A survey of CH3CN and HC3N in protoplanetary disks
Abstract
The organic content of protoplanetary disks sets the initial compositions of planets and comets, thereby influencing subsequent chemistry that is possible in nascent planetary systems. We present observations of the complex nitrile-bearing species CH3CN and HC3N towards the disks around the T Tauri stars AS 209, IM Lup, LkCa 15, and V4046 Sgr as well as the Herbig Ae stars MWC 480 and HD 163296. HC3N is detected towards all disks except IM Lup, and CH3CN is detected towards V4046 Sgr, MWC 480, and HD 163296. Rotational temperatures derived for disks with multiple detected lines range from 29–73K, indicating emission from the temperate molecular layer of the disk. V4046 Sgr and MWC 480 radial abundance profiles are constrained using a parametric model; the gas-phase CH3CN and HC3N abundances with respect to HCN are a few to tens of percent in the inner 100 AU of the disk, signifying a rich nitrile chemistry at planet- and comet-forming disk radii. We find consistent relative abundances of CH3CN, HC3N, and HCN between our disk sample, protostellar envelopes, and solar system comets; this is suggestive of a robust nitrile chemistry with similar outcomes under a wide range of physical conditions.
1 Introduction
Planets form by accreting gas and dust within the protoplanetary disk; the material present in the disk therefore sets the initial composition of planets. Observations of solar system comets suggest that the solar nebula was rich in volatile organic molecules around the time the comets were formed, usually with abundances of a few percent with respect to water ice (e.g. Mumma & Charnley, 2011). Understanding how this early inventory of organic molecules developed into the vast complexity of biochemistry is key to the study of the origins of life. Recent successes in prebiotic syntheses of RNA and protein precursors suggest that nitrile-bearing molecules, characterized by the CN functionality, played a crucial role in prebiotic chemistry (Powner et al., 2009; Ritson & Sutherland, 2012; Sutherland, 2016). From cometary studies, HCN, CH3CN, and HC3N indeed appear to have been common in the young Solar system (Mumma & Charnley, 2011; Cordiner et al., 2014; Le Roy et al., 2015). To evaluate whether the nitrile chemistry of the solar nebula is typical, and in turn any implications for the chemical habitability of other planetary systems, observations of planet-forming disks are essential.
The simple nitrile species CN and HCN were first detected towards protoplanetary disks two decades ago (Dutrey et al., 1997; Kastner et al., 1997) and have since been observed towards many additional disks (see Dutrey et al., 2014). Until the advent of ALMA, observational challenges limited our ability to detect and characterize more complex nitrile species in disks. The first disk detections of HC3N were made by Chapillon et al. (2012) with the IRAM 30m telescope towards GO Tau, LkCa 15, and MWC 480. CH3CN was first detected in a disk by Öberg et al. (2015) towards MWC 480 using ALMA. The molecular emission was spatially resolved, allowing radial abundance profiles of CH3CN and HC3N to be derived. At comet-forming disk radii the abundances were found to be similar to those measured in solar system comets, suggesting that the solar system is not unique in its nitrile chemistry.
In addition to their relevance to pre-biotic chemistry, CH3CN and HC3N are, along with CH3OH (Walsh et al., 2016), the only large organic molecules detected in protoplanetary disks to date. Because of this, these molecules are key to furthering our understanding of the growth of organic complexity in disks. Their abundances and distributions can be used to benchmark astrochemical models of disks, and in turn to help predict the chemistry of complex molecules which cannot currently be directly observed. This is of particular importance for gaining insights into the ice compositions in disks, which can be constrained only through chemical models.
To date, the number of disks with well-characterized nitrile abundances is small, and it is unclear (i) whether other disks commonly host similar nitrile abundances as the solar nebula, and (ii) how robust the nitrile chemistry is across different circumstellar environments. A larger sample of observations is required to obtain constraints on the nitrile chemistry in disks.
Here, we present observations of the complex nitrile molecules HC3N and CH3CN towards a diverse sample of six protoplanetary disks: our targets span over an order of magnitude in luminosity and disk age and represent both transition disks and full disks. In Section 2 we describe the observations and data reduction. The observational results are presented in Section 3. In Section 4 a parametric model is used to obtain abundance profiles of CH3CN an HC3N towards the bright sources MWC 480 and V4046 Sgr. Finally, in Section 5 we comment on implications for the nitrile chemistry in other circumstellar systems based on our findings.
2 Methods
2.1 Observations
During ALMA Cycle 2, the HC3N 27–26 transition as well as the CH3CN 14–13 K-ladder were observed for the disks AS 209, HD 163296, IM Lup, LkCa 15, MWC 480, and V4046 Sgr (project code 2013.1.00226). Disk and stellar properties for each source are listed in Table 1. The MWC 480 data were previously presented in Öberg et al. (2015); these lines were re-analyzed in this work to ensure that all sources were treated consistently. During Cycles 3 and 4, as part of a line survey in disks (project code 2013.1.01070.S), the HC3N 31–30 and 32–31 transitions and the CH3CN 15–14 and 16–15 K-ladders were observed towards MWC 480 and LkCa 15.
A detailed description of the Cycle 2 observations can be found in Huang et al. (2017). Briefly, from 2014 to 2015 Band 6 observations were taken at two spectral settings, 1.1mm and 1.4mm, containing 14 and 13 narrow spectral windows, respectively. Baselines spanned 18 to 650m, and the total on-source time was 20 minutes per source. Amplitude and phase calibration, as well as frequency bandpass calibration, were performed using observations of a quasar. Flux calibration was performed using observations of either Titan or a quasar. A portion of the CH3CN 14–13 ladder (140–130, 141–131, and 142–132) is contained in a spectral window of 59 MHz with a channel width of 61 kHz (0.071 km/s) in the 1.1mm spectral setting. The HC3N 27–26 transition is contained in a spectral window of 117 MHz, also with a channel width of 61 kHz (0.075 km/s) in the 1.1mm spectral setting.
| Source | Distance | Spectral | Age | Disk Inc. | Disk PA | |||||
|---|---|---|---|---|---|---|---|---|---|---|
| (pc) | type | (Myr) | () | () | (10 yr-1) | (deg) | (deg) | () | (km s-1) | |
| AS 209 | 143a | K5 | 1.6 | 0.9 | 1.5 | 51 | 38 | 86 | 0.015 | 4.6 |
| IM Lup | 161a | M0 | 1 | 1.0 | 0.93 | 0.01 | 50 | 144.5 | 0.17 | 4.4 |
| LkCa 15 | 140 | K3 | 3-5 | 0.97 | 0.74 | 1.3 | 52 | 60 | 0.05-0.1 | 6.3 |
| V4046 Sgr | 72 | K5, K7 | 24 | 1.75 | 0.49, 0.33 | 0.5 | 33.5 | 76 | 0.028 | 2.9 |
| MWC 480 | 142a | A4 | 7 | 1.65 | 11.5 | 126 | 37 | 148 | 0.11 | 5.1 |
| HD 163296 | 122 | A1 | 4 | 2.25 | 30 | 69 | 48.5 | 132 | 0.17 | 5.8 |
Note. — Table adapted from Huang et al. (2017), where a full list of references can be found.
The Cycle 3/4 observations are described in full in Loomis et al. (subm.). This work made use of data taken in two Band 7 correlator setups at 0.9mm and 1.1mm, each containing 4 spectral windows of 1920 channels with channel widths of 975 kHz (0.99 – 1.06 km/s for the lines of interest). Baselines spanned 15 to 650m, and the total on-source integration time was 20 minutes per source. Phase calibration, bandpass calibration, and flux calibration were all performed using quasar observations.
2.2 Data reduction
Initial data calibration was performed by ALMA/NAASC staff. Two rounds of phase self-calibration were performed using the continuum emission from individual spectral windows, except for HD 163296 which was self-calibrated using averaged spectral windows due to weak continuum emission. Following continuum subtraction, the data cubes were imaged in CASA using the CLEAN task with a 3 noise threshold. Briggs weighting was used with a robust parameter of 2.0 for all lines except those in the source V4046 Sgr; here, a value of 1.0 was adopted to improve the angular resolution, which was possible due to higher signal-to-noise ratios. To obtain channel maps, the data were regridded to 0.5 km s-1 and 1.1 km s-1 spectral resolution for the Cycle 2 and Cycle 3/4 observations, respectively. CLEAN masks were drawn by hand for lines with obvious emission (V4046 Sgr HC3N 27-26 and CH3CN 140-130 and 141-131). For all other lines, the 5 continuum contour was used as the CLEAN mask.
| Transition | Frequency | Source | Beam | Beam PA | Channel rmsa | Mom. zero rmsb | Int. Flux Densityc |
|---|---|---|---|---|---|---|---|
| (GHz) | (”) | (o) | (mJy beam-1) | (mJy beam-1 km s-1) | (mJy km s-1) | ||
| CH3CN 140–130 | 257.5274 | AS 209 | 0.51 x 0.45 | -66.2 | 3.1 | 4.3 | 39 |
| IM Lup | 0.47 x 0.43 | 83.4 | 3.0 | 4.1 | 33 | ||
| LkCa 15 | 0.67 x 0.51 | -15.5 | 2.8 | 4.7 | 28 | ||
| V4046 Sgr | 0.59 x 0.48 | 84.9 | 2.9 | 7.9 | 299 94d | ||
| MWC 480 | 0.76 x 0.49 | -8.6 | 2.8 | 4.8 | 42 11 | ||
| HD 163296 | 0.60 x 0.46 | -87.1 | 2.3 | 4.2 | 53 11 | ||
| CH3CN 141–131 | 257.5224 | V4046 Sgr | 0.59 x 0.48 | 84.9 | 2.9 | 7.9 | 259 82d |
| CH3CN 142–132 | 257.5076 | V4046 Sgr | 0.59 x 0.48 | 84.9 | 3.0 | 4.7 | 113 17 |
| CH3CN 150–140 | 275.9156 | LkCa 15 | 1.17 x 1.04 | -43.6 | 2.8 | 8.7 | 30 |
| MWC 480 | 1.30 x 1.07 | -7.3 | 2.7 | 10.0 | 44 23d | ||
| CH3CN 151–141 | 275.9103 | MWC 480 | 1.30 x 1.07 | -7.3 | 2.7 | 10.0 | 42 19d |
| CH3CN 160–150 | 294.3024 | LkCa 15 | 1.35 x 0.85 | -56.5 | 5.3 | 16.0 | 54 |
| MWC 480 | 1.41 x 0.86 | -45.6 | 4.8 | 16.0 | 67 | ||
| HC3N 27–26 | 245.6063 | AS 209 | 0.54 x 0.46 | -64.0 | 3.4 | 5.4 | 103 15 |
| IM Lup | 0.51 x 0.45 | 69.5 | 3.1 | 4.2 | 29 | ||
| LkCa 15 | 0.71 x 0.53 | -14.5 | 2.9 | 4.8 | 44 9 | ||
| V4046 Sgr | 0.60 x 0.50 | 86.7 | 3.4 | 6.0 | 352 20 | ||
| MWC 480 | 0.81 x 0.51 | -8.5 | 3.1 | 5.3 | 136 11 | ||
| HD 163296 | 0.62 x 0.48 | -86.1 | 2.7 | 4.6 | 201 13 | ||
| HC3N 31–30 | 281.9768 | LkCa 15 | 1.40 x 0.86 | -56.4 | 4.6 | 12.9 | 44 |
| MWC 480 | 1.45 x 0.90 | -44.7 | 4.1 | 11.4 | 92 15 | ||
| HC3N 32–31 | 291.0684 | LkCa 15 | 1.40 x 0.86 | -56.4 | 5.0 | 15.2 | 48 |
| MWC 480 | 1.38 x 0.90 | -43.7 | 5.0 | 14.2 | 59 20 |
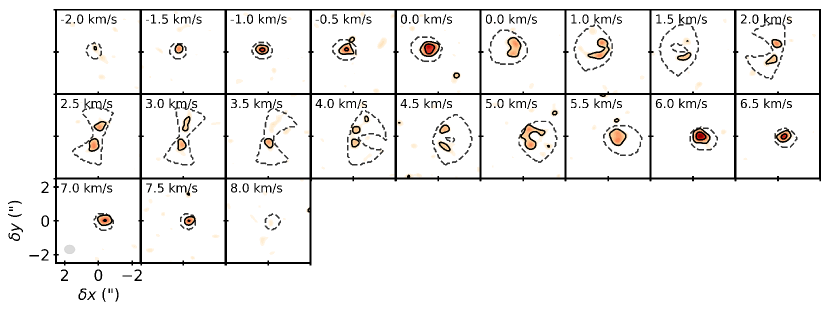
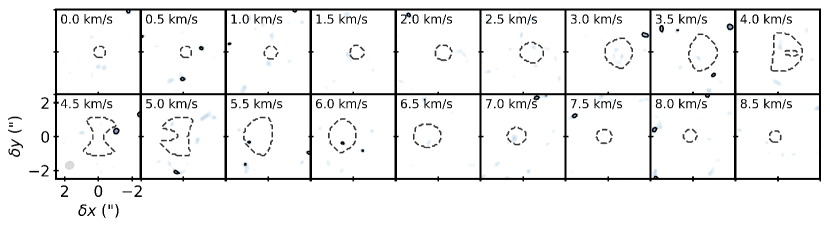
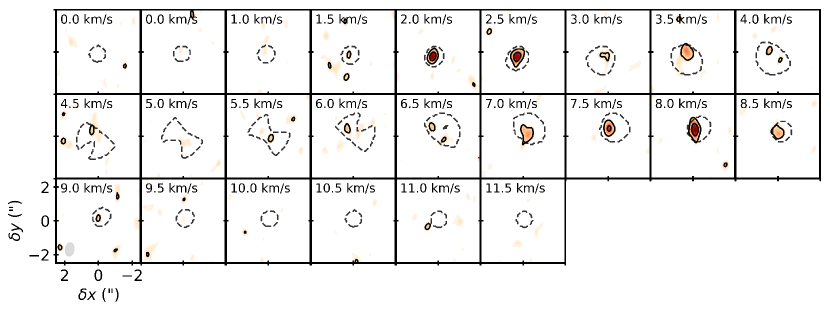
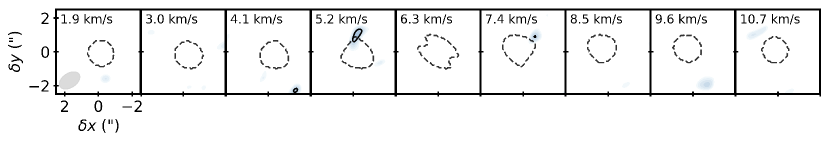
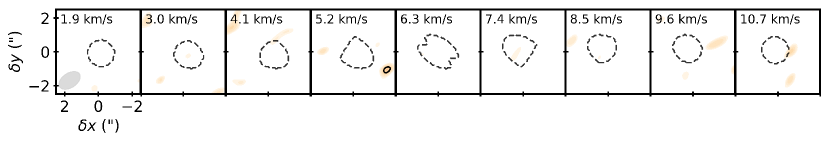
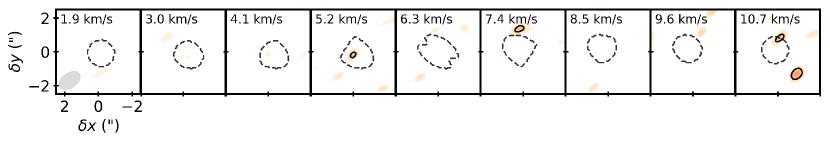
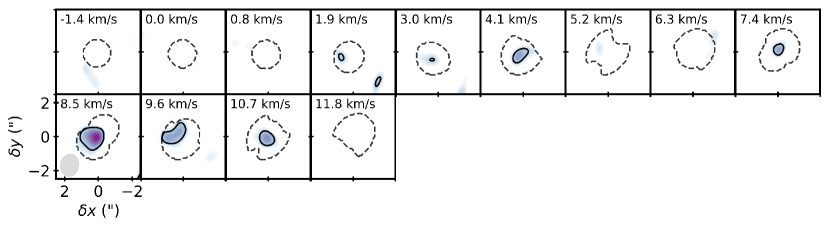
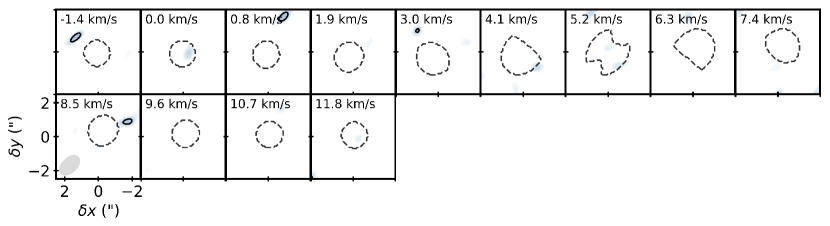
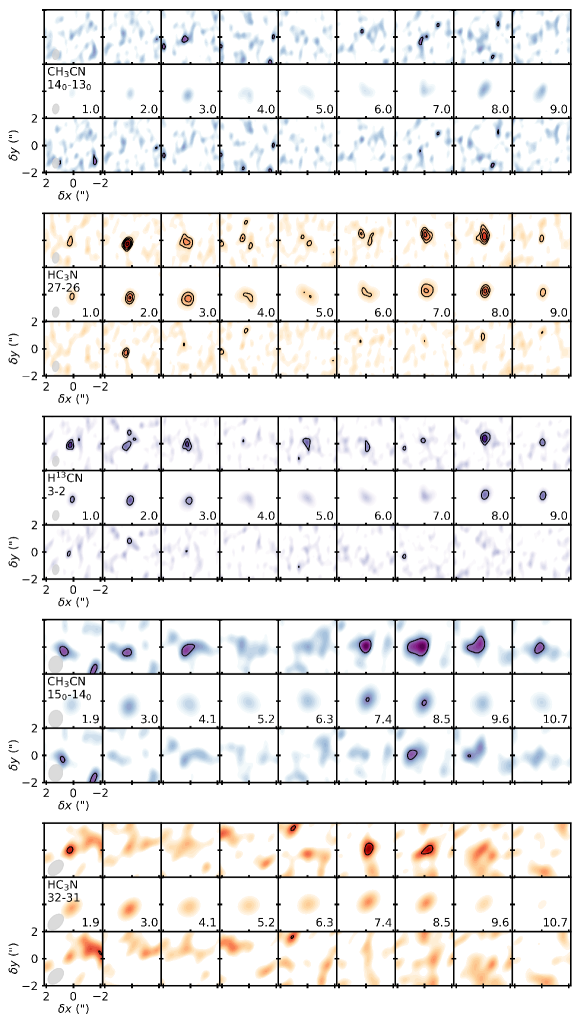
A Keplerian mask was applied to the cleaned data cube to obtain moment zero maps, line spectra, and integrated flux densities for each transition. The use of Keplerian masks as CLEAN templates and for spectral extraction is well established (e.g. Rosenfeld et al., 2013a; Loomis et al., 2015; Öberg et al., 2015); details on the use of Keplerian masking for moment zero map generation will be presented in (Pegues et al., in prep). Briefly, to construct appropriate masks, the Keplerian velocity of each image pixel was calculated based on its deprojected radius from the star, assuming disk and stellar parameters taken from the literature (Table 1). In each velocity channel, only pixels corresponding to the appropriate Keplerian velocity were included, and all other pixels were masked. The mask outer radii were chosen to encompass all HC3N and CH3CN emission. The masks were verified to fit the actual disk profile using H13CN emission (Guzmán et al., 2017), which has more obvious Keplerian structure than HC3N or CH3CN. An example channel map with its Keplerian mask overlaid is shown in Figure 1 for the HC3N 27-26 transition in V4046 Sgr; for all other lines and sources, a similar figure can be found in Appendix A.
Since the moment zero maps are produced by summing only emission within the Keplerian mask, each moment zero pixel represents the sum of a different number of channels. The rms is therefore non-uniform across the moment zero map. We approximate the moment zero rms by bootstrapping: the same Keplerian mask used to obtain the moment zero map is applied to 1000 off-source positions. The rms per pixel is determined from the standard deviation of each mask pixel across all off-source moment zero maps. The median rms value is taken to be the representative moment zero rms, and is quoted in Table 2 and used to draw contours in Figures 2 and 4. The uncertainty in the integrated flux density was estimated from the standard deviation of the integrated fluxes within 1000 off-source Keplerian masks.
In V4046 Sgr, the CH3CN 140–130 line is blended with the 141–131 line (spectrum shown in Figure 2). Likewise, in MWC 480 the CH3CN 150–140 and 151–141 lines are blended. To treat blended lines, two Keplerian masks (one centered on each line) were calculated and used to extract the emission from both lines, and the resulting moment zero map sums the total emission. To estimate the integrated flux density from each individual transition, we assume that emission is symmetric around the rest velocity of the source. The integrated flux for the lower-energy transition was therefore assumed to be twice the integrated flux of the lowest-velocity horn (i.e., velocities lower than the source velocity). The integrated flux of the higher-energy transition was taken to be the integrated flux of the total blended feature minus the integrated flux of the low-energy transition. To account for the added uncertainties in this procedure an additional error of 30% the integrated flux was added in quadrature with the bootstrapped integrated flux uncertainty for blended lines.
3 Observational results
Based on our observations, we now present the molecular line detections and non-detections in our sample. For molecules with multiple detections towards a source, we use the rotational diagram method to derive rotational temperatures and column densities. Finally, we calculate disk-averaged abundance ratios of CH3CN/HCN and HC3N/HCN for all disks by assuming a range of emission temperatures.
3.1 Molecule detections
A summary of the line observations is presented in Table 2. The CH3CN 140–130 and HC3N 27–26 transitions were targeted towards all 6 disks and, compared to the other observed CH3CN and HC3N transitions, are the brightest across the sample. We therefore use these lines to classify whether molecules are detected or not detected in a disk. A molecule is considered detected if emission 3rms is present within the Keplerian mask in at least three channels. We also tested a detection criterion of a SNR 3 for the integrated flux density, and find the same status of detection vs. non-detection for all transitions. Based on these criteria, HC3N is detected towards all disks except IM Lup. CH3CN is firmly detected towards three of six disks (HD 163296, MWC 480, and V4046 Sgr). In AS 209 and LkCa 15, CH3CN is not seen at significant levels in individual channel maps but shows suggestive features at around a 3 level in the moment zero maps, as well as positive integrated intensities in the radial profiles. Higher-sensitivity follow-up observations are required to confirm if these are indeed detections. For subsequent analysis these lines are treated as non-detections (3 upper limits).
Figure 2 shows the disk continuum maps as well as the CH3CN 140–130 and HC3N 27–26 line maps and spectra for each disk. In all cases the molecular emission is more compact than the continuum emission. Comparing the nitrile emission across the sample, V4046 Sgr is by far the strongest emitter, with strong detections of both CH3CN and HC3N. Next strongest are HD 163296 and MWC 480, which both host strong HC3N and moderate CH3CN emission. AS 209 and LkCa 15 both exhibit moderate HC3N and tentative CH3CN emission, and neither molecule is detected in IM Lup.
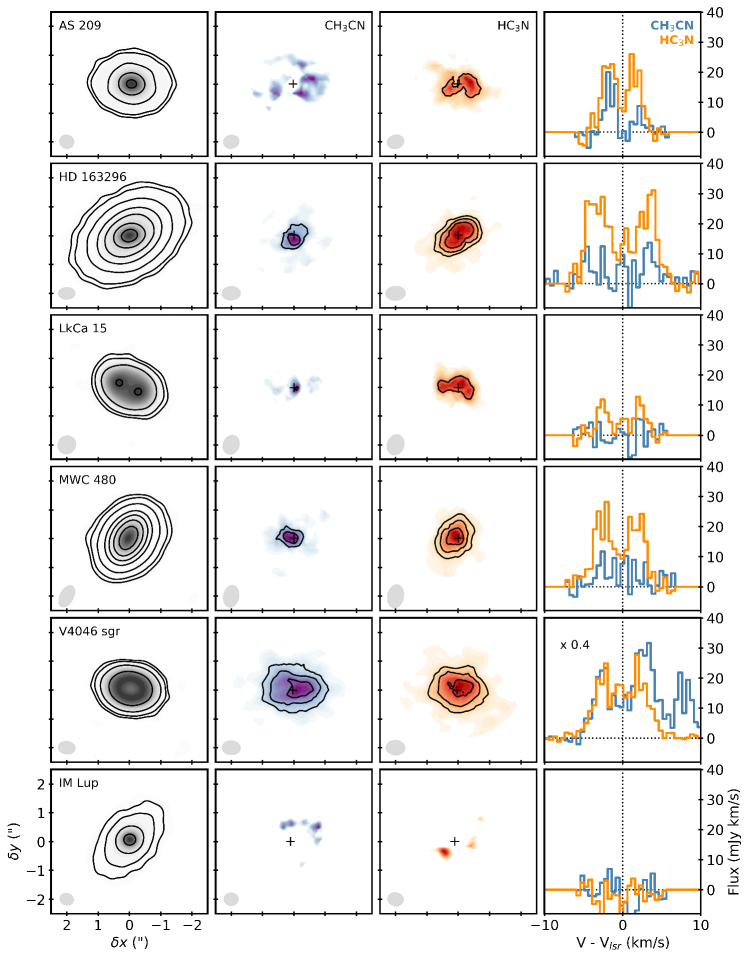
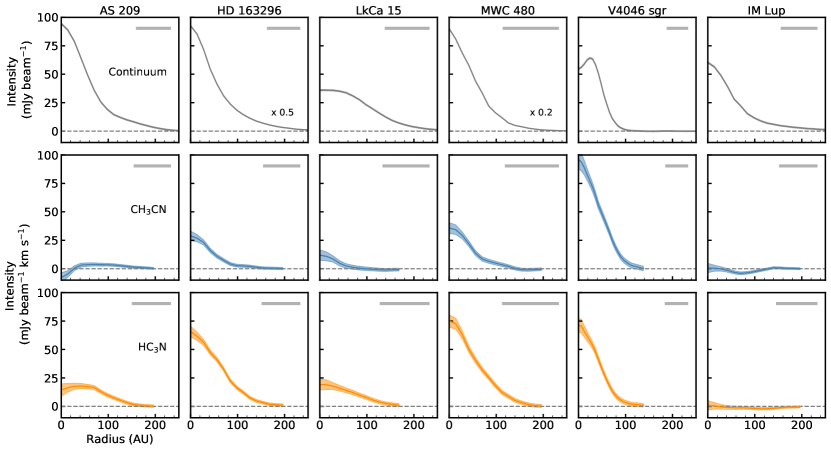
Figure 3 shows the deprojected radial profiles for each transition. The uncertainties are estimated by dividing the median moment zero rms by the square root of the number of independent measurements (i.e., the number of pixels at each radius divided by the beam size in pixels, to account for beam convolution). For both CH3CN and HC3N, almost all detections exhibit centrally peaked emission. The exception is CH3CN and HC3N in AS 209, which peak at larger radii, indicative of a ringed structure; this can also be seen in the moment zero map (Figure 2). Although it does not have a large central dust cavity, AS 209 also exhibits a ring-like structure in the molecules H13CN, HC15N, DCN, H13CO+, and DCO+ (Guzmán et al., 2017; Huang et al., 2017), possibly due to dust opacity effects. Additionally, we note that when imaged with a smaller robust factor, HC3N and possibly CH3CN in V4046 Sgr show evidence of a central depression. Higher-resolution observations are required to confirm the morphology of these molecules at small scales.
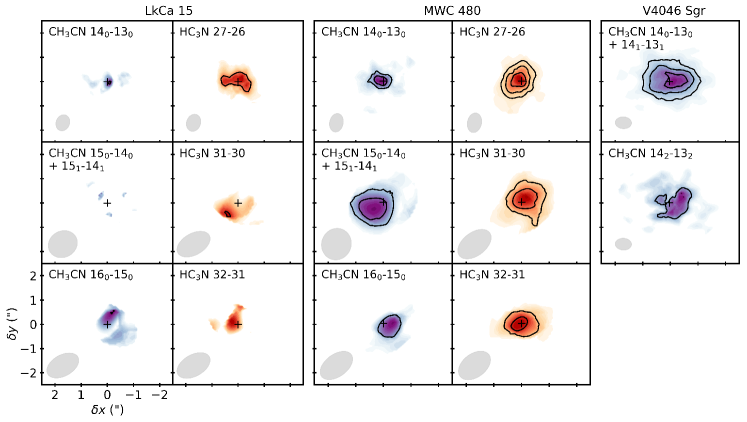
In V4046 Sgr, MWC 480, and LkCa 15, multiple transitions from the same molecule were observed. Figure 4 shows the moment zero maps for these additional transitions. The CH3CN 141-131 and 142-132 lines were covered within the same spectral window as the 140–130 transition, and in V4046 Sgr these higher-K lines were strong enough to be detected. Additionally, for MWC 480 and LkCa 15 the CH3CN 150-140 and 160-150 and HC3N 31-30 and 32-31 lines were observed in a separate program (Loomis et al., subm.). In MWC 480, CH3CN 150-140 and HC3N 31-30 and 32-31 were detected. These additional lines were not detected in LkCa 15.
3.2 Population diagrams
For molecules with multiple detections, rotational diagrams can be used to determine the disk-averaged column densities and rotational temperatures of emission (Figure 5). In most cases, only detected lines were used in fitting rotational diagrams; the exception is for HC3N in LkCa 15, as only a single line is detected. In this case the 3 upper limits on the non-detected transitions were used to obtain an upper limit for the rotational temperature.
Assuming LTE and optically thin emission, the disk-integrated flux density can be converted to an upper level population (Goldsmith & Langer, 1999):
| (1) |
where is the flux density, is the line width, is the Einstein coefficient and is the solid angle of the source. For a disk-averaged column density, is the same for each transition of a molecule. To estimate for each molecule, we use the deprojected radial profile of the brightest line (Figure 3) to identify the maximum angular extent of emission. is taken to be the solid angle subtended by a circle with this radius. In turn, the total column density and rotational temperature can be determined from the upper level populations given by the Boltzmann distribution:
| (2) |
Here, is the upper state degeneracy, is the molecular partition function, and is the energy of the upper state (K). To calculate the partition functions for CH3CN and HC3N, we use the symmetric top and linear polyatomic approximations respectively (Gordy & Cook, 1984; Mangum & Shirley, 2015):
| (3) | |||
| (4) |
where , , and are the rotational constants for CH3CN and HC3N.
The best-fit CH3CN and HC3N column densities and rotational temperatures are listed in Table 3. The rotational temperature of CH3CN in V4046 Sgr is 29 2K and in MWC 480 is 73 23K. By comparison, the rotational temperature of CH3CN was recently measured in the disk around the solar analog TW Hya to be 29K; follow-up chemical modeling predicted abundant gas-phase CH3CN between temperatures of 25–50K corresponding to the warm molecular layer of the disk (Loomis et al., in prep.). The measured rotational temperature in V4046 Sgr is consistent with these TW Hya results, while CH3CN in MWC 480 is warmer. MWC 480 is a Herbig Ae star and hosts a stronger radiation field than the T Tauri stars TW Hya and V4046 Sgr, which may explain the warmer emission. However, we emphasize that given the line blending of CH3CN (see Section 2.2) the rotational temperature is rather poorly constrained. Moreover, at densities below 107 cm-3, the CH3CN and HC3N transitions targeted in this survey will be sub-thermally excited. Modeling in Loomis et al. (in prep.) suggests that CH3CN emission can arise from regions with densities down to 106 cm-3; therefore, the rotational temperatures listed in Table 3 may underestimate the kinetic temperature of the emission region.

| Source | Molecule | NT (1012 cm-2) | Trot (K) |
|---|---|---|---|
| MWC 480 | CH3CN | 1.8 0.4 | 73 23 |
| V4046 Sgr | CH3CN | 6.2 1.8 | 29 2 |
| MWC 480 | HC3N | 5.8 2.8 | 49 6 |
| LkCa 15 | HC3N | 0.8 | 103 |
We note that in V4046 Sgr, the derived CH3CN rotational temperature also corresponds to the kinetic gas temperature: for symmetric top molecules, the populations of different K levels with the same J value are a direct result of collisions (e.g. Loren & Mundy, 1984). This is not the case for MWC 480 since the multiple lines detected consist of different J levels within the same K ladder.
HC3N in MWC 480 has a measured rotational temperature of 49 6K, consistent within the uncertainties with the warm CH3CN temperature found in the same source. Additional observations are needed to determine whether there is a real difference in the emission temperature (and therefore emission location) of CH3CN and HC3N within a disk. In LkCa 15 only one HC3N line was firmly detected, resulting in a rotational temperature upper limit of 103K.
3.3 Disk-averaged abundance ratios
Disk-averaged abundance ratios of HC3N and CH3CN with respect to HCN are calculated using the integrated fluxes listed in Table 2 and adopted rotational temperatures. H13CN integrated fluxes are taken from Guzmán et al. (2017); we assume a standard 12C/13C ratio of 70 (with an uncertainty of 15%) to convert to HCN column densities. HC3N/HCN and CH3CN/HCN abundance ratios are calculated for rotational temperatures of 30, 50, and 70K corresponding to the range of observed rotational temperatures. In this treatment we assume that HC3N and CH3CN are co-spatial with HCN. If all molecules are emitting from the molecular layer between the midplane and the disk atmosphere this is a reasonable approximation vertically, however differences in the radial extent of emission for each molecule may introduce some error into the abundance ratios. IM Lup is excluded from this analysis since only upper limits are available for all species.
The derived abundance ratios are listed in Table 4. For all rotational temperatures, HC3N is more abundant than CH3CN. The CH3CN abundance is on the order of a few percent with respect to HCN for all choices of rotational temperature. For a given rotational temperature, the CH3CN/HCN ratios are consistent within the uncertainties with a single value across the entire disk sample. The derived HC3N/HCN abundance ratios are a few percent for a 70K rotational temperature but significantly higher (50% for AS 209, LkCa 15, and V4046 Sgr, and over 100% for MWC 480 and HD 163296) for a 30K rotational temperature. In MWC 480, the only source with a well-constrained HC3N rotational diagram, the derived temperature is close to 50K; therefore, for at least the Herbig Ae stars, the 50K abundances (20%) are likely the most reliable.
| Source | CH3CN/HCN (%) | HC3N/HCN (%) | ||||
|---|---|---|---|---|---|---|
| 30K | 50K | 70K | 30K | 50K | 70K | |
| AS 209 | 4.7 | 2.5 | 2.0 | 69.7 17.7 | 10.8 2.8 | 4.9 1.2 |
| LkCa 15 | 4.3 | 2.3 | 1.8 | 43.4 13.2 | 6.7 2.0 | 3.0 0.9 |
| V4046 Sgr | 5.1 1.8 | 2.7 0.9 | 2.2 0.8 | 37.9 6.2 | 5.9 1.0 | 2.7 0.4 |
| HD 163296 | 5.6 1.6 | 2.9 0.9 | 2.4 0.7 | 134.1 28.0 | 20.9 4.4 | 9.4 2.0 |
| MWC 480 | 5.9 1.9 | 3.1 1.0 | 2.5 0.8 | 121.9 24.0 | 19.0 3.7 | 8.5 1.7 |
4 Abundance profile modeling
The strong emission of both CH3CN and HC3N in MWC 480 and V046 Sgr enables a more detailed modeling of the radial abundance profiles within each disk.
4.1 V4046 Sgr model
The physical model for V4046 Sgr is adapted from the parametric model of the V4046 Sgr disk described in Rosenfeld et al. (2013b) and is further developed in Guzmán et al. (2017). For fitting CH3CN and HC3N emission, we use the same physical disk model as described in Guzmán et al. (2017).
Molecular abundance profiles are assumed to follow a power law, following e.g. Qi et al. (2008, 2013):
| (5) |
where is the abundance with respect to the total hydrogen density, is the abundance at the characteristic radius of = 100 AU, and is the power law index. An outer radius cutoff of 100AU was adopted based on the extent of emission in the deprojected radial profile (Figure 3). In the disk atmosphere, photo-dissociation is assumed to destroy most molecules, and the molecular abundances are attenuated by a factor of 108 above = 0.5. To account for depletion in the disk midplane, molecule abundances are attenuated by a factor of 103 at temperatures below 25K. This temperature does not correspond to a purely thermal freeze-out boundary for nitriles, but was chosen empirically based on the boundary where gas-phase CH3CN disappears in the chemical model presented in Loomis et al. (in prep.), and is also consistent with the 30K rotational temperature found for CH3CN in this disk. This depletion boundary is similar to the expected CO freeze-out temperature, and likely arises due to either a coincidence with the photodesorption boundary of the nitrile molecules, or an increase in gas-phase nitrile chemistry driven by CO sublimation.
CH3CN and HC3N were fit independently for the free parameters and . While we use the same physical disk model as in Guzmán et al. (2017), the boundary conditions for the molecular abundance profiles are slightly different here; since we ultimately wish to normalize CH3CN and HC3N with respect to H13CN, we also re-fit the H13CN observations to ensure consistency.
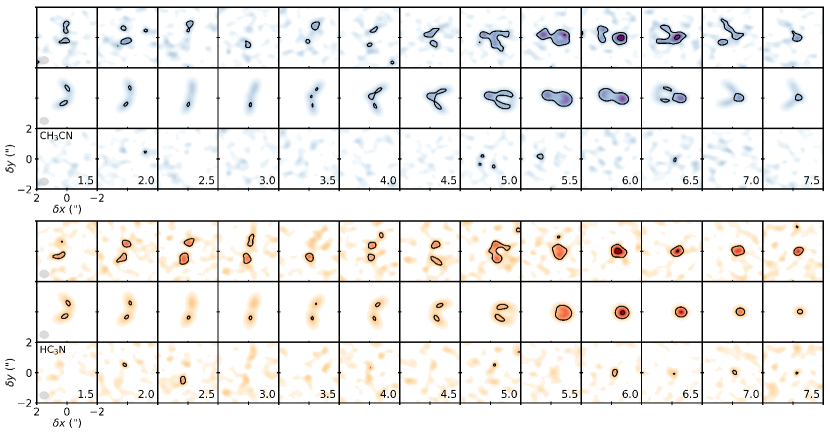
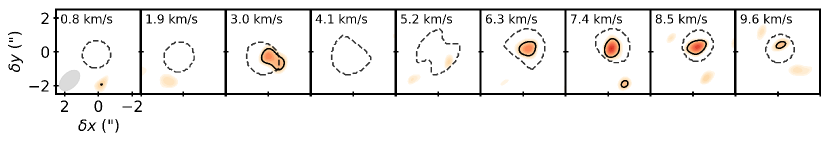
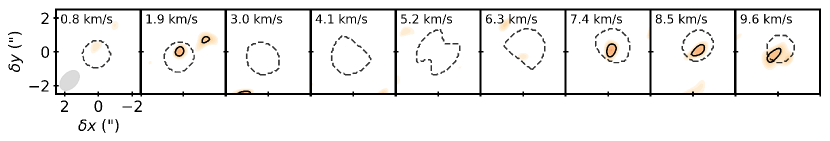
The fitting was performed by generating synthetic observations of the brightest line emission, holding the gas density and temperature profiles constant and adopting the disk inclination, position angle, stellar mass, and systemic velocity listed in Table 1. The synthetic images had a spectral resolution of 0.5 km s-1 and spanned -2.0 – 14.5 km/s for CH3CN (including both the 140–130 and 141–131 transitions) and -3.0 – 9.0 km/s for HC3N. The radiative transfer code RADMC-3D (Dullemond, 2012) was used to calculate level populations for each synthetic image assuming LTE conditions. The vis_sample Python package111https://pypi.python.org/pypi/vis_sample (Loomis et al., subm.) was then used to sample the synthetic image at the points of the observations. The likelihood function was calculated from the weighted difference between observations and the model in the plane. The affine-invariant MCMC package emcee (Foreman-Mackey et al., 2013) was used to sample posterior distributions of both parameters and . A flat prior was used for each parameter when generating new samples: 10-8 and -3 2. The resulting best-fit values are listed in Table 5. Figure 6 shows channel maps of the observations along with the best-fit model and residuals for CH3CN and HC3N (H13CN and CH3CN 142–132 can be found in Appendix B); the observations are well reproduced by the model.
To ensure that the choice of depletion boundary does not significantly impact our results, the models were also run with an adopted depletion boundary of 19K and 30K. For CH3CN the best-fit at 19K and 30K are within 25% of the 25K value, and the best-fit are within 15%. For HC3N there was less than 3% change for both and . The results are therefore not highly sensitive to the choice of depletion boundary. To further confirm the derived abundances we use the best-fit and values from the CH3CN 140–130 line to create a synthetic image of the 142–132 transition. The higher-frequency transition is well reproduced by the lower-frequency best-fit values (shown in Appendix B), indicating that the adopted model is appropriate.
Since V4046 Sgr is a transition disk with a large inner gap, we also test whether a model with a large cavity produces a better fit to the observations. The fiducial model uses a cavity radius of 3 AU based on the CO line emission and SED of V4046 Sgr (Rosenfeld et al., 2013b). An adopted 29 AU radius, corresponding to the mm dust radius hole, produces a worse fit to the data for both molecules.
| V4046 Sgr | MWC 480 | |||
|---|---|---|---|---|
| CH3CN | 8.1 0.4 10-12 | 0.6 0.1 | 7.9 10-13 | -0.1 0.3 |
| HC3N | 2.8 0.2 10-11 | 1.3 0.1 | 1.2 0.1 10-11 | 0.8 0.1 |
| H13CN | 1.2 0.1 10-12 | -0.5 0.1 | 1.2 0.2 10-13 | -1.1 0.1 |
4.2 MWC 480 model
In Öberg et al. (2015), the CH3CN 140–130 and HC3N 27–26 profiles in MWC 480 were fit by obtaining the minimum value from a grid of calculated abundance models. Here, we adopt the same parametric physical model for the disk density and temperature described in that paper but use the MCMC fitting procedure described in the previous section to constrain and . This allows us to better explore the parameter space and therefore to obtain more robust constraints on the fit parameters and their uncertainties. Also in contrast to Öberg et al. (2015), we use RADMC-3D instead of the non-LTE LIME code for radiative transfer calculations to ensure consistency with the V4046 Sgr results.
To retrieve molecular abundances, we use the same power-law prescription (Equation 5) as in Section 4.1. Again the abundances are attenuated above a of 0.5 to account for photo-destruction. We adopt a depletion boundary of 0.05 which roughly corresponds to the cutoff in the V4046 Sgr model. As in the V4046 Sgr model, this does not correspond to the nitrile freeze-out boundary but likely corresponds to where photodesorption of nitriles and/or CO-driven gas phase chemistry become efficient. A higher cutoff of 0.2 was also tested, corresponding to the lower boundary of CH3CN emission in the model of Loomis et al. (in prep.). An outer radius of 180 AU was chosen, corresponding to the extent of emission in the MWC 480 radial profiles (Figure 3). The MCMC fitting procedure is otherwise the same as described above. CH3CN, HC3N, and H13CN were each fit with spectral resolutions of 0.5km/s and velocity ranges of 1–9.5km/s, 0–14.5km/s, and 0–14.5km/s, respectively. The resulting model channel maps and residuals are shown in Appendix B. The best-fit values of X100 and are listed in Table 5. For both V4046 Sgr and MWC 480, CH3CN and HC3N appear to have increasing or flat abundance profiles, while H13CN shows a decreasing abundance profile.
Like for V4046 Sgr we can use the constraints from additional lines to confirm the validity of the best-fit model. For both depletion boundaries of and we created synthetic images of the upper-level CH3CN and HC3N lines based on the best-fit and values from the lower-level lines. Rotational diagram calculations were performed for CH3CN and HC3N using the modeled fluxes. We obtain very similar rotational temperatures for and models: 20K and 23K for CH3CN, and 44K and 45K for HC3N, respectively. The HC3N model temperatures are very close to the observed values, while the CH3CN temperatures are low. Because the modeled CH3CN rotational temperature is not substantially improved by increasing the cutoff, a more complex parametric model is likely required to fully describe the disk physical and/or abundance structure. For instance, modeling of H2CO emission in TW Hya required both a hot inner component and a cool extended component to match observations (Öberg et al., 2017); the possible presence of a warm inner component in MWC 480 would not be captured by the single power-law profile used in our models, resulting in a potential under-prediction of the observed rotational temperature. We emphasize, however, that the observed rotational temperature of CH3CN in MWC 480 is not well constrained due to a small lever arm in upper energy levels as well as line blending uncertainties, and may in reality be closer to the modeled rotational temperature. Of the two depletion boundaries, the cutoff produced better fits to the higher-J lines as determined by the reduced , and therefore all future discussion pertains to the 0.05 model results. Channel maps for these models are shown in Appendix B.
4.3 CH3CN and HC3N column densities and abundances
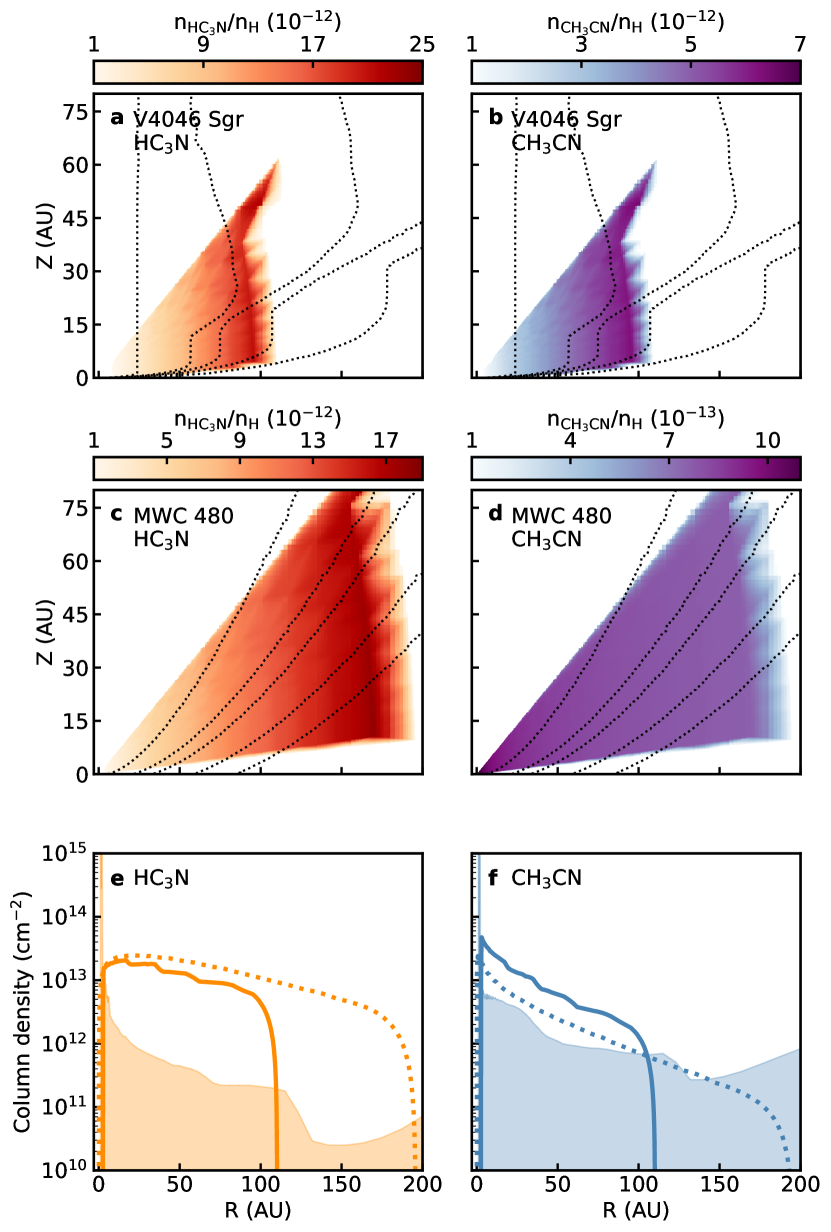
The best-fit CH3CN and HC3N abundance profiles derived for V4046 Sgr and MWC 480 are shown in Figure 7, along with the derived radial column density profiles. For comparison, we also show the column densities of HC3N and CH3CN predicted by a disk chemistry model for a generic T Tauri star and disk (Walsh et al., 2014). CH3CN column densities from the disk chemistry model are within an order of magnitude to those derived in this work for V4046 Sgr and MWC 480, while HC3N column densities are under-estimated by over an order of magnitude in the model. However, neither V4046 Sgr nor MWC 480 is well-described by the disk physical structure adopted by Walsh et al. (2014), and further tuning of models is required to make conclusive comparisons. Comparing the relative shapes of the radial column density profiles, the extremely centrally peaked profile in the model is not reproduced in the profiles derived in this work. However, we note that due to the high upper-state energies of the lines fitted (92K for CH3CN and 165K for HC3N), our observations are not sensitive to cool material and therefore may not reflect the true spatial distributions of the molecules.
To illustrate this, we use the modeled best-fit abundance profiles to determine the fraction of emitting molecules (i.e., molecules in the upper energy state of the observed transition) in temperature bins from 10 to 200K, following Bergin et al. (2013). The number density of a species in the upper energy state is related to the total number density by the Boltzmann distribution (Equation 2). is integrated over the disk to find the number of upper-state molecules in target temperature bins. The fraction of upper-state molecules in each temperature bin relative to the total number of upper-state molecules, , is shown in Figure 8 as a cumulative distribution function.
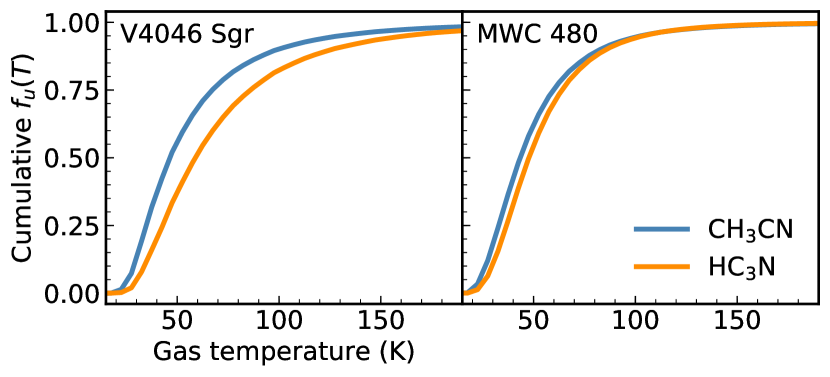
For both CH3CN and HC3N in V4046 Sgr and MWC 480, roughly half of the emitting molecules are in gas warmer than 50K, with virtually no contribution from 30K gas. This indicates that our observations are mostly probing warm emission. Since most gas in disks exists at 50K temperatures, there may be a substantial amount of material that our observations are not sensitive to. As further discussed in Section 5, follow-up observations of lower-J transitions of HC3N and CH3CN will be helpful in addressing this issue.
Because the retrieved abundance profiles may depend on the physical disk structure assumed in the model, we also present the CH3CN and HC3N abundance profiles normalized with respect to HCN. This should be less sensitive to the details of the physical model structure assuming that all three molecules are emitting co-spatially; this is already implicit in our model since we used the same freeze-out and photo-dissociation boundary conditions to retrieve molecular abundances within a given source. H13CN is converted to HCN using the standard isotopic ratio of 70 with an uncertainty of 15%.
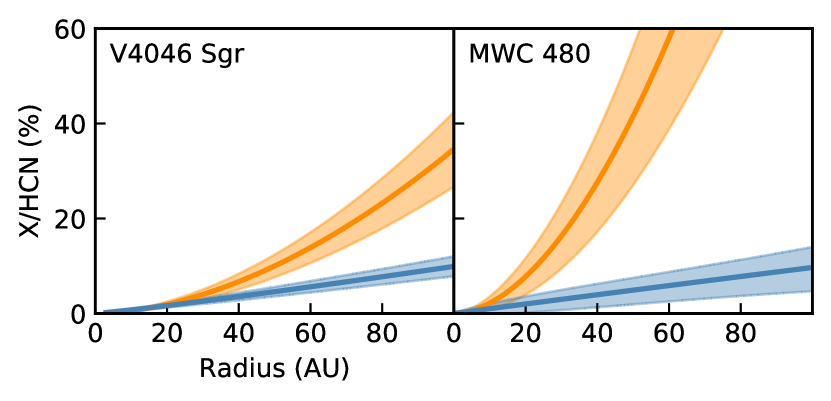
The resulting CH3CN and HC3N abundance profiles with respect to HCN in V4046 Sgr and MWC 480 are shown in Figure 9. The derived gas-phase abundances with respect to HCN in the inner 100AU of the disks are on the order of a few percent for CH3CN and a few tens of percent for HC3N. These model-derived inner disk abundances are consistent with the range of disk-averaged abundances calculated assuming 30–70K rotational temperatures (Table 4).
5 Discussion
In a sample of 6 protoplanetary disks, we have detected the complex nitrile molecules HC3N and CH3CN in five and three disks respectively. These molecules therefore appear common in other nascent planeatry systems. The disks in our sample host a range of physical conditions, which can be used to evaluate the nitrile chemistry in disks. We begin by surveying the possible origins of complex nitriles in disks, followed by an evaluation of our source sample.
5.1 Nitrile formation in disks
5.1.1 Chemical pathways
HC3N is proposed to form efficiently in the gas phase, via either CN + C2H2 or HCN + C2H (Fukuzawa & Osamura, 1997), and has no known efficient grain surface formation pathways. In contrast, CH3CN can form via both gas-phase and grain-surface processes. In current astrochemistry codes, the dominant gas phase CH3CN formation channel is CH + HCN followed by dissociative recombination. On grain surfaces, CH3 + CN or hydrogenation of C2N are proposed to be efficient at forming CH3CN (Huntress & Mitchell, 1979; Walsh et al., 2014). Current evidence suggests that grain-surface chemistry is a primary contributor of CH3CN in disk environments: in Öberg et al. (2015), a gas-phase only chemical model failed to reproduce observed abundances of CH3CN/HCN towards MWC 480, implying a significant contribution from grain-surface chemistry to the observed gas-phase abundances. Likewise, Loomis et al. (in prep.) test a gas-phase only and gas-grain model and find that grain chemistry is required to reproduce observed CH3CN abundances in the disk around TW Hya. We note that all of the proposed formation mechanisms of CH3CN have estimated rate constants and have not been experimentally validated, and there may be important contributions from as yet unexplored chemistry that leads to CH3CN formation.
5.1.2 Nitrile abundance correlations
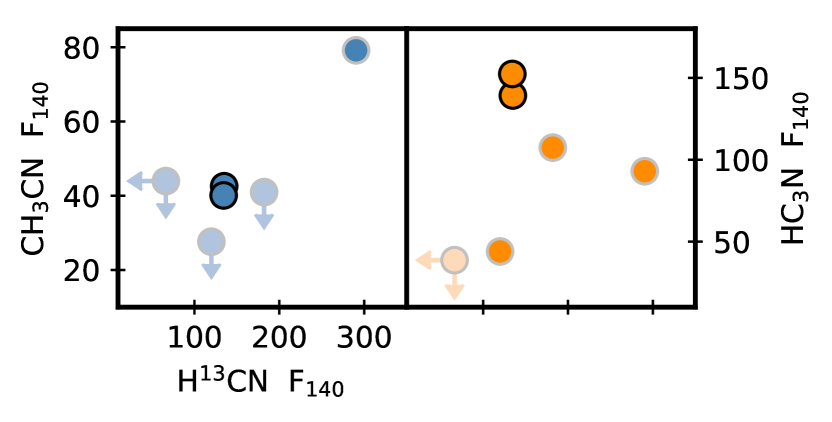
To explore the relationship among different nitrile-bearing species in our disk sample, Figure 10 shows the distance-normalized fluxes of the CH3CN 140–130 and HC3N 27–26 transitions each plotted against the H13CN 3–2 transition.
The HC3N emission strength has no clear relation to H13CN. However, interpreting this lack of correlation is complicated by the high upper energy of the HC3N 27–26 line: with an excitation temperature of 165K, this transition is not sensitive to cool HC3N molecules which may be abundant in some disks. Indeed, the enhanced HC3N emission around the Herbig Ae stars compared with the T Tauri stars is consistent with a thermal effect (Figure 10), as there will be more hot molecular material around more luminous stars. Observations of lower-J HC3N transitions are needed to determine whether the HC3N chemistry is related to the other nitrile chemistry in disks.
From the available data, CH3CN emission appears to correlate with H13CN, although more detections are required to establish if this relationship is real. We note that CH3CN exhibits no such correlation with C18O emission strength; the tentative correlation with H13CN is therefore not simply a trend with the amount of gas in the disk. If additional data points confirm this correlation, it may be evidence for an active gas-phase contribution to CH3CN formation, as this is currently the only chemical pathway with a direct link between HCN and CH3CN. Other potential gas-phase and grain-surface channels to CH3CN formation which could explain a correlation with HCN but are not currently included in models should be also explored.
5.1.3 Nitrile spatial correlations
Correlations in the spatial extent of molecules within a disk can also be used to constrain their formation chemistry. Across the disk sample, the spatial distributions of CH3CN and HC3N (Figure 2) as well as H13CN (see Guzmán et al., 2017 for H13CN maps) are all compact, typically well within the bounds of the dust continuum. This spatial similarity of nitrile emission within each disk is consistent with a chemical scheme in which CH3CN and HC3N depend on abundant HCN (or its photo-product CN) to form. We note that this is a stronger constraint for CH3CN and H13CN than for HC3N because, as discussed above, the emission from high-J transitions of HC3N may not reflect the true distribution of molecules within the disk, and lower-energy transitions are required to confirm a compact distribution.
Determining whether the spatial distributions of HC3N and its proposed precursor C2H are related will provide important constraints on the HC3N formation chemistry. Spatially resolved observations of C2H towards TW Hya show a ringed structure peaking near the edge of the sub-millimeter continuum; DM Tau similarly demonstrates an outer ring near the dust edge and an inner ring co-spatial with the continuum (Kastner et al., 2015; Bergin et al., 2016). A ringed morphology may be a feature of hydrocarbons more generally, and indeed is reproduced for the slightly larger hydrocarbon C3H2 (Bergin et al., 2016; Qi et al., 2013). The apparent anti-correlation of HC3N and C2H suggests that the proposed HC3N formation pathway of C2H + HCN may not be efficient. If the ringed morphology is common to all hydrocarbons, this is also problematic for the C2H2 + CN pathway, although the relationship between C2H and C2H2 distributions is unconstrained. Yet again we note that due to the high-energy HC3N transitions and comparatively low angular resolution of our observations we cannot exclude the possibility of HC3N rings. Higher-resolution observations of lower-J HC3N transitions combined with C2H observations in the same sources will be important for constraining whether the current HC3N formation paradigm is viable.
5.2 Physical drivers of nitrile chemistry in disks
The physical conditions of a protoplanetary disk set what chemistry can occur; while myriad properties have been proposed as chemical drivers in disks, we focus here on those which are to some degree testable based on the properties of our sample, namely the radiation field, disk structure, and evolutionary stage.
5.2.1 Radiation field
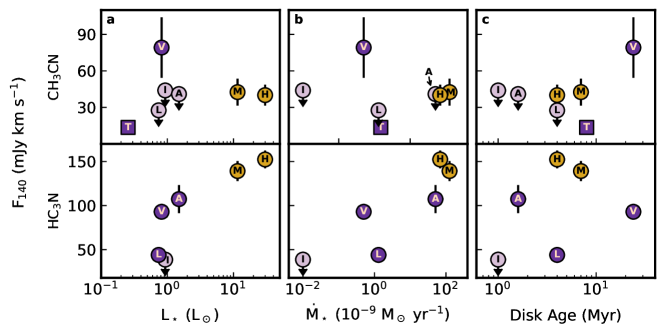
The quiescent luminosity and accretion luminosity of a host star both contribute to the overall radiation environment in a disk. The FUV emission in T Tauri stars arises dominantly from accretion luminosity, while Herbig Ae stars should have significant FUV contributions from quiescent stellar photospheric emission in addition to accretion luminosity (e.g. Kurucz, 1993; Matsuyama et al., 2003). Figure 11a–b shows the distance-normalized disk-integrated fluxes of CH3CN 140–130 and HC3N 27–26 plotted against the quiescent luminosity and the mass accretion rate of each star. For comparison, the CH3CN 140–130 flux calculated for TW Hya based on the observations of Loomis et al. (in prep.) is also included, with a bolometric luminosity and mass accretion rate taken from Van Boekel et al. (2017) and Herczeg & Hillenbrand (2008) respectively. For CH3CN we do not see any obvious trends with L⋆ or . This lack of correlation with the radiation field could indicate emission from the colder UV-shielded layers of the disk, but is also possibly due to the small number of CH3CN detections. HC3N appears to correlate with both the stellar luminosity and the mass accretion rate, suggesting that the UV field may play an important role in driving its chemistry. However, due to the high upper energy of the 27–26 transition, this could be due in part to the presence of hotter gas in high-UV environments rather than increased abundances of HC3N; observations of lower-J HC3N lines will be able to break this degeneracy.
5.2.2 Disk age
As disks evolve, processes such as viscous accretion, dust growth/settling, and radial drift reshape the physical structure of the disk (reviewed in Williams & Cieza, 2011). Astrochemical modelers have recently begun to explore how a dynamically evolving disk impacts the chemistry, with a particular focus on the C/O ratio over time (Piso et al., 2015; Eistrup et al., 2017). Modeling by Du et al. (2015) shows that the abundance of nitrile species can be greatly enhanced as a result of gas-phase carbon and oxygen depletion: as the system ages and more CO and H2O are depleted from the gas-phase, the nitrile abundances should correspondingly increase. Observationally, Kastner et al. (2014) observed enhanced CN abundances towards the evolved disks around TW Hya and V4046 Sgr.
Figure 11c shows the CH3CN 140–130 and HC3N 27–26 integrated fluxes normalized to a distance of 140pc and plotted against the disk age. Again, the CH3CN 140–130 flux in TW Hya calculated from the observations of Loomis et al. (in prep.) is included for comparison. V4046 Sgr, the oldest disk in the sample, shows anomalously high CH3CN emission. However, in all other disks CH3CN detections and upper limits are fairly clustered, showing no obvious trend with age. Likewise, HC3N emission does not appear related to disk age. With the existing data there is therefore insufficient evidence for an evolutionary trend in nitrile emission. We note that the discrepancy in CH3CN emission between V4046 Sgr and TW Hya is somewhat surprising given that the line intensities of other small molecules in the two disks are quite similar (Kastner et al., 2014).
5.2.3 Inner dust cavity
The disk structure sets set how radiation is processed through the disk. Transitional disks, characterized by inner gaps in mm dust emission, may host a distinct chemistry due to increased UV radiation in the inner disk (e.g. Cleeves et al., 2011). LkCa 15 and V4046 Sgr are both transition disks and yet exhibit very different nitrile chemistries: V4046 Sgr is strongly detected in both CH3CN and HC3N, while LkCa 15 is weakly detected in HC3N and tentatively or not detected in CH3CN. There is therefore no strong global impact of an inner cavity on the disk’s nitrile chemistry; observations towards other transition disks are needed to confirm this in a larger sample. On smaller scales, we expect that the presence of an inner gap would result in warmer gas and a higher UV field within the cavity. Suggestively, there is a slight peak in the radial profile of CH3CN in LkCa 15 out to 50 AU scales (Figure 3), consistent with the cavity radius derived by Piétu et al. (2006); however, this emission is not significant at the 3 level and therefore no firm conclusions can be drawn.
5.3 Nitriles in different circumstellar environments
We now compare the disk-averaged abundance ratios for our sample with the abundances measured in similar objects at different evolutionary stages. Low-mass protostars are the evolutionary precursors to the 2M⊙ stars in this sample, while comets formed out of the midplane of the protosolar nebula and should preserve material from the time of planet formation. We note the environments in these different types of objects span a wide range of temperatures, densities, radiation fields, and other physical conditions.
As discussed in Section 4.3, for V4046 Sgr and MWC 480 the model-derived CH3CN/HCN and HC3N/HCN abundances in the inner 100 AU are consistent with the range of disk-averaged abundances calculated for 30K–70K rotational temperatures. In this section, we therefore use the range of disk-averaged abundances as representative of the inner 100AU of the disk in order to compare across the entire disk sample.
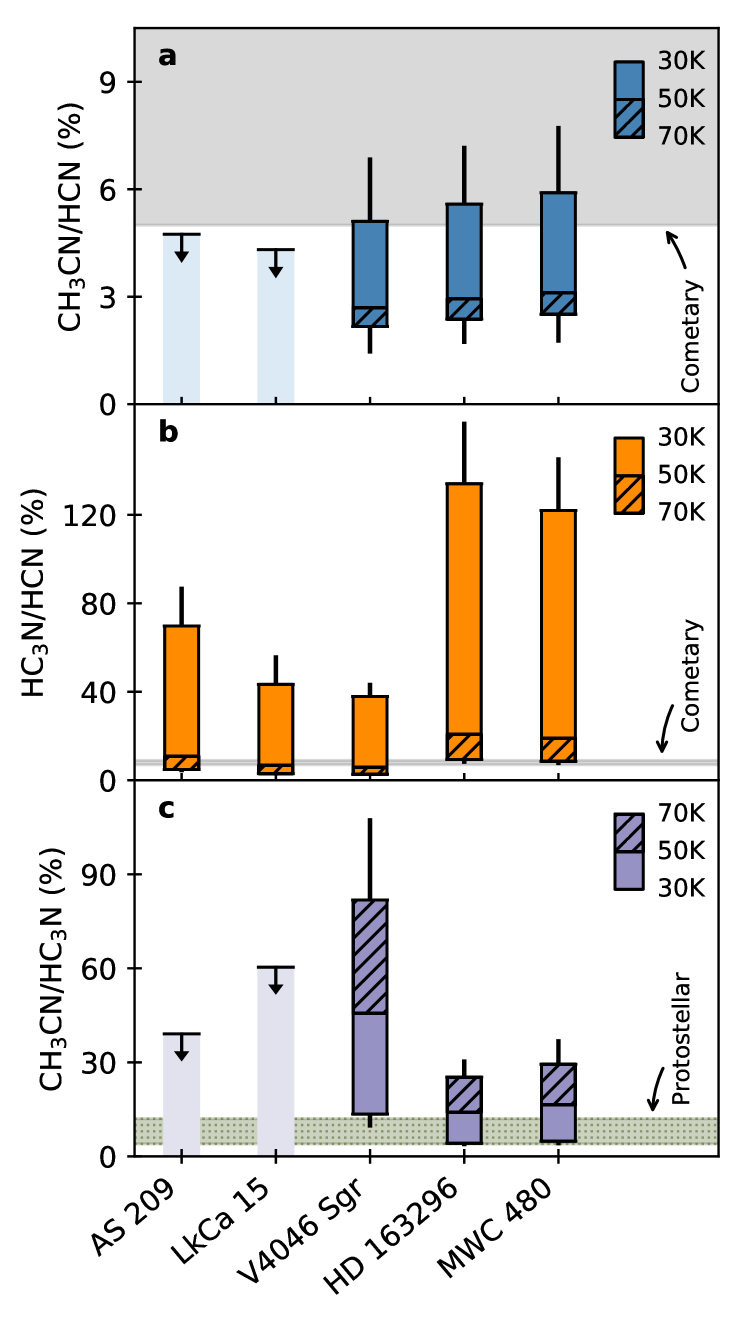
Figure 12a–b show the range of CH3CN/HCN and HC3N/HCN abundances measured in solar system comets (Mumma & Charnley, 2011) compared to the gas-phase abundances measured in our disk sample. The disk abundances of CH3CN are within a few percent of the values measured in solar system comets for sources with detections. The upper limits for AS 209 and LkCa 15 are somewhat lower but still possibly within a few percent of cometary.
For HC3N, the disk abundances are up to an order of magnitude higher than cometary for an adopted 30K rotational temperature; however, given the warmer (50K) HC3N rotational temperature derived for MWC 480, we expect that the abundances calculated assuming a 30K temperature over-estimate the HC3N/HCN ratio for the Herbig Ae disks at least. Restricting the comparison to the 50–70K values, the HC3N abundances are quite close to cometary.
Figure 12c shows the range of CH3CN/HC3N ratios measured in a sample of 16 low-mass protostellar envelopes (Bergner et al., 2017). HCN column densities towards these sources are not available, however the CH3CN/HC3N ratio still provides a useful proxy for the relative efficiency of different complex nitrile chemistries. The ratios across the disk sample are mostly consistent with the values measured in protostellar envelopes, with the exception of V4046 Sgr which is somewhat enhanced in CH3CN/HC3N compared to the other disks and protostars.
Based on this comparison, we see that the gas-phase nitrile abundances relative to other N-bearing molecules are consistent across various physical environments: disk molecular layers, protostellar envelopes, and the midplane of the solar nebula. We note that with these observations alone we cannot directly compare the comet- and planet-forming material in our sample with that of the protosolar nebula, as this would require extrapolations (i) from the molecular layer down to the midplane, and (ii) from gas-phase to ice abundances. Nonetheless, the consistency of nitrile abundances across a wide range of physical conditions demonstrates a robust nitrile chemistry with similar outcomes in different environments. CH3CN abundance ratios (and upper limits) in particular appear to be especially regular both across the disk sample and in comparison with comets and protostars. Complex nitrile species should therefore be reliably produced in a variety of different star- and planet-forming environments.
While the abundances of N-bearing molecules appear internally consistent across a range of physical environments, there is evidence that the ratio of N- to O-bearing COMs in disks is distinct compared to other environments. In both comets and protostellar envelopes the CH3CN/CH3OH ratio is typically on the order of a few percent (Mumma & Charnley, 2011; Bergner et al., 2017). By contrast, in the one disk where CH3OH has been detected (TW Hya), the column density ratio of CH3CN/CH3OH is about unity (Walsh et al., 2016; Loomis et al., in prep.), indicative of an oxygen-poor chemistry. Similarly, our observations covered a number of CH3OH transitions in the 5–4 ladder, with no CH3OH detections despite the strong nitrile emission. This suggests that the under-abundance of gas-phase O- vs. N-bearing COMs is systematic in disks. A nitrogen-rich, oxygen-poor chemistry is qualitatively consistent with an oxygen-starved environment due to e.g. the depletion of H2O and CO from the gas phase (Du et al., 2015). Such a scenario would indicate a predominantly gas-phase formation pathway for CH3CN in disks. Another possible factor is if the photodesorption efficiency of intact CH3CN is high compared to CH3OH, which has been shown to photodesorb mainly as fragments (Bertin et al., 2016; Cruz-Diaz et al., 2016). Since photodesorption from grains is thought to be of primary importance in disks, compared to mainly thermal desorption in protostars and comets, this could also contribute to the observed discrepancy in CH3CN/CH3OH across circumstellar environments. Further exploration of the nitrile formation chemistry in disks using astrochemical models is needed to resolve the origin of this unique chemistry.
6 Conclusions
Based on ALMA observations of the complex nitrile species CH3CN and HC3N towards six protoplanetary disks, we conclude the following:
-
1.
Complex nitrile molecules are commonly observed in protoplanetary disks, with five of six disks detected in HC3N and three of six disks detected in CH3CN.
-
2.
Rotational temperatures derived for sources with multiple line detections are consistent with emission from the temperate molecular layer of the disk. V4046 Sgr exhibits cool (29 2K) CH3CN emission consistent with the temperature measured in TW Hya (Loomis et al., in prep.). CH3CN and HC3N in MWC 480 are both characterized by warmer emission, with rotational temperatures of 73 23K and 49 6K respectively. The increased radiation field around Herbig Ae disks compared to T Tauri disks may be responsible for this difference.
-
3.
Parametric models of the CH3CN, HC3N, and H13CN abundances in MWC 480 and V4046 Sgr are used to fit the observed emission and constrain radial abundance profiles. Within 100AU, CH3CN/HCN abundances are on the order of a few percent and HC3N/HCN abundances on the order of tens of percent.
-
4.
Across the disk sample we observe a tentative correlation of CH3CN with H13CN emission; if confirmed by further detections, the formation chemistry of CH3CN should be re-visited to explain this relationship. We see evidence for a possible anti-correlation in the spatial distributions of HC3N and its pre-cursor C2H; if confirmed in lower-J HC3N transitions this would seem to rule out the current proposed HC3N formation path.
-
5.
We use the heterogenous physical properties of our disk sample to explore whether the UV field, disk age, or presence of an inner dust cavity impact the nitrile chemistry. We observe no strong trends relating these environmental properties to the nitrile emission strength. We emphasize the need for observations of lower-energy HC3N lines to help constrain any relationships with disk physical properties.
-
6.
Disk-averaged CH3CN and HC3N abundances relative to other N-bearing molecules are compared to values measured in solar system comets and protostellar envelopes and found to be consistent across these different of environments, although the HC3N/HCN uncertainties are large due to sensitivity to the adopted rotational temperature. These molecules appear to be reliably produced under a wide variety of physical conditions, demonstrating a robust nitrogen chemistry with similar outcomes in different environments.
-
7.
Our results are suggestive of a disk chemistry systematically rich in N-bearing relative to O-bearing COMs when compared to other circumstellar environments. The origin of this unique chemistry observed in disks compared to other stages of star and planet formation remains to be resolved.
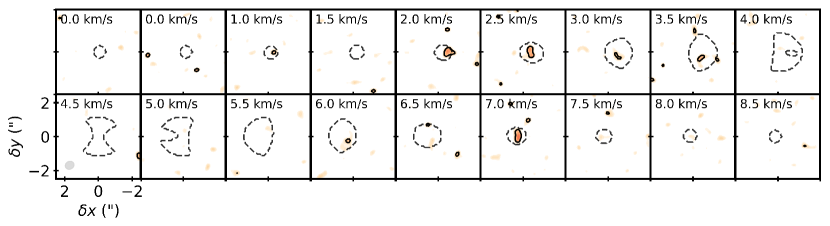
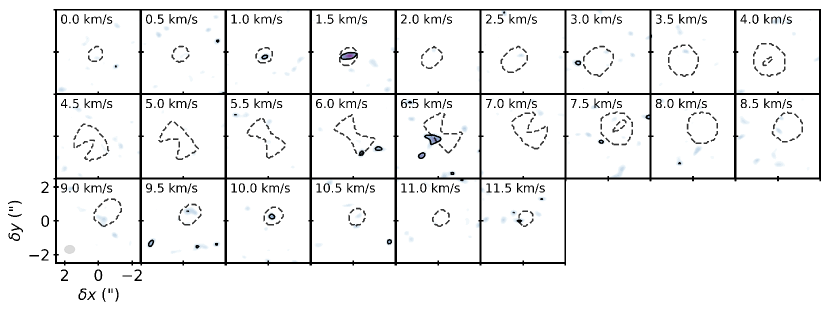
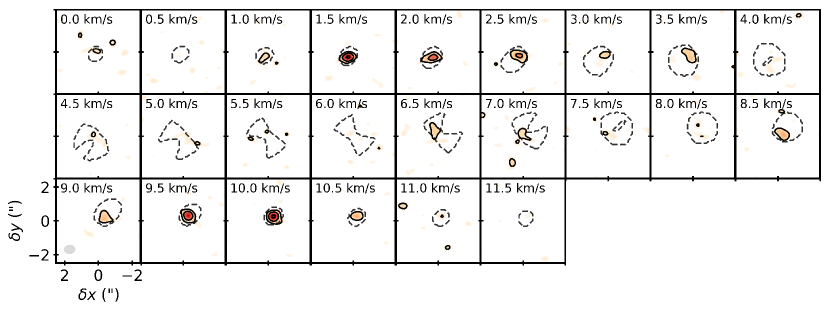
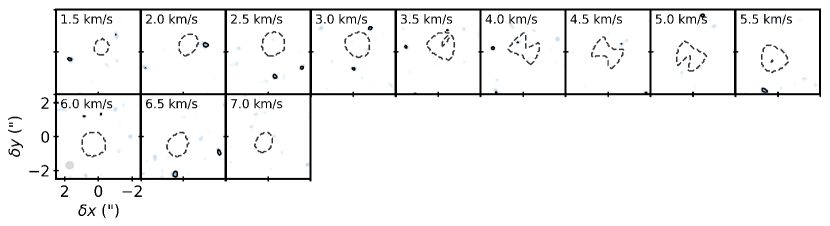
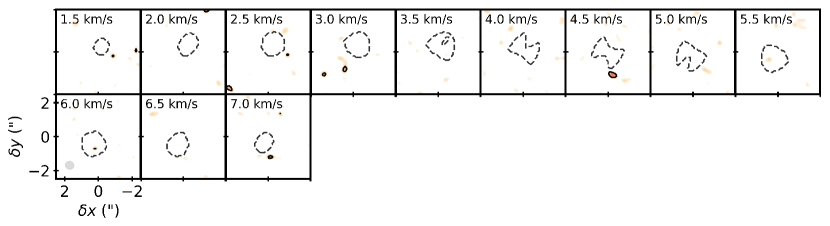
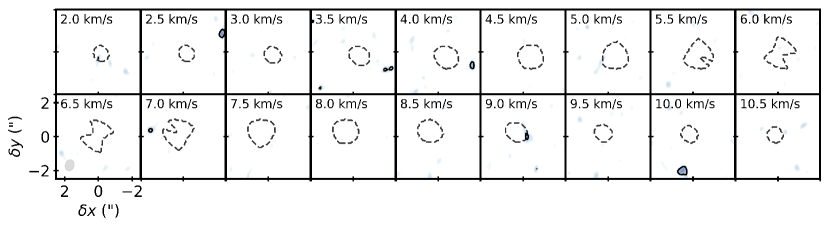
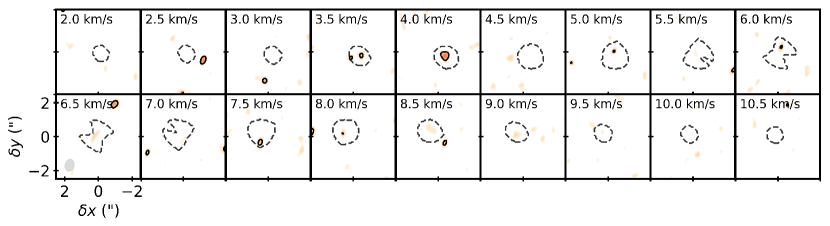
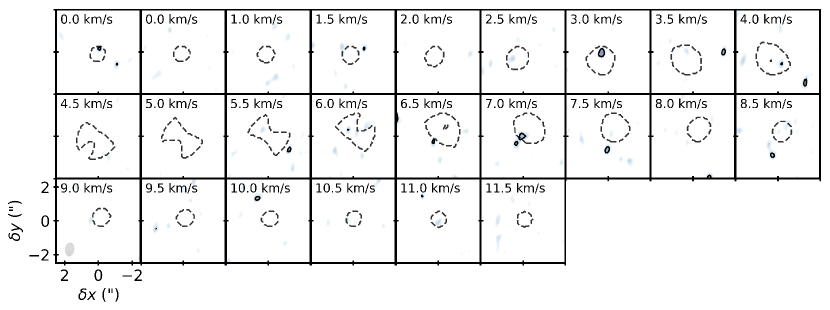
Appendix A Channel maps
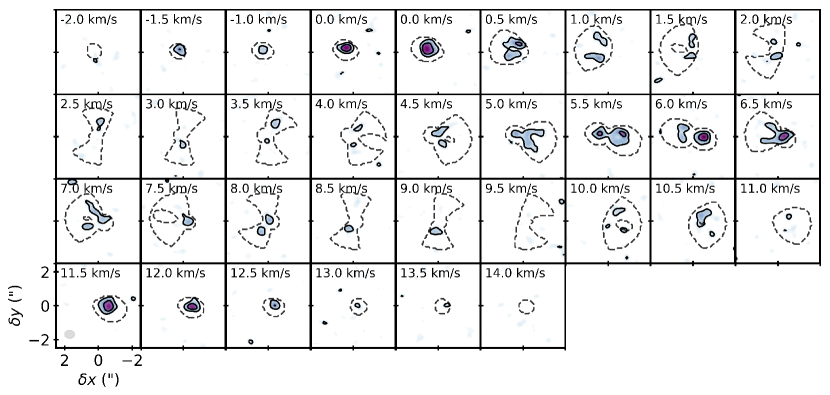
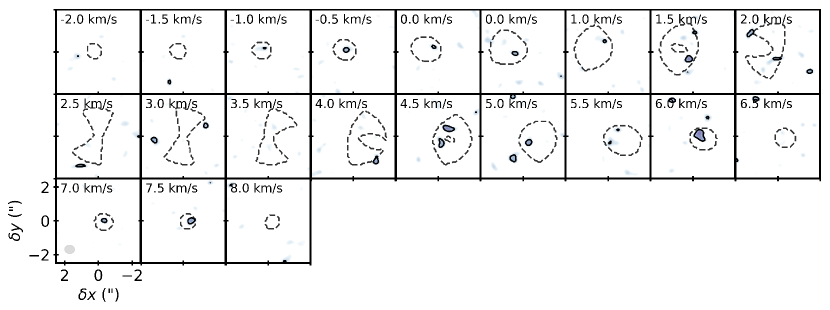
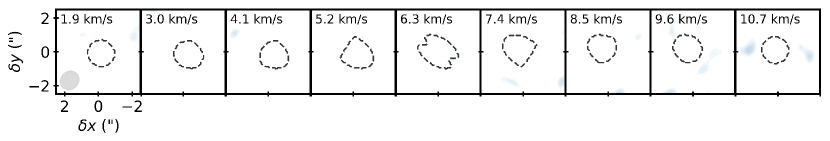
Channel maps for CH3CN 140-130 and HC3N 27-26 in all sources are shown in Figures 13-23. Channel maps for additional observed lines in V4046 Sgr, LkCa 15, and MWC 480 are shown in Figures 24-32.
Appendix B Abundance models
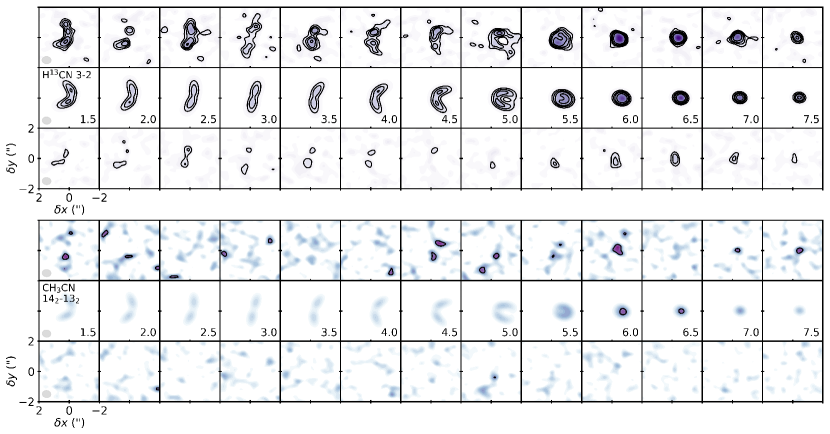
Modeling results for H13CN and CH3CN 142–132 in V4046 Sgr are shown in Figure 33. Figure 34 shows modeling results for MWC 480 CH3CN 140–130, HC3N 27–26, H13CN 3–2, CH3CN 150–140, and HC3N 31–30.
References
- Astropy Collaboration (2013) Astropy Collaboration, 2013, A&A, 558, A33
- Bergin et al. (2016) Bergin, E. A., Du, F., Cleeves, L. I., et al. 2016, ApJ, 831, 101
- Bergin et al. (2013) Bergin, E. A., Cleeves, L. I., Gorti, U., et al. 2013, Nature, 493, 644
- Bergner et al. (2017) Bergner, J. B., Öberg, K. I., Garrod, R. T., & Graninger, D. M. 2017, ApJ, 841, 120
- Bertin et al. (2016) Bertin, M., Romanzin, C., Doronin, M., et al. 2016, ApJ, 817, L12
- Calvet et al. (2004) Calvet, N., Muzerolle, J., Briceño, C., et al. 2004, ApJ, 128, 1294
- Chapillon et al. (2012) Chapillon, E., Dutrey, A., Guilloteau, S., et al. 2012, ApJ, 756, 58
- Cleeves et al. (2011) Cleeves, L. I., Bergin, E. A., Bethell, T. J., et al. 2011, ApJ, 743, L2
- Cordiner et al. (2014) Cordiner, M. A., Remijan, A. J., Milam, S. N., et al. 2014, ApJ, 792, L2
- Cruz-Diaz et al. (2016) Cruz-Diaz, G. A., Doménech, R. M., Muñoz Caro, G. M., & Chen, Y. J. 2016, A&A, 592, A68
- Du et al. (2015) Du, F., Bergin, E. A., & Hogerheijde, M. R. 2015, ApJ, 807, L32
- Dullemond (2012) Dullemond, C. P. 2012, RADMC-3D: A Multi-purpose Radiative Transfer Tool, Astrophysics Source Code Library, ascl:1202.015
- Dutrey et al. (1997) Dutrey, A., Guilloteau, S., & Guélin, M. 1997, A&A, 317, L55
- Dutrey et al. (2014) Dutrey, A., Semenov, D., Chapillon, E., et al. 2014, in Protostars and Planets VI, ed. H., Beuther et al. (Tucson, AZ: Univ. of Arizona Press), p. 317
- Eistrup et al. (2017) Eistrup, C., Walsh, C., & van Dishoeck, E. F. 2017, arXiv:1709.07863, A&Ain press
- Foreman-Mackey et al. (2013) Foreman-Mackey, D., Hogg, D. W., Lang, D., & Goodman, J. 2013, PASP, 125, 306
- Fukuzawa & Osamura (1997) Fukuzawa, K. & Osamura, Y. 1997, ApJ, 489, 113
- Gaia collaboration (2016) Gaia Collaboration, Brown, A. G. A., Vallenari, A. et al. 2016, A&A, 595, A2
- Goldman et al. (2010) Goldman, N., Reed, E. J., Fried, L. E., William Kuo, I. F., & Maiti, A. 2010, NatCh, 2, 949
- Goldsmith & Langer (1999) Goldsmith, P. F. & Langer, W. D. 1999, ApJ, 517, 209, 959
- Gordy & Cook (1984) Gordy, W. & Cook, R. L. 1984, Microwave molecular spectra (Wiley, New York, 3rd ed)
- Gratier et al. (2013) Gratier, P., Pety, J., Guzmán, V., et al.. 2013, A&A, 557, A101
- Güdel & Nazé (2009) Güdel, M. & Nazé, Y. 2009, A&ARv, 17, 309
- Guzmán et al. (2017) Guzmán, V. V., Öberg, K. I., Huang, J., et al. 2017, ApJ, 836, 3
- Guzmán et al. (2015) Guzmán, V. V., Öberg, K. I., Loomis, R., & Qi, C. 2015, ApJ, 814, 53
- Herczeg & Hillenbrand (2008) Herczeg, G. J. & Hillenbrand, L. A. 2008, ApJ, 681, 594
- Huang et al. (2017) Huang, J., Öberg, K. I., Qi, C., et al. 2017, ApJ, 835, 231
- Hunter et al. (2007) Hunter, J. D. 2007, Comput. Sci. Eng., 9, 90
- Huntress & Mitchell (1979) Huntress, W. T., Jr. & Mitchell, G. F. 1979, ApJ, 231, 456
- Kastner et al. (1997) Kastner, J. H., Zuckerman, B., Weintraub, D. A., & Forveille, T. 1997, Sci, 277, 67
- Kastner et al. (2014) Kastner, J. H., Hily-Blant, P., Rodriguez, D. R., Punzi, K., & Forveille, T. 2014, ApJ, 793, 55
- Kastner et al. (2015) Kastner, J. H., Qi, C., Gorti, U., et al. 2015, ApJ, 806, 75
- Kurucz (1993) Kurucz, R. L. 1993, VizieR Online Data Catalog, 6039,0
- Le Roy et al. (2015) Le Roy, L., Altwegg, K., Balsiger, H., et al. 2015, A&A, 583, A1
- Loomis et al. (2015) Loomis, R., Cleeves, I. L., Öberg, K. I., et al. 2015, ApJ, 809, L25
- Loomis et al. (in prep.) Loomis, R., Cleeves, I. L., Öberg, K. I., et al. in prep.
- Loomis et al. (subm.) Loomis, R., Öberg, K. I., Andrews, S. M., & MacGregor, M. A. subm.
- Loren & Mundy (1984) Loren, R. B. & Mundy, L. G. 1984, ApJ, 286, 232
- Mangum & Shirley (2015) Mangum, J. G., & Shirley, Y. L. 2015, PASP, 127, 266
- Matsuyama et al. (2003) Matsuyama, I., Johnstone, D., & Hartmann, L. 2003, ApJ, 582, 893
- Mumma & Charnley (2011) Mumma, M. J. & Charnley, S. B. 2011, ARA&A, 49, 471
- Öberg et al. (2010) Öberg, K. I., Qi, C., Fogel, J. K. J., et al. 2010, ApJ, 720, 480
- Öberg et al. (2011) Öberg, K. I., Qi, C., Fogel, J. K. J., et al. 2011, ApJ, 734, 98
- Öberg et al. (2015) Öberg, K. I., Guzmán, V. V., Furuya, K., et al. 2015, Nature, 520, 198
- Öberg et al. (2017) Öberg, K. I., Guzmán, V. V., Merchantz, C. J., et al. 2017, ApJ, 893, 43
- Pascucci et al. (2009) Pascucci, I., Apai, D., Luhman, K., et al. 2009, ApJ, 696, 143
- Piso et al. (2015) Piso, A.-M. A., Öberg, K. I., Birnstiel, T., & Murray-Clay, R. A. 2015, ApJ, 815, 109
- Pegues et al. (in prep) Pegues, J. in prep.
- Piétu et al. (2006) Piétu, V., Dutrey, A., Guilloteau, S., Chapillon, E., & Pety, J. 2006, A&A, 460, L43
- Pontoppidan et al. (2010) Pontoppidan, K. M., Salyk, C., Blake, G., et al. 2010, ApJ, 720, 887
- Powner et al. (2009) Powner, M. W., Gerland, B., & Sutherland, J. D. 2009, Nature, 459, 239
- Qi et al. (2013) Qi, C., Öberg, K. I., & Wilner, D. J. 2013, ApJ, 765, 34
- Qi et al. (2013) Qi, C., Öberg, K. I., Wilner, D. J., & Rosenfeld, K. A. 2013, ApJ, 765, L14
- Qi et al. (2008) Qi, C., Wilner, D. J., Aikawa, Y., Blake, G. A., & Hogerheijde, M. R. 2008, ApJ, 681, 1396
- Rosenfeld et al. (2013a) Rosenfeld, K. A., Andrews, S. M., Hughes, A. M., &Wilner, D. J. 2013, ApJ, 774, 16
- Rosenfeld et al. (2013b) Rosenfeld, K. A., Andrews, S. M., Kastner, J. H., &McLure, M. K. 2013, ApJ, 775, 136
- Ritson & Sutherland (2012) Ritson, D. & Sutherland, J. D. 2012, NatCh, 4, 895
- Sutherland (2016) Sutherland, J. D. 2016, Angew. Chem., 55, 104
- Thi et al. (2004) Thi, W. F., Van Zadelhoff, G. J., & van Dishoeck, E. F. 2004, A&A, 425, 955
- Van Boekel et al. (2017) Van Boekel, R., Henning, T., Menu, J., et al. 2017, ApJ, 837, 132
- Van Der Walt et al. (2011) Van Der Walt, S., Colbert, C. C., & Varoquaux, G. 2011, Comput. Sci. Eng., 13, 22
- Van Der Walt et al. (2014) Van Der Walt, S., Schönberger, J. L., Nunez-Iglesias, J., et al. 2014, PeerJ 2:e453
- Walsh et al. (2014) Walsh, C., Millar, T. J., Nomura, H., et al. A&A, 563, A33
- Walsh et al. (2016) Walsh, C., Loomis, R. A., Öberg, K. I., et al. ApJ, 823, L10
- Williams & Cieza (2011) Williams, J. P. & Cieza, L. A. ARA&A, 49, 67