A single population of red globular clusters around the massive compact galaxy NGC 1277
Massive galaxies are thought to form in two phases: an initial, early collapse of gas and giant burst of central star formation, followed by the later accretion of material that builds up their stellar and dark matter haloes (?) (?) (?) (?). The globular cluster systems of such galaxies are believed to form in a similar manner. The initial central burst forms metal-rich (red) clusters, while more metal-poor (blue) clusters are brought in by the later accretion of less massive satellites (?) (?) (?) (?) (?) (?). This formation process is thought to lead the creation of the multimodal optical colour distributions seen in the globular cluster systems of massive galaxies (?) (?) (?). Here we report optical observations of the massive relic galaxy NGC 1277, a nearby unevolved example of a high redshift “red nugget” (?) (?) (?) (?) (?). The cluster colour distribution shows that the GC system of the relic is unimodal and uniquely red. This is in strong contrast to normal galaxies of similar and larger stellar mass, whose cluster systems always exhibit (and are generally dominated by) blue clusters (?). We argue that the cluster system of NGC 1277 indicates that the galaxy has undergone little (if any) mass accretion after its initial collapse and use analytic merger trees to show that the total stellar mass accretion is likely less than %. These results confirm that NGC 1277 is a genuine relic galaxy and show that the blue clusters constitute an accreted population in present day massive galaxies.
Introduction
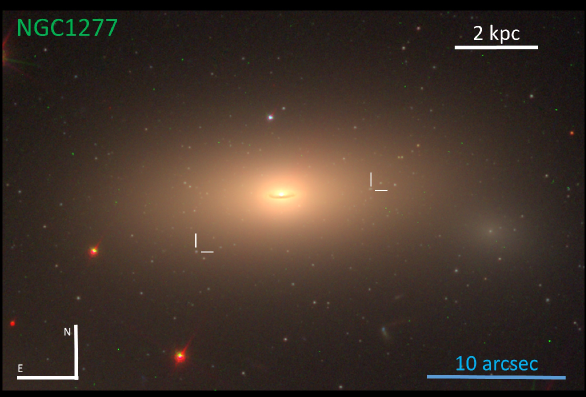
We obtained HST/ACS and imaging of NGC 1277 in order to characterize its globular cluster system (E.D. Fig. 1). NGC 1277 has been identified as a massive ( M⊙; (?)) relic galaxy based on its high stellar mass density, compactness, kinematics and old and metal-rich stellar populations (?) (?) (?) (?). We hypothesized that if NGC 1277 is a true relic – a low redshift counterpart of massive, compact high-redshift galaxies termed “red nuggets” – then NGC 1277 should have accreted little or no stellar halo and should have few or no blue clusters.
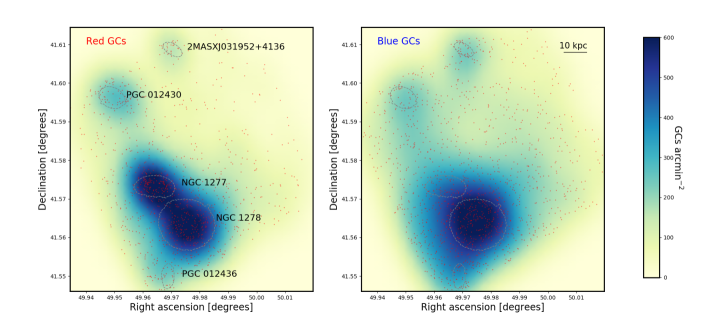
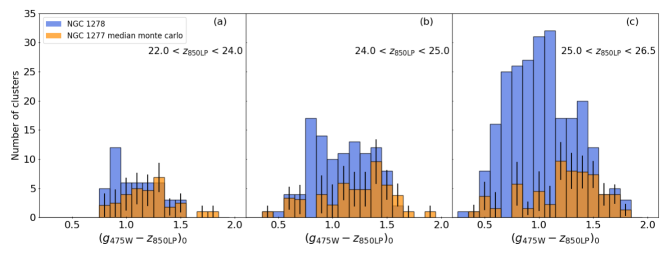
The spatial distributions of cluster candidates from the HST/ACS imaging (Fig. 1) indicate that both NGC 1277 and its companion galaxy in projection, NGC 1278, have relatively rich cluster systems. Separating the clusters in the ACS field by colour by cutting at (, the approximate separation between the red and blue peaks for a galaxy of this mass in the ACS Virgo Cluster Survey (?), it is apparent that while NGC 1277 has a rich red cluster population, it has few blue clusters. This is in strong contrast to NGC 1278, which has a similar stellar mass to NGC 1277 ( M⊙), but has both red and blue clusters.
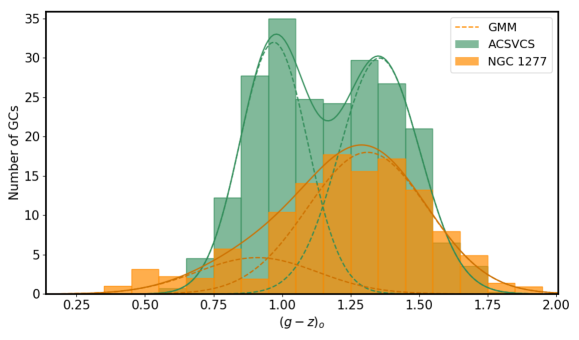
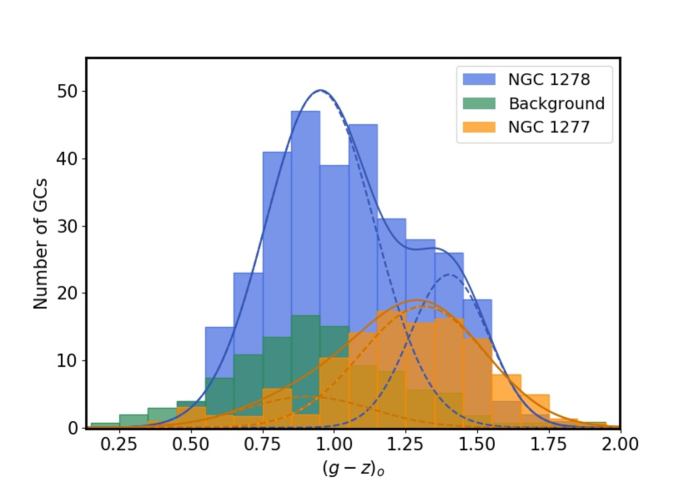
This visual impression is supported by looking at the detailed colour distribution of the NGC 1277 GCs compared to galaxies from the Virgo Cluster survey of similar stellar mass (Fig. 2). No obvious blue peak is seen in the cluster colour distribution of NGC 1277, which appears red with a tail to bluer colours. In contrast, the survey composite colour distribution has both blue and red peaks. We ran gaussian mixture modelling tests (gmm) (Methods) on these colour distributions whose null hypothesis is that the input colour distributions are unimodal. For NGC 1277, gmm cannot reject the null hypothesis, i.e. that of a unimodal distribution for the GCs (). However, under the assumption that two populations of clusters are indeed present, gmm associates 99 clusters with a red cluster population with a mean colour ( while 21 clusters are associated with a metal-poor component with mean colour . For the survey colour distribution, gmm rejects a unimodal distribution at high confidence (), finding a roughly even split between blue (101 clusters) and red clusters (110 clusters) with colour peaks at (- and , respectively.
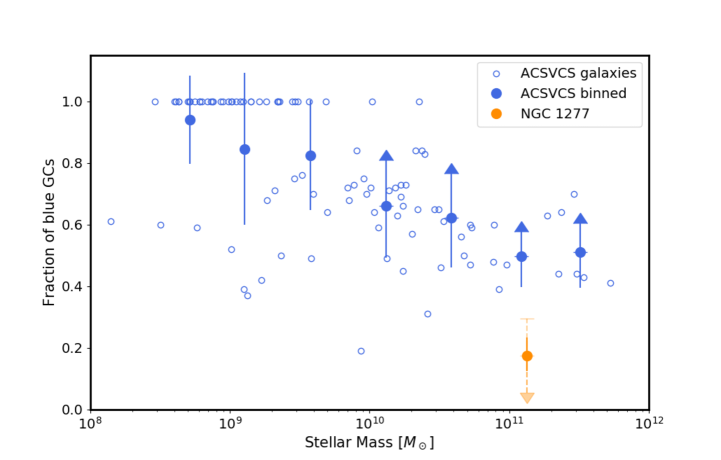
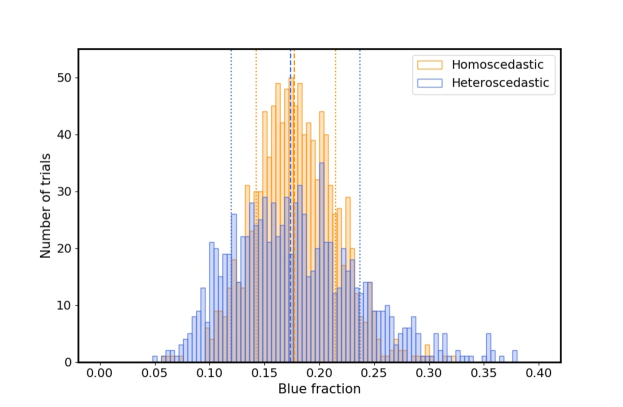
The results of the survey show that the cluster systems of present-day massive galaxies can have diverse colour distributions and that all galaxies in the survey, independent of their stellar mass, have substantial numbers of blue clusters (?). For galaxies of stellar masses comparable to NGC 1277, the typical blue globular cluster fraction is (?) or larger. For NGC 1277 we find a blue cluster fraction of, (systematic) (random) (Fig. 3, Methods). This is an upper limit since the null hypothesis of unimodality is not rejected. NGC 1277 is clearly an outlier in that it has a significantly lower blue fraction than the survey galaxies at similar stellar mass (Fig. 3).
For massive galaxies in the survey, the blue cluster fractions are lower limits because the survey only covered the inner 1-2 effective radii () of these galaxies, which is a region where red clusters dominate over blue clusters due to the red clusters more concentrated spatial distributions (?). In the case of NGC 1277, which is very compact ( kpc) and located in the more distant Perseus cluster, we have probed the entire radial range () of the cluster system and therefore are not biased against detecting blue clusters. Thus, NGC 1277 truly lacks blue clusters when compared to normal galaxies (Fig. 3).
We rule out the possibility that a colour-magnitude relation in the blue GCs is driving the red-dominated peak of the NGC 1277 clusters. This is not seen in our data (Methods, E.D. Fig. 6). Our results are also unaffected by possible non-linear colour-metallicity relations of the clusters (?) (?) (?). The majority of clusters (70%) in NGC 1277 have , which is the approximate colour where the empirical – metallicity relations for clusters in the Milky Way, M49 and M87 are linear (?).
NGC 1277 is times more compact than normal galaxies of the same stellar mass at (?). As we have shown, NGC 1277 also lacks a significant population of blue clusters which are generally associated with a “halo” population in galaxies. The lack of a halo is consistent with the surface brightness profile of NGC 1277 which shows a sharp decline beyond kpc corresponding to a factor of less stars when compared to normal galaxies of the same mass (?). Assuming that NGC 1277 obeyed the same size-stellar mass relation for quiescent galaxies of the same stellar mass at , NGC 1277 has either been stripped of its outer envelope and clusters and been reduced in size, or NGC 1277 has failed to grow substantially in size and its blue cluster system since . We explored both scenarios and favour the latter picture – i.e. NGC 1277 is a genuine relic galaxy.
The tidal radius of NGC 1277 – the radius at which stars and clusters become unbound from the galaxy – can be estimated analytically (?). In the extreme case that NGC 1277 is currently at pericentre within the Perseus cluster and that its stellar halo and clusters are on prograde orbits with respect to its orbit within Perseus, we calculate a lower limit for the tidal radius of 11 kpc. This corresponds to effective radii in a normal sized galaxy of NGC 1277’s stellar mass and is a radius where the cluster population should consist of at least 50% blue clusters (?). This suggests that stripping has not significantly affected the physical size or the cluster system of NGC 1277. Furthermore, the central stellar density of NGC 1277 is a factor of higher than normal galaxies within 1 kpc (?). Tidal stripping cannot increase central stellar densities (?) implying that NGC 1277 was born both dense and compact. This then raises the question of why NGC 1277 should suffer severe tidal stripping while larger galaxies of similar mass in the same environment – such as NGC 1278 – have not. Finally, the outer region of NGC 1277 shows no evidence for tidal tails or streams (?) and its kinematics show no evidence for stripping in its stellar orbits, in its rotation curve or mass distribution (?).
In contrast, NGC 1277 strongly resembles the low-redshift equivalent of higher redshift compact systems. NGC 1277 lies on the size-stellar mass relation of galaxies (?) (?). It has a high central stellar density consistent with massive galaxies at these redshifts (?). Schwarzschild dynamical modelling (?) shows that NGC 1277 is dominated by high angular momentum orbits implying that it formed in a largely dissipative process. The results of (?) (?) imply that NGC 1277 is essentially a massive disk with no classical, pressure-supported component. These kinematical properties are remarkably similar to the lensed “dead disk” at (?), which has the same stellar mass as NGC 1277 and is similarly compact ( kpc). Additionally, the old, metal-rich stellar population of NGC 1277 is similar to other nearby relic-galaxy candidates (?), with the expectations for passively evolving red nuggets and with predictions for the redshift evolution of the massive, compact systems in cosmological simulations (?) (?). Finally, the fact that NGC 1277 lies in a massive galaxy cluster is neither unexpected observationally or theoretically (Methods).
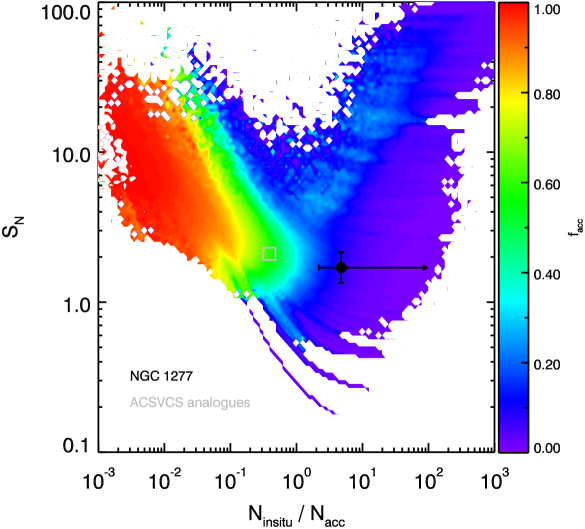
Our findings for the cluster system of NGC 1277 bring further contraints on the evolutionary histories of relic galaxies. In accretion models for the formation of the blue cluster population in massive galaxies, the location of the blue peak and the relative fraction of blue clusters brings insight into the total mass and properties of accreted satellites by any given galaxy (?) (?) (?). We ran a series of analytic merger models (Fig. 4, Methods, E.D. Figs. 7–8) in order to constrain the accreted mass fraction of NGC 1277, based on our observations. From this modelling we find that the observed blue cluster fraction of NGC 1277 is characteristic of galaxies which have accreted % or less of their stellar mass, with the rest of the stars forming in-situ. By contrast, mass-matched ACS Virgo cluster survey galaxies show accretion fractions of %. Therefore, we find that the blue fraction of globular clusters approximately traces the total fraction of accreted mass in galaxies, and that NGC 1277 has accreted very little mass (if any) over its lifetime in comparison with other galaxies of similar stellar mass.
Hence we conclude that NGC 1277 provides a nearby benchmark for the detailed study of the properties of massive galaxies which remain unevolved since . High-resolution imaging of the cluster systems of more relic galaxies will allow for the reconstruction of their mass accretion histories.
References
References and Notes
- 1. Khochfar, S., & Silk, J. A Simple Model for the Size Evolution of Elliptical Galaxies. ApJ, 648, L21-24 (2006)
- 2. Oser, L., Naab, T., Ostriker, J. P. & Johansson, P. H. The Cosmological Size and Velocity Dispersion Evolution of Massive Early-type Galaxies. ApJ, 744, 63-71 (2012)
- 3. Ceverino, D., Dekel, A., Tweed, D., & Primack, J. Early formation of massive, compact, spheroidal galaxies with classical profiles by violent disc instability or mergers. MNRAS, 447, 3291-3310 (2015)
- 4. van Dokkum, P. G., Whitaker, K. E., Brammer, G., et al. The growth of massive galaxies since z=2. ApJ, 709, 1018-1041 (2010)
- 5. Searle, L., & Zinn, R. Compositions of halo clusters and the formation of the galactic halo. ApJ, 225, 357-379 (1978)
- 6. Côté, P., Marzke, R. O., & West, M. J. The Formation of Giant Elliptical Galaxies and Their Globular Cluster Systems. ApJ, 501, 554-570 (1998)
- 7. Beasley, M. A., Baugh, C. M., Forbes, D. A., Sharples, R. M., & Frenk, C. S. On the formation of globular cluster systems in a hierarchical Universe. MNRAS, 333, 383-399
- 8. Tonini, C. The Metallicity Bimodality of Globular Cluster Systems: A Test of Galaxy Assembly and of the Evolution of the Galaxy Mass-Metallicity Relation. ApJ, 762, 39-49 (2013)
- 9. Leaman, R., VandenBerg, D. A., & Mendel, J. T. The bifurcated age-metallicity relation of Milky Way globular clusters and its implications for the accretion history of the galaxy. MNRAS, 436, 122-135 (2013)
- 10. Kruijssen, J. M. D. Globular clusters as the relics of regular star formation in normal high-redshift galaxies. MNRAS, 454, 1658-1686 (2015)
- 11. Peng, E. W., Jordán, A., Côté, P., et al. The ACS Virgo Cluster Survey. IX. The Color Distributions of Globular Cluster Systems in Early-Type Galaxies. ApJ, 639, 95-119 (2006)
- 12. Brodie, J. P., & Strader, J. Extragalactic Globular Clusters and Galaxy Formation. ARA&A, 44, 193-267 (2006)
- 13. Damjanov, I., McCarthy, P. J., Abraham, R. G., et al. Red Nuggets at z 1.5: Compact Passive Galaxies and the Formation of the Kormendy Relation ApJ, 695, 101-115 (2009)
- 14. van den Bosch, R. C. E., Gebhardt, K., Gültekin, K., et al. An over-massive black hole in the compact lenticular galaxy NGC 1277. Nature, 491, 729-731 (2012)
- 15. Trujillo, I., Ferré-Mateu, A., Balcells, M., Vazdekis, A., & Sánchez-Blázquez, P. NGC 1277: A Massive Compact Relic Galaxy in the Nearby Universe. ApJ, 780, L20-25 (2014)
- 16. Martín-Navarro, I., La Barbera, F., Vazdekis, A., et al. The initial mass function of a massive relic galaxy. MNRAS, 451, 1081-1089 (2015)
- 17. Yıldırım, A., van den Bosch, R. C. E., van de Ven, G., et al. The structural and dynamical properties of compact elliptical galaxies. MNRAS, 468, 4216-4245 (2017)
- 18. Hargis, J. R., & Rhode, K. L. Globular Cluster Systems and their Host Galaxies: Comparison of Spatial Distributions and Colors. ApJ, 796, 62-87 (2014)
- 19. Blakeslee, J. P., Cho, H., Peng, E. W., et al. Optical and Infrared Photometry of Globular Clusters in NGC 1399: Evidence for Color-Metallicity Nonlinearity. ApJ, 746, 88-102 (2012)
- 20. Yoon, S.-J., Lee, S.-Y., Blakeslee, J. P., et al. Nonlinear Color-Metallicity Relations of Globular Clusters. III. On the Discrepancy in Metallicity between Globular Cluster Systems and Their Parent Elliptical Galaxies, ApJ, 743, 150-168 (2011)
- 21. Chies-Santos, A. L., Larsen, S. S., Cantiello, M., et al. An optical/NIR survey of globular clusters in early-type galaxies. III. On the colour bimodality of globular cluster systems. A&A, 539, 54-66 (2012)
- 22. Read, J. I., Wilkinson, M. I., Evans, N. W., Gilmore, G., & Kleyna, J. T. The tidal stripping of satellites. MNRAS, 366, 429-437 (2006)
- 23. Szomoru, D., Franx, M., & van Dokkum, P. G. Sizes and Surface Brightness Profiles of Quiescent Galaxies at z 2. ApJ, 749, 121-130 (2012)
- 24. Yıldırım, A., van den Bosch, R. C. E., van de Ven, G., et al. MRK 1216 and NGC 1277 - an orbit-based dynamical analysis of compact, high-velocity dispersion galaxies. MNRAS, 452, 1792-1816 (2015)
- 25. Toft, S., Zabl, J., Richard, J., et al. A massive, dead disk galaxy in the early Universe. Nature, 546, 510-513 (2017)
- 26. Wellons, S., Torrey, P., Ma, C.-P., et al. The diverse evolutionary paths of simulated high-z massive, compact galaxies to z = 0. MNRAS, 456, 1030-1048 (2016)
- 27. Furlong, M., Bower, R. G., Crain, R. A., et al. Size evolution of normal and compact galaxies in the EAGLE simulation. MNRAS, 465, 722-738 (2017)
Acknowledgements
We thank Claudio dalla Vecchia, Jorge Sanchez Almeida, Chris Brook, Sarah Wellons, Morgan Fouesneau, Alejandro Vazdekis,
Bililign Dullo, Justin Read and Glenn van de Ven for useful discussions and Javier Roman and Alejandro Serrano Borlaf for
assistance with image alignment.
M.A.B. and I.T. acknowledge support from grant AYA2016-77237-C3-1-P from the Spanish Ministry of Economy and
Competitiveness (MINECO).
R.L. acknowledges funding from the Natural Sciences and Engineering Research Council of Canada PDF award.
This research has made use of the NASA/IPAC Extragalactic Database (NED) which is operated by the Jet Propulsion
Laboratory, California Institute of Technology, under contract with the National Aeronautics and Space Administration.
Based on observations made with the NASA/ESA Hubble Space Telescope, which is operated by the Association of
Universities for Research in Astronomy,
Inc., under NASA contract NAS 5-26555. These observations are associated with program GO-14215.
Support for this work was provided by NASA through grant HST-GO-14215 from the Space Telescope Science Institute,
operated by AURA, Inc. under NASA contract NAS 5-26555 This research has made use of NASA’s Astrophysics Data System.
This work made extensive use of Python and Scipy.
Author contributions
M.A.B. led the data processing and analysis, contributed to the interpretation and HST proposal preparation
and produced Figs 1–3, ED Figs 2–6.
I.T. contributed to the analysis and the interpretation, produced E.D Fig. 1 and lead the HST proposal preparation.
R.L. generated and analysed the analytic merger models, produced Fig. 4, E.D. Figs 7–8, contributed to the analysis,
interpretation and HST proposal preparation. M.M. contributed to the analysis, the interpretation and HST proposal preparation.
All authors contributed to the overall design of this project.
Author information
The authors declare no competing financial interests. Correspondence and requests for materials should be addressed to M.A.B. (beasley@iac.es)
Methods
HST/ACS Photometry
We obtained HST/ACS imaging of NGC 1277 in the F475W () and F850LP () (2 orbits; GO: 14215; PI: Trujillo)(E.D. Fig. 1). The total exposure time was: 2280s (F475W) and 2432s (F850LP). We adopt a standard cosmological model with = 70 km s-1 Mpc-1, = 0.3 and = 0.7. The redshift assumed here for NGC 1277, z = 0.0169, corresponds to a galaxy distance of 73.3 Mpc (34.33) and a spatial scale of 344 pc/arcsec.
The HST data were pipeline-reduced including correction for charge-transfer efficiency. We calculated zeropoints for the AB magnitude system using the file header information. Aperture and PSF photometry was performed on the ACS imaging using source extractor (SE; (?)) and the SE add-on psfex (?). Our photometry was corrected for foreground extinction using line of sight reddening estimates (?). SE was run in dual image mode using unsharp masks as detection images with photometry performed on the original images. We selected matched sources in the and filters. Aperture magnitudes were measured using a range of aperture radii from 3 to 50 pixels. We applied aperture corrections to the 3-pixel aperture magnitudes by correcting to 10-pixel (0.5 arcsec) apertures based on bright, isolated stars, and then correcting to infinity using the corrections tabulated in (?). For artificial point-source tests, we used psfex to construct PSFs based on bright, isolated stars across the ACS field.
Completeness tests
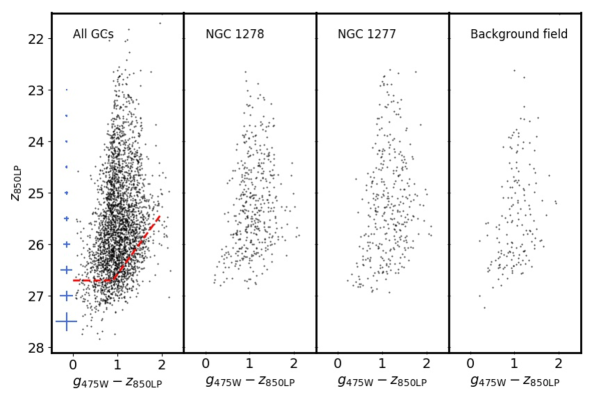
Completeness tests were performed by injecting artificial point-sources into the images (using the psfex PSFs) and determining the recovery fraction as a function of magnitude with SE. In regions arcsec from bright galaxies we are 100% complete to mag, mag with typical colour uncertainties of mag. We take this as a conservative photometric limiting magnitude. However, the completeness varies as a function of position and therefore we also calculated photometric completeness by repeating our tests as a function of position and magnitude across the field. In the very central regions (1.5 arcsec; 0.5 kpc) of NGC 1277 and neighbouring NGC 1278 we recover few clusters due to the high surface brightness of the galaxies. Photometric errors were characterised by measuring the difference between the input and output magnitudes of 50,000 artificial point sources placed randomly across the images. To separate point sources (GC candidates) from extended sources we obtained the SE output FLUX_RADIUS as a function of magnitude for our artificial point sources. All real sources identified within the region defined by the artificial sources were regarded as cluster candidates. In total, to 27.3 mag, we detect 2286 objects in the magnitude range consistent with being clusters. Colour-magnitude diagrams (CMDs) for all the cluster candidates, and cluster candidates around NGC 1278, NGC 1277 and an example background field are shown in E.D. Fig. 2.
Characterising the cluster system colour distributions
The spatial density distribution of candidate clusters (Fig. 1) was constructed directly from the photometry, after masking a small region (3 arcsecond radius) centred on an uncatalogued dwarf located arcseconds to the west of NGC 1277 (RA: 03:19:50.1, Dec: +41:34:22.10). A kernel density estimate map was constructed using the python SciPy routine gaussian_kde with gaussian kernel determined by “Scott’s rule” (?). As expected, the globular clusters aggregate around known galaxies (Fig. 1). However, taking a colour cut at (, the approximate separation between the red and blue peaks for a galaxy the mass of NGC 1277 in (?), NGC 1277 seems to “drop out” of the blue cluster density map. This contrasts with NGC 1278 that has both red and blue clusters clustered about the galaxy.
To create the colour distribution of NGC 1277 (Fig. 2), we were required to deal with interloping clusters from the neighbouring NGC 1278 and also contributions from intra-cluster clusters. We constructed a “master background” by selecting five regions located at a distance from NGC 1278 equal to the separation between NGC 1277 and NGC 1278, and sufficiently distant from NGC 1277 so as not to overlap with its cluster system (which has extent kpc; E.D. Fig. 3). The colour distribution of NGC 1277 clusters was built by selecting all cluster candidates within 11 kpc ( galaxy ) and subtracting off the master background normalised to the area of that covered by the cluster system of NGC 1277. This process also removes intra-cluster clusters from the cluster system of NGC 1277. The colour distribution of this master background is shown in E.D. Fig. 4. The composite cluster system in Fig. 2 was constructed by selecting galaxies from (?) that bracket the stellar mass of NGC 1277, for a mean stellar mass, M⊙ with dispersion M⊙. To compare with NGC 1277, we took a magnitude cut in the survey data at (Virgo cluster distance modulus 31.01), which corresponds to our photometric depth.
To explore the sub-populations in the colour distributions, we ran a gaussian mixture modelling code gmm (?) on the binned colour distributions. For the visibly bimodal survey composite colour distribution, in the heteroscedastic (different variances between populations) case we obtain means of ( and with gaussian full-width half-maxima (FWHM) of and . 101 clusters are associated with the blue peak and 110 clusters are placed in the red peak. A unimodal distribution is rejected at high confidence (). Similar results were obtained in the homoscedastic case.
For NGC 1277, a unimodal distribution cannot be rejected as the null hypothesis has confidence. Notwithstanding the possibility of unimodality, in the homoscedastic case for two populations, we obtain means of ( and with FWHM of . 21 clusters are placed in the blue peak and 99 clusters are placed in the red peak (Fig. 2). We define a blue fraction, .
We consider two sources of uncertainty for . The uncertainty returned from gmm on the number of blue and red clusters we regard as our systematic uncertainty. In addition, a random uncertainty on comes from our background subtraction. In order quantify the true value of and this uncertainty, we performed 1,000 Monte Carlo simulations where we randomly selected clusters from our background regions (until the observed background level was reached), and varied the radial apertures of the background and NGC 1277 selection regions by 3 kpc ( arcseconds). From this we built new colour distributions and ran gmm on these colour distributions in order to obtain (E.D. Fig. 5). In the homoscedastic case, we obtain (systematic) (random), for the heteroscedastic case (systematic) (random). We conservatively take this latter value as the true blue fraction and its associated uncertainties. From the Monte Carlo simulations, we find (systematic) (random). We consider these are upper limits since the unimodal hypothesis cannot be rejected.
As a sanity check, we compared the colour distributions of NGC 1277 with NGC 1278 (E.D. Fig 4). We remove contributions from intra-cluster clusters to the colour distribution of NGC 1278 by selecting clusters in a region away from bright galaxies (centred on RA:03:19:57.0, Dec: +41:35:30.0) over an area normalised to that of our cluster selection region. NGC 1278 shows a prominent blue peak, and an evident though less prominent red peak. gmm (heteroscedastic case) locates peaks at ( and . These solutions are in excellent agreement with expectations (?).
Surface density profiles of the clusters
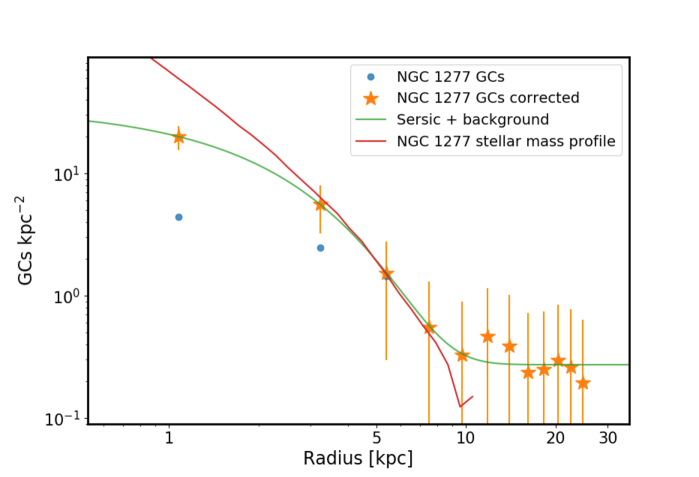
The surface density profile of clusters (E.D. Fig. 3) was constructed by counting GCs in semi-circular annuli and dividing by the area of each semi-annulus. We only counted clusters in the northern half of the galaxy – bisected by the galaxy major axis – to minimise contamination from the cluster system of NGC 1278. The inner two radial bins have been corrected based on our completeness tests. The clusters closely follow the galaxy light (?). This is a characteristic property of red clusters in massive galaxies (?). In contrast, blue clusters generally have spatial distributions that are more extended than the galaxy stars (?) (?). To define the radial extent of the system, and locate the background level, we fit the data with a modified Sérsic function (?):
| (1) |
with being the surface density of clusters at radius , is the Sérsic index and is the background value. is linked to as .
A Sérsic fit ( clusters kpc-2, kpc, , bkg = clusters kpc-2)
to the surface density profile of the clusters (E.D. Fig. 3), and visual inspection, indicates that we reach
the background level at kpc from the centre of NGC 1277. We consider this the full radial extent of the
NGC 1277 cluster system.
GC luminosity functions
We constructed cluster luminosity functions for the NGC 1277 clusters in order
to obtain an independent distance estimate to the galaxy using the turn over of the cluster
luminosity function as a standard candle
(?), and also to calculate the total size of the cluster system.
Again, we only selected from the northern half of the galaxy in
order to minimise interlopers from NGC 1278.
We binned the and
magnitudes of the clusters as a function of magnitude (0.5 mag bins) and
ran a version of the maximum likelihood code of (?) which fits for the mean (),
the full-width half-maximum () and normalisation of the distribution.
The code takes into full account the background, incompleteness and photometric errors.
In () we obtain = mag ( mag) and
= () respectively. Assuming “universal” absolute magnitudes for the turn-over of the
luminosity function of mag ( mag) (?), we obtain distance moduli
of (). These values are in excellent agreement with
our adopted distance to NGC 1277.
Total cluster population of NGC 1277
We counted the total number of clusters brighter than the cluster luminosity function turnover
( mag in ) that lie within 11 kpc of the galaxy centre within the northern half of NGC 1277.
In so doing, we detect clusters to our photometric limit, where the uncertainties
come from the uncertainty of mag in the peak position of the luminosity function.
From this number we then subtracted the expected contribution from NGC 1278 clusters ( clusters).
Correcting for radial incompleteness, this number becomes
clusters.
We then doubled the total number of clusters to account for the undetected faint half of the cluster
luminosity function, and doubled it again since we constructed the surface density
profile in the northern half of the galaxy.
We arrive at a total cluster population clusters. For (NED),
this gives a specific frequency, . This value is consistent with
galaxies in the stellar mass range of NGC 1277, which typically have (?).
The blue tilt
The “blue-tilt” manifests as a colour-magnitude relation in the blue clusters such that the brightest blue clusters become redder with increasing luminosity (?) (?) (?). This can make the colour distributions for the brightest clusters look unimodal. We investigated this issue by making colour distributions from the median bin values of our Monte Carlo simulations for the NGC 1277 clusters binned by magnitude (E.D. Fig. 6). The mean colours of all three bins are very similar and are predominantly red with (), () and (). This behaviour is not expected if a blue tilt were driving the observed colour distributions. The majority of the clusters with are consistent with the background residuals. However, a few of the brightest clusters (8) are above the background. These “blue” clusters constitute a small fraction of the overall GC population.
The environments of relic galaxies
NGC 1277 lies 3.8 arcminutes ( kpc) in projection to the North of the central massive galaxy NGC 1275 in the Perseus cluster of galaxies. Should we be surprised to find a relic galaxy in such a dense environment?
Observational studies that have looked specifically at the preferred environments of massive compact galaxies in the nearby universe find that the fraction of present day compact, quiescent galaxies with masses above M⊙ that lie in low density environments is % (?). The corresponding fraction in nearby galaxy clusters is % (?). Similar dependencies on environmental density have been obtained by other studies based on different samples (?) (?). Of the 16 best-studied nearby massive compact galaxies (including NGC 1277), 7 lie in clusters, 4 in groups and 5 are in isolated systems (?).
On the theoretical side, (?) used DM only simulations to explore the clustering properties of massive compact galaxies, finding that the fraction of massive compact galaxies is times larger in the most massive structures than in low mass DM haloes. Similarly, (?) used semi-analytic models to explore the environments of compact massive galaxies and found that they represent % of the total galaxy population, but represent % of the galaxy population in clusters. In addition, (?) showed that compact galaxies preferentially lie in the centres of clusters ( virial radii – corresponding to kpc in Perseus) whereas non-compact galaxies of the same mass have mean clustercentric radii of virial radii. (?) explored the evolution of massive compact systems at in cosmological, hydrodynamical simulations. Of their sample of 35 galaxies, % remained sufficiently undisturbed as to be defined as relics at . Of these relics, % survive as satellites in galaxy clusters.
In summary, although massive, compact “relic” galaxies are rare in the nearby Universe (with space densities Mpc-3) (?) (?), they are expected to be preferentially found in the most massive structures, such as the Perseus cluster of galaxies.
Accretion models for cluster formation
To get a quantitative understanding of the link between cluster colour distributions and a galaxy’s accretion history, we constructed a library of analytic merger histories for NGC 1277. We ran model realizations of NGC 1277 where we reconstruct its total present day stellar mass by assuming it had accreted some fraction of its stellar mass () between . In order to test rare, or non-cosmological merger histories, for each realisation we draw satellite galaxies from a subhalo dark matter mass function with a randomly selected slope (). These satellites are stochastically assigned stellar mass via empirical abundance matching relations (?) and their stellar mass added to the in-situ stellar mass of NGC 1277 () until the observed total present day stellar mass of NGC 1277 () is reached for that merger history realization. This necessitates a dynamic subhalo mass-function cutoff, in that the maximum accreted subhalo at any point cannot be more than the total accreted mass for that trial, and must be less than the in-situ mass. This ensures a working definition of the primary being most massive, and importantly, preserves an accretion fraction of and total mass of at the end of each trial.
The stellar mass of each subhalo sets its metallicity (?) (?) (and the metallicity of the clusters which are accreted with it), and the satellite’s dark matter mass provides the specific frequency of clusters for that satellite (?) (?) (importantly with stochastic sampling of the scatter in all the relations). The same relations are used to construct the cluster population of the in-situ component of NGC 1277 in every realisation. Finally the cluster metallicities are converted to colours (?).
This exercise is qualitatively similar to that employed by (?) with the added benefit here that we allow for a flexible slope of the sub halo mass function, rather than constraining it based on average accretion histories in CDM simulations. This allows us to explore how cluster colour distributions and galaxy stellar mass could be assembled in potentially rare scenarios with either very low or high numbers of mergers or consecutive extreme mass ratio mergers.
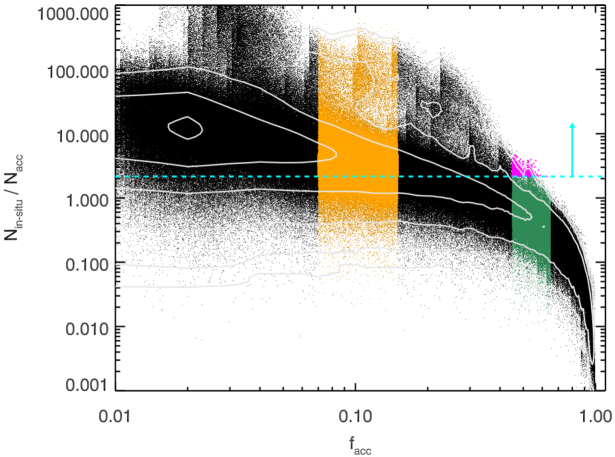
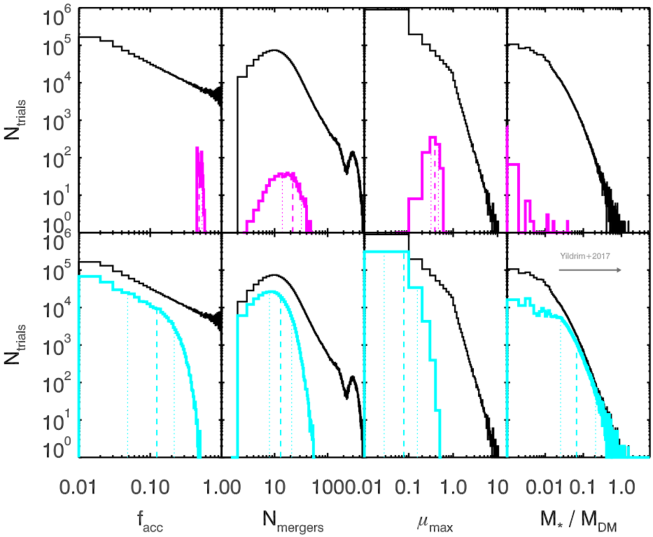
While simple, these models recover the ensemble properties of observed cluster colour and number distributions for galaxies of the mass of NGC 1277. E.D. Fig. 7 shows the accreted fraction of each realization of NGC 1277 (with each dot representing one possible merger history which repoduces the total mass of NGC 1277) versus the number of in-situ to accreted (red to blue) clusters for NGC 1277 in that realization. Note that we have conservatively used the minimum value allowed within the error bars, i.e. 2.17 rather than The observed cluster colour ratio of NGC 1277 clusters is characteristic of galaxies which have undergone merger histories resulting in the host accreting of the present day stellar mass. In comparison, galaxies of comparable mass to NGC 1277 in the ACSVCS sample, show observed colour distributions () typical of having accreted of their stellar mass. A very small percentage () of these high models can produce cluster colour ratios similar to NGC 1277. However, Fig. 4. and E.D. Fig. 8. show that these successful high assembly histories tend to overpredict the total number of clusters per unit mass (i.e., ) and tend to result in systems with DM masses , which is ruled out for NGC 1277 by dynamical modelling (?) (?).
E.D. Fig. 8. summarizes that the typical merger histories in our models which successfully reproduce the and colour distribution of NGC 1277 tend to: have only accreted of their stellar mass, had at most a 1:10 mass ratio merger event, and reside in under-massive DM halos () when compared to normal galaxies of the same stellar mass as NGC 1277. These models support the idea that NGC 1277 has not accreted significant amounts of dark matter rich subhalos leaving it deficient both in DM mass and in blue, accreted clusters.
Code availability
The photometry software Source Extractor and PSFex are publicly available at https://www.astromatic.net/. The mixture modelling code GMM is publicly available at http://www-personal.umich.edu/ ognedin/gmm/. A version of the GCLF fitting code is available upon request. The code used for the modelling of the accretion histories of NGC 1277 will be made available in a forthcoming publication.
Data availability
The HST data used was obtained under GO-14215 (PI: Trujillo) and GO-10546 (PI: Fabian) and is publicly available at https://archive.stsci.edu/. Data products are available upon request.
Extended Data
References
References and Notes
- 1. Bertin, E., & Arnout, S. SExtractor: Software for source extraction, aaps, 117, 393-404 (1996)
- 2. Bertin, E. Automated Morphometry with SExtractor and PSFEx, Astronomical Data Analysis Software and Systems XX, 442, 435-438 (2011)
- 3. Schlafly, E. F., & Finkbeiner, D. P. Measuring Reddening with Sloan Digital Sky Survey Stellar Spectra and Recalibrating SFD. ApJ, 737, 103-115 (2011)
- 4. Bohlin, R. C. Perfecting the Photometric Calibration of the ACS CCD Cameras. AJ, 152, 60-76 (2016)
- 5. D.W. Scott. Multivariate Density Estimation: Theory, Practice, and Visualization. John Wiley & Sons, New York, Chichester, 1-336 (1992).
- 6. Muratov, A. L., & Gnedin, O. Y. Modeling the Metallicity Distribution of Globular Clusters. ApJ, 718, 1266-1288 (2010)
- 7. Pota, V., Forbes, D. A., Romanowsky, A. J., et al. The SLUGGS Survey: kinematics for over 2500 globular clusters in 12 early-type galaxies. MNRAS, 428, 389-420 (2013)
- 8. Sersic, J. L. Atlas de galaxias australes. Cordoba, Argentina: Observatorio Astronomico, pp. 1-150 (1968)
- 9. Ferrarese,, Laura, Ford, H. C., Huchra, J., et al. A Database of Cepheid Distance Moduli and Tip of the Red Giant Branch, Globular Cluster Luminosity Function, Planetary Nebula Luminosity Function, and Surface Brightness Fluctuation Data Useful for Distance Determinations. ApJS, 128, 431-459 (2000)
- 10. Secker, J., & Harris, W. E. A maximum likelihood analysis of globular cluster luminosity distributions in the Virgo ellipticals. AJ, 105, 1358-1368 (1993)
- 11. Jordán, A., McLaughlin, D. E., Côté, P., et al. The ACS Virgo Cluster Survey. XII. The Luminosity Function of Globular Clusters in Early-Type Galaxies. ApJS, 171, 101-145 (2007)
- 12. Peng, E. W., Jordán, A., Côté, P., et al. The ACS Virgo Cluster Survey. XV. The Formation Efficiencies of Globular Clusters in Early-Type Galaxies: The Effects of Mass and Environment. ApJ, 681, 197-224 (2008)
- 13. Harris, W. E., Whitmore, B. C., Karakla, D., et al. Globular Cluster Systems in Brightest Cluster Galaxies: Bimodal Metallicity Distributions and the Nature of the High-Luminosity Clusters. ApJ, 636, 90-114 (2006)
- 14. Strader, J., Brodie, J. P., Spitler, L., & Beasley, M. A. Globular Clusters in Virgo Ellipticals: Unexpected Results for Giants and Dwarfs from Advanced Camera for Surveys Imaging. AJ, 132, 2333-2345 (2006)
- 15. Mieske, S., Jordán, A., Côté, P., et al. The ACS Fornax Cluster Survey. IX. The Color-Magnitude Relation of Globular Cluster Systems. ApJ, 710, 1672-1682 (2006)
- 16. Poggianti, B. M., Calvi, R., Bindoni, D., et al. Superdense Galaxies and the Mass-Size Relation at Low Redshift. ApJ, 762, 77-83 (2013)
- 17. Valentinuzzi, T., Fritz, J., Poggianti, B. M., et al. Superdense Massive Galaxies in Wings Local Clusters. ApJ, 712, 226-237 (2010)
- 18. Peralta de Arriba, L., Quilis, V., Trujillo, I., Cebrián, M., & Balcells, M. Massive relic galaxies prefer dense environments. MNRAS, 461, 156-163 (2016)
- 19. Damjanov, I., Zahid, H. J., Geller, M. J., & Hwang, H. S. The Environment of Massive Quiescent Compact Galaxies at in the COSMOS Field. ApJ, 815, 104-115 (2015)
- 20. Stringer, M., Trujillo, I., Dalla Vecchia, C., & Martinez-Valpuesta, I. A cosmological context for compact massive galaxies. MNRAS, 449, 2396-2404 (2015)
- 21. Trujillo, I., Cenarro, A. J., de Lorenzo-Cáceres, A., et al. Superdense Massive Galaxies in the Nearby Universe. ApJ, 692, L118-122 (2009)
- 22. Taylor, E. N., Franx, M., Glazebrook, K., et al. On the Dearth of Compact, Massive, Red Sequence Galaxies in the Local Universe ApJ, 720, 723-471 (2010)
- 23. de Vaucouleurs, G., & Olson, D. W. A comparison of distance scales for early-type galaxies. ApJS, 56, 91-104 (1984)
- 24. Kirby, E. N., Cohen, J. G., Guhathakurta, P., et al. The Universal Stellar Mass-Stellar Metallicity Relation for Dwarf Galaxies. ApJ, 779, 102-122 (2013)
- 25. Georgiev, I. Y., Puzia, T. H., Goudfrooij, P., & Hilker, M. Globular cluster systems in nearby dwarf galaxies - III. Formation efficiencies of old globular clusters. MNRAS, 406, 1967-1984 (2010)
- 26. Leauthaud, A., Tinker, J., Bundy, K., et al. New Constraints on the Evolution of the Stellar-to-dark Matter Connection: A Combined Analysis of Galaxy-Galaxy Lensing, Clustering, and Stellar Mass Functions from z = 0.2 to z =1. ApJ, 744, 159-186 (2012)