Effect of network clustering on mutually cooperative coinfections
Abstract
The spread of an infectious disease can be promoted by previous infections with other pathogens. This cooperative effect can give rise to violent outbreaks, reflecting the presence of an abrupt epidemic transition. As for other diffusive dynamics, the topology of the interaction pattern of the host population plays a crucial role. It was conjectured that a discontinuous transition arises when there are relatively few short loops and many long loops in the contact network. Here we focus on the role of local clustering in determining the nature of the transition. We consider two mutually cooperative pathogens diffusing in the same population: an individual already infected with one disease has an increased probability of getting infected by the other. We look at how a disease obeying the susceptible–infected–removed dynamics spreads on contact networks with tunable clustering. Using numerical simulations we show that for large cooperativity the epidemic transition is always abrupt, with the discontinuity decreasing as clustering is increased. For large clustering strong finite size effects are present and the discontinuous nature of the transition is manifest only in large networks. We also investigate the problem of influential spreaders for cooperative infections, revealing that both cooperativity and clustering strongly enhance the dependence of the spreading influence on the degree of the initial seed.
I Introduction
The modelling of epidemic dynamics is of paramount importance in the effort to predict when, where, and how far an infectious disease will spread Pastor-Satorras et al. (2015); Kiss et al. (2017). The topological structure of the social contact network of the host population turns out to play a key role in determining the patterns of disease transmission. While most studies have focused on the dynamics of a single disease, recently there has been a growing interest in understanding how concurrent epidemics (coinfections) interact with each other, when either multiple pathogens or multiple strains of the same disease simultaneously propagate in the same population.
The interaction among pathogens can have either antagonistic or synergistic effects. The main mechanism through which two or more pathogens spreading in the same population compete is cross–immunity: An individual infected with one pathogen becomes partially or fully immune to infection by the others, thus reducing the pool of susceptible hosts for secondary infections. The competition between antagonistic or mutually exclusive epidemics was studied in Newman (2005a); Funk and Jansen (2010); Marceau et al. (2011); Miller (2013). The opposite case is the simultaneous spreading of two or more cooperating pathogens: In this case, an individual already infected with one disease has increased chance of getting infected by another. A notable example is the 1918 “Spanish” flu pandemic caused by the H1N1 influenza A virus. The Spanish flu was the the deadliest pandemic in modern history, involving about one–third of the world’s population. Researchers recently realized that the reason why it was so deadly is that a considerable proportion of the infected individuals were coinfected by bacterial pneumonia Morens et al. (2008); Brundage and Shanks (2008). Another well–known example of synergistic effects in disease spreading is the case of HIV, which increases the host susceptibility to other pathogens, in particular to the hepatitis C virus (HCV) Sulkowski (2008).
In coinfections, positive feedback between multiple diseases can lead to sudden and major outbreaks: In 1918 the concurrence of Spanish flu and pneumonia killed tens of millions of people within months Taubenberger and Morens (2006). One important question in the study of interacting epidemics is therefore whether cooperation can change the nature of the epidemic transition from being continuous to being abrupt when external conditions vary, even slightly, as for a microscopic change in infectivity.
In Ref. Chen et al. (2013) a generalized susceptible–infected–removed (SIR) model (CGCG) was introduced to include mutual cooperative effects of co–infections: Two different diseases simultaneously spread in a population: having been infected with one disease gives an increased probability to be infected by the other. The amount of this increase is a proxy of the mutual cooperativity between the two diseases. The authors studied the model at mean–field level and observed that cooperative effects, depending of their strength, can cause a change of the epidemic transition from continuous to discontinuous. In Janssen and Stenull (2016) Janssen and Stenull showed that the CGCG model is equivalent, in mean–field, to the homogeneous limit of an extended general epidemic process (EGEP) and clarified the spinodal nature of the discontinuous transition observed.
In Ref. Cai et al. (2015); Grassberger et al. (2016) the CGCG model was simulated on lattices and random networks, and it was shown that the type of transition depends on the contact network topology. The authors concluded that a necessary condition for a discontinuous transition to occur, when starting from a doubly–infected node, is the relative paucity of short loops with respect to long ones. A discontinuous transition occurs if the two epidemics first evolve separately and then meet only after each of the independent clusters of singly–infected nodes has reached a large fraction of the population. At that point, cooperativity between the two pathogens enters into play, and both clusters rapidly become doubly–infected. A necessary condition then is that few short loops are present (otherwise the two pathogens immediately cooperate and the transition is continuous) and long loops exist (otherwise cooperativity has no effect and one sees only single infections). In agreement with this scenario discontinuous transitions are absent on trees (no long loops) and on 2–d lattices (many short loops), while they are observed on Erdös–Rényi (ER) networks, on 4–d lattices, and on 2–d lattices with sufficiently long–range contactsGrassberger et al. (2016). In Ref. Cui et al. (2017) we have studied the CGCG model on uncorrelated power–law networks and shown that in the scale–free case, i.e., topologies with diverging second moment of the degree distribution, the transition is always continuous, even for large cooperativity. On power–law networks with finite second moment of the degree distribution, the epidemic transition is instead continuous for low cooperativity, while it becomes discontinuous when cooperativity is sufficiently high. Strong size effects are present, so that the real nature of the transition is difficult to assess in finite systems. All the observed discontinuous transitions are of hybrid type Goltsev et al. (2006); Parisi and Rizzo (2008): at the transition the size of doubly–infected clusters in some realizations jumps discontinuously from zero to a finite value; however the fraction of realizations showing such non–zero clusters grows continuously from zero at the transition. (For universal mechanisms underlying hybrid transitions see Ref. Lee et al. (2017).)
A model for two cooperative infective pathogens not conferring immunity, analogous to the CGCG model, was recently introduced by Chen et al. Chen et al. (2017). It is based on the susceptible–infected–susceptible (SIS) epidemic model and features increased infectivity if the node susceptible to one pathogen is already infected with the other. By means of numerical simulations on lattices and homogeneous networks and of a mean–field approach Chen et al. have shown that in this case large cooperativity can give rise to a splitting of the epidemic transition in two distinct outbreak and eradication transitions, with associated phenomena of multistability and hysteresis. For other recent work about cooperating infections see Refs. Sanz et al. (2014); Hébert-Dufresne and Althouse (2015); Azimi-Tafreshi (2016).
Previous work has focused on relatively simple network structures, where the density of short loops decays to zero as the system size diverges. In many real–world topologies instead, in particular those of social origin, two neighbors of a given node are often mutually connected, and this property is also observable in very large networks. The clustering coefficient quantifies the abundance of short loops, by measuring how many of the connected triples form a triangle. According to the physical argument discussed above, one might hypothesize that increasing clustering could change the nature of the epidemic transition from discontinuous to continuous, even with strong cooperativity. In the first part of this paper we focus on the role of clustering in cooperative epidemics and test in detail this conjecture. We generate Poissonian networks with given tunable clustering using the algorithm introduced by Serrano and Boguñá Serrano and Boguñá (2005), and study, on the resulting topologies, the behavior of two cooperating epidemics diffusing according to the CGCG dynamics. A recent work Chung et al. (2014) has investigated the same issue, but considering different types of clustered topologies and of cooperative dynamics. We find that, in the limit of large networks, the epidemic transition is always abrupt and of hybrid nature: extensive clusters of nodes hit by both infections suddenly start to appear at some critical value of the infectivity, with a probability that grows from zero at the transition. The total fraction of nodes belonging to these extensive clusters remains finite but becomes smaller when increasing the clustering, so that for large clustering it is hard to assess the nature of the transition in small systems. Simulations on large networks, however, clearly show a discontinuous transition also for large clustering. Our results indicate that although the paucity of short loops is a necessary condition to observe the discontinuous epidemic transition, increasing the density of short loops just by tuning the clustering does not guarantee to change the nature of the transition to a continuous one.
In the second part of the paper we briefly discuss the problem of spreading influence for coinfections, i.e., how the probability that a macroscopic outbreak occurs depends on which node triggers the coinfection event. We find that large-degree nodes are much more influential than nodes with few connections than in the absence of cooperativity. This effect of degree on spreading influence is further increased when the underlying network is clustered.
II The Model for cooperative SIR dynamics
Compartmental models are in epidemiology the main mathematical framework for the study of disease spreading. In these kind of models the population is divided in “compartments” – in the simplest case susceptible to the infection (S), infected by the pathogen and able to transmit it (I), and recovered or removed (immune) (R) – that interact according to rules based upon phenomenological assumptions. Compartmental models branch in two large classes, depending on whether or not permanent immunity may occur. Infectious diseases where recovery confers immunity, such as measles, mumps and rubella are modelled by susceptible–infected–removed (SIR) Kermack and McKendrick (1927) type dynamics: infected individuals transmit the infection to each of their susceptible neighbors with some probability, while spontaneously recover with some other probability. In this case maintaining an endemic level of infection is impossible in a closed population due to the depletion of susceptible individuals as the epidemic spreads through the population. Other infections, such as the common cold and some sexually transmitted diseases, do not confer any long lasting immunity, and after recovery individuals become susceptible again. These epidemics are modelled by the susceptible–infected–susceptible (SIS) Pastor-Satorras et al. (2015) type of dynamics: the difference with SIR dynamics is that when infected individuals spontaneously recover they become again susceptible. In this paper we only deal with infections conferring permanent immunity, modeled by SIR dynamics.
In the classical SIR model in discrete time, at each time step each infected individual spontaneously decays with probability into the removed state, while transmitting the infection to each susceptible neighbor with probability . The cooperative SIR dynamics that we consider (CGCG model) is an extension of SIR to two circulating diseases, A and B as in Chen et al. (2013). The infection probability for one disease is increased if the individual already contracted the other disease (even if currently recovered): Individuals uninfected with either disease get infected (with either A or B) by any infective neighbor with probability , while a node that is currently infected or has been infected in the past by with one of the two diseases has a higher probability to get infected with the other disease by the neighbor. When recovering from one disease an individual becomes immune to it, but can still be infected with the other. We assume the same recovery probability for both diseases, therefore the model is totally symmetric with respect to A and B. Since each individual can be in one of three possible states (S, I, R) with respect to each of the two diseases (A, B) there are nine possible states for each individual, denoted as S, A, B, AB, a, b, aB, Ab and ab, where, for each disease, capital letters refer to the infected state, while lower–case letters refer to the removed state. States denoted by single letters (a, b, A, B) imply that the individual is still susceptible with respect to the other disease.
III Networks with tunable clustering
In order to perform a detailed analysis of the effects of the topology on the epidemic dynamics, we generate networks with tunable clustering to use as contact networks for the epidemics. To build such networks we use the algorithm introduced by Serrano and Boguñá in Ref. Serrano and Boguñá (2005). The Serrano–Boguñá algorithm is devised in the same philosophy of the classical configuration model to generate maximally random networks of fixed size with given degree distribution and given average clustering coefficient for each class of nodes of degree . Precisely, denotes the average clustering among all nodes with degree :
| (1) |
where is the number of nodes with degree , is the number of triangles node belongs to and the sum runs over all nodes with degree . The mean clustering coefficient is then derived by averaging the with the degree distribution as .
The algorithm is divided in three steps: (i) assigning a degree to each node and a number of triangles to each degree class according to the given distributions; (ii) closing triangles; (iii) closing the remaining free stubs as in the classical configuration model. More in detail, in the first step, to each vertex is assigned a degree according to by attaching to it of a certain number of stubs (half links). Also, to each class of vertices with degree is associated a number of triangles according to the given average clustering coefficient . In the second step, stubs are paired (and eventually unpaired) to form triangles according to specific rules until each degree class has the desired number of triangles. In this step a parameter determines the way stubs are chosen. This parameter ranges in the interval , and has the effect of tuning the level of assortativity in the network: The clustering of high degree nodes is limited by the presence of degree–correlations in the topology. As approaches , more assortative networks are produced, which can accommodate stronger local clustering for nodes with large . In the third step of the algorithm the remaining unpaired stubs are finally closed into links by applying the classical configuration model algorithm, i. e. connecting randomly selected pairs of free stubs, and suspending the restriction on the assigned triangle number. There are a number of caveats to be considered for the algorithm to work; for further details we refer to the original paper.
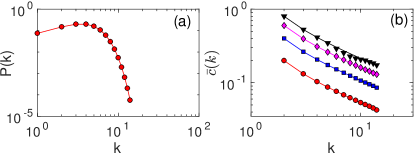
In Fig. 1(a) we show that the distributions characterizing the networks obtained as outcome of the Serrano–Boguñá algorithm closely reproduce the distributions given as input. In these examples the algorithm is started with a Poissonian degree distribution , where the number or nodes , and the average degree are fixed to , and , and with a clustering distribution of the form with fixed to and varying . The value of the parameter , that, as explained in Ref. Serrano and Boguñá (2005), tunes the assortativity, is fixed to . The parameter sets the overall clustering level of the network and is the key parameter in our analysis. A value of means that no clustering is imposed beyond the one naturally occurring for Poissonian networks. In what follows we use networks produced by the Serrano–Boguñá algorithm as contact patterns for the cooperative SIR dynamics. By tuning the parameter we investigate the effect of loops and clustering on the epidemic spreading. All other parameters are kept fixed at the values of Fig. 1.
IV The nature of the epidemic transition
We simulate the mutually cooperative SIR dynamics ruled by the CGCG Chen et al. (2013); Cai et al. (2015) model, as defined in Sec II, with two pathogens and . At each time step, each singly–infected node representing an individual infected with either or attempts to transmit the pathogen to each of its neighbors that are susceptible to it. The transmission is successful with probability if the neighbor is healthy (in the S state), and with probability if the neighbor has already been infected with the other pathogen, even if it has already recovered. After attempting the contagion, with probability the singly–infected node recovers from the disease and goes into the R state. In the limiting case the cooperative effect vanishes and the two pathogens spread independently from one another.
In a similar way, each node in the AB state, representing a doubly–infected individual, attempts to transmit both pathogens to each of its neighbors and succeeds in infecting healthy (S) nodes with just one disease with probability , and with both diseases simultaneously with probability . Singly–infected neighbors instead get doubly–infected with probability . The doubly–infected node that has attempted the contagion recovers from either disease shifting into a singly–infected state with probability , while it recovers from both diseases simultaneously, shifting into the ab state with probability . In all simulations, unless otherwise stated, we fix (for both pathogens) and , which is the maximum possible value of the cooperativity. Unless explicitly stated, we start the system with all individuals in the susceptible (S) state, except for one randomly chosen individual who is in the doubly–infected AB state.
For small values of only small outbreaks occur, reaching a finite number of individuals. As is increased above the epidemic transition another type of outbreak appears: large outbreaks of size proportional to . The probability to have a large outbreak grows continuously from zero at the transition. For this reason the fraction of doubly–recovered nodes in the final state averaged over all realizations is not useful for discriminating among a continuous and a hybrid transition, as it necessarily changes continuously. In order to discriminate we study the behavior of the average , computed only on large outbreaks. Clearly the distinction between large and small outbreaks is clear–cut only in the infinite size limit. We operatively define such realizations as those for which in the final state , where will be specified below. Therefore the order parameter for the transition is the average value , where the average is computed only over the fraction of realizations fulfilling the condition .
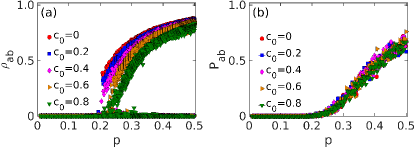
In Fig. 2 (left) we plot the final fraction of population in the doubly–recovered state () for each realization and in Fig. 2 (right) the probability that . When clustering is small, the figure shows a clear discontinuous change: at a critical value of some realizations with large start to appear. In these runs the two pathogens, starting from the same doubly–infected node, manage to separately infect large clusters prior to get in contact with each other. At some point, they meet along a large loop and this exposes large singly–infected portions of the population to the coinfection that diffuses fast given the large coinfectivity, leading to large final values of . When clustering is increased, the jump becomes smaller: the abundance of short loops makes it hard for the two epidemics to develop separated clusters. For very high clustering the height of the jump seems to go to zero, but the nature of the transition cannot be assessed by visual inspection: data are inconclusive at this system size.
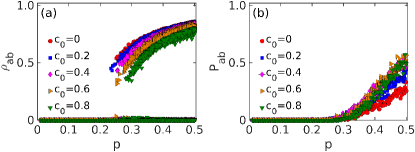
To better understand the interpretation in terms of loop structure we compare the above results with the case where the epidemic is initiated with two singly–infected nodes, chosen randomly, but constrained to be at a minimum distance from each other. In this case for coinfections to occur two large clusters of singly–infected nodes must necessarily develop first and then meet. In this case data show always a large discontinuity for and only a weak dependence on the clustering (see Fig. 3). As expected, the presence of short loops does not play any major role in this case, in agreement with the physical interpretation in terms of loop structure.
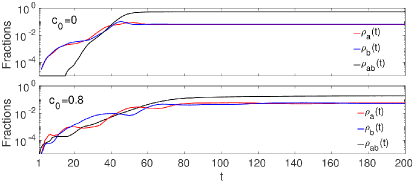
Starting the system with a single doubly-infected seed, we inspected the temporal evolution of the densities of infected nodes (Fig. 4) in two realizations leading to large epidemics, for a value of above and around the threshold, in a system of size . For no clustering (Fig. 4, top) there is an initial transient during which (the initial seed) while and rapidly grow, witnessing the formation of large singly-infected clusters. Around the two clusters meet over a long loop and rapidly coinfection takes over. For large clustering (; Fig. 4, bottom) the dynamics starts in a way similar to what one would expect in a continuous transition: A and B infected clusters are intertwined and immediately after being infected by one pathogen each node is also hit by the other. As expected according to the interpretation given in Refs. Cai et al. (2015); Grassberger et al. (2016); Cui et al. (2017), the abundance of short loops causes the two epidemics to meet frequently on the networks and hampers the independent development of single disease clusters. After a while, however, doubly infected nodes appear, and the evolution becomes more similar to the case indicating that a similar scenario, with merging singly-infected clusters, occurs, although on a smaller scale. Even by looking closely at the dynamics, the behavior of the system in the high clustering regime is not clear-cut, and to identify the nature of the transition a finite size analysis is needed.
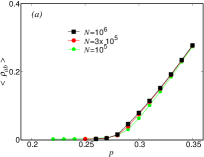
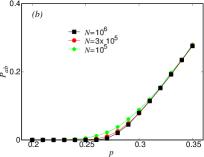
As observed in Ref. Cui et al. (2017) finite size–effects might be important and conceal the real nature of the transition: To analyze the effect of network size we simulate the cooperative SIR dynamics on networks of different sizes, for no clustering () and high clustering . For each value of the single disease infectivity parameter we simulate realizations of the process starting with a randomly chosen doubly–infected (AB) seed. For each realization we determine the final density of nodes in the ab state, and the probability that . After checking the results of for single realizations we fixed the threshold at , and checked that the results are unchanged when is halved. This ensures that the values are clustered around zero or around some finite value, and that a sensible gap exists between them. We then compute the average value restricted to values . Results are shown in Fig. 5. In both cases we observe a hybrid transition: The probability of reaching a finite value of undergoes a continuous transition, for ; on the other hand, the size of the doubly–recovered (ab) cluster in those realizations jumps discontinuously to a finite value at the transition. Large outbreaks can develop in finite systems also below threshold, however the probability that they occur vanishes as . The jump is smaller in the high clustering case, where the discontinuity is clearly shown only when large enough networks are considered [Fig. 5 (c)].
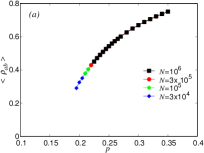
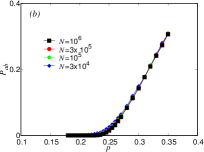
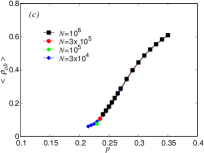
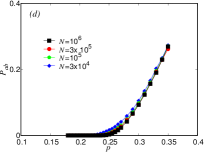
We conclude that the tendency toward a continuous transition observed in Fig. 2 for large cooperativity as grows, is a finite-size effect. No matter how strong the clustering the transition is discontinuous in the large size limit. The discontinuity arises from the coalescence of independently grown singly–infected clusters. If is below the threshold value for single epidemics such extensive singly–infected clusters cannot develop and coinfectivity does not play any role. Consistently with this physical interpretation, the value of marking the threshold for coinfections coincides with the threshold for single pathogen epidemics. This threshold slightly increases with the level of clustering .
For comparison, we repeat a similar analysis for the case of weak cooperativity () and large clustering (). In this case the transition remains continuous also in the large size limit, as shown in Fig. 6. For each system size and for each value of the results are averaged over realizations.
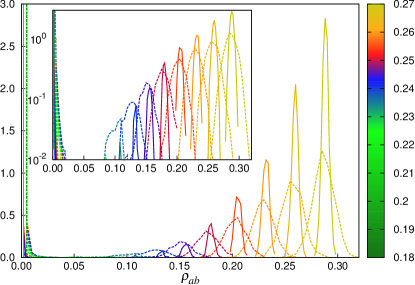
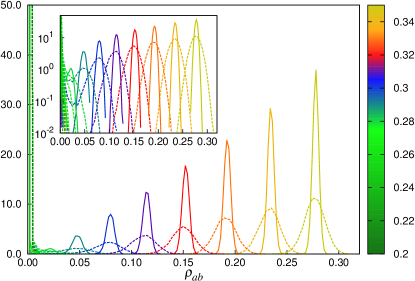
Further evidence on the nature of the transition is given by inspecting the distributions of at fixed . In the case of high infectivity, even when clustering is high the distribution shows a secondary peak around a finite value of that is suppressed when the system size grows when is below a threshold value around . Fig. 7, top panel, shows the distributions for the case and two system sizes, and , for realizations. Each peak corresponds to a value of starting with for the rightmost one and decreasing of at each curve. The position of the peaks does not depend on the system size, as also shown in Fig. 5, where the curves for different perfectly overlap. Fluctuations decrease with the system size and sharper peaks correspond to the larger systems. The same data are plotted in lin–log scale in the inset of the top panel of Fig. 7: above some critical value of (around ) the height of the peaks grows for larger ; for the peaks tend to disappear as is increased. This is the signature of a discontinuous transition. The bottom panel of Fig. 7 shows the same kind of plots, always for , but for small coinfectivity, . Each peak corresponds to a value of starting from the right with and decreasing of at each curve. In this case peaks corresponding to the larger system are never suppressed, consistently with the occurrence of a continuous transition.
In a recent work by Chung et al. Chung et al. (2014), a model similar to the CGCG, the EGEP, is found to have an hybrid transition for large cooperativity in clustered systems. Our results globally go along the same lines. However, for some particular values of the parameters determining the topology, in that work the transition remains continuous even for the highest possible cooperativity level, at odds with our results. This discrepancy may be due to differences in the epidemic dynamics, since, as pointed out in Ref. Janssen and Stenull (2016), the mapping of the CGCG model onto the EGEP model only holds within mean–field.
V Influential coinfection spreaders
In this Section, we investigate the problem of identifying influential spreaders for coinfections. For single spreading processes this issue has attracted a lot of interest in recent years Kitsak et al. (2010); Lu et al. (2016). The problem is the following. The values of , the average outbreak size, generally considered to study the phase-diagram, are obtained by averaging over many outbreaks, each starting in a randomly selected seed. However this quantity is likely to depend to some extent on the precise location where the infection is seeded. For example, it is reasonable to expect that nodes with many neighbors will typically originate larger outbreaks. Is it possible to predict the spreading influence of node , i.e., the average size of outbreaks generated by it? Is it possible at least to identify topological properties of individual nodes that are correlated with their spreading influence?
It is clear that degree is positively correlated with , but the detailed structure of the contact pattern makes in some cases centralities such as the -core index, betweenness or eigenvalue or other centralities, better predictors of the spreading influence Lu et al. (2016). The mapping of SIR dynamics to bond percolation Grassberger (1983); Newman (2005b); Karrer et al. (2014) allows, at the epidemic threshold , to identify the Non-Backtracking centrality Martin et al. (2014) as the exact solution (i.e. a centrality perfectly correlated with the spreading influence) on locally tree-like networks Radicchi and Castellano (2016). On the same type of topologies, the spreading influence of each individual node can be exactly calculated for any value of by message-passing techniques Min (2018).
For cooperating epidemics, the problem is slightly different. As the transition is discontinuous, the most interesting observable is the probability that seeding the double-infection in node will generate a macroscopic double-infection outbreak.
We have simulated the coinfection process with initial condition given by a doubly-infected seed in each node of the network, for a value of immediately above the epidemic transition. We have computed the fraction of times an outbreak of relative size larger than is produced and also the average size of these macroscopic outbreaks. We have then averaged the results over nodes with the same degree (see Fig. 8). In the absence of clustering the probability to give rise to a macroscopic outbreak is proportional to the square of the node degree. In the presence of clustering instead the probability is overall smaller, but its growth with is much faster. In both cases the size of the extensive coinfection is, with remarkable accuracy, independent from .
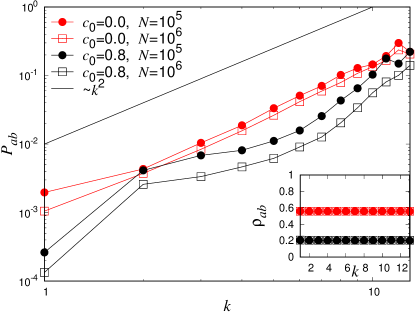
This behavior can be rationalized in the light of our understanding of the physical origin of large outbreaks for cooperating infections. Let us first consider unclustered topologies. For a large outbreak to occur one needs the separate development of two single epidemics along different directions. The size of each of them is on average proportional to the degree of the seed node. Hence the probability that they meet is proportional to . Once the two infections have met, the coinfection rapidly spreads throughout the network. This last part of the process clearly does not depend on the degree of the initial seed.
In the presence of local clustering it is much more difficult for the two single epidemics to evolve separately, because of the presence of triangles. This explains the reduction of with respect to the unclustered case. However, since the clustering coefficient strongly decreases with (see Fig. 1) the spreading influence of nodes grows fast with the number of neighbors. Also in this case the formation of the macroscopic outbreak after the two independent epidemics have met does not depend on local properties of the seed node, i.e. it is independent from .
VI Conclusions
In Ref. Cai et al. (2015) it was shown that the type of transition depends on the topology of the network. It was suggested that necessary conditions to observe a discontinuous transition when starting from a doubly–infected node are the paucity of short loops coupled with the existence of long loops. A discontinuous transition occurs if the two clusters of singly–infected nodes spread independently, and then meet, rapidly becoming doubly–infected due to large cooperativity. The authors concluded that this can happen if few short loops are present –to allow the growth of two independent single–infection clusters– and long loops exist –to allow the two clusters to meet. Based on this physical picture one can hypothesize that in topologies with many short loops the two diseases do not have the possibility to spread in independent regions; from the beginning they form a single doubly–infected cluster which, in a way similar to the single disease case, gives rise to a continuous transition as infectivity is increased.
We have analyzed the effect of local network clustering on the spreading of two concurrent cooperating diseases under SIR dynamics, i.e. infections conferring permanent immunity. A detailed analysis has been performed by means of numerical simulations on Poissonian contact networks with tunable clustering. Our simulations show that increasing the number of loops of length 3, i.e., the local clustering, does not produce this effect. The epidemic transition remains discontinuous, although the size of the jump is reduced when clustering is increased. The nature of the transition is evident only in large networks, while for small sizes it is blurred by fluctuations.
The observed behavior suggests the following refined physical picture, that builds upon the one proposed in Ref. Cai et al. (2015) and further clarifies the role of the network loop structure in determining the nature of the transition. We hypothesize that it is still possible to observe an abrupt transition when short loops abound, as long as a gap exists between short and long loops. The proposed scenario would explain the above finite size effects in high clustered networks as follows. In large systems with high clustering there are many loops of length 3, however longer loops but still smaller than the network diameter, that is of order , are scarce. Their number decays as . Although rare, single epidemics that manage to escape the structure of loops of length 3 can therefore grow independently before they meet. For small networks however, the loop structure is not so well separated in small and large loops for two reasons: on the one hand the diameter is smaller, on the other hand also loops of size smaller than become more abundant. In this case, single epidemics that do not meet along loops of length 3 have some probability to meet along loops of intermediate length. This makes the distribution of broader, and the discontinuous transition more difficult to identify. It would be interesting to investigate the role of the loop structure of the network beyond the clustering in cooperative coinfections.
Concerning spreading influence for coinfections, our results for unclustered networks nicely fit with the physical picture outlined above. The dependence of on the seed degree is perfectly consistent with the scenario of two single infections evolving separately and then meeting. Also the stronger growth with in the presence of clustering can be interpreted along the same lines, as the effect of the reduction of the local clustering coefficient with the degree of the seed. In both cases the effect of the degree on the spreading influence of a node is much stronger than for single epidemics. Hence it is even more crucial in this case to monitor and possibly immunize hubs in order to prevent extensive coinfection outbreaks in the system. It would be extremely interesting to attack these problems, analyzed here by means of numerical simulations, using message-passing techniques.
VII Acknowledgments
This work was supported by China Scholarship Council (CSC), grant number 201606075021.
References
- Pastor-Satorras et al. (2015) R. Pastor-Satorras, C. Castellano, P. Van Mieghem, and A. Vespignani, Rev. Mod. Phys. 87, 925 (2015).
- Kiss et al. (2017) I. Z. Kiss, J. C. Miller, and P. Simon, Mathematics of epidemics on networks: from exact to approximate models (Springer, 2017).
- Newman (2005a) M. E. J. Newman, Phys. Rev. Lett. 95, 108701 (2005a).
- Funk and Jansen (2010) S. Funk and V. A. A. Jansen, Phys. Rev. E 81, 036118 (2010).
- Marceau et al. (2011) V. Marceau, P.-A. Noël, L. Hébert-Dufresne, A. Allard, and L. J. Dubé, Phys. Rev. E 84, 026105 (2011).
- Miller (2013) J. C. Miller, Phys. Rev. E 87, 060801 (2013).
- Morens et al. (2008) D. M. Morens, J. K. Taubenberger, and A. S. Fauci, The Journal of Infectious Diseases 198, 962 (2008).
- Brundage and Shanks (2008) J. F. Brundage and G. Shanks, Emerg. Infect Dis. 14, 1193 (2008).
- Sulkowski (2008) M. S. Sulkowski, Journal of Hepatology 48, 353 (2008).
- Taubenberger and Morens (2006) J. K. Taubenberger and D. M. Morens, Emerging Infectious Diseases 12, 15 (2006).
- Chen et al. (2013) L. Chen, F. Ghanbarnejad, W. Cai, and P. Grassberger, EPL (Europhysics Letters) 104, 50001 (2013).
- Janssen and Stenull (2016) H.-K. Janssen and O. Stenull, EPL (Europhysics Letters) 113, 26005 (2016).
- Cai et al. (2015) W. Cai, L. Chen, F. Ghanbarnejad, and P. Grassberger, Nature physics 11, 936 (2015).
- Grassberger et al. (2016) P. Grassberger, L. Chen, F. Ghanbarnejad, and W. Cai, Phys. Rev. E 93, 042316 (2016).
- Cui et al. (2017) P.-B. Cui, F. Colaiori, and C. Castellano, Phys. Rev. E 96, 022301 (2017).
- Goltsev et al. (2006) A. V. Goltsev, S. N. Dorogovtsev, and J. F. F. Mendes, Phys. Rev. E 73, 056101 (2006).
- Parisi and Rizzo (2008) G. Parisi and T. Rizzo, Phys. Rev. E 78, 022101 (2008).
- Lee et al. (2017) D. Lee, W. Choi, J. Kertész, and B. Kahng, Scientific Reports 7, 5723 (2017).
- Chen et al. (2017) L. Chen, F. Ghanbarnejad, and D. Brockmann, New Journal of Physics 19, 103041 (2017).
- Sanz et al. (2014) J. Sanz, C.-Y. Xia, S. Meloni, and Y. Moreno, Phys. Rev. X 4, 041005 (2014).
- Hébert-Dufresne and Althouse (2015) L. Hébert-Dufresne and B. M. Althouse, Proceedings of the National Academy of Sciences 112, 10551 (2015).
- Azimi-Tafreshi (2016) N. Azimi-Tafreshi, Phys. Rev. E 93, 042303 (2016).
- Serrano and Boguñá (2005) M. Á. Serrano and M. Boguñá, Phys. Rev. E 72, 036133 (2005).
- Chung et al. (2014) K. Chung, Y. Baek, D. Kim, M. Ha, and H. Jeong, Phys. Rev. E 89, 052811 (2014).
- Kermack and McKendrick (1927) W. O. Kermack and A. G. McKendrick, Proc. R. Soc. Lond. A 115, 700 (1927).
- Kitsak et al. (2010) M. Kitsak, L. K. Gallos, S. Havlin, F. L iljeros, L. Muchnik, H. E. Stanley, and H. A. Makse, Nature Physics 6, 888 (2010).
- Lu et al. (2016) L. Lu, D. Chen, X.-L. Ren, Q.-M. Zhang, Y.-C. Zhang, and T. Zhou, Physics Reports 650, 1 (2016), vital nodes identification in complex networks.
- Grassberger (1983) P. Grassberger, Mathematical Biosciences 63, 157 (1983).
- Newman (2005b) M. E. J. Newman, “Random graphs as models of networks,” in Handbook of Graphs and Networks (Wiley-VCH Verlag GmbH & Co. KGaA, 2005) pp. 35–68.
- Karrer et al. (2014) B. Karrer, M. E. J. Newman, and L. Zdeborová, Phys. Rev. Lett. 113, 208702 (2014).
- Martin et al. (2014) T. Martin, X. Zhang, and M. E. J. Newman, Phys. Rev. E 90, 052808 (2014).
- Radicchi and Castellano (2016) F. Radicchi and C. Castellano, Phys. Rev. E 93, 062314 (2016).
- Min (2018) B. Min, The European Physical Journal B 91, 18 (2018).