Reaction rate theory for supramolecular kinetics: application to protein aggregation
Abstract
Probing the reaction mechanisms of supramolecular processes in soft- and biological matter, such as protein aggregation, is inherently challenging. These processes emerge from the simultaneous action of multiple molecular mechanisms, each of which is associated with the rearrangement of a large number of weak bonds, resulting in a complex free energy landscape with many kinetic barriers. Reaction rate measurements of supramolecular processes at different temperatures can offer unprecedented insights into the underlying molecular mechanisms and their thermodynamic properties. However, to be able to interpret such measurements in terms of the underlying microscopic mechanisms, a key challenge is to establish which properties of the complex free energy landscapes are probed by the reaction rate. Here, we present a reaction rate theory for supramolecular kinetics based on Kramers rate theory for diffusive reactions over multiple kinetic barriers, and apply the results to protein aggregation. Using this framework and Monte Carlo simulations, we show that reaction rates for protein aggregation are of the Arrhenius-Eyring type and that the associated activation energies probe only one relevant barrier along the respective free energy landscapes. We apply this advancement to interpret, both in experiments and in coarse-grained computer simulations, reaction rate measurements of amyloid aggregation kinetics in terms of the underlying molecular mechanisms and associated thermodynamic signatures. Our results establish a general platform for probing the mechanisms and energetics of supramolecular phenomena in soft- and biological matter using the framework of chemical kinetics.
keywords:
Energy landscape; Energy of activation; Amyloid; Nucleation; Coarse-grained computer simulations.1 Introduction and motivation
The mechanisms of macromolecular reactions in soft and biological matter, such as protein protein association or protein aggregation, are notoriously difficult to probe in experiments. This difficulty originates from the fact that these complex macromolecular processes involve the concurrent making and breaking of very large numbers of bonds and interactions between the multiple molecular species present. Historically, the key for investigating molecular mechanisms of small molecule reactions has been to probe the underlying free energy landscape by measuring the temperature dependence of the reaction rates. Reaction rate theory then provides the framework for relating these measurements to the thermodynamics of the underlying free energy landscape.
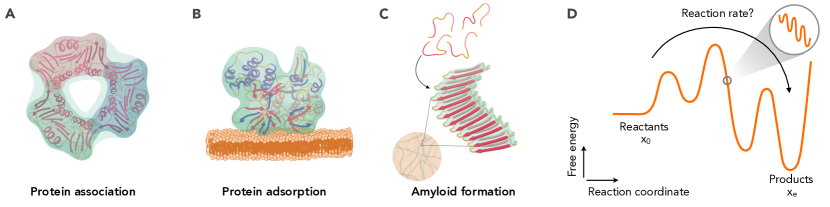
The discipline of rate theory was established when Arrhenius [2] described the temperature dependence of the rate of a chemical reaction in terms of what is now known as the Arrhenius equation: , where is a frequency pre-factor, is the inverse temperature and is the free energy barrier. The next substantial development came with Eyring [3] in the 1930’s, who assumed that the reaction is governed by a rate determining step which corresponds to the breaking of a single quantum mechanical chemical bond. This assumption allows explicit calculation of the frequency prefactor as , where is the Planck constant. Eyring’s equation has proved very successful in describing the reactions of small molecules, but it is not expected to apply to supramolecular processes involving macromolecules, as these processes require the rearrangement of large numbers of bonds rather than breaking of a single quantum-mechanical mode of vibration (Fig. 1). Hence, the associated energy landscape in this case involves many kinetic barriers along the reaction coordinate. A more physically realistic model for these systems is offered by Kramers rate theory [4, 5]. In this theory, reactions are described as diffusion processes along a complex free energy landscape which is parameterized by just a few important coordinates. The reaction rate corresponds to the inverse of the escape time and it is found that the reaction rate is of the Arrhenius-Eyring type, whereby the prefactor depends on key features of the free energy landscape. In particular, it is found that , where and denote the curvature of the potential landscape at the bottom and the top of the free energy barrier, respectively, and is the friction coefficient.
Characterizing the molecular mechanisms of macromolecular diffusive processes thus requires solving the inverse problem of characterising the free energy landscape by measuring the reaction rate. Clearly, the reaction rate will contain the information about the associated free energy barrier, , via Kramers equation. Specifically, by measuring the temperature-variation of the reaction rate, the information about the free energy barrier becomes directly accessible. A key question therefore is to establish which free energy barrier on a complex multibarrier landscape is read out by such a measurement.
Here, we review and apply Kramers reaction theory to model the molecular mechanisms of reactions governed by diffusive dynamics and, conversely, to establish which information about the free energy landscape can be obtained from the temperature-dependence of the associated reaction rate. We find that only one specific barrier from the multi-barrier landscape is probed by such measurements. We then apply this framework to study the energetics of protein aggregation phenomena, a biologically relevant example of multi-step diffusive processes with implications in areas ranging from biomedicine [9] to nanotechnology [15, 17, 18, 16]. Specifically, we apply Kramer’s theory in conjunction with coarse-grained computer simulations and kinetic experiments to determine the thermodynamic characteristics of key steps involved in the aggregation of Alzheimer’s Amyloid- peptide into amyloid fibrils. These results establish a general platform for probing the energetics of complex macromolecular reactions in soft matter.
2 Kramers theory of diffusive reactions with multiple kinetic barriers
Let us consider a diffusive reaction between well-defined initial and final states, and , taking place over a one-dimensional potential free energy landscape, , with multiple barriers (Fig. 1d).
The following Fokker-Planck equation then describes the time evolution of the probability that, starting at , the system has diffused to position at time [5]:
| (1) |
where
| (2) |
Here, denotes the frictional coefficient and is the diffusion coefficient. Note that and are related to the thermal energy through the Einstein-Smoluchowski relation, .
The key quantity of interest is the average first passage time , i.e. the time that it takes, on average, for a system described by Eq. (1) and starting at to reach . In fact, the inverse of the average first passage time corresponds to the transition rate from to [6]
| (3) |
thus providing a link between free energy landscapes and experimental reaction rate measurements. The average first passage time is related to the probability through (see Supplementary Material)
| (4) |
Integrating the Fokker-Planck equation (1) using Eq. (4), we find that satisfies the following differential equation (see Supplementary Material):
| (5) |
The solution to Eq. (5) subject to the boundary condition is (see Supplementary Material):
| (6) |
In the limit when the relevant free energy barrier is much bigger than thermal energy (), the integrals in Eq. (6) can be evaluated explicitly using the saddle point approximation [7]. In particular, assuming that the width does not vary significantly between the multiple potential energy barriers, we need to maximize the integrand over the integration range of Eq. (6), i.e. we need to find . Let and denote the points in the range of integration of Eq. (6) where the integrand in Eq. (6) is maximal. We find (see Supplementary Material):
| (7) |
where
| (8) |
and and are the curvatures of the free energy landscape at and , respectively.
2.1 Determining the relevant free energy barrier from kinetic experiments
Using Eq. (3) we find that the escape rate is in the form of the Arrhenius-Eyring equation:
| (9) |
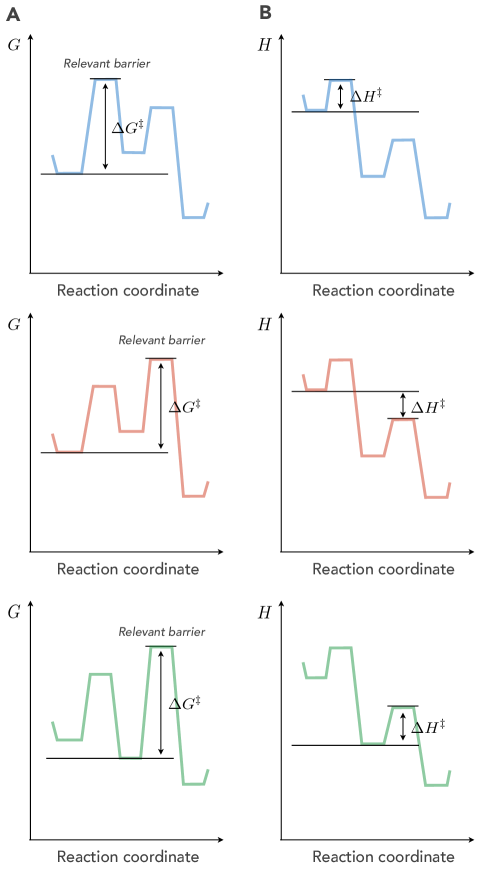
where is a pre-factor, which depends on the curvatures of the potential landscape at and , respectively. Note that, although the energy landscape includes multiple intermediate kinetic barriers, only one relevant free energy barrier determines the escape rate and hence can be probed directly by kinetic experiments. This relevant free energy barrier is found using Eq. (8) and corresponds to the largest possible energy difference between any local maximum and any local minimum preceding it. Figure 2 illustrates this principle for a series of three examples of energy landscapes. An analogous interpretation of the results can be given by performing an explicit analysis of the spectrum of the rate matrix that describes individual transitions in the energy landscapes of Fig. 2 (see Supplementary Material for details).
As Eq. (9) predicts that has an exponential dependency on the height of the relevant energy barrier, using the relationship , where is the enthalpy of activation and is the entropy of activation, and absorbing the entropy contribution into the prefactor, we find . Hence, a plot of against is expected to yield a straight line with the enthalpy of activation corresponding to the relevant barrier as the slope:
| (10) |
This equation provides the key for interpreting reaction rate measurements at varying temperature in terms of the enthalpy of activation of the rate determining step. Note, however, that replacing with in Eq. (8) is wrong. This is because, the relevant activation energy barrier is determined by the free energy landscape (Fig. 2a), while the measured temperature dependence of rate constants only reflects the enthalpic contribution to this barrier, which need not correspond to the highest enthalpy change (Fig. 2b).
2.2 The frequency pre-factor
Unlike the enthalpy of activation, , the free energy of activation, , is crucially coordinate dependent. This raises the question of the appropriate choice for the reaction coordinate, or, equivalently, of an appropriate frequency pre-factor . While Kramers theory in principle provides an explicit formula for this pre-factor via Eq. (9), this expression depends on parameters such as the curvature of the free energy landscape at the top of the relevant barrier, which are commonly inaccessible in experiments. A possible strategy to overcome this limitation consists in partitioning all of the missing information about diffusion along the reaction coordinate into the free energy barrier in the rate equation by re-writing the escape rate as:
| (11) |
where and . Here, is a known frequency pre-factor which can be constructed conveniently from the experimentally accessible information about the reactive flux towards the relevant barrier. Hence, can be interpreted as an additional entropy term representing the fact that we inevitably do not have complete information about diffusion along the reaction coordinate. Note that various choices of partitionings are equally possible. Thus, the kinetic pre-factor, , and the absolute value of the relevant free energy barrier, , are not independent quantities, and the latter is only meaningful if stated together with the corresponding pre-factor.
3 Application to protein aggregation
In the following, we demonstrate how Kramers rate theory discussed above can be used to study complex multi-molecular reactions governed by diffusive dynamics and, in this manner, extract energetic information about some of its constituents microscopic steps. In particular, we shall focus on protein aggregation kinetics into amyloid fibrils, a process which is attracting great interest due to its connection with over 50 medical conditions, including Alzheimer’s and Parkinson’s diseases [8, 9, 10, 11].
Amyloid fibril formation is a process in which soluble proteins spontaneously aggregate into fibrils of a cross- structure, enriched in -sheet content [23]. This is a complex phenomenon that typically involves the concomitant action of multiple molecular mechanisms. Recent advances in the available experimental techniques for measuring aggregation kinetics coupled to mathematical analysis of the underlying kinetic equations have allowed the identification of these mechanisms at a microscopic level [14, 12, 13]. In the case of the aggregation of A42 (the 42-residue form of the Amyloid- peptide), a process that is intimately linked to Alzheimer’s disease [21], the fundamental steps that underlie amyloid fibril formation involve an initial primary nucleation step, where monomeric proteins spontaneously come together to form new fibrils, coupled to filament elongation. In addition, the aggregation process is accelerated by the fact that fibrils are able to generate copies of themselves through surface catalysis [19, 20], a process known as secondary nucleation [22].
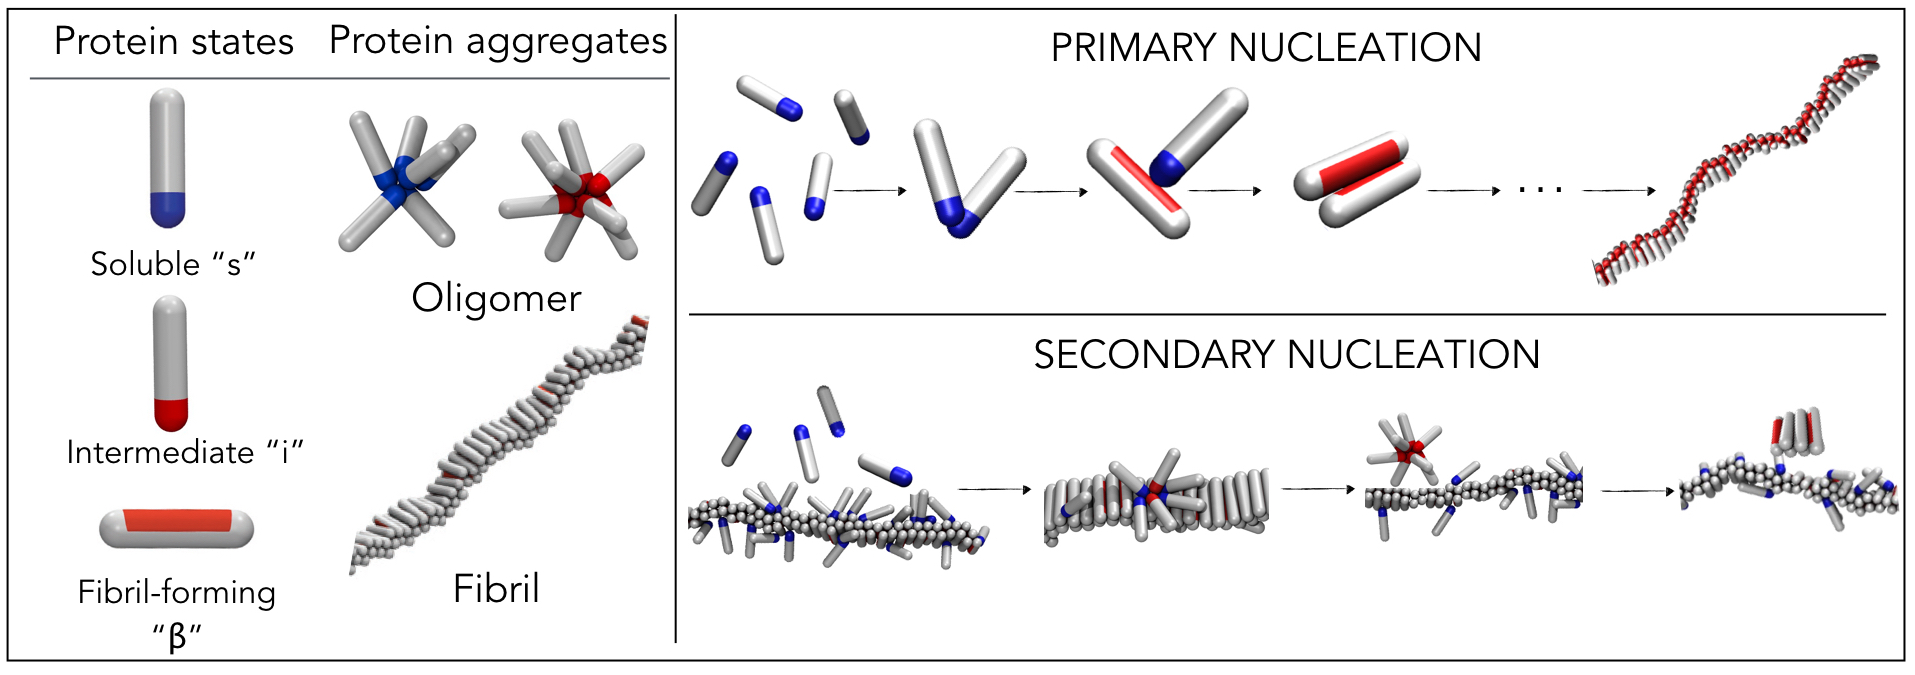
Despite the fact that the molecular steps of A42 amyloid formation have been identified, the molecular mechanisms that underlie them have remained challenging to understand [33, 34, 35]. Here, we use Kramers theory to study the free energy landscape of two key steps in the formation of A42 amyloid fibrils, namely primary and secondary nucleation. We use a coarse-grained model (Fig. 3) which can capture the diffusive motion of proteins on a multi-barrier energy landscape determined by the relevant effective intermolecular interactions, such as hydrophobic forces, hydrogen bonding and screened electrostatic interactions. Our model retains only crucial molecular ingredients needed to reproduce the aggregation behaviour at experimentally relevant scales. The main advantage of this coarse-grained computer simulation approach is that the measurements from simulations can be validated directly against bulk experimental measurements [26], as we also demonstrate here.
In the case of primary nucleation, the free energy landscape along the reaction coordinate in our model involves an initial step whereby monomeric proteins associate, followed by a conformational conversion of proteins from their native soluble states into a -sheet prone state, and finally the association of the latter state in a -sheet rich nucleus, which then rapidly grows into an amyloid fibril (Fig. 3). Secondary nucleation involves the adsorption of monomers onto the surface of an existing fibril and a subsequent surface-catalysed conformational conversion step. This step leads to aggregate detachment and its conversion into the -sheet nucleus, which then elongates into a fibril (Fig. 3). In both scenarios, we measure the temperature dependence of the overall rates of primary and secondary nucleation, and show that, despite the complexity of the underlying processes, these temperature-dependent kinetic measurements probe only one relevant barrier along the free energy landscape. We then compare our simulation results to the equivalent experimental results on the temperature-dependence of primary and secondary nucleation during the formation of A42 amyloid fibrils. Just like predicted by Eq. (9) and (10), we show that the kinetic measurements do not probe the highest enthalpic barrier on the energy landscape, but rather the enthalpic barrier which contributes tot the highest free energy barrier on the landscape.
3.1 Computer model
We used a coarse-grained Monte Carlo model for primary and secondary amyloid nucleation developed in [25] and [26]. Although minimal in its nature, this model captures many complex features of the aggregation processes. In particular, the model accounts for the fact that an amyloidogenic protein needs to exist in at least two different states: a state in solution (“”) that can occasionally aggregate into small oligomers, and a higher free-energy state that can form amyloid fibrils (“”) [28, 25] (Fig. 3). To capture secondary nucleation, a soluble monomer can adsorb onto the fibril surface, and can convert into an additional (intermediate “”) state that lies inbetween the “” and “” states; the existence of this intermediate state reflects the catalytic role of the fibril in assisting the conformational conversion from the soluble into the fibril-forming state. In this model a protein is described by a single rod-like particle, decorated with a patch that controls protein aggregation into either non--sheet oligomers or fibrils. A protein in an “” or “” state interacts with its own kind via its attractive tip, which mimics non-specific inter-protein interactions. The fibril-forming state interacts with its own kind via an attractive side-patch, which models directional interactions, such as hydrogen bonding, and drives the formation of fibrillar aggregates. The interaction between two proteins in the fibril-forming states is by far the strongest interaction in the system, and once formed, the fibrils are effectively irreversible. Monomer adsorption onto the fibril is energetically favorable; adsorbed monomers are then able to interact on the fibril surface to form oligomers. Since the protein in the intermediate state interacts with the fibril only weakly, oligomer detachment is favorable only for sufficiently large oligomers. This is because the loss of monomer-fibril interactions is overcome by the energetic gain associated with the interaction between proteins in the oligomer-forming state. Every conversion event from the soluble state into the fibril-forming state is penalized by a change in the excess chemical potential, . This property is needed to reflect the fact that amyloidogenic proteins, such as A, are typically not found in the -sheet prone conformation in solution [29, 30]. As in our previous work [26], the conversion from the soluble to the intermediate state on the fibril surface, as well as the conversion from the oligomer-forming state to the fibril forming state was penalized by . Further details on the parameters used in this work are given in the Supplementary Information. To calculate the nucleation rate, we measure the mean first passage time for the particles to diffuse along the energy landscape and create a -sheet enriched nucleus. The rate of nucleation is then defined as the inverse of such an average first passage time for nucleation [26, 27].
3.2 Temperature dependence of primary nucleation
For primary nucleation to take place, proteins need to meet in solution and then convert into the -sheet-prone conformations. The converted monomers interact strongly and form a -sheet nucleus which is able to grow into a mature fibril (Fig. 3). This process can involve the formation of long-lived pre-nucleation clusters. Such clusters provide a suitable environment for the conformational conversion to take place and hence significantly enhance the rate of nucleation [25, 27]. We simulated amyloid nucleation in solution for a range of different temperatures. Interestingly, we find a non-monotonic dependence of the primary nucleation rate on temperature (Fig. S5 a): at low temperatures the nucleation rate decreases with temperature, while at high temperatures the rate increases as the temperature is increased. We find that monomers oligomerize substantially at low temperatures (Fig. S5 b), which increases the rate of fibril nucleation. As the temperature is increased, the pre-nucleation oligomers become smaller and smaller, which in turn decreases the nucleation rate. However, as the temperature is further increased, the high-energy -sheet prone state becomes more easily accessible by thermal fluctuations, and the conversion rate is enhanced, resulting in an increased overall nucleation rate.
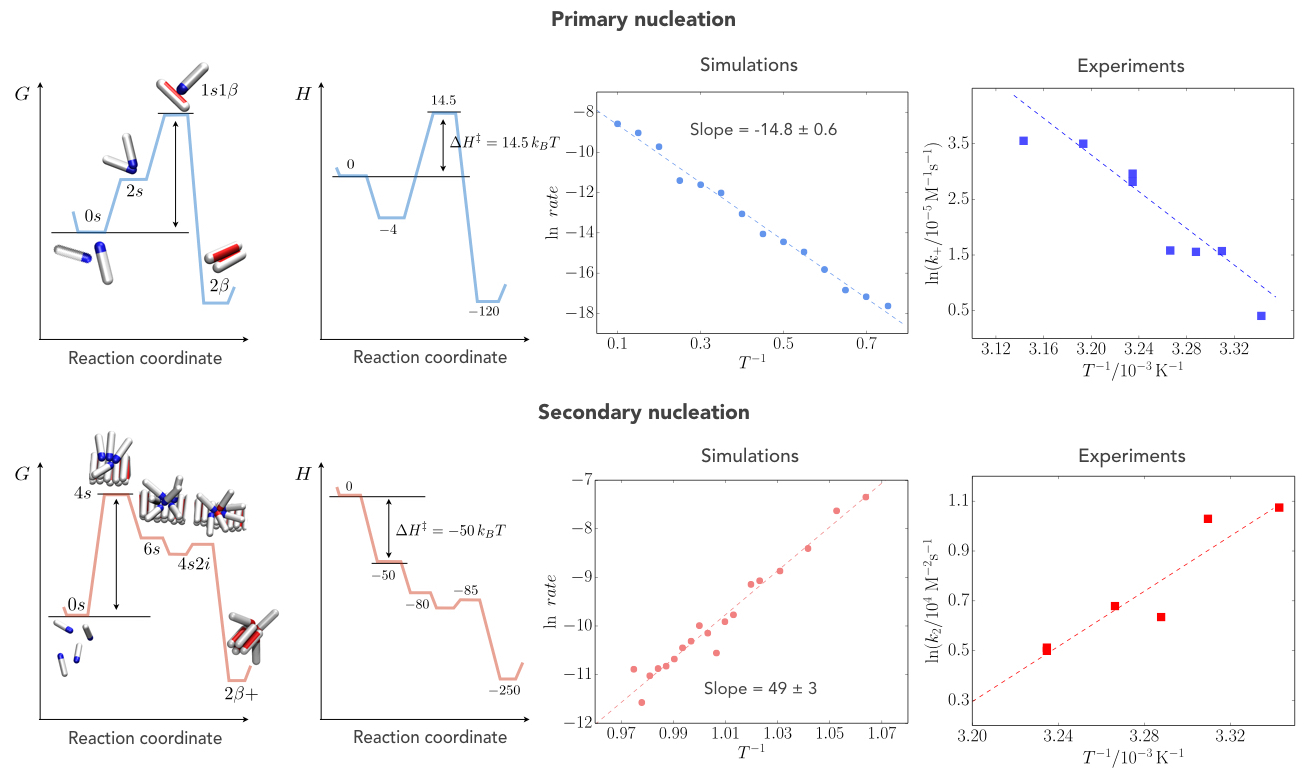
Recently, the temperature-dependence of the rate of primary nucleation of A peptide has been probed in experiments [31], and it has been found that, in the experimentally relevant regime of temperatures for this peptide, the nucleation rate is significantly increased at higher temperatures. Hence we focus on this regime in our analysis. In this temperature regime the nucleation process starts by two proteins meeting in solution and forming a dimer (denoted as "" in Fig. 4). A "" dimer usually falls apart many times and reforms elsewhere in solution before one protein in the dimer successfully converts into the -sheet prone state ("" in Fig. 4). Such a "" dimer also has a high probability of dissolving back to the solution, before a successful conversion into a -sheet nucleus ("2") occurs, which then quickly grows into a fibril. From analyzing the simulation trajectories, we find that such a nucleus made of two proteins in the -sheet prone state always grows further. We also detect a significant amount of dimers which contain two proteins in the soluble states, while the least probable species in the system is a dimer that contains exactly one protein in the soluble state and one protein in the -sheet prone state. We assign the highest free energy barrier in the system to precisely this rare species, as shown in Fig. 4. Since we know all the interactions in the system, we can explicitly calculate the enthalpic barrier which corresponds to this "rate-determining" free energy barrier in our simulations. Our measurements recover the value of 14.5 for the relevant enthalpic barrier, which agrees remarkably well with the variation of the reaction rate with temperature that measures 14.8 , just like predicted by the reaction rate theory in Eqs.(9-10).
3.3 Temperature dependence of secondary nucleation
We repeated an analogous set of simulations and rate measurements for the temperature dependence of secondary nucleation. By contrast to primary nucleation, secondary nucleation occurs via protein adsorption and oligomerization on the fibril surface, followed by a conformational conversion into the intermediate state, oligomer detachment, and conversion into the -sheet nucleus which further grows into a fibril in solution (Fig. 3). From our simulations, at the particular protein concentration we considered, we find that the rarest species in the system is a fibril-bound oligomer which contains four proteins in the "s" state ("" in Fig.4). If such an oligomer survives, it grows into a hexamer ("" in Fig. 4), which then partially converts into an intermediate state ("" in Fig.4), detaches ("" in Fig.4), and finally converts into a -sheet nucleus ("" in Fig.4). Our rate measurements show that secondary nucleation is strongly hampered at high temperatures, which is exactly the opposite trend compared to the one observed for primary nucleation. The reason for this observation is that, unlike in primary nucleation, the highest free energy barrier for secondary nucleation corresponds to the protein oligomerisation step on the fibril surface, rather than the oligomer conversion step. At higher temperatures, fewer monomers are adsorbed onto the fibril surface, which leads to a decreased protein oligomerisation, and slower overall nucleation.
It is important to note that secondary nucleation in our simulations occurs only in a very narrow temperature regime. As previously reported in experiments [20, 32] and simulations [26], secondary nucleation is extremely sensitive to environmental conditions. The exact temperature range where secondary nucleation occurs in our simulations is determined by the choice of all the interactions in the system, which is somewhat arbitrary in such a highly coarse-grained model. Hence, one should not try to compare the exact values of the rates or temperatures between primary and secondary nucleation, but should rather focus on trends and qualitative behavior observed in simulations.
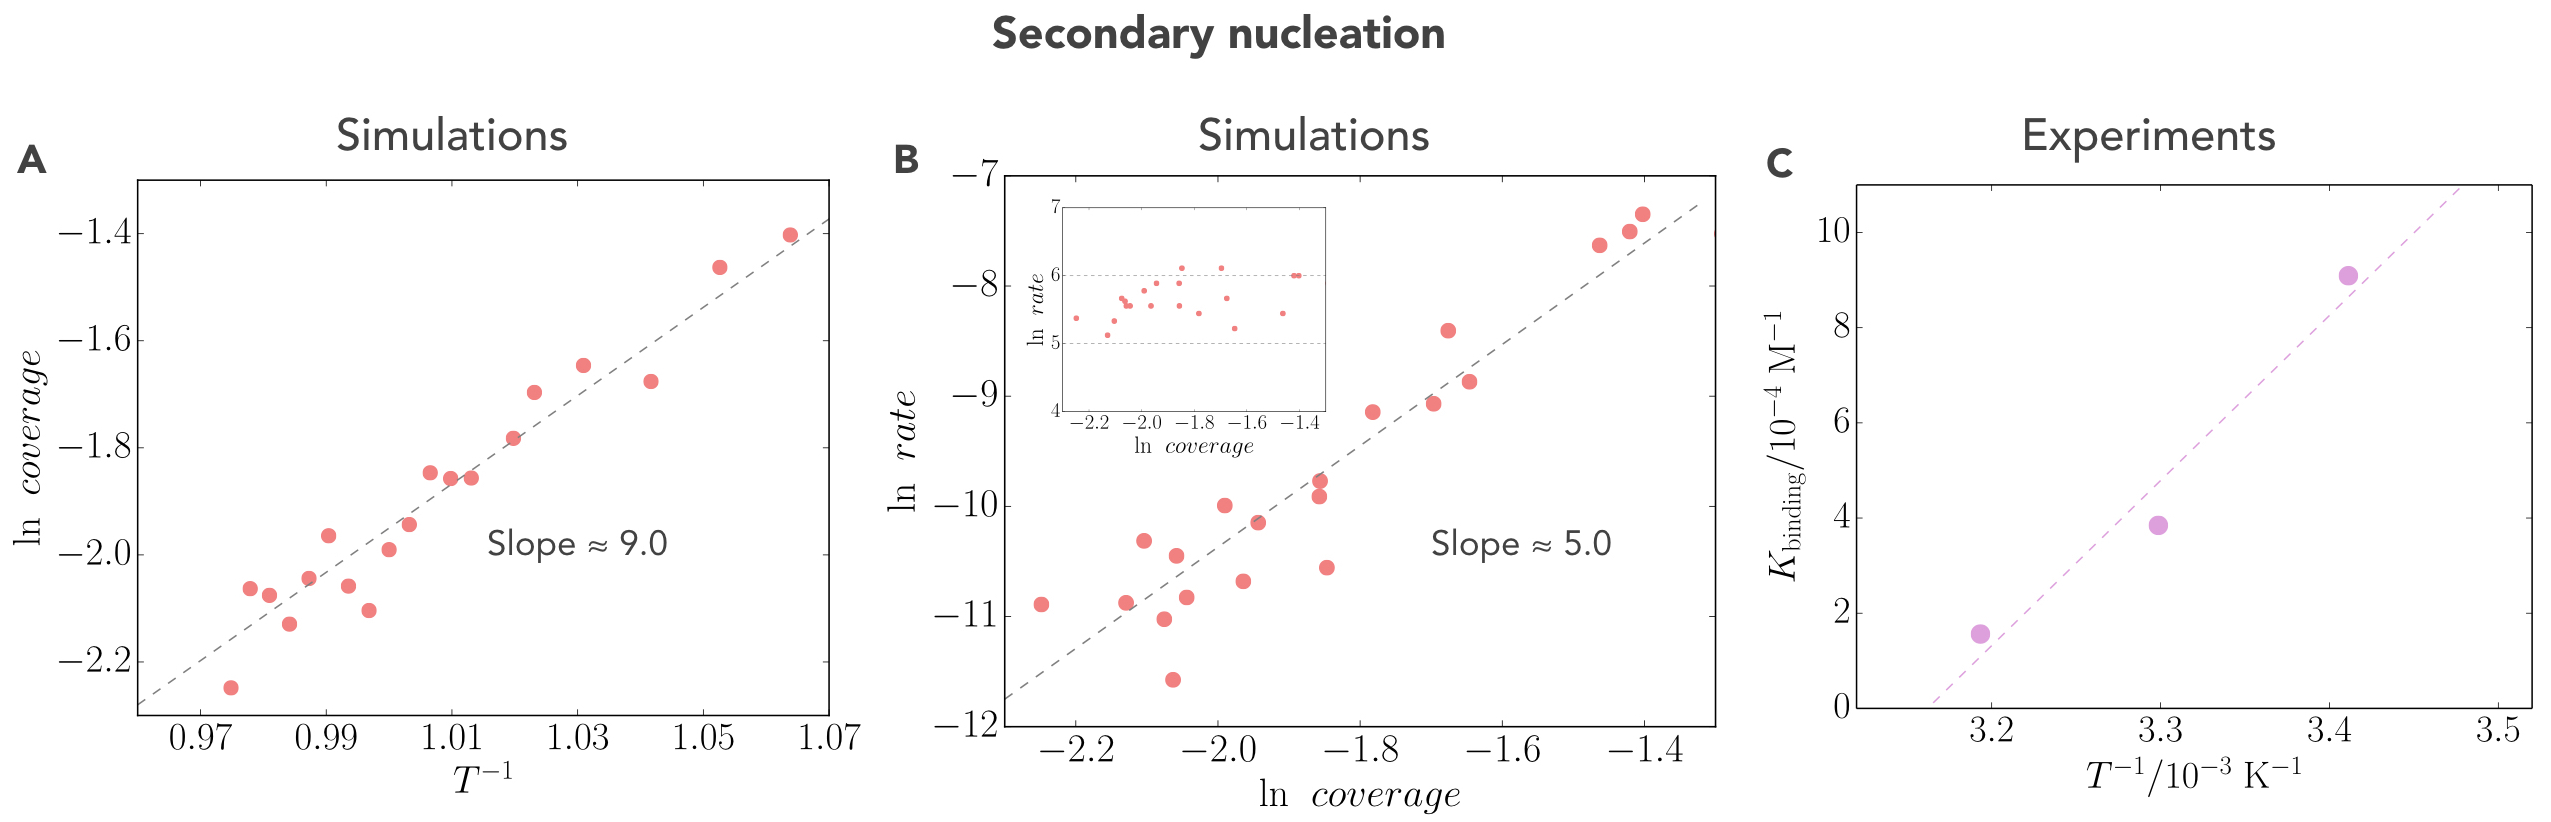
To that end, Fig. 5a shows the temperature-dependence of the surface coverage, while Fig. 5b plots the dependence of the rate of secondary nucleation on the fibril surface coverage. The two dependencies (Fig. 5a and b) combined give rise to the temperature-dependent behaviour of the secondary nucleation reaction rate observed in Fig. 4. From the measurements of the interactions in our model (Fig. 4), we find that the enthalpic barrier corresponding to the formation of the "critical" oligomer is actually negative, and, again, this result aligns very well with the variation of the nucleation rate with temperature. The same trends have recently been reported for the kinetics of secondary nucleation of A42 [31], where the secondary nucleation has also been reported to be retarded at high temperatures, and appeared to have a negative enthalpic barrier (Fig. 4). In this case, the observed behaviour is also caused by the lower protein-fibril adsorption as the temperature increases [31] (Fig. 5c). Secondary amyloid nucleation is a clear example of a process in which the kinetic measurements do not read out the highest enthalpic barrier on the energy landscape. The enthalpic barrier probed is highly negative, both in simulations and experiments, and contributes to the highest free energy barrier on the free energy landscape, which is clearly dominated by the unfavourable entropic contribution related to protein adsorption.
4 Conclusions
We have discussed a general framework, based on Kramers reaction rate theory, for studying the temperature-dependence of complex supramolecular processes with multiple barriers and wells. We find that the enthalpic barrier probed in temperature dependent kinetic measurements of reaction rates does not necessarily correspond to the highest enthalpic barrier along the reaction coordinate, but rather to the enthalpic barrier corresponding to the highest relative free energy barrier on the free energy landscape. We have then applied Kramers theory to interpret in coarse-grained computer simulations of the fundamental processes underlying the formation of amyloid fibrils - primary and secondary amyloid nucleation. For primary nucleation we find that two regimes can exist for the rate of nucleation - a regime in which the nucleation is faster at low temperatures, and a regime in which nucleation is faster at high temperatures. Guided by recent experimental results, we focus on the latter regime, and find that protein conformational conversion, which is aided at high temperatures, is driving primary nucleation in this temperature range. Unlike primary nucleation, we find that the relevant free energy barrier that determines the temperature dependence of secondary nucleation is the adsorption and oligomerisation on the fibril surface, which is hampered at high temperature. This difference results in fundamentally distinct thermodynamic signatures for primary and secondary nucleation, thus highlighting the power of probing free energy landscapes for understanding microscopic processes underlying complex multi-molecular processes.
Acknowledgements
LXL ans SC contributed equally to this work. We acknowledge support from the Swiss National Science Foundation (TCTM), Peterhouse College Cambridge (TCTM), the UCL Institute for the Physics of Living Systems (LXL, SC, AŠ), ERASMUS Placement Programme (SC), the Royal Society (AŠ), the Academy of Medical Sciences (AŠ), Wellcome Trust (AŠ), the Biological Sciences Research Council (TPJK), the Frances and Augustus Newman Foundation (TPJK), the European Research Council (TPJK). We thank Claudia Flandoli for the help with illustrations.
References
- [1] B. Schuler, E.A. Lipman, and W.A. Eaton, Nature 419, 743 (2002).
- [2] S. Arrhenius, Zeitschrift für Physikalische Chemie 4, 226 (1889).
- [3] H. Eyring, J. Chem. Phys. 3, 107 (1935).
- [4] H. A. Kramers, Physica 7, 284 (1940).
- [5] P. Hänggi, P. Talkner, and M. Borkovec, Rev. Mod. Phys. 62, 251 (1990).
- [6] P. Reimann, G.J. Schmid, and P. Hänggi. Phys. Rev. E 60, R1 (1999).
- [7] C.M. Bender and S.A. Orszag, Advanced mathematical methods for scientists and engineers, McGraw-Hill book company (1978).
- [8] F. Chiti and C.M. Dobson, Annu. Rev. Biochem. 75, 333 (2006).
- [9] F. Chiti and C.M. Dobson, Annu. Rev. Biochem. 86, 27 (2017).
- [10] C. M. Dobson, Cold Spring Harb Perspect Biol 9, a023648 (2017).
- [11] T. P. J. Knowles, M. Vendruscolo, C. M. Dobson, Nat. Rev. Mol. Cell Biol. 15, 385 (2014).
- [12] S. I. A. Cohen, M. Vendruscolo, C. M. Dobson, T. P. J. Knowles, J. Mol. Biol. 421, 160 (2012).
- [13] G. Meisl, J. B. Kirkegaard, P. Arosio, T. C. T. Michaels, M. Vendruscolo, C. M. Dobson, S. Linse, T. P. J. Knowles, Nat. Prot. 11, 252 (2016).
- [14] T.C.T. Michaels, A. Šarić, J. Habchi, S. Chia, G. Meisl, M. Vendruscolo, C.M. Dobson, T.P.J. Knowles, Annu. Rev. Phys. Chem. 69, 11 (2018).
- [15] E. Gazit, Chem. Soc. Rev. 36, 1263 (2007).
- [16] R. Mezzenga and P. Fischer, Rep. Prog. Phys. 76, 046601 (2013).
- [17] T.P.J. Knowles and M.J. Buehler, Nat. Nanotechnol. 6, 469 (2011).
- [18] G. Wei, Z. Su, N.P. Reynolds, P. Arosio, I.W. Hamley, et al. Chem. Soc. Rev. 46, 4661 (2017).
- [19] S. I. A. Cohen et al, Proc. Natl. Acad. Sci. USA 110, 9758 (2013).
- [20] G. Meisl et al, Proc. Natl. Acad. Sci. USA 111, 9384 (2014).
- [21] D.J. Selkoe and J. Hardy, EMBO Mol. Med. 8, 595 (2016).
- [22] F.A. Ferrone, J. Hofrichter, W.A. Eaton WA, J Mol Biol 183, 611 (1985).
- [23] A. W. P. Fitzpatrick et al., Proc. Natl Acad. Sci. USA 110, 5468 (2013).
- [24] D. Frenkel, B. Smit, Understanding molecular simulation: from algorithms to applications (Vol. 1), Elsevier (2001).
- [25] A. Šarić, Y. C. Chebaro, T. P. J. Knowles, D. Frenkel, Proc. Natl. Acad. Sci. U.S.A. 11, 17869 (2014).
- [26] A. Šarić, A. K. Buell, G. Meisl, T. C. T. Michaels, C. M. Dobson, S. Linse, T. P. J. Knowles, D. Frenkel, Nat. Phys. 12, 874 (2016).
- [27] A. Šarić, T. C. T. Michaels, A. Zaccone, T. P. J. Knowles, D. Frenkel, J. Chem. Phys 145, 211926 (2016).
- [28] N. S. Bieler, T. P.Knowles, D. Frenkel, R. Vácha, PLoS Comput Biol, 8, e1002692 (2012).
- [29] M. Fändrich, M. A. Fletcher, C. M. Dobson, Nature, 410, 165 (2001).
- [30] J. R. Allison, P. Varnai, C. M. Dobson, M. Vendruscolo, J. Am. Chem. Soc. 131, 18314 (2009).
- [31] S. I. A. Cohen, R. Cukalevski, T. C. T. Michaels, A. Šarić, M. Vendruscolo, C. M. Dobson, A. K. Buell, T. P. J. Knowles, S. Linse, Nat. Chem., in press (2018).
- [32] G. Meisl, X. Yang, C. M. Dobson, S. Linse, T. P. J. Knowles, Chem. Sci. 8, 4352 (2017).
- [33] D. Kashchiev and S. Auer, J. Chem. Phys. 132, 215101 (2010).
- [34] R. Cabriolu, D. Kashchiev, and S. Auer, J. Chem. Phys. 133, 225101 (2010).
- [35] R. Cabriolu and S. Auer, J. Mol. Biol. 411,275 (2011).
See pages 1-last of Paper_barriers_SI_16.pdf