Cosmic clocks: A Tight Radius - Velocity Relationship for HI-Selected Galaxies
Abstract
Hi-Selected galaxies obey a linear relationship between their maximum detected radius and rotational velocity. This result covers measurements in the optical, ultraviolet, and Hi emission in galaxies spanning a factor of 30 in size and velocity, from small dwarf irregulars to the largest spirals. Hence, galaxies behave as clocks, rotating once a Gyr at the very outskirts of their discs. Observations of a large optically-selected sample are consistent, implying this relationship is generic to disc galaxies in the low redshift Universe. A linear relationship is expected from simple models of galaxy formation and evolution. The total mass within has collapsed by a factor of 37 compared to the present mean density of the Universe. Adopting standard assumptions we find a mean halo spin parameter in the range 0.020 to 0.035. The dispersion in , 0.16 dex, is smaller than expected from simulations. This may be due to the biases in our selection of disc galaxies rather than all halos. The estimated mass densities of stars and atomic gas at are similar () indicating outer discs are highly evolved. The gas consumption and stellar population build time-scales are hundreds of Gyr, hence star formation is not driving the current evolution of outer discs. The estimated ratio between and disc scale length is consistent with long-standing predictions from monolithic collapse models. Hence, it remains unclear whether disc extent results from continual accretion, a rapid initial collapse, secular evolution or a combination thereof.
keywords:
galaxies: dwarf – galaxies: fundamental parameters – galaxies: kinematics and dynamics – galaxies: spiral – galaxies: structure.1 Introduction
Based on the Cold Dark Matter (CDM) scenario for galaxy evolution the main structural and dynamical properties of galaxies’ halos and discs are expected to obey simple virial scaling relations (Fall & Efstathiou, 1980; Mo et al., 1998; Dutton et al., 2007). These properties are typically specified as a radius , rotation velocity amplitude and a mass , or alternatively luminosity as a proxy for mass. For halos in virial equilibrium we expect (Mo et al., 1998, hereafter MMW98). While the dark matter is not directly observable, scaling relations are observed in the properties of the baryons, although the slopes (power law exponents) of the relations are not exactly as predicted for the halos (e.g. Courteau et al., 2007).
The most used scaling relation is the velocity-luminosity relation, better known as the Tully-Fisher Relation (hereafter TFR; Tully & Fisher, 1977), and similarly the Baryonic Tully-Fisher Relationship (McGaugh et al., 2000) which is a velocity-mass relationship. Baryonic physics is messy. The scaling between luminosity and baryonic mass depends on the star formation history which varies between galaxies (Grebel, 1997; Tolstoy et al., 2009; Weisz et al., 2011; Williams et al., 2011), the Initial Mass Function (IMF) which also apparently varies between galaxies whether they are dominated by young stellar populations (Hoversten & Glazebrook, 2008; Meurer et al., 2009; Lee et al., 2009; Gunawardhana et al., 2011) or old ones (Treu et al., 2010; van Dokkum & Conroy, 2012; Conroy & van Dokkum, 2012; Cappellari et al., 2012; Smith et al., 2012; Dutton et al., 2012), and the dust content and distribution (Calzetti et al., 1994; Gordon et al., 2001; Tuffs et al., 2004). Theory and observations indicate that feedback from star formation (Governato et al., 2010; Oh et al., 2011) or active galactic nuclei (e.g. Bonoli et al., 2016) can rearrange the distribution of baryons, and in the process drag along the dark matter (DM) into an altered distribution, affecting all scaling relations.
The radius-velocity () relationship has received somewhat less attention. Courteau et al. (2007) and Dutton et al. (2007) fit scaling relations to , , and in a sample of luminous spiral galaxies having optical spectroscopic observations. They found that the scatter in the relationship was the highest compared to the and relationships. Some of the scatter in the relation is due to the uncertainties and ambiguities of measuring . This includes lack of a uniform definition of radial scale length (cf. Pohlen & Trujillo, 2006), contamination by the bulge component, selection effects (especially with surface brightness), and errors due to dust. However, if instead of using a scale length to characterise we consider an outer radius, then some of these concerns (e.g. bulge and dust) are minimised and a tighter relationship can be found. This will allow a better measurement of the intrinsic scatter in the relationship which is very sensitive to the spin of the halos in which galaxies lie (e.g. Mo et al., 1998; Dutton et al., 2007; Courteau et al., 2007; Obreschkow & Glazebrook, 2014).
Here we demonstrate a nearly linear relationship in various measurements of Hi-selected galaxy samples. In Section 2 we present our primary samples and detail the measurements we use. Section 3 shows the observed correlations and quantifies the slopes and scatters; we also test the results on a large comparison sample selected and measured in the optical giving consistent results. In Section 4 we show what a linear relation means in the context of CDM dominated galaxy evolution models. Our results are discussed further in Section 5 where we estimate the spin parameter of galaxies, the properties of discs near their outer extents, and then discuss how these results relate to ideas on what limits the extent of galaxy discs. Our conclusions are presented in Section 6.
2 Samples and measurements
We measure the relationship in three primary samples. The first uses optical data from the Survey of Ionization in Neutral Gas Galaxies (SINGG; Meurer et al., 2006), which is an H and R-band follow-up survey to the Hi Parkes All Sky Survey (HiPASS; Meyer et al., 2004; Zwaan et al., 2004; Koribalski et al., 2004) combined with single dish Hi data from HiPASS. The second uses data from the Survey of Ultraviolet emission in Neutral Gas Galaxies (SUNGG; Wong, 2007), which observed HiPASS-selected galaxies in the ultraviolet (UV) with GALEX, for a sample largely overlapping with SINGG. Here, we use sub-samples of SINGG and SUNGG designed to ensure that reasonable rotation amplitudes can be derived from the HiPASS Hi data. Specifically, both samples are selected to have major to minor axial ratios and to be the only apparent star forming galaxy in the system. The cut guarantees a minimum inclination of about 60∘, thus limiting projection errors in calculating orbital velocities. For those galaxies observed by SINGG, the isolation criterion was determined using the H images, which are roughly the same size as the HiPASS beam. For those SUNGG galaxies not observed by SINGG, isolation was determined morphologically; systems with companions of similar angular size, obvious signs of interaction, or noted as interacting with another galaxy in the literature were excluded. These selection criteria results in 71 and 87 galaxies from SINGG and SUNGG respectively, with an overlap of 47 galaxies in common. The third sample uses Hi imaging data of the 20 galaxies studied by Meurer et al. (2013, hereafter MZD13).
In all three samples, Hi data is used to infer the maximum rotation amplitude. The implicit assumption is that the Hi in these galaxies is dominated by a rotating disc. It is important to bear in mind that the selection of the samples requires detectable amounts of Hi, and thus is biased against gas-poor disc galaxies (e.g. S0 galaxies and ellipticals). Note that the cut applied to the SINGG and SUNGG samples also is likely to remove early type and S0 galaxies from our samples. As pointed out by Meurer et al. (2006), very few such galaxies are found in the SINGG sample. The selection against early type galaxies may have implications on the types of halos they are associated with, as discussed in §5.1. As we show below, the implied rotational amplitudes range from km s-1 (dwarf galaxies) to 300 km s-1 (the largest spirals).
The radii used for the SINGG and SUNGG samples depend on the maximum extent of the galaxies observed in the optical and UV, respectively. Both surveys are designed to measure the total light of extended nearby galaxies using a series of concentric elliptical annuli. For SINGG the apertures are set in a manner slightly modified from that given in Meurer et al. (2006). As noted there, the aperture shape ( and position angle) and centre are set by eye to include all the apparent optical emission. In most cases, this shape matches well the apparent shape of the galaxy in the R-band, i.e. a tilted disc. We then grow the apertures to an arbitrarily large size, and determine, by eye, where the raw (before sky subtraction) radial surface brightness profile levels off. The surface brightness of the galaxy at that radius is on the order of 1% of the sky brightness.
The radius where the raw surface brightness profiles flatten is called the maximum radius . Since the R-band light almost always can be traced further than H, typically measures the maximum detectable extent in the optical continuum. Most exceptions are dwarf galaxies with strong minor-axis outflows. Optical sizes were estimated in this manner by two of us. First by DH and then by GRM who “tweaked” the size estimates in about half of the SINGG sample. Typically those that were adjusted were made larger because the raw profiles indicated a small amount of additional flux could be gained doing so. Here we use the tweaked aperture radii. Compared to using the initial estimates, the use of the tweaked apertures increases by 0.06 dex on average and also reduces the scatter in the residuals of the fits described below by 0.06 dex (when taken in quadrature). The SUNGG maximum radius is set in a similar manner; it is determined separately in NUV and FUV and the maximum of the two is taken as .
For both the SINGG and SUNGG samples we interpolate enclosed flux versus aperture semi-major axis profiles to determine the radii containing 50% () and 90% () of the flux in the R-band and UV, respectively.
For the MZD13 sample we use three radii: is the maximum extent of the Hi radial profiles as given in the original studies used by MZD13, while and represent the extent of the region of the Hi surface mass density profile fit with a power law by MZD13. These radii are set by eye to mark kinks in the Hi radial profiles, indicating changes of slope in . On average they are close to the radii that contain 25% and 75% of the Hi flux respectively (MZD13). Unfortunately, neither MZD13, nor the studies they employed, calculated and for the Hi data.
The shape of the Rotation Curve (hereafter RC) of galaxies varies systematically with mass, or peak rotational velocity, from nearly solid body (linearly rising) for the lowest mass galaxies, to RCs that are flat at nearly all radii, or even slightly declining at large for the most massive galaxies (Persic & Salucci, 1991; Persic et al., 1996; Catinella et al., 2006). Unless stated otherwise we take to be the maximum rotational amplitude. For most cases this will be the amplitude at the flat part of the RC. In the majority of other cases it will be the farthest measured point of the RC. We take these definitions to be synonymous. For the SINGG and SUNGG samples we derive from the full width at half maximum of the Hi spectrum from HiPASS, assuming a flat RC over all relevant radii. We follow the method of Meyer et al. (2008) and correct the line widths for inclination, and broadening resulting from turbulence, relativity, instrumental effects and data smoothing. As with Meyer et al. (2008) the inclinations are derived from . For the Hi sample we interpolate the RCs, from the various original studies used by MZD13 to arrive at rotation amplitudes at , , and separately (i.e. , , and ).
3 Results
3.1 Observed Correlations
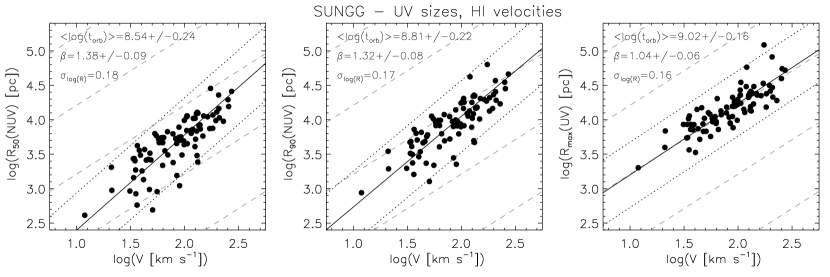
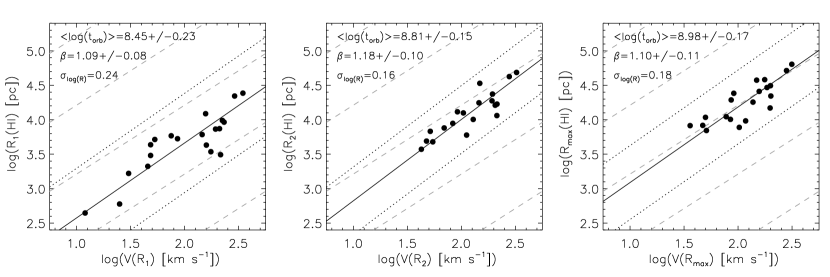
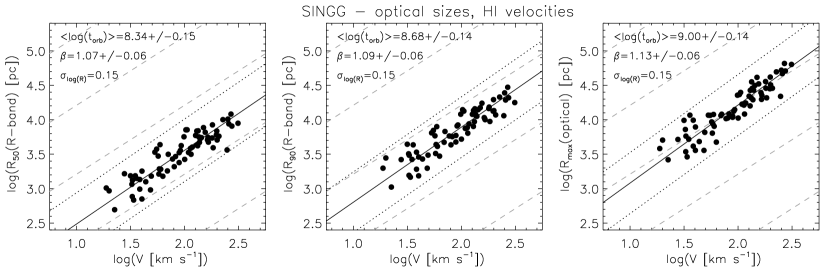
We show the observed correlations separately for each data set in three figures. Figure 1 shows the relationship for the SINGG optical data. In the left panel the -axis gives the radius as , i.e. the radius containing 50% of the R-band light; similarly the middle panel shows as the radius; while the right panel uses as defined from the SINGG optical data. The velocity in all panels is the circular velocity defined from the HiPASS Hi line widths (§2). Similarly, Fig. 2 shows , , and from the SUNGG UV data in the left, middle and right panels, respectively, against derived from HiPASS. Figure 3 shows the Hi radii , and plotted against the circular velocities interpolated at those radii , , in the left, middle and right panels respectively.
We fit the relations in log-log space as
| (1) |
using an ordinary linear least squares bisector algorithm (Isobe et al., 1990) weighting each point equally, and iteratively clipping points that deviate from the fit by more than three times the dispersion in . Table 1 reports the results of the fits, giving the coefficients , , the dispersion of the residuals , , and Pearson’s correlation coefficient . Some of these quantities are also listed in Figures 1 - 3.
| Sample | radius | ||||||||
|---|---|---|---|---|---|---|---|---|---|
| (1) | (2) | (3) | (4) | (5) | (6) | (7) | (8) | (9) | (10) |
| SINGG | 71 | 0 | 0.15 | 0.14 | 0.899 | ||||
| SINGG | 71 | 0 | 0.15 | 0.14 | 0.908 | ||||
| SINGG | 71 | 0 | 0.15 | 0.13 | 0.914 | ||||
| SUNGG | 88 | 0 | 0.18 | 0.24 | 0.797 | ||||
| SUNGG | 88 | 0 | 0.18 | 0.22 | 0.805 | ||||
| SUNGG | 87 | 1 | 0.16 | 0.16 | 0.830 | ||||
| Hi | 20 | 0 | 0.24 | 0.22 | 0.859 | ||||
| Hi | 19 | 1 | 0.16 | 0.14 | 0.876 | ||||
| Hi | 20 | 0 | 0.18 | 0.16 | 0.825 | ||||
| PS1 | 692 | 6 | 0.14 | 0.13 | 0.770 | ||||
| PS1 | 694 | 4 | 0.15 | 0.13 | 0.761 | ||||
| PS1 | 689 | 9 | 0.12 | 0.11 | 0.818 |
Column (1): the Galaxy sample fitted. Column (2): the radius measured. Column (3): the number of data points used in the fit. Column (4): the number of data points rejected from the fit. Column (5): the zeropoint of the fit. Column (6): the slope of the fit. Column (7): average log of the orbital time of the fitted data points. Column (8): dispersion in the log of the residuals in radius of the fitted points. Column (9): dispersion in the log of the residuals in orbital velocity of the fitted points (or implied orbital velocity for the PS1 sample). Column (10): Pearson’s correlation coefficient using all data points.
For the optical and UV samples the fits are the “best” at , where best is defined as having the highest and lowest and . For the Hi sample, the fit at , marking where the Hi profiles flatten, is much worse than the other two fits. The flattening is likely to be due to the increasing dominance of molecular gas at small radii (Leroy et al., 2008; Bigiel et al., 2008). The fits at and have similar scatters, indistinguishable statistically. In summary, the fits are their best, or close to it, at where is close to but slightly greater than unity, that is, a linear relationship.
A linear implies that the orbital time
| (2) |
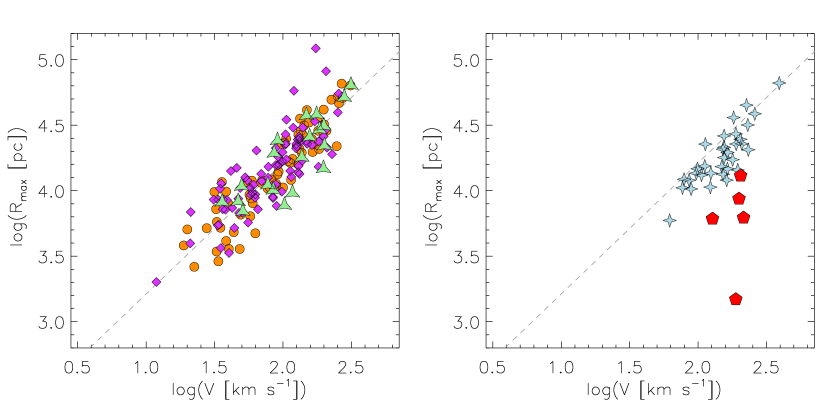
is constant (assuming the orbit shape is well approximated by a circle). We list the mean in Table 1 and the panels of Figures 1 - 3. The relation at is nearly identical in the three figures even though is defined at very different wavelengths, which are sensitive to different physical processes. Figure 4a over-plots the three samples at , showing the excellent correspondence in the relationships. They all imply that Gyr, with a scatter of 0.14 to 0.18 dex (38% to 51%). Thus, Hi-selected disc galaxies behave like clocks and rotate once in a Gyr at their outermost detected radii, for galaxies which range in radius from kpc, having to galaxies with kpc and . The relationship for Gyr is shown with the dashed line in Figure 4a.
The SINGG– relation is equally well defined at , and . However, the meaning is less clear when using and . The velocity used, , is determined from the line width of integrated Hi velocity profiles of galaxies that are spatially unresolved. The Hi in galaxies typically is weighted to larger radius than the easily observed optical emission (e.g. Leroy et al., 2008), hence the derived is also applicable to large radii. The rotation amplitude at and will be systematically over-estimated using as one goes to lower rotation amplitudes and shorter radii (i.e. the effect will be stronger for than ). Hence, if we used the true values at and then we should see shallower values than shown in Fig. 1.
The relations in the UV also are defined using Hi velocity profiles. Here we see significantly larger residuals when using and as well as steeper values compared to the relation at . We posit that the worse fits are due to whether or not galaxies have a central starburst, and the degree to which they are affected by dust. These will have more of an impact on the distribution of the UV luminosity at small radii than in the determination of .
3.2 Results for a comparison sample
Our primary results are for three samples having Hi-based measurements, one has Hi-based measurements, and two have overlapping selections based on Hi properties. In order to address whether our results may be a byproduct of working with Hi data, we now consider a sample that is selected and measured in the optical; the sample of 698 disc galaxies of Zheng et al. (2015). The sample was selected from the Pan-STARRS1 (PS1) Medium Deep Survey (Chambers et al., 2016) fields, and measured from the stacked survey images. The galaxies were selected to have images in all PS1 bands (g,r,i,z,y), spectroscopic redshifts from SDSS-III111http://skyserver.sdss.org/, to be fairly face-on (), and to be well resolved with a Petrosian (1976) radius222where the local surface brightness is 20% of the average interior surface brightness . Galaxy profiles are then measured to . This algorithm recovers of the total light for galaxies having a Sérsic (1963) index typical of disc galaxies (Graham et al., 2005). Zheng et al. (2015) found that radial surface brightness profiles typically show a “break”, or change in slope, in the bluer bands with the break less apparent towards longer wavelengths. They fitted stellar population models to annular photometry in the five bands to derive stellar mass density profiles and integrated to yield the total stellar mass. They recorded , and the break radius all measured in the r-band. Hence, as with the other samples, we have three fiducial radii to work with. Instead of using a measured rotational velocity, we use , the circular velocity estimated from the stellar mass based TFR of Reyes et al. (2011). This fit to the TFR has been shown to well represent the kinematics of an SDSS based sample (Simons et al., 2015) which has redshifts similar to this PS1 sample.
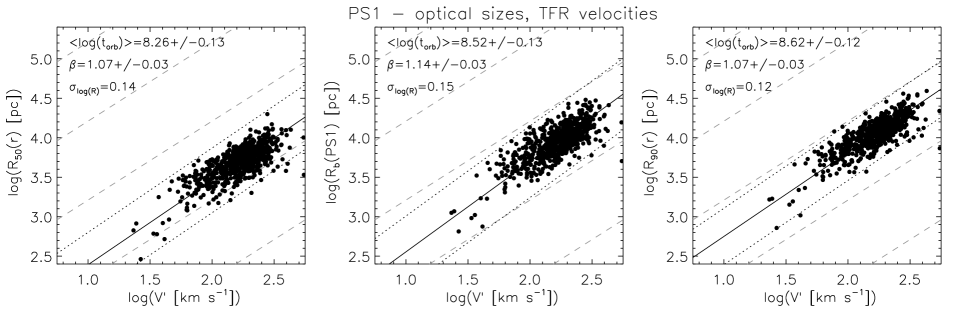
The resulting relationships are shown in Fig. 5. We fit this sample in the same manner as done for the other samples (§3.1). The fit parameters are tabulated in Table 1. In all three cases the fits to the PS1 data are nearly linear (), with the fit at being closest to linear and having the smallest scatter dex of any of our fits.
Amongst the PS1 sample fits, the one at has the largest scatter, 0.15 dex in , and deviates the farthest from linear (). Nevertheless, the scatter about the mean orbital time of 0.13 dex compares well with the other fits. The larger scatter compared to the fit at may arise because the strength of the radial profiles breaks is highly variable with some galaxies “breaking down” (more typical), others “breaking up”, and some showing no discernible breaks (Freeman, 1970; Pohlen & Trujillo, 2006; Zheng et al., 2015).
The (logarithmic) mean at and for the PS1 sample 0.18, 0.42 Gyr respectively, is close to that for the SINGG sample 0.22, 0.48 Gyr. Meanwhile, at the mean Gyr, intermediate between that at and . Hence for the PS1 sample. While Zheng et al. (2015) do not measure , they note that typically and that most of the light is recovered at , hence we expect for the PS1 sample. For flat RCs, then we infer that Gyr for the PS1 sample, within 0.08 dex of the SINGG sample. The estimates for the PS1 sample at , and that implied at are all lower than those for the SINGG sample, suggesting a more general optical selection of galaxies may result in smaller galaxies than an Hi selection. However, the differences are all close to or about equal to the 0.06 dex systematic error noted in §2. Hence to that level of accuracy, the same relationship for Hi selected galaxies applies to all disc galaxies at low redshifts.
The somewhat tighter fits to the PS1 sample does not necessarily mean that the intrinsic scatter in the relations is lower than for the SINGG sample. This is because an inferred rather than measured velocity is used. Since the in Fig. 5 is derived from luminosities, these are essentially or correlations we are showing. Saintonge & Spekkens (2011) find a very tight relation (having a scatter of 0.05 dex in ) using their SFI++ sample of spiral galaxies, and employing isophotal radii and I-band luminosities. Similarly, both Courteau et al. (2007) and Hall et al. (2012) find smaller scatters in their relations than their relations. In part, this is because errors in are effectively reduced by a factor of 3 to 4 due to the TFR scaling, making them competitive or better than velocity errors (Saintonge & Spekkens, 2011). Velocities are also more prone to errors in inclination, position angle and non-circular motions. Working with stellar mass (fitted to photometry), as done with our PS1 sample, also improves the accuracy by effectively spreading any error over five bands and weighting the results to the reddest bands. But improved accuracy may not be the only cause for the tight fits in Fig. 5. Saintonge & Spekkens (2011) performed a careful error analysis of the scatter in their scaling relations and estimate the intrinsic scatter in their relations ( dex in ) is less than half of that in their relations ( dex in ).
4 Expectations from simple galaxy evolution models
A constant at implies a constant spherically averaged mean mass (baryons and DM) density interior to since
| (3) |
where is the gravitational constant. Our adopted Gyr yields the mean mass density interior to :
| (4) |
The closure density of the universe, , is given by
| (5) |
where is the redshift () dependent Hubble constant. This can be used to estimate the collapse factor of matter within . Adopting and the results of the Planck Collaboration (Planck Collaboration et al., 2014) that the ratio of the cosmic matter density to the closure density then we have
| (6) |
The third root of this is the average collapse factor of the matter within compared to the present day matter density of the universe:
| (7) |
The “virial radius” is usually defined as the radius where the mean density of the enclosed mass is 200 times larger than . From eq. 5 it is apparent that depends only on redshift, and thus, by definition, a linear relationship is expected at at any given epoch given by eq. 2 of MMW98:
| (8) |
From eq. 2 the orbital time at the virial radius at the present epoch is Gyr.
The RC interior to depends on the distribution of DM and baryons. MMW98 used an analytical approach to examine the expected structure of disc galaxies within DM halos under a variety of plausible assumptions about cosmogeny and distribution of the baryons and DM. They adopt a simple isothermal sphere to parameterise DM halos, and show that this framework is convenient for understanding how the galaxy scaling relations are influenced by the properties of their halos. Adopting this approach MMW98 derived eq. 8, above. An isothermal sphere has a flat (constant) RC and a density profile
| (9) |
A flat RC is well supported observationally in most disc galaxies, especially at large radii (e.g. Rubin et al., 1978; Bosma, 1981; Mathewson et al., 1992; de Blok et al., 2008; Epinat et al., 2008), while the shape of the inner part of the RC varies systematically with mass, or (e.g. Persic & Salucci, 1991; Catinella et al., 2006). Since our results are the most consistent at , where RCs are typically flat, the isothermal approximation suffices for our purposes. For a pure exponential disc galaxy in a dominant isothermal halo MMW98 derive the disc scale length relative to in their eq. 12. Combining that with eq. 8 yields
| (10) |
where is the fraction of the total angular momentum in the disc, is the fraction of the total mass in the disc, and is the spin parameter. For systems that are not purely exponential discs in an isothermal halo, the scale factor () will vary depending on the detailed distributions of DM and baryons (MMW98). Thus a linear relationship between and should exist if is constant.
If the DM and baryons are well mixed when galaxies collapse one would naively expect and thus a constant (MMW98). This is also the working assumption of Fall & Efstathiou (1980) whose simple models were consistent with the observations of the time. While it is impossible to observationally confirm this expectation because of the invisible nature of DM, simulations allow it to be tested. Posti et al. (2018), using a similar approach to ours, and matching of galaxy properties to halo properties from a variety of recent cosmological N-body simulations, find that is approximately constant, close to what what we require. We note that a constant is difficult to reproduce in more detailed numerical simulations (Governato et al., 2010). The dependence of on mass and other parameters for dark halos, as measured in numerous simulations, is also weak (e.g. MMW98; Cole & Lacey, 1996; Macciò et al., 2007; Bett et al., 2007). Thus naive considerations tell us that we expect a linear relation when a disc scale length, or anything proportional to it, is used to measure size. This would be the case for the isophotal sizes of pure exponential discs that have constant central surface brightness as originally proposed by Freeman (1970).
Disc galaxies, however, are not that simple. They typically contain a bulge increasingly apparent with morphological type (e.g. Hubble, 1926). Since Freeman’s landmark work, it has become apparent that discs obey a surface brightness – luminosity relationship (e.g. Kauffmann et al., 2003), and that the radial profiles frequently show breaks from being pure exponential (Freeman, 1970; Pohlen & Trujillo, 2006; Zheng et al., 2015). However, allowing for these complications may not necessarily cause major changes to the the relation. MMW98 derive the behaviour of an exponential disc in a halo having the typical profile found in CDM-only simulations (Navarro et al., 1997, hereafter NFW) which is allowed to respond to the disc’s mass. They find relationships for and the maximum rotational velocity that differ from the isothermal case by form functions that depend on , , and halo concentration . Of these, is the parameter that is expected to have the largest impact Dutton et al. (2007). For example, MMW98 considered the case of a bulge plus disc embedded in an NFW halo, and found disc size depends on assumptions about angular momentum transfer between the bulge, disc and halo. They found disc sizes can vary by a factor of about two, while maximum velocities only vary by %.
5 Discussion
The formalism presented in Section 4 allows us to place our results in a cosmological context. We continue with this approach in Section 5.1 by examining the constraints on the spin parameter and its dispersion implied by our results. Section 5.2 discusses what our results imply for the properties at the disc outskirts. Section 5.3 argues that our results are best explained by a true physical truncation of discs. While the formalism presented thus far implies continual accretion limits the extent of discs, Section 5.4 considers other scenarios for limiting the extent of discs. Finally we present some ancillary implications of our results in Section 5.5.
5.1 Spin Parameter
Equation 10 is readily re-arranged to be
| (11) |
where is the orbital time at radius , and is the Hubble time (13.96 Gyr for our ), and assuming . Thus, spin parameter can be estimated from the orbital time at a given radius and the scaling of that radius with disc scale length. Since was not measured in our samples, indirect estimates of this scaling must be made. We do this using two approaches.
First, if all baryons are in an un-truncated exponential disc, we can use the SINGG results shown in Fig. 1 and Table 1 to estimate . Noting that the radius containing 50% and 90% of the light of such a disc corresponds to 1.68 and 3.89 times , and converting the mean orbital times in the log from Table 1, then we have estimated from and respectively. Being virtually identical, we take to be the average spin under the pure exponential disc assumption.
Second, we estimate , and thus by scaling from the sample of Kregel et al. (2002) shown in Fig. 4b. They fit models including both an exponential disc and bulge to the light distribution of edge-on galaxies. Their disc model is truncated, yielding a maximum radius , which they find to be on average a factor times larger than . Their sample yields a significantly shorter average Gyr than what we find, probably due to systematic differences in how is determined. If so, then we scale their results to estimate
| (12) |
Following eq. 11, we have for Gyr. Since this scales from an estimate that avoids bulges, it produces a longer scale length and hence higher value than assuming all the light comes from an exponential disc.
In comparison, measurements of typical average spin parameters of halos created in cosmological simulations range from to 0.055 with each simulation set producing a broad distribution that is close to log normal and consistently having a width to 0.23 dex found (Cole & Lacey, 1996; Bullock et al., 2001; Bett et al., 2007; Macciò et al., 2007). Our first estimate, (assuming pure exponential discs) is somewhat below the expectations of cosmological simulations, while the second estimate (from scaling the results of Kregel et al., 2002) is at the low end of the expectations from simulations. The 0.23 dex difference in these estimates is indicative of the systematic uncertainty involved. In addition, neglect of the gaseous disc, or equivalently assuming the same distribution for it as the stars, will underestimate the angular momentum of the baryons, and thus . Improved estimates of can be made with better modelling of the baryonic mass and angular momentum distribution in galaxies (e.g. Obreschkow & Glazebrook, 2014; Butler et al., 2017), but would still require assumptions about the coupling with the unseen DM halo. Our approach using eq. 11 assumes a singular isothermal sphere and , both of which might introduce additional systematic bias in our estimate of .
Despite the likely systematic offset between our observational estimate of (via eq. 11) and its true value, we can nonetheless discuss the relation between the relative scatter in and , or, equivalently, the absolute scatter in and . The observed scatter in of 0.16 dex has several sources: (1) the physical dispersion in , (2) measurement uncertainties in and , (3) variations in the ratio , (4) variations in , (5) deviations from the assumed iso-thermal density profile333this includes variations in the ratio of circular velocity measured over the disc to that at the virial radius, . We assume that (1) is the dominant source, but expect that the other sources make a non-negligible addition to the scatter of . In §2 we (crudely) estimated (2) the scatter in due to measurement errors as 0.06 dex. Removing this (in quadrature), but neglecting (3), (4) and (5), then the scatter in is . This is somewhat lower than predicted by CDM models (0.23 dex Macciò et al., 2008). This is remarkable, given that we haven’t even accounted for the scatter of () coming from the sources (3), (4) and (5).
The explanation for the relatively low scatter in () is likely two-fold. First, to the extent that the disc surface mass density at is similar in all galaxies444In §5.2, below, we show that the surface brightness limits at varies greatly, but this does not preclude the corresponding mass densities just interior to where this limit is found to be similar., then high spin systems are likely to have their disc truncated at smaller radii relative to than low-spin systems. Therefore, the scatter in (source 3) is negatively correlated to that of (source 1), hence reducing the scatter in , relative to the scatter in , which would be similar to the scatter in . is the closest proxy we have to and we do indeed find that the scatter in is less than that of in both the optical and UV samples (Table 1). The effect is more prominent in the UV sample. Secondly, our sample is likely biased towards a more narrow range of spin parameters than present in a volume-complete sample of all DM halos. The lowest- halos have little angular momentum and are more likely to be bulge dominated (i.e. S0 and elliptical galaxies), hence they will have little Hi, and not make it in to our samples. A rationale for our Hi-selection producing a bias against high systems is less obvious. Effectively, all Hi-selected galaxies are detected in the optical and UV (Meurer et al., 2006; Wong, 2007); the detection limits are not biasing the samples. More speculatively, there may be a bias against high systems if the baryons they contain have not been able to cool enough for Hi or stars to form.
5.2 Properties at disc galaxy outskirts
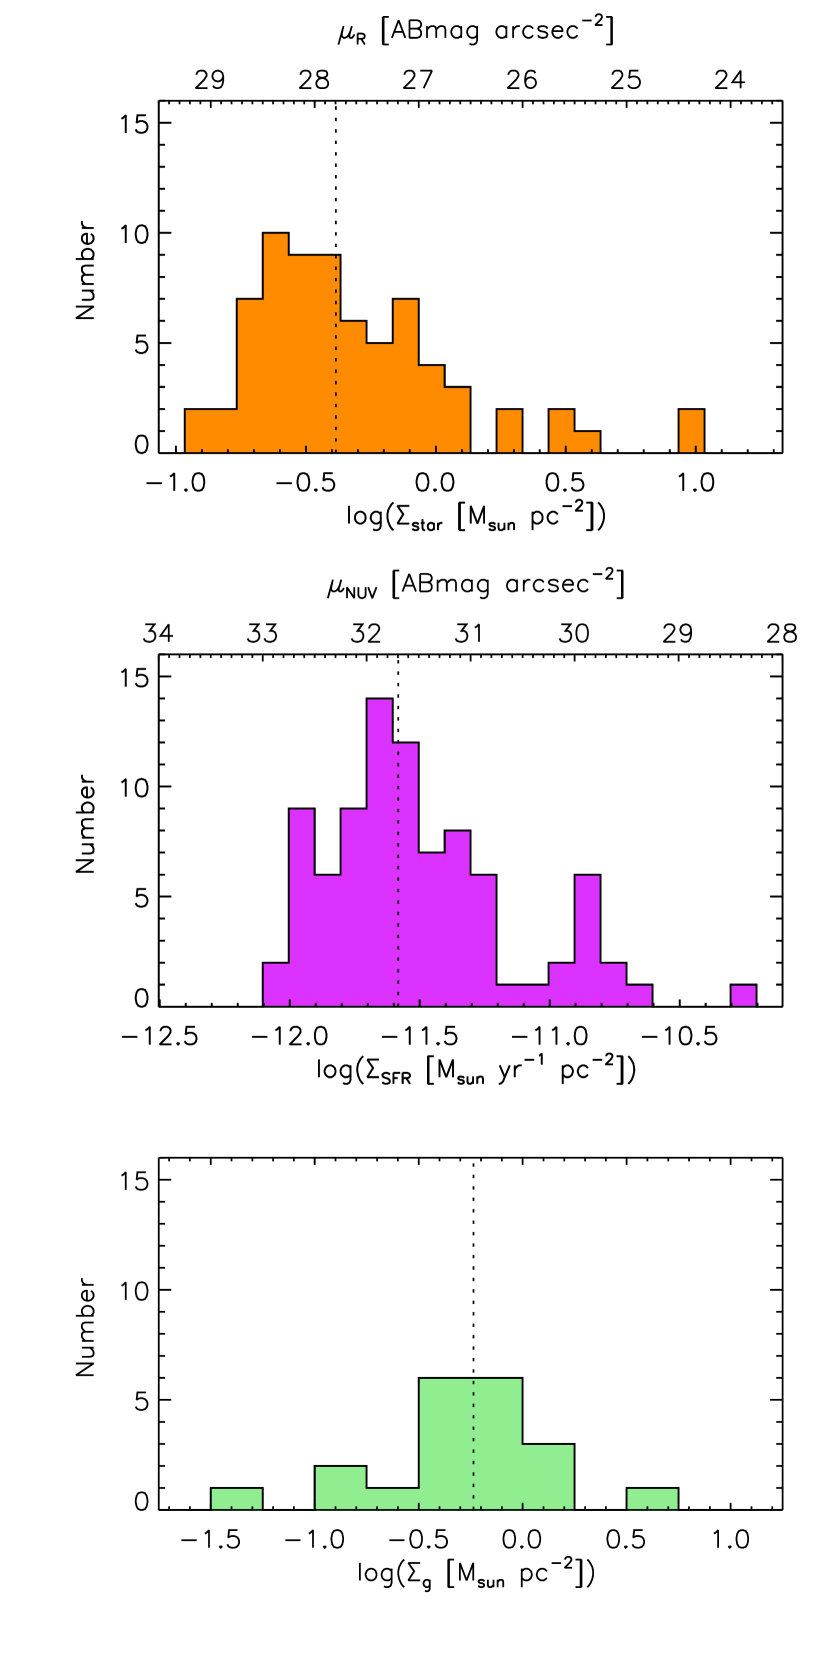
In §2 we defined as the radius of readily detectable emission. It is largely determined by the amplitude of large scale “sky variations” in the R-band (optical) and NUV (ultraviolet). These variations represent how well we can flat field our data. The surface brightness of these variations provide a crude estimate of the limiting surface brightness at, or just interior to, . The situation is slightly different for (Hi) - the limiting surface brightness is the measured at the last measured point in published Hi profiles. Of course, a galaxy may extend beyond at fainter levels than the limiting surface brightness. Histograms of limiting surface brightness are shown in Fig. 6.
The bottom axes of Fig. 6 show the limiting surface brightnesses converted to physically meaningful quantities. The R-band surface brightness is converted to the stellar mass density assuming a mass to light ratio . For standard IMF assumptions, the adopted is reasonable for a star forming population, but probably will result in an underestimate for stellar mass densities if the relevant stellar population is old (Bell et al., 2003). To convert to star formation intensity we adopt the FUV conversion factor of Leroy et al. (2008) and assume an intrinsic colour ABmag, which is reasonable for the outer discs of galaxies (Thilker et al., 2007; Gil de Paz et al., 2007; Zaritsky & Christlein, 2007; Boissier et al., 2008; Hunter et al., 2010; Werk et al., 2010; Goddard et al., 2010; Lee et al., 2011). The ISM density assumes that the ISM is dominated by Hi and is corrected by a factor 1.3 to account for heavier elements.
The medians of the distributions are marked on Fig. 6 and correspond to , , and . These may be considered typical conditions at or near . The star formation intensity at is weak compared to the stellar and gaseous contents. The time needed to form the observed stellar populations at the current star formation intensity is Gyr, while the time required to process the gas through star formation is Gyr. Equivalently both the Specific Star Formation Rate () and the Star Formation Efficiency () are both low in outer discs. Thus at the current in situ star formation is too feeble to either create the stellar populations or transform the accumulated ISM into stars in a reasonable amount of time.
For a galaxy to have the same in the R-band and the NUV implies that the colour at is similar to the “colour” of the large scale sky fluctuations, i.e. ABmag. This is a “green-valley” colour, i.e. intermediate between the blue and red sequences (Schiminovich et al., 2007), validating the long we derive above.
The slope of the relationship in the R-band () is slightly steeper than in the NUV (). Comparison of Fig. 1 and Fig. 2 shows that the values of in the optical and UV are nearly equal at the high end, where , while for we find that on average galaxies have . Hence at (NUV) galaxies are redder for large spirals than dwarfs. This may be due to the relative importance of an old component in the disc or halo for spirals compared to dwarfs. It may also be a sign of “down-sizing” lower mass galaxies are less evolved in to stars than high mass galaxies.
5.3 The edge of the disc
Our results imply a distinct physical edge in the light distribution corresponding to . The first line of evidence for this is the result that the three tracers give nearly identical estimates of ; for a given they yield the same radius in the distribution of stars, star formation, and atomic hydrogen. If discs were purely exponential, then the equality in would be remarkably coincidental, since the different measurements of are set by independent observational limits for each tracer. If the observational limits were consistent within each band, then one could argue that is effectively an isophotal radius. Previous studies (Saintonge et al., 2008; Hall et al., 2012; Saintonge & Spekkens, 2011) have shown that isophotal radii produce tighter relationships than those using an exponential scale length, perhaps because of the difficulty in consistently measuring in the face of contamination from the bulge, breaks in radial profiles, and biases in setting the range of radii to fit with an exponential (Freeman, 1970; Pohlen & Trujillo, 2006; Hall et al., 2012; Zheng et al., 2015). However, as shown by Fig. 6 the limiting surface brightness is not consistent between galaxies, hence is not an isophotal radius.
Indeed, the observed scatter in the relationship provides a second line of evidence that we are dealing with a truncation in the disc. The dispersion in limiting surface brightnesses shown in Fig. 6 is 0.40, 1.05, 0.44 dex in the R-band, NUV, and Hi respectively. Assuming a pure exponential disc and adopting Eq. 12 for the mean scaling between the disc scale length and then these dispersions should contribute 0.08, 0.27, and 0.09 dex to the respective scatter in the relationships, while the corresponding observed scatters are 0.15, 0.16, and 0.18 dex. Thus the expected induced scatter, in this scenario, is larger than the observed scatter in the NUV, while it would make a considerable fraction ( in quadrature) of the observed scatter in the R-band and Hi.
That we are seeing a real edge to the disc is most apparent in the Hi sample. Using the data from MZD13 we find an average power law index for profiles between and (HI) (the uncertainty is the standard error on the mean). If this slope is maintained towards larger , the total Hi content is well constrained. This is unlike the region to , where the Hi traces DM well but , which can not be maintained indefinitely. Modern Hi observations are sufficiently deep that large improvements in sensitivity of observations do not result in large changes to the Hi content. For example, Gentile et al. (2013) present HALOGAS survey data of NGC 3198 with an Hi surface brightness sensitivity ten times fainter than the THINGS observations used by MZD13. Those improved observations result in an increase of 6% in the Hi flux, and 21% (0.08 dex) in maximum radius compared to the THINGS data.
We conclude that discs are not purely exponential all the way to , but must have a steep fall off in surface brightness near . An edge, or steep fall-off, in surface brightness has been noted in the optical by van der Kruit and collaborators (van der Kruit, 2007; Kregel et al., 2002) and in Hi by van Gorkom (1993). Our results are similar to theirs (Fig. 4) indicating that disc has nearly identical truncations at in stars, star formation and atomic hydrogen, and that it is this physical disc truncation that we are observing.
Baryons clearly exist beyond in galaxies. For example at the rotational amplitude of our Galaxy , then Gyr corresponds to . The RC of the Milky Way disc can be traced out to kpc (Sofue et al., 2009; Burch & Cowsik, 2013; Bhattacharjee et al., 2014), while halo blue horizontal branch stars can be detected out to kpc (Xue et al., 2008) and globular clusters out to kpc (e.g. Pal 3; Koch et al., 2009). In M31 the stellar disc can be traced to at least kpc as shown by Ibata et al. (2005). Using their adopted RC (Klypin et al., 2002) Gyr at this radius, nicely consistent with our average at . Ibata et al. (2005) point out that additional fainter disc material may be detected out to 70 kpc, while Ibata et al. (2014) show faint but prominent features at larger radii relate to the halo, which extends to at least 150 kpc, about half the virial radius of kpc (Klypin et al., 2002). Clearly there are stars well beyond where is 1 Gyr in both the Milky Way and M31. But they are primarily located in their host’s halo, rather than disc.
5.4 Alternative mechanisms to truncate discs
The cosmological approach we adopted in Sec. 5.1 implies that discs grow with cosmic time (the dependence) due to accretion. Disc growth is also predicted in simple semi-analytic model extensions to cosmological -body simulations, albeit with weaker growth (Dutton et al., 2011). However, other mechanisms may also be at play in setting the extent of galactic discs. These include the limitations in the angular momentum in an initial proto-galactic collapse (van der Kruit, 1987), truncation in star formation due to disc stabilisation (Kennicutt, 1989; Martin & Kennicutt, 2001) ionisation by the UV background (UVB; van Gorkom, 1993), and spreading of the disc due to internal angular momentum transfer (Roškar et al., 2008a, b).
The fact that we see the linear expected for the cosmological accretion scenario, is a strong argument in its favour. Likewise, simple semi-analytic models of galaxy evolution that incorporate accretion can account for the redshift evolution of the RV relationship and other virial scaling relations (Dutton et al., 2011). However, “smoking-gun” observations of intergalactic gas being “caught in the act” of accreting on to galaxies have been elusive. In a naive interpretation of the accretion scenario, one would expect outer discs to be largely gaseous. Instead, the equality of in the R-band and Hi combined with the near equality of and in the outer discs implied by Fig. 6 suggests that they are well evolved in to stars (albeit typically less so than inner disc). This conclusion should be considered tentative since our methods for estimating the various values as well as and are crude.
An older scenario for producing a truncated but evolved outer disc is the concept of a rapid initial collapse of galaxies including their discs (Eggen et al., 1962; Freeman, 1970). van der Kruit (1987) shows that an initial uniformly rotating spherical gas cloud in a potential with a flat RC that collapses while conserving angular momentum will produce an exponential disc that truncates at 4.5 times the disc scale length. In practise, Kregel et al. (2002) found that stellar discs truncate at , i.e. somewhat smaller. However, as argued in §5.2, they are likely measuring shorter values than we do. Indeed, van der Kruit (2007) notes that the truncations examined by Kregel et al. (2002) correspond to to 27.5 mag arcsec-2, brighter than our estimates of the surface brightness at (Fig. 6). The fact that van der Kruit (2007) often find Hi beyond their optical truncation radii is consistent with them underestimating compared to us, since our Hi and optical values are consistent. When we scale their results to our (eq. 12) then we find that the ratio between and is a factor , consistent with what is expected from a monolithic early collapse.
Kennicutt (1989) note that star formation, as traced by Hii regions in spiral galaxies, typically cuts-off at a radius , beyond which few bright Hii regions are detected. Martin & Kennicutt (2001) confirmed this result with improved observations of more galaxies. Figure 4b plots for five galaxies from Martin & Kennicutt (2001) which are also in the sample of MZD13. The values (which correspond to to 390 Myr) are considerably smaller than the values in our primary samples, but similar to the break radius of the PS1 sample. Christlein et al. (2010) find that the H distribution of edge-on spirals typically has a downward break at which they note may correspond to the break. This scaling is very close to the scaling we find for the PS1 sample, strengthening the notion that and are related. The fact that Christlein et al. (2010) find H emission beyond their break radius and the SUNGG UV measurements continue out to demonstrates that the limits of galaxies traced by prominent Hii regions does not measure the full extent of star formation in galactic discs.
Instead, UV emission is a better tracer of star formation in outer discs. The existence of extended UV (XUV) discs (Gil de Paz et al., 2005; Thilker et al., 2005; Thilker et al., 2007) demonstrates that star formation can extend beyond the portion of the disc readily observed in the optical. These outer discs can also be probed using resolved stellar populations from the ground (Cuillandre et al., 2001; Ibata et al., 2005) or space (e.g. Bruzzese et al., 2015). The close match in the RV relationships at shown in Fig. 4 implies that star formation extends to the limits of the Hi disc.
One mechanism that has been promoted for limiting the extent of galaxy discs is ionisation by the UVB posited by van Gorkom (1993) to explain the the steep decline in profiles at large in NGC 3198 and other galaxies. The scenario was consistent with modelling of the time (Maloney, 1993). The column densities he considered are similar to or somewhat smaller than the typical we find at (Hi). If ionisation by the background is setting (Hi) then one should be able to detect emission from the ionised disc beyond . Bland-Hawthorn et al. (1997) present evidence for finding this emission in the outer disc of NGC 253. However, other searches for ionized disc gas beyond the Hi edges of galaxies have not been successful (e.g. Madsen et al., 2001; Dicaire et al., 2008; Hlavacek-Larrondo et al., 2011; Adams et al., 2011). Recent very deep integral field spectroscopy of the outermost disc of UGC 7321 finds very low surface brightness H, consistent with ionisation by the UVB, but this emission does not extend beyond the contour (Fumagalli et al., 2017). While UVB may ionize the “skin” of Hi discs, ionized gas does not extend much beyond the observable Hi disc which marks the true maximum extent of the cool ISM disc.
Roškar et al. (2008a,b) model the interplay between star formation and disc dynamics in isolated spiral galaxies. Their simulations produce star formation edges like that seen seen by Kennicutt (1989) and Martin & Kennicutt (2001), beyond which the gaseous part of the disc has a high Toomre (1964) disc stability parameter and thus produces little in situ star formation. Instead, most of the old stars at large radii formed at smaller radii and “migrated” outwards due to resonances with transient spiral features. Such a process can explain the downward breaking surface brightness profiles, “U” shaped age and colour profiles commonly seen in spiral galaxies (e.g. Pohlen & Trujillo, 2006; Bakos & Trujillo, 2013; Zheng et al., 2015). The material in discs between and may then be a combination of weak XUV disc star formation in the stable portion of the disc combined with outwardly migrating older stars. While this scenario is appealing, it is not obvious how it would result in a linear relation largely consistent at different wavelengths down to the dwarf galaxy regime. Low mass galaxies are also a concern because they do not have spiral density waves that are likely to drive radial migrations.
5.5 Other implications
There is a strong relationship between the Hi radius and Hi mass in galaxies of the form
| (13) |
This was emphasised recently by Wang et al. (2016) who note that it has been found for samples selected in a wide variety of ways (Broeils & Rhee, 1997; Verheijen & Sancisi, 2001; Swaters et al., 2002; Noordermeer et al., 2005; Wang et al., 2013). The correlation implies that the average Hi surface brightness within is constant. The scatter in this relationship is 0.06 dex, tighter than our relationship. The relationship at is peripherally related to this result. It has long been known that a maximum is set by the conversion of the interstellar medium into a molecular form (e.g. Bigiel et al., 2008), and many galaxies reach this saturation in their central regions. The outer radius adopted by Wang et al. (2016) is where brighter than adopted for our Hi sample (MZD13). This effectively limits the range of allowed average surface brightness. Within galaxies, Hi has a predictable distribution giving a power-law fall-off in , which is apparently set by the disc maintaining a constant stability parameter (Meurer et al., 2013; Wong et al., 2016). The limited dynamic range of , combined with the shallow power law radial profile, results in the narrow range of average .
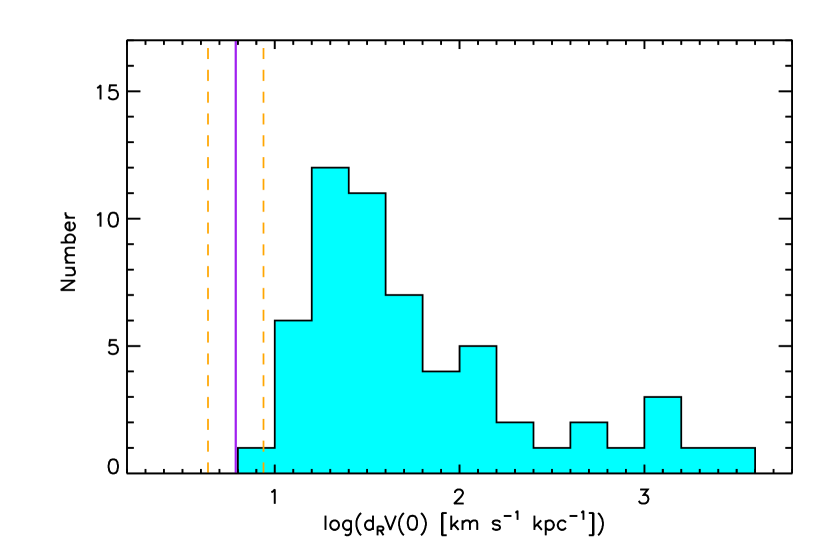
Since radial density profiles typically decrease monotonically with , the central density should not be less than the average density at . This corresponds to a constraint on the slope of the inner RC of galaxies - the gradient should not be less than that implied by the relation at , hence the orbital time should be less than or equal to Gyr in the central parts of galaxies. Figure 7 tests this assertion by plotting the histogram of central velocity gradients, for 57 galaxies comprising the final sample of Lelli et al. (2013) with valid measurements. The dashed line shows the gradient corresponding to . There are no galaxies with a shallower gradient. The shallowest in their sample corresponds to the irregular galaxy IC 2574 (de Blok et al., 2008). Following the discussion in §4 and §5, a galaxy with a central density less than would have had to have collapsed less than our samples, and that would mean they either have a higher or (i.e. they have a larger fraction of the spin in the disc than the fraction of mass in the disc) or some combination of the two. Apparently such galaxies have not (yet) formed.
6 Conclusions
We have shown that disc galaxies display a nearly linear radius versus velocity () relationship at the outermost radius observed in the optical, ultraviolet, and Hi emission at 21cm. The relationship is consistent between data sets and implies a constant orbital time of 1 Gyr at this radius. A comparison of our Hi selected and optically measured SINGG sample with the much larger optically selected and measured PS1 sample of Zheng et al. (2015) shows nearly identical relations at two fiducial radii. This suggests our results are robust against the vagaries of sample selection and may be generic to disc galaxies in the low redshift Universe. Within , matter has collapsed by a factor of 37 to , a factor times higher than the present day average matter density in the Universe.
We argue that in our data sets corresponds to the edge of the disc. Recent studies indicate that (Hi) is limited by the available ISM in the disc rather than external ionisation by the ultraviolet background. The star formation intensity at is an order of magnitude too weak to build up the existing stellar populations or consume the available gas within a Hubble time. Hence, star formation at its current rate is not solely responsible for setting this radius. While appears to mark a sharp truncation in the disc of galaxies, it does not enclose all baryons. Stars in the halo are distributed to much larger radii, and their kinematics indicate the dark matter also extends further, likely to the virial radius.
Instead must be set by other processes such as accretion (e.g. Sancisi et al., 2008; Brook et al., 2012; Mollá et al., 2016). Continuous cosmic accretion provides a natural explanation for the relation. In that scenario, the relation gives a constraint on the average spin parameter, which we estimate to be in the range to 0.035. This estimate is likely to be biased due to the crudeness of our estimates and the requirement for Hi in our samples which will bias them against the typically gas poor and low spin elliptical and S0 galaxies. The scatter in the orbital times provides a constraint on the dispersion of spin parameters dex, somewhat smaller than expected by theory ( dex), probably also due in part to the previously mentioned biases. The scatter in orbital times may also underestimate that in if corresponds to a consistent disc surface brightness or mass density.
An older theory, consistent with our results, is that is set by a rapid early collapse. Unfortunately, this scenario does not make a prediction on the relationship. However, a crude estimate of the scaling of with disc scale length (following the results of Kregel et al., 2002) is consistent with long-standing theoretical predictions for this scenario ( van der Kruit, 1987). Our estimates of the gas and stellar surface densities near are very similar, indicating a high degree of evolution of outer discs. The relatively flat metallicity gradients in the outskirts of galaxies also indicates a high degree of chemical evolution in disc outskirts (Werk et al., 2010, 2011). Hence an early rapid collapse model is nominally consistent with our results. However, our estimates of and the surface densities at are crude. Better estimates are needed to test this interpretation.
The relationship has some practical implications. Since the conversion of angular to physical radius is distance dependent, while the conversion of velocities is not (to first order), then one could use our relationship to estimate distances. However, since the observed relationship is linear it is not as powerful as the TFR where luminosity goes as orbital velocity to a power of three to four (e.g. Meyer et al., 2008). Furthermore, due to the likely evolution in this relationship (Dutton et al., 2011) one must take care to limit its use to the local universe.
A simple scaling relation provides a convenient tool to estimate the extent of galaxy discs. We used the found here in the model we developed to explain the nearly constant ratio of star formation rate (as traced in the ultraviolet) to the Hi mass (Wong et al., 2016). Further development of this model would be useful for determining a wide range of properties along the star forming main sequence of galaxies. Of particular relevance would be using such an approach, combined with observed column density distributions within galaxies, to model the likely cross-section of Hi absorbers (e.g. Rao & Briggs, 1993; Ryan-Weber et al., 2003, 2005; Zwaan et al., 2005; Braun, 2012). Similarly a realistic disc truncation radius could be usefully employed in setting the initial conditions for detailed dynamical simulations of local galaxies, or for modelling the inclusion of baryons in semi-analytic models.
Acknowledgments
GRM acknowledges useful discussions with Tim Heckman, Brent Tully, Ken Freeman, Joss Bland-Hawthorn, Emma Ryan-Weber, and Martin Zwaan. GRM also thanks the Center for Astrophysical Sciences of the Johns Hopkins University, and the National Astronomical Observatories of the Chinese Academy of Sciences for their hospitality during visits while this paper was being developed. ZZ is supported by the National Natural Science Foundation of China Grant No. 11703036. Partial funding for the SINGG and SUNGG surveys came from NASA grants NAG5-13083 (LTSA program), GALEX GI04-0105-0009 (NASA GALEX Guest Investigator grant), and NNX09AF85G (GALEX archival grant) to G.R. Meurer. The SINGG observations were made possible by a generous allocation of time from the Survey Program of the National Optical Astronomy Observatory (NOAO), which is operated by the Association of Universities for Research in Astronomy (AURA), Inc., under a cooperative agreement with the National Science Foundation. GALEX is a NASA Small Explorer, launched in 2003 April. We gratefully acknowledge NASA’s support for construction, operation and science analysis for the GALEX mission, developed in cooperation with the Centre National d’Etudes Spatiales of France and the Korean Ministry of Science and Technology. This research has made use of the NASA/IPAC Extragalactic Database (NED), which is operated by the Jet Propulsion Laboratory, California Institute of Technology, under contract with the National Aeronautics and Space Administration.
References
- Adams et al. (2011) Adams J. J., Uson J. M., Hill G. J., MacQueen P. J., 2011, ApJ, 728, 107
- Bakos & Trujillo (2013) Bakos J., Trujillo I., 2013, Mem. Soc. Astron. Italiana Sup., 25, 21
- Bell et al. (2003) Bell E. F., McIntosh D. H., Katz N., Weinberg M. D., 2003, ApJS, 149, 289
- Bett et al. (2007) Bett P., Eke V., Frenk C. S., Jenkins A., Helly J., Navarro J., 2007, MNRAS, 376, 215
- Bhattacharjee et al. (2014) Bhattacharjee P., Chaudhury S., Kundu S., 2014, ApJ, 785, 63
- Bigiel et al. (2008) Bigiel F., Leroy A., Walter F., Brinks E., de Blok W. J. G., Madore B., Thornley M. D., 2008, AJ, 136, 2846
- Bland-Hawthorn et al. (1997) Bland-Hawthorn J., Freeman K. C., Quinn P. J., 1997, ApJ, 490, 143
- Boissier et al. (2008) Boissier S., Gil de Paz A., Boselli A., Buat V., Madore B., Chemin L., Balkowski C., Amram P., et al., 2008, ApJ, 681, 244
- Bonoli et al. (2016) Bonoli S., Mayer L., Kazantzidis S., Madau P., Bellovary J., Governato F., 2016, MNRAS, 459, 2603
- Bosma (1981) Bosma A., 1981, AJ, 86, 1825
- Braun (2012) Braun R., 2012, ApJ, 749, 87
- Broeils & Rhee (1997) Broeils A. H., Rhee M.-H., 1997, A&A, 324, 877
- Brook et al. (2012) Brook C. B., Stinson G. S., Gibson B. K., Kawata D., House E. L., Miranda M. S., Macciò A. V., Pilkington K., et al., 2012, MNRAS, 426, 690
- Bruzzese et al. (2015) Bruzzese S. M., Meurer G. R., Lagos C. D. P., Elson E. C., Werk J. K., Blakeslee J. P., Ford H., 2015, MNRAS, 447, 618
- Bullock et al. (2001) Bullock J. S., Dekel A., Kolatt T. S., Kravtsov A. V., Klypin A. A., Porciani C., Primack J. R., 2001, ApJ, 555, 240
- Burch & Cowsik (2013) Burch B., Cowsik R., 2013, ApJ, 779, 35
- Butler et al. (2017) Butler K. M., Obreschkow D., Oh S.-H., 2017, ApJ, 834, L4
- Calzetti et al. (1994) Calzetti D., Kinney A. L., Storchi-Bergmann T., 1994, ApJ, 429, 582
- Cappellari et al. (2012) Cappellari M., McDermid R. M., Alatalo K., Blitz L., Bois M., Bournaud F., Bureau M., Crocker A. F., et al., 2012, Nature, 484, 485
- Catinella et al. (2006) Catinella B., Giovanelli R., Haynes M. P., 2006, ApJ, 640, 751
- Chambers et al. (2016) Chambers K. C., Magnier E. A., Metcalfe N., Flewelling H. A., Huber M. E., Waters C. Z., Denneau L., Draper P. W., et al., 2016, MNRAS (submitted), p. arXiv:1612.05560
- Christlein et al. (2010) Christlein D., Zaritsky D., Bland-Hawthorn J., 2010, MNRAS, 405, 2549
- Cole & Lacey (1996) Cole S., Lacey C., 1996, MNRAS, 281, 716
- Conroy & van Dokkum (2012) Conroy C., van Dokkum P. G., 2012, ApJ, 760, 71
- Courteau et al. (2007) Courteau S., Dutton A. A., van den Bosch F. C., MacArthur L. A., Dekel A., McIntosh D. H., Dale D. A., 2007, ApJ, 671, 203
- Cuillandre et al. (2001) Cuillandre J.-C., Lequeux J., Allen R. J., Mellier Y., Bertin E., 2001, ApJ, 554, 190
- de Blok et al. (2008) de Blok W. J. G., Walter F., Brinks E., Trachternach C., Oh S.-H., Kennicutt R. C., 2008, AJ, 136, 2648
- Dicaire et al. (2008) Dicaire I., Carignan C., Amram P., Marcelin M., Hlavacek-Larrondo J., de Denus-Baillargeon M. M., Daigle O., Hernandez O., 2008, AJ, 135, 2038
- Dutton et al. (2012) Dutton A. A., Mendel J. T., Simard L., 2012, MNRAS, 422, L33
- Dutton et al. (2007) Dutton A. A., van den Bosch F. C., Dekel A., Courteau S., 2007, ApJ, 654, 27
- Dutton et al. (2011) Dutton A. A., van den Bosch F. C., Faber S. M., Simard L., Kassin S. A., Koo D. C., Bundy K., Huang J., et al., 2011, MNRAS, 410, 1660
- Eggen et al. (1962) Eggen O. J., Lynden-Bell D., Sandage A. R., 1962, ApJ, 136, 748
- Epinat et al. (2008) Epinat B., Amram P., Marcelin M., Balkowski C., Daigle O., Hernandez O., Chemin L., Carignan C., et al., 2008, MNRAS, 388, 500
- Fall & Efstathiou (1980) Fall S. M., Efstathiou G., 1980, MNRAS, 193, 189
- Freeman (1970) Freeman K. C., 1970, ApJ, 160, 811
- Fumagalli et al. (2017) Fumagalli M., Haardt F., Theuns T., Morris S. L., Cantalupo S., Madau P., Fossati M., 2017, MNRAS, 467, 4802
- Gentile et al. (2013) Gentile G., Józsa G. I. G., Serra P., Heald G. H., de Blok W. J. G., Fraternali F., Patterson M. T., Walterbos R. A. M., et al., 2013, A&A, 554, A125
- Gil de Paz et al. (2007) Gil de Paz A., Boissier S., Madore B. F., Seibert M., Joe Y. H., Boselli A., Wyder T. K., Thilker D., et al., 2007, ApJS, 173, 185
- Gil de Paz et al. (2005) Gil de Paz A., Madore B. F., Boissier S., Swaters R., Popescu C. C., Tuffs R. J., Sheth K., Kennicutt R. C., et al., 2005, ApJ, 619, L29
- Goddard et al. (2010) Goddard Q. E., Kennicutt R. C., Ryan-Weber E. V., 2010, MNRAS, 405, 2791
- Gordon et al. (2001) Gordon K. D., Misselt K. A., Witt A. N., Clayton G. C., 2001, ApJ, 551, 269
- Governato et al. (2010) Governato F., Brook C., Mayer L., Brooks A., Rhee G., Wadsley J., Jonsson P., Willman B., et al., 2010, Nature, 463, 203
- Graham et al. (2005) Graham A. W., Driver S. P., Petrosian V., Conselice C. J., Bershady M. A., Crawford S. M., Goto T., 2005, AJ, 130, 1535
- Grebel (1997) Grebel E. K., 1997, Rev. Mod. Astron., 10, 29
- Gunawardhana et al. (2011) Gunawardhana M. L. P., Hopkins A. M., Sharp R. G., Brough S., Taylor E., Bland-Hawthorn J., Maraston C., Tuffs R. J., et al., 2011, MNRAS, 415, 1647
- Hall et al. (2012) Hall M., Courteau S., Dutton A. A., McDonald M., Zhu Y., 2012, MNRAS, 425, 2741
- Hlavacek-Larrondo et al. (2011) Hlavacek-Larrondo J., Marcelin M., Epinat B., Carignan C., de Denus-Baillargeon M. M., Daigle O., Hernandez O., 2011, MNRAS, 416, 509
- Hoversten & Glazebrook (2008) Hoversten E. A., Glazebrook K., 2008, ApJ, 675, 163
- Hubble (1926) Hubble E. P., 1926, ApJ, 64, 321
- Hunter et al. (2010) Hunter D. A., Elmegreen B. G., Ludka B. C., 2010, AJ, 139, 447
- Ibata et al. (2005) Ibata R., Chapman S., Ferguson A. M. N., Lewis G., Irwin M., Tanvir N., 2005, ApJ, 634, 287
- Ibata et al. (2014) Ibata R. A., Lewis G. F., McConnachie A. W., Martin N. F., Irwin M. J., Ferguson A. M. N., Babul A., Bernard E. J., et al., 2014, ApJ, 780, 128
- Isobe et al. (1990) Isobe T., Feigelson E. D., Akritas M. G., Babu G. J., 1990, ApJ, 364, 104
- Kauffmann et al. (2003) Kauffmann G., Heckman T. M., White S. D. M., Charlot S., Tremonti C., Peng E. W., Seibert M., Brinkmann J., et al., 2003, MNRAS, 341, 54
- Kennicutt (1989) Kennicutt R. C., 1989, ApJ, 344, 685
- Klypin et al. (2002) Klypin A., Zhao H., Somerville R. S., 2002, ApJ, 573, 597
- Koch et al. (2009) Koch A., Côté P., McWilliam A., 2009, A&A, 506, 729
- Koribalski et al. (2004) Koribalski B. S., Staveley-Smith L., Kilborn V. A., Ryder S. D., Kraan-Korteweg R. C., Ryan-Weber E. V., Ekers R. D., Jerjen H., et al., 2004, AJ, 128, 16
- Kregel et al. (2002) Kregel M., van der Kruit P. C., de Grijs R., 2002, MNRAS, 334, 646
- Lee et al. (2011) Lee J. C., Gil de Paz A., Kennicutt R. C. J., Bothwell M., Dalcanton J., José G Funes S. J., Johnson B. D., Sakai S., et al., 2011, ApJS, 192, 6
- Lee et al. (2009) Lee J. C., Gil de Paz A., Tremonti C., Kennicutt R. C., Salim S., Bothwell M., Calzetti D., Dalcanton J., et al., 2009, ApJ, 706, 599
- Lelli et al. (2013) Lelli F., Fraternali F., Verheijen M., 2013, MNRAS, 433, L30
- Leroy et al. (2008) Leroy A. K., Walter F., Brinks E., Bigiel F., de Blok W. J. G., Madore B., Thornley M. D., 2008, AJ, 136, 2782
- Macciò et al. (2008) Macciò A. V., Dutton A. A., van den Bosch F. C., 2008, MNRAS, 391, 1940
- Macciò et al. (2007) Macciò A. V., Dutton A. A., van den Bosch F. C., Moore B., Potter D., Stadel J., 2007, MNRAS, 378, 55
- McGaugh et al. (2000) McGaugh S. S., Schombert J. M., Bothun G. D., De Blok W., 2000, ApJ, 533, L99
- Madsen et al. (2001) Madsen G. J., Reynolds R. J., Haffner L. M., Tufte S. L., Maloney P. R., 2001, ApJ, 560, L135
- Maloney (1993) Maloney P., 1993, ApJ, 414, 41
- Martin & Kennicutt (2001) Martin C. L., Kennicutt R. C., 2001, ApJ, 555, 301
- Mathewson et al. (1992) Mathewson D. S., Ford V. L., Buchhorn M., 1992, ApJS, 81, 413
- Meurer et al. (2006) Meurer G. R., Hanish D. J., Ferguson H. C., Knezek P. M., Kilborn V. A., Putman M. E., Smith R. C., Koribalski B., et al., 2006, ApJS, 165, 307
- Meurer et al. (2009) Meurer G. R., Wong O. I., Kim J. H., Hanish D. J., Heckman T. M., Werk J., Bland-Hawthorn J., Dopita M. A., et al., 2009, ApJ, 695, 765
- Meurer et al. (2013) Meurer G. R., Zheng Z., de Blok W. J. G., 2013, MNRAS, 429, 2537
- Meyer et al. (2008) Meyer M. J., Zwaan M. A., Webster R. L., Schneider S., Staveley-Smith L., 2008, MNRAS, 391, 1712
- Meyer et al. (2004) Meyer M. J., Zwaan M. A., Webster R. L., Staveley-Smith L., Ryan-Weber E., Drinkwater M. J., Barnes D. G., Howlett M., et al., 2004, MNRAS, 350, 1195
- Mo et al. (1998) Mo H. J., Mao S., White S. D. M., 1998, MNRAS, 295, 319
- Mollá et al. (2016) Mollá M., Díaz Á. I., Gibson B. K., Cavichia O., López-Sánchez Á.-R., 2016, MNRAS, 462, 1329
- Navarro et al. (1997) Navarro J. F., Frenk C. S., White S. D. M., 1997, ApJ, 490, 493
- Noordermeer et al. (2005) Noordermeer E., van der Hulst J. M., Sancisi R., Swaters R. A., van Albada T. S., 2005, A&A, 442, 137
- Obreschkow & Glazebrook (2014) Obreschkow D., Glazebrook K., 2014, ApJ, 784, 26
- Oh et al. (2011) Oh S.-H., Brook C., Governato F., Brinks E., Mayer L., de Blok W. J. G., Brooks A., Walter F., 2011, AJ, 142, 24
- Persic & Salucci (1991) Persic M., Salucci P., 1991, ApJ, 368, 60
- Persic et al. (1996) Persic M., Salucci P., Stel F., 1996, MNRAS, 281, 27
- Petrosian (1976) Petrosian V., 1976, ApJ, 209, L1
- Planck Collaboration et al. (2014) Planck Collaboration Ade P. A. R., Aghanim N., Armitage-Caplan C., Arnaud M., Ashdown M., Atrio-Barandela F., Aumont J., et al., 2014, A&A, 571, A16
- Pohlen & Trujillo (2006) Pohlen M., Trujillo I., 2006, A&A, 454, 759
- Posti et al. (2018) Posti L., Pezzulli G., Fraternali F., Di Teodoro E. M., 2018, MNRAS, 475, 232
- Rao & Briggs (1993) Rao S., Briggs F., 1993, ApJ, 419, 515
- Reyes et al. (2011) Reyes R., Mandelbaum R., Gunn J. E., Pizagno J., Lackner C. N., 2011, MNRAS, 417, 2347
- Roškar et al. (2008a) Roškar R., Debattista V. P., Stinson G. S., Quinn T. R., Kaufmann T., Wadsley J., 2008a, ApJ, 675, L65
- Roškar et al. (2008b) Roškar R., Debattista V. P., Quinn T. R., Stinson G. S., Wadsley J., 2008b, ApJ, 684, L79
- Rubin et al. (1978) Rubin V. C., Thonnard N., Ford W. K. J., 1978, ApJ, 225, L107
- Ryan-Weber et al. (2003) Ryan-Weber E. V., Webster R. L., Staveley-Smith L., 2003, MNRAS, 343, 1195
- Ryan-Weber et al. (2005) Ryan-Weber E. V., Webster R. L., Staveley-Smith L., 2005, MNRAS, 356, 1600
- Saintonge et al. (2008) Saintonge A., Masters K. L., Marinoni C., Spekkens K., Giovanelli R., Haynes M. P., 2008, A&A, 478, 57
- Saintonge & Spekkens (2011) Saintonge A., Spekkens K., 2011, ApJ, 726, 77
- Sancisi et al. (2008) Sancisi R., Fraternali F., Oosterloo T., van der Hulst T., 2008, A&ARv, 15, 189
- Schiminovich et al. (2007) Schiminovich D., Wyder T. K., Martin D. C., Johnson B. D., Salim S., Seibert M., Treyer M. A., Budavári T., et al., 2007, ApJS, 173, 315
- Sérsic (1963) Sérsic J. L., 1963, Boletin de la Asociacion Argentina de Astronomia, 6, 41
- Simons et al. (2015) Simons R. C., Kassin S. A., Weiner B. J., Heckman T. M., Lee J. C., Lotz J. M., Peth M., Tchernyshyov K., 2015, MNRAS, 452, 986
- Smith et al. (2012) Smith R. J., Lucey J. R., Carter D., 2012, MNRAS, 426, 2994
- Sofue et al. (2009) Sofue Y., Honma M., Omodaka T., 2009, PASJ, 61, 227
- Swaters et al. (2002) Swaters R. A., van Albada T. S., van der Hulst J. M., Sancisi R., 2002, A&A, 390, 829
- Thilker et al. (2005) Thilker D. A., Bianchi L., Boissier S., Gil de Paz A., Madore B. F., Martin D. C., Meurer G. R., Neff S. G., et al., 2005, ApJ, 619, L79
- Thilker et al. (2007) Thilker D. A., Bianchi L., Meurer G. R., Gil de Paz A., Boissier S., Madore B. F., Boselli A., Ferguson A. M. N., et al., 2007, ApJS, 173, 538
- Tolstoy et al. (2009) Tolstoy E., Hill V., Tosi M., 2009, ARAA, 47, 371
- Toomre (1964) Toomre A., 1964, ApJ, 139, 1217
- Treu et al. (2010) Treu T., Auger M. W., Koopmans L. V. E., Gavazzi R., Marshall P. J., Bolton A. S., 2010, ApJ, 709, 1195
- Tuffs et al. (2004) Tuffs R. J., Popescu C. C., Völk H. J., Kylafis N. D., Dopita M. A., 2004, A&A, 419, 821
- Tully & Fisher (1977) Tully R. B., Fisher J. R., 1977, A&A, 54, 661
- van der Kruit (1987) van der Kruit P. C., 1987, A&A, 173, 59
- van der Kruit (2007) van der Kruit P. C., 2007, A&A, 466, 883
- van Dokkum & Conroy (2012) van Dokkum P. G., Conroy C., 2012, ApJ, 760, 70
- van Gorkom (1993) van Gorkom J., 1993, The Environment and Evolution of Galaxies, Astronomy and Space Sciences Library, 188, 345
- Verheijen & Sancisi (2001) Verheijen M. A. W., Sancisi R., 2001, A&A, 370, 765
- Wang et al. (2013) Wang J., Kauffmann G., Józsa G. I. G., Serra P., van der Hulst T., Bigiel F., Brinchmann J., Verheijen M. A. W., et al., 2013, MNRAS, 433, 270
- Wang et al. (2016) Wang J., Koribalski B. S., Serra P., van der Hulst T., Roychowdhury S., Kamphuis P., Chengalur J. N., 2016, MNRAS, 460, 2143
- Weisz et al. (2011) Weisz D. R., Dalcanton J. J., Williams B. F., Gilbert K. M., Skillman E. D., Seth A. C., Dolphin A. E., McQuinn K. B. W., et al., 2011, ApJ, 739, 5
- Werk et al. (2010) Werk J. K., Putman M. E., Meurer G. R., Ryan-Weber E. V., Kehrig C., Thilker D. A., Bland-Hawthorn J., Drinkwater M. J., et al., 2010, AJ, 139, 279
- Werk et al. (2011) Werk J. K., Putman M. E., Meurer G. R., Santiago-Figueroa N., 2011, ApJ, 735, 71
- Werk et al. (2010) Werk J. K., Putman M. E., Meurer G. R., Thilker D. A., Allen R. J., Bland-Hawthorn J., Kravtsov A., Freeman K., 2010, ApJ, 715, 656
- Williams et al. (2011) Williams B. F., Dalcanton J. J., Johnson L. C., Weisz D. R., Seth A. C., Dolphin A., Gilbert K. M., Skillman E., et al., 2011, ApJ, 734, L22
- Wong (2007) Wong O. I., 2007, PhD Thesis, p. 20
- Wong et al. (2016) Wong O. I., Meurer G. R., Zheng Z., Heckman T. M., Thilker D. A., Zwaan M. A., 2016, MNRAS, 460, 1106
- Xue et al. (2008) Xue X. X., Rix H.-W., Zhao G., Re Fiorentin P., Naab T., Steinmetz M., van den Bosch F. C., Beers T. C., et al., 2008, ApJ, 684, 1143
- Zaritsky & Christlein (2007) Zaritsky D., Christlein D., 2007, AJ, 134, 135
- Zheng et al. (2015) Zheng Z., Thilker D. A., Heckman T. M., Meurer G. R., Burgett W. S., Chambers K. C., Huber M. E., Kaiser N., et al., 2015, ApJ, 800, 120
- Zwaan et al. (2004) Zwaan M. A., Meyer M. J., Webster R. L., Staveley-Smith L., Drinkwater M. J., Barnes D. G., Bhathal R., de Blok W. J. G., et al., 2004, MNRAS, 350, 1210
- Zwaan et al. (2005) Zwaan M. A., van der Hulst J. M., Briggs F. H., Verheijen M. A. W., Ryan-Weber E. V., 2005, MNRAS, 364, 1467