Unveiling the physical conditions of the youngest disks:
Abstract
Context. Protoplanetary disks have been studied extensively, both physically and chemically, to understand the environment in which planets form. However, the first steps of planet formation are likely to occur already when the protostar and disk are still embedded in their natal envelope. The initial conditions for planet formation may thus be provided by these young embedded disks, of which the physical and chemical structure is poorly characterized.
Aims. We aim to constrain the midplane temperature structure, one of the critical unknowns, of the embedded disk around L1527. In particular, we set out to determine whether there is an extended cold outer region where CO is frozen out, as is the case for Class II disks. This will show whether young disks are indeed warmer than their more evolved counterparts, as is predicted by physical models.
Methods. We use archival ALMA data of 13CO , C18O and N2D to directly observe the midplane of the near edge-on L1527 disk. The optically thick CO isotopologues allow us to derive a radial temperature profile for the disk midplane, while N2D+, which can only be abundant when CO is frozen out, provides an additional constraint on the temperature. Moreover, the effect of CO freeze-out on the 13CO, C18O and N2D+ emission is investigated using 3D radiative transfer modeling.
Results. Optically thick 13CO and C18O emission is observed throughout the disk and inner envelope, while N2D+ is not detected. Both CO isotopologues have brightness temperatures 25 K along the midplane. Disk and envelope emission can be disentangled kinematically, because the largest velocities are reached in the disk. A power law radial temperature profile constructed using the highest midplane temperature at these velocities suggest that the temperature is above 20 K out to at least 75 AU, and possibly throughout the entire 125 AU disk. The radiative transfer models show that a model without CO freeze-out in the disk matches the C18O observations better than a model with the CO snowline at 70 AU. In addition, there is no evidence for a large (order of magnitude) depletion of CO.
Conclusions. The disk around L1527 is likely to be warm enough to have CO present in the gas phase throughout the disk, suggesting that young embedded disks can indeed be warmer than the more evolved Class II disks.
Key Words.:
ISM: individual objects: L1527 – ISM: molecules – stars: protostars1 Introduction
Disks around young stars play a fundamental role in the star and planet formation process by regulating mass accretion and providing the mass reservoirs for forming planets. The physical structure of the disk is intimately related to its chemical structure, which in turn determines the initial planet composition. Many studies have therefore focused on the evolved protoplanetary disks around pre-main sequence stars, and these Class II disks are now becoming well characterized both physically (e.g., Andrews et al. 2010; Schwarz et al. 2016; Ansdell et al. 2016) and chemically (e.g., Dutrey et al. 1997; Thi et al. 2004; Öberg et al. 2010; Huang et al. 2017). The thermal and chemical structure that has emerged consists of a cold dense midplane where CO is frozen out, a warm molecular layer where CO and other species are in the gas phase, and a tenuous upper layer where molecules are photodissociated by UV radiation (e.g., Aikawa et al. 2002). In addition, disk masses are typically low; average dust masses range between 5 and 15 (depending on the star forming region) and gas masses are generally (Andrews et al. 2013; Ansdell et al. 2016, 2017; Barenfeld et al. 2016; Pascucci et al. 2016; Law et al. 2017).
However, it is now becoming clear that the first steps of planet formation likely occur at an earlier stage, when the disk is still forming within the infalling envelope (Class 0 and I sources). Grain growth begins during this embedded stage (Kwon et al. 2009; Pagani et al. 2010; Foster et al. 2013; Miotello et al. 2014), and the HL Tau images suggest that even the formation of larger bodies may have already started before the envelope has fully dissipated (ALMA Partnership et al. 2015). Thus, young embedded disks may reflect the true initial conditions for planet formation.
| Molecule | Transition | Frequency | a𝑎aa𝑎aEinstein-A coefficient. | b𝑏bb𝑏bUpper level degeneracy. | c𝑐cc𝑐cUpper level energy. | Beam | d𝑑dd𝑑dVelocity resolution. | rms | rms |
|---|---|---|---|---|---|---|---|---|---|
| (GHz) | (s-1) | (K) | () | (km s-1) | (mJy beam-1 | (K | |||
| channel-1) | channel-1) | ||||||||
| 13CO | 220.39868 | 6.03810-7 | 5 | 15.87 | 0.320.18 (PA = 39.0∘) | 0.08e𝑒ee𝑒eVelocities were binned to 0.16 km s-1. | 10.2f𝑓ff𝑓fIn 0.16 km s-1 channels. | 4.4f𝑓ff𝑓fIn 0.16 km s-1 channels. | |
| C18O | 219.56035 | 6.01110-7 | 5 | 15.81 | 0.320.19 (PA = 38.7∘) | 0.04e𝑒ee𝑒eVelocities were binned to 0.16 km s-1. | 8.7f𝑓ff𝑓fIn 0.16 km s-1 channels. | 3.6f𝑓ff𝑓fIn 0.16 km s-1 channels. | |
| N2D+ | 231.32183 | 7.13810-4 | 7 | 22.20 | 0.930.71 (PA = 10.7∘) | 0.08 | 10.4 | 0.4 |
Efforts to detect these embedded disks have been made for the past 20 years, but early studies of the dust continuum were hampered by a lack of sensitivity and/or spatial resolution (e.g., Keene & Masson 1990; Looney et al. 2000; Jørgensen et al. 2009). While recent interferometric surveys have resolved disk-like structures in the dust around many protostars (Tobin et al. 2015; Segura-Cox et al. 2016), molecular line observations are necessary to establish whether these disk structures are in fact rotationally supported. Keplerian rotation has indeed been observed for a handful Class 0 sources (Tobin et al. 2012; Murillo et al. 2013; Codella et al. 2014; Lindberg et al. 2014; Yen et al. 2017), and more disks have been detected around the less embedded Class I protostars (e.g., Brinch et al. 2007; Lommen et al. 2008; Lee 2010; Takakuwa et al. 2012; Harsono et al. 2014).
So far, studies of these young disk systems have mostly focused on disk size, kinematics and disk formation mechanisms (e.g., Yen et al. 2013; Ohashi et al. 2014; Harsono et al. 2014), or the chemical structure at the disk-envelope interface (Sakai et al. 2014a, b; Murillo et al. 2015). Although a few studies have set out to model the disk radial density profile (e.g., Tobin et al. 2013b; Aso et al. 2017, hereafter T13 and A17, resp.), the physical and chemical structure of embedded disks remains poorly characterized. A simple but crucial question, for example, is whether these young disks are warm ( 20 K, i.e. warmer than the CO freeze-out temperature) or cold (have a large region where 20 K), as this will strongly affect disk evolution as well as the molecular composition.
The effect of temperature on the chemical structure can be readily seen in the snowline locations of the major volatile species. The snowline is the midplane radius where the temperature drops below the freeze-out temperature of a given molecule and hence this molecule freezes out from the gas phase onto the dust grains. The sequential freeze out of molecules causes molecular abundances and elemental ratios (like the C/O ratio) in both the gas and ice to vary with radius (e.g., Öberg et al. 2011). This in turn affects the composition of planets formed at different orbital distances (e.g., Madhusudhan et al. 2014; Walsh et al. 2015; Eistrup et al. 2016; Ali-Dib 2017). In addition, the solid-state formation of high abundances of complex molecules, which starts from CO ice (e.g., Tielens & Hagen 1982; Garrod & Herbst 2006; Chuang et al. 2016), will be impeded if the disk temperature is higher than the freeze-out temperature of CO (20 K). Furthermore, the location where grain growth is efficient is related to the water snowline (e.g., Stevenson & Lunine 1988; Schoonenberg & Ormel 2017). The thermal structure of the disk is thus a crucial ingredient in the planet formation process.
Modeling studies of evolved disks without an envelope have shown that the mass accretion rate is an important parameter for the disk temperature; higher accretion rates result in warmer disks (Davis 2005; Garaud & Lin 2007; Min et al. 2011). Since accretion rates are expected to decrease on average as the protostar evolves, disks in the embedded phase may be warmer than their more evolved counterparts. The envelope itself also influences the disk temperature as it serves as an isolating blanket (D’Alessio et al. 1997; Whitney et al. 2003). Specifically, Harsono et al. (2015) showed that both a high accretion rate and the presence of an envelope affects the location of 40 K dust, shifting the CO snowline to larger radii compared to disks without an envelope.
L1527 IRS (IRAS 04368+2557) is a good protostellar source to investigate whether young embedded disks are indeed warm, or have a large cold outer region where CO is frozen out, like the more evolved Class II disks. This protostar located in the Taurus molecular cloud (140 pc, Torres et al. 2007) is a borderline Class 0/I object (see e.g. the discussion in T13), with a bolometric luminosity of (Tobin et al. 2008; Kristensen et al. 2012). Spitzer images revealed bright bipolar outflow cavities in the east-west direction extending 10,000 AU in radius (Tobin et al. 2008). On 2000 AU scales the protostellar envelope has a flattened shape with an infalling rotating velocity profile (Ohashi et al. 1997), and the presence of a rotationally supported disk with a 100 AU radius was derived from the continuum and 13CO emission (Tobin et al. 2012). Analysis of C18O emission confirmed the presence of a Keplerian disk with a kinematic estimate of 74 AU for the disk radius (Ohashi et al. 2014, A17). The disk is seen almost edge-on (, Tobin et al. 2008; Oya et al. 2015), enabling direct probes of the midplane as shown for the Flying Saucer protoplanetary disk (Dutrey et al. 2017).
T13 modeled the (sub)millimeter continuum emission and visibilities, scattered light L′ image, spectral energy distribution, and mid-infrared spectrum using 3D radiative transfer codes (Whitney et al. 2003; Brinch & Hogerheijde 2010). Their best-fit model has a highly flared disk (, with = 100 AU at a 48 AU radius) with a radius of 125 AU. The temperature structure has a midplane temperature of 30 K at 100 AU, implying that CO will not freeze out in the disk. Given the edge-on configuration, high resolution CO observations should be able to confirm or refute the presence of gas-phase CO throughout the entire disk midplane. These results can be reinforced by observations of molecular tracers of CO freeze-out like N2D+, which will be destroyed as long as CO is present in the gas phase.
In this paper we use archival ALMA observations of CO isotopologues (13CO and C18O) and N2D+ to determine whether the embedded disk around L1527 resembles a Class II disk with a large cold gas reservoir, or whether this young disk is warm enough to have gaseous CO throughout. The data reduction is described in Sect. 2, and the resulting 13CO and C18O images and non-detection of N2D+ are presented in Sect. 3. In Sect. 4, we use the optically thick 13CO and C18O emission to derive a radial temperature profile for the disk midplane, and discuss the difficulties of disentangling disk and envelope emission. The effect of CO freeze out over different radial extents on the 13CO, C18O and N2D+ emission is examined in Sect. 5 using the 3D radiative transfer code LIME (Brinch & Hogerheijde 2010). In addition these models are used to address the CO abundance in the disk. Implications of the absence of CO freeze-out in embedded disks are discussed in Sect. 6, and the conclusions are summarized in Sect. 7.
2 Observations
The L1527 data analyzed here were retrieved from the ALMA archive (project code: 2013.1.01086.S, PI: S. Koyamatsu). Observations were carried out during Cycle 2 on 24 May 2015, using 34 antennas sampling baselines between 21 and 539 m, and on 20 September 2015, using 35 antennas sampling baselines between 41 and 2269 m. This corresponds to a maximum angular scale of 4.2 and 1.3, respectively. The phase center was (J2000) = 04h39m5391; (J2000) = 26030980. During both observations, L1527 was observed with a total on-source integration time of 25 minutes. The correlator setup included a 2 GHz continuum band centered at 233.0 GHz, and spectral windows with a bandwidth of 58.6 MHz targeting the 13CO , C18O and N2D+ transitions. The spectral resolution was 30.5 kHz for C18O and 61.0 kHz for the two other lines, which corresponds to a velocity resolution of 0.04 and 0.08 km s-1, respectively.
Calibration of the visibilities observed in the compact configuration was done using the ALMA Pipeline and version 4.2.2 of Common Astronomy Software Applications (CASA), while the observations in the more extended configuration were reduced manually by the East Asia ALMA Regional Center staff using CASA version 4.5. Calibrators for the respective observations were J0510+1800 and J0429+2724 (phase), J0423-0120 and J0510+1800 (bandpass and flux). We performed self-calibration on the continuum data and applied the phase and amplitude solutions also to the spectral line bands. The data were imaged using the CASA task CLEAN with natural weighting. For the line images, the continuum was subtracted before imaging. The total 1.3 mm continuum flux density derived from a Gaussian fit to the visibilities is 184.2 0.15 mJy, consistent with the 1.3 mm flux density reported by A17. The natural weighted continuum image has a peak flux density of 66.0 0.16 mJy beam-1 (for a beam), and is shown in Fig. 1. An overview of the image parameters for the observed molecular lines is provided in Table 1. For 13CO and C18O, only the observations in the extended configuration are used, while the N2D+ upper limits are derived from the data obtained in the more compact configuration.
3 Results
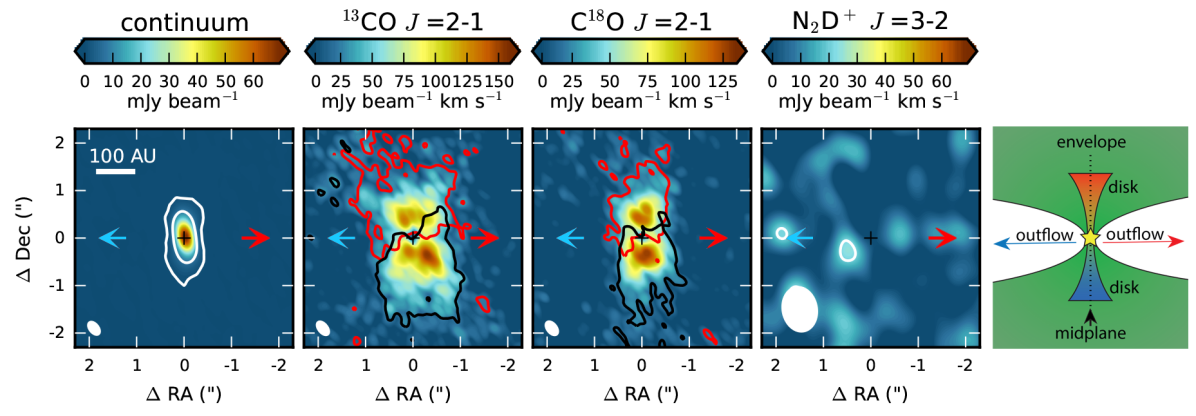
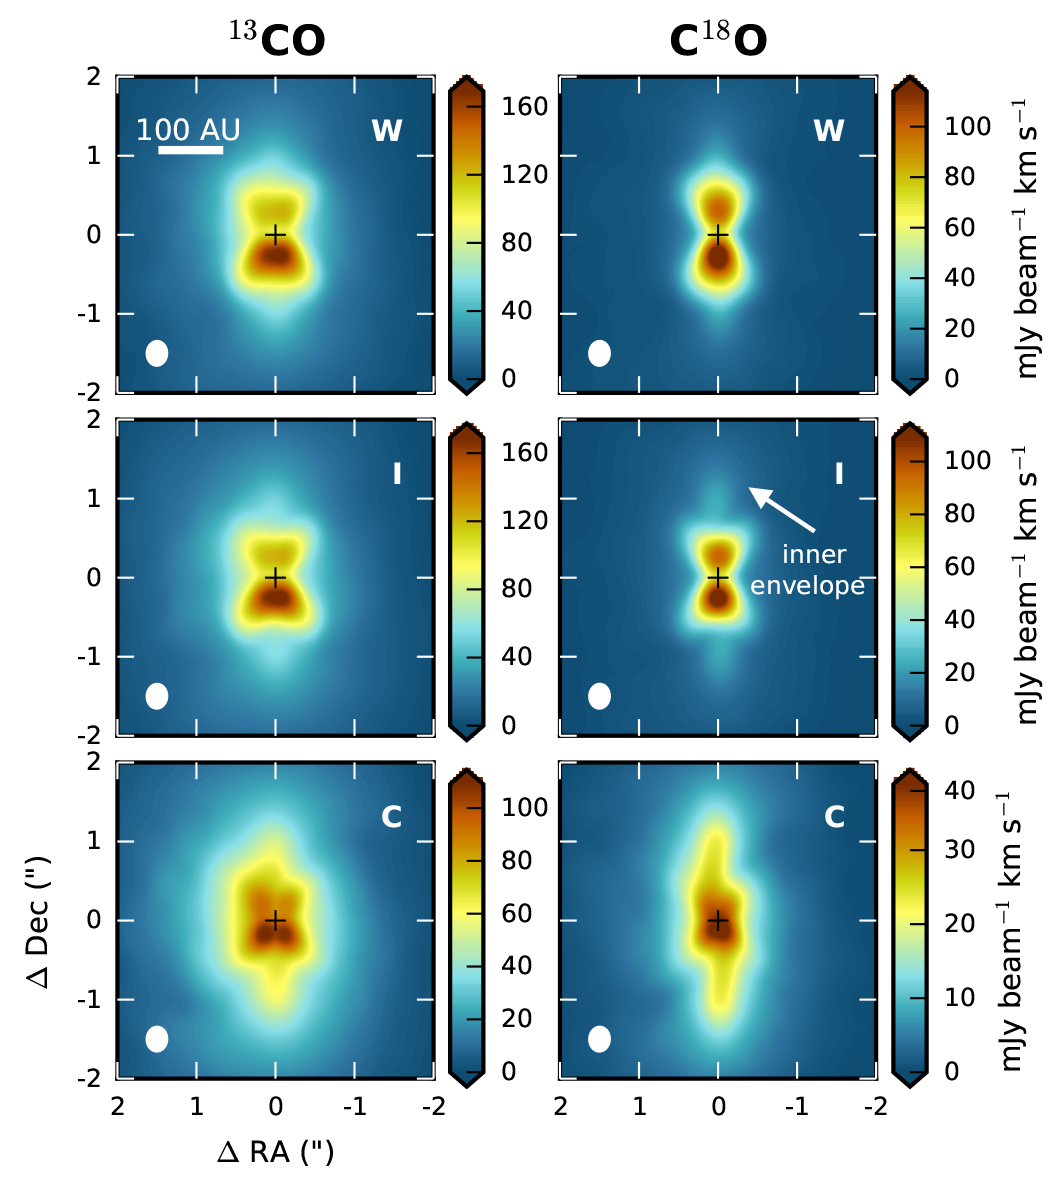
Figure 1 shows the integrated intensity (zeroth moment) maps for 13CO (), C18O (), and N2D+ () toward L1527, as well as a schematic overview of this region with the edge-on disk and inner part of the infalling rotating envelope. Carbon monoxide (CO) emission has been widely used to study the regions in protostellar systems where the material is warm enough (20 K) to evaporate CO off the dust grains. Emission lines from the main isotopologue 12C16O are optically thick and dominated by the outflow material, while the less abundant isotopologues are relatively more optically thin and expected to probe the disk forming region. Meanwhile, the cold regions ( 20 K) where CO is frozen out are traced by N2H+ and its deuterated variant N2D+ (e.g., Jørgensen et al. 2004; Crapsi et al. 2005; Tobin et al. 2013a).
13CO emission was detected above the 3 level at relative velocities with respect to the of the source (5.9 km s-1), between -3.2 and -0.3 km s-1, and between 0.7 and 2.8 km s-1. C18O emission was detected at similar velocities: between -3.0 and -0.3 km s-1, and between 0.5 and 2.8 km s-1. Line emission is not detected around the systemic velocity due to large-scale emission being resolved out. The zeroth moment maps presented in Fig. 1 are constructed using only channels with a detection. Both CO isotopologues show emission elongated in the direction perpendicular to the outflow, with redshifted emission located north of the continuum peak and blueshifted emission to the south. This is consistent with a Keplerian rotating disk and the inner part of a infalling rotating envelope (Tobin et al. 2012, T13, Ohashi et al. 2014, A17). Estimates of the Keplerian disk radius vary between 74 and 125 AU (A17, T13, resp.), that is, . The 13CO isotopologue is more abundant than C18O which results in the 13CO emission being more extended in the east-west direction while C18O is only detected in the denser regions toward the midplane. The line emission does not peak on source, probably because the continuum becomes optically thick in the innermost region around the protostar (15 AU, see also the discussion in Sect. 6.1), lowering the emission peak.
The edge-on orientation of the disk allows for direct observation of the midplane, and thus, theoretically, for a direct determination whether CO is frozen out or present in the gas phase. From these observations, no obvious reduction in 13CO or C18O emission, corresponding to CO freeze-out, is seen toward the midplane. Some asymmetry is visible, especially for 13CO, with the southern half of the disk being brightest west of the midplane and the northern half east of the midplane. This asymmetry is, at least partly, the result of the -coverage of the observations. Similar asymmetrical features can be introduced for axisymmetric models simulated with the observed visibilities.
In contrast with the clear CO isotopologue detections, no emission was detected for N2D+, which can only be abundant when CO is frozen out (at 20 K and cm-3). The 3 limit of 20 mJy beam km s-1 corresponds to an upper level for the beam-averaged N2D+ column density of cm-2 (assuming LTE and excitation temperatures between 10 and 50 K; see e.g., Goldsmith & Langer 1999). Thus, at first inspection there is no evidence in these observations for a large cold outer region in the disk around L1527 where CO is frozen out.
4 Analysis
To examine the temperature structure of the L1527 disk in more detail we analyse the 13CO and C18O emission. First, we establish that emission from both molecules is optically thick using the line ratio (Sect. 4.1). Next, we derive a temperature profile for the disk midplane (Sect. 4.2). Although the edge-on configuration of the disk allows a direct view of the midplane, deriving a radial temperature profile is not straightforward. The 13CO and C18O emission trace both the disk and inner envelope, so emission originating from the disk has to be disentangled from envelope emission. In addition, the radius from which the optically thick emission originates has to be determined. Viewing the disk edge-on means that the line of sight goes through the entire midplane before reaching the inner most part. If the emission becomes optically thick already in the inner envelope or outer disk, the inner disk cannot be observed. Moreover, this means that on-source emission does not necessarily originate at small radii ( AU). Before addressing these problems in detail using the velocity structure (Sect. 4.3), we derive a radial temperature profile in a conservative way. That is, we measure the temperature in the disk midplane at the highest possible velocity offsets. Assuming a power law temperature profile we can then estimate the midplane temperature structure for the entire disk (Sect. 4.2).
4.1 13CO optical depth
Given the low critical density of the 13CO transition ( cm-3), the emission is expected to be thermalized throughout the disk and in the inner envelope ( cm-3). This means that if the emission is optically thick, the brightness temperature is a measure of the excitation temperature, which in turn is a lower limit of the kinetic temperature of the gas. The optical depth of the 13CO emission can be derived from the 13CO/C18O line ratio. If both lines are optically thin, the line ratio will be equal to the abundance ratio of 13CO and C18O (7–8), given no isotope-selective photodissociation processes. This is a valid assumption for the disk midplane, since UV radiation will only penetrate into the disk surface layers. As the 13CO emission becomes optically thick, the line ratio decreases. The line ratio becomes unity when both lines are optically thick.
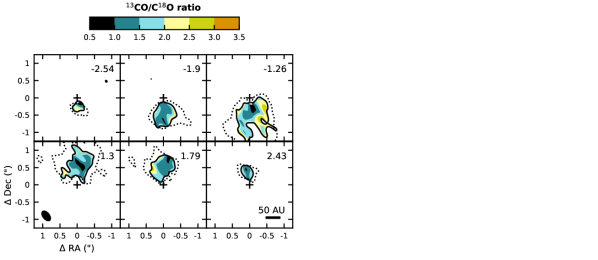
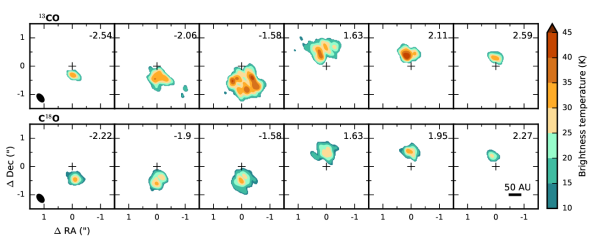
The 13CO () / C18O () line ratio is calculated for each pixel with at least a detection (see Table 1) for both 13CO and C18O, and six representative channels are presented in Fig. 2. The 13CO/C18O ratio is below 3.0 in all regions, and below 2.0 in the pixels with the highest signal-to-noise (along the midplane). The uncertainty on the 13CO/C18O ratio is calculated for each pixel by propagating the rms in the 0.16 km s-1 channels. Within this uncertainty, the ratio remains below 3.5, except in a few pixels close to the contour of the C18O emission. Theoretically, the ratio cannot be smaller than 1.0, unless 13CO emission is significantly more resolved out relative to C18O. The lowest values reached are 0.5, but the uncertainty in these pixels is 0.5. The values below 1.0 are thus not significant.
Since the optical depth depends on the gas temperature, the quantity we set out to determine, the line ratio is also dependent on the temperature. Therefore, in order to determine whether the emission from either or both CO isotopologues is optically thick, we calculate line ratios for a range of temperatures (20–100 K) and column densities (C18O column densities ranging from cm-2 to cm-2) using RADEX222http://home.strw.leidenuniv.nl/moldata/radex.html (van der Tak et al. 2007; van der Tak 2011) with collisional rate coefficients from Yang et al. (2010). The isotope ratios are taken to be [12C]/[13C] = 77 and [16O]/[18O] = 560 (Wilson & Rood 1994), which gives an abundance ratio of 7 for 13CO and C18O. For all temperatures considered, a 13CO/C18O ratio below 4 can only be reached if the 13CO emission is optically thick (Fig. 14, left panel). When the C18O emission becomes optically thick as well, the line ratio drops below 1.5 (Fig. 14, right panel). Taking [12C]/[13C] = 70, that is, [13CO]/[C18O] = 8, does not change these results. This thus means that the observed 13CO emission is generally optically thick (), except maybe in the upper most layers of the disk. In addition, C18O becomes optically thick in the densest regions near the midplane where 13CO/C18O ¡ 1.5.
4.2 Gas temperature
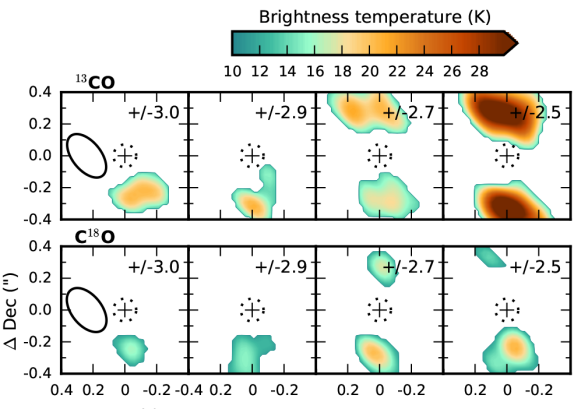
Since the 13CO and C18O emission is optically thick (), their brightness temperatures can be used as a measure for the kinetic temperature of the gas. The brightness temperature for six representative channels is presented in Fig. 3. All channels are displayed in Appendix B. For 13CO, the temperature along the midplane is above 25 K, except at km s-1, where the emission is unresolved, and around km s-1, where there may still be an effect of emission being resolved out. The C18O emission is weaker than the 13CO emission, but the channels with resolved emission show the same result: the midplane temperature is above 25 K.
Despite the complexity of locating the radial origin of the emission (see Sect. 4.3), we can make a conservative estimate of the radial temperature profile by determining the maximum temperature in the highest velocity channels and extrapolating this assuming a radial power law dependence,
| (1) |
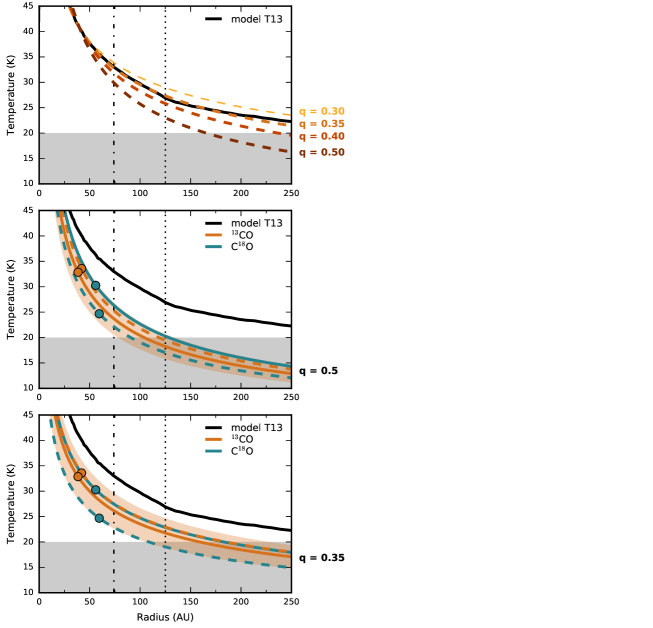
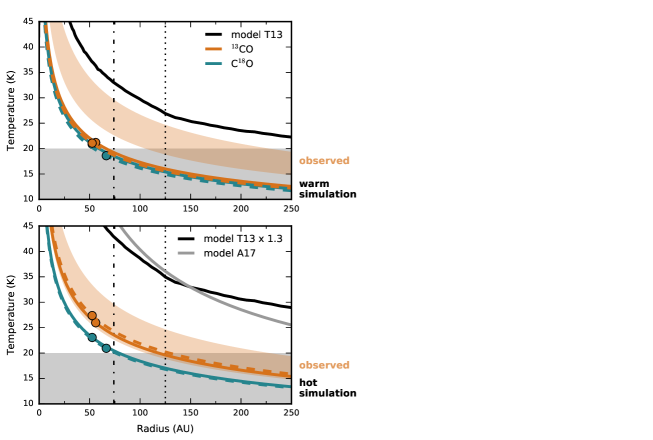
where and are the temperature and radius derived from the observations. Since the highest velocities are reached closest to the star, these channels are the least likely to be contaminated by envelope emission. Often a power law exponent of is used, appropriate for a black body flared disk with scale height (Kenyon & Hartmann 1987), but can range between 0.33 and 0.75 (see e.g., Adams & Shu 1986; Kenyon et al. 1993; Chiang & Goldreich 1997). However, full radiative transfer modeling shows that the temperature can not be characterized by a single power law, and that the midplane temperature profile can be flatter when the disk is embedded in an envelope (e.g., Whitney et al. 2003). We therefore compared a power law with to the midplane temperature profile from the T13 best fit model (see Fig. 4, top panel). T13 modeled the disk continuum emission by fitting both the visibilities and images of 870 m and 3.4 mm observations, the multi-wavelength SED and scattered light images with 3D radiative transfer modeling (see Appendix C for a more detailed description). A power law with appears to be steeper than the T13 profile, while adopting results in a better match to the T13 model between 40 and 125 AU. Assuming will thus likely provide a lower limit to the temperature in the outer disk.
For 13CO, the largest observed velocity offsets containing resolved emission are = -2.54 and = 2.59 km s-1. The blueshifted channel has a maximum temperature of 34 K along the midplane at 42 AU (0.3 from the continuum peak position), and in the redshifted channel this is 33 K at 39 AU. Even with the rms of 4 K channel-1, the temperature is thus above 20 K around 40 AU within the 3 uncertainty. The onset of CO freeze-out is therefore expected at radii 40 AU. Figure 4 shows the resulting radial profiles assuming (middle panel) and (bottom panel). For , the temperature drops below 20 K between approximately 100 and 125 AU. Adopting the 125 AU disk radius derived by T13 this would mean that there could be a small cold outer region in the disk where CO is frozen out. A disk radius of 74 AU as determined by A17 would however mean that the entire disk is too warm for CO freeze-out. It is also expected that CO is not frozen out in a 125 AU disk for .
For C18O, the highest velocity offsets that show resolved emission are = -2.22 and = 2.43 km s-1. The constructed temperature profiles are very similar to those derived from 13CO (Fig. 4). The temperature in the blueshifted channel is probably lower because the emission does not peak along the midplane (see Fig. 3). Since the C18O emission is more confined to the midplane than 13CO, which extends to larger heights above the midplane, the similarity in the temperature profiles suggests that the temperature measured in the midplane is not strongly affected by blending with the warmer upper layers. The observed temperatures are lower than expected based on the T13 model. In Sect. 5.1, we will discuss that the measured brightness temperature, and consequently the corresponding radial temperature profile, underestimates the kinetic gas temperature. In summary, extrapolating the temperature measured for the highest velocity material in the inner disk (40 AU) suggest that the temperature is likely to remain 20 K out to at least 75 AU, and possibly out to 150 AU.
The CO freeze-out temperature is 20 K when CO binds to pure CO ice. When CO binds to a water ice surface the freeze-out temperature is higher (25 K, see e.g., Burke & Brown 2010, Fayolle et al. 2016). Assuming , this would mean that the snowline is at radii 50 AU, allowing CO freeze-out in the outer disk also for a radius of 74 AU. With a power law dependence similar to the T13 profile (), the disk remains 25 K out to 85 AU. Thus, with measurements of the disk radius varying between 74 and 125 AU, these results indicate that a large fraction of the disk, or even the entire disk, is warm enough to prevent CO freeze-out.
4.3 Disentangling disk and envelope emission
As mentioned above, determining the radial origin of the optically thick CO isotopologue emission is not trivial as both the disk and inner envelope contain CO. In addition, because the emission originates at the radius at which it becomes optically thick, the observed angular offset does not necessarily correspond to the physical radial offset. These problems, and their effect on the inferred power law temperature profile, can be investigated using the velocity structure of the system. To do so, we calculate the velocity along the line of sight for each position in the midplane. Then, for each 0.16 km s-1 velocity bin of the observations, we select the material moving at that velocity range and calculate the molecular column density along the line of sight. Finally, we convert this column density into optical depth and locate the surface:
| (2) |
where and are the frequency and the Einstein-A coefficient of the transition, respectively, and are the degeneracy and energy of the upper level, respectively, is the partition function and is the line width (FWHM).
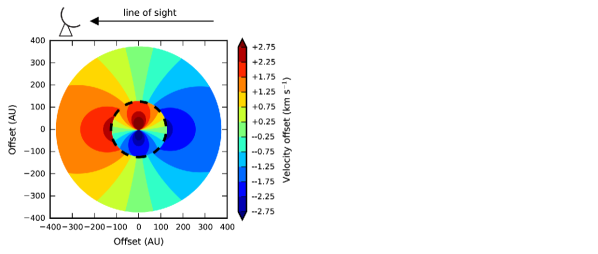
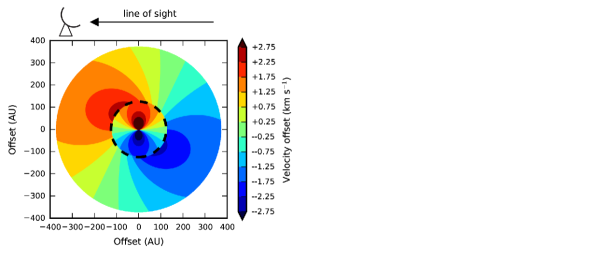
We adopt the physical structure (dust density and temperature) from T13, who modeled the disk continuum emission by fitting both the visibilities and images of 870 m and 3.4 mm observations, the multi-wavelength SED and scattered light images with 3D radiative transfer modeling. Their best fit model has a disk radius of 125 AU. Inside this radius the velocity is Keplerian, while the material in the envelope has a infalling rotating velocity profile (Ulrich 1976; Cassen & Moosman 1981). More details can be found in Appendix C. A critical parameter for the velocity structure is the stellar mass. Tobin et al. (2012) derived a dynamical mass of 0.19 , while recently A17 find a slightly larger value of 0.45 . Here we adopt the higher value so our estimate of the channels containing only disk emission is conservative; for lower stellar masses, envelope emission will be confined to smaller velocity offsets. We will refer to this as our fiducial model. To calculate the optical depth we assume a gas-to-dust ratio of 100 and a constant canonical CO/H abundance of in the region with temperatures larger than 20 K. We assume the gas temperature is equal to the dust temperature, which is a valid approximation in the dense midplane.
The resulting midplane velocity profile projected along the line of sight for the fiducial model is shown in Fig. 5, and the midplane temperature and density structure from T13 can be found in Fig. 19. For the above described parameters, velocities larger than km s-1 can only be reached in the disk, so these velocity channels are expected to contain only disk emission (see Table 2). For a 0.19 star, disk-only emission would be observed for velocity offsets larger than 1.7 km s-1. Assuming free-fall velocity for the envelope material gives similar results (see Fig. 20). A17 use the modified free fall velocity structure from Ohashi et al. (2014), that is, the free fall velocity reduced by a factor of 0.3, and derive a disk radius of 74 AU. For these parameters, channels with velocity offsets larger than 1.1 km s-1 would contain emission originating only in the disk.
| Envelope | Disk only | Envelope onlya𝑎aa𝑎aOnly for 13CO for which the redshifted emission becomes optically thick in the envelope. | |
|---|---|---|---|
| velocity | () | (km s-1) | (km s-1) |
| UCMb𝑏bb𝑏bInfalling rotating envelope (Ulrich 1976; Cassen & Moosman 1981). | 0.19 | ||
| UCMb𝑏bb𝑏bInfalling rotating envelope (Ulrich 1976; Cassen & Moosman 1981). | 0.45 | ||
| Free fall | 0.19 | ||
| Free fall | 0.45 | ||
| Modified | |||
| free fallc𝑐cc𝑐cFree fall velocity modified by a factor 0.3 and a disk radius of 74 AU (Ohashi et al. 2014, A17). | 0.45 |
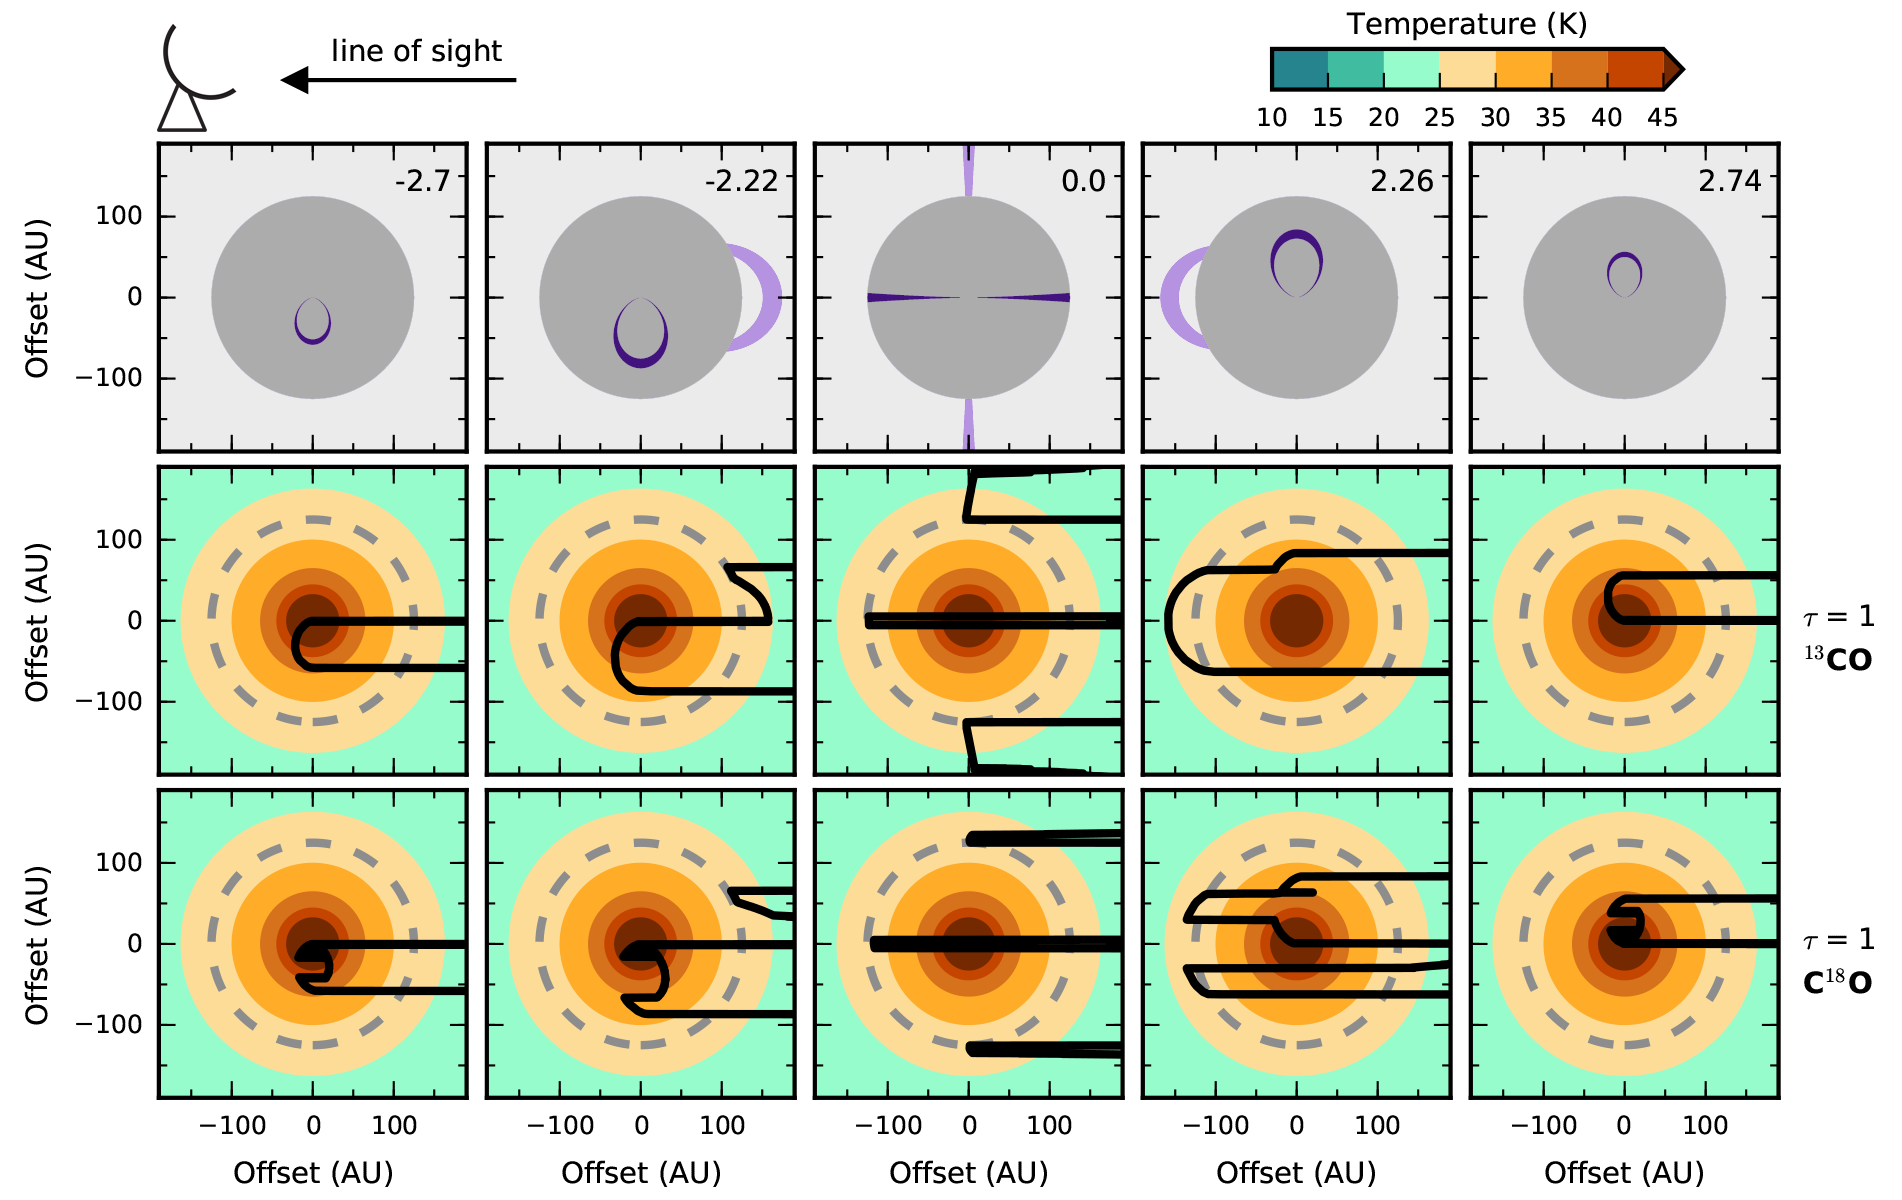
For a 0.45 star, both the disk and envelope contain material that has line-of-sight velocity offsets smaller than km s-1. What material is responsible for the emission thus depends on where the emission becomes optically thick. The surface for 13CO in five representative channels ( -2.70, -2.04, 0, 2.10 and 2.74 km s-1) is shown in Fig. 6 (see Fig. 21 for the case of a free falling envelope). At blueshifted velocities the southern half of the disk is observed, as well as that part of the envelope that is behind the disk for our line of sight (see Fig. 5). The emission becomes optically thick in the disk, so the envelope is blocked from our view except at velocities where the envelope extends further south than the disk. In this case, at small angular offsets from the source center the emission originates in the disk, while emission at larger offsets traces the envelope (see Fig. 6, second column). In the redshifted channels the emission becomes optically thick in the envelope between us and the disk. At the highest velocities occuring in the envelope, disk emission will be present very close to the protostar (see Fig. 6, fourth column), while envelope emission is present at larger angular offsets. However, the angular offset of the envelope emission (30 AU in this case) is smaller than the radius at which the emission originate (125 AU). At lower velocities only envelope emission will be observed (see Table 2), until at velocities close to the systemic velocity the disk can be seen at the source position with envelope emission on both sides (see Fig. 6, third column). The situation is similar for C18O (see Fig. 6, bottom row), except that the emission becomes optically thick in the far side of the disk (see Fig. 6, column one, two and five), instead of the near side. In addition, the emission remains optically thin in most of the envelope at redshifted velocities (for the adopted density structure; see Fig. 6, fourth column). The disk is thus not hidden from our view.
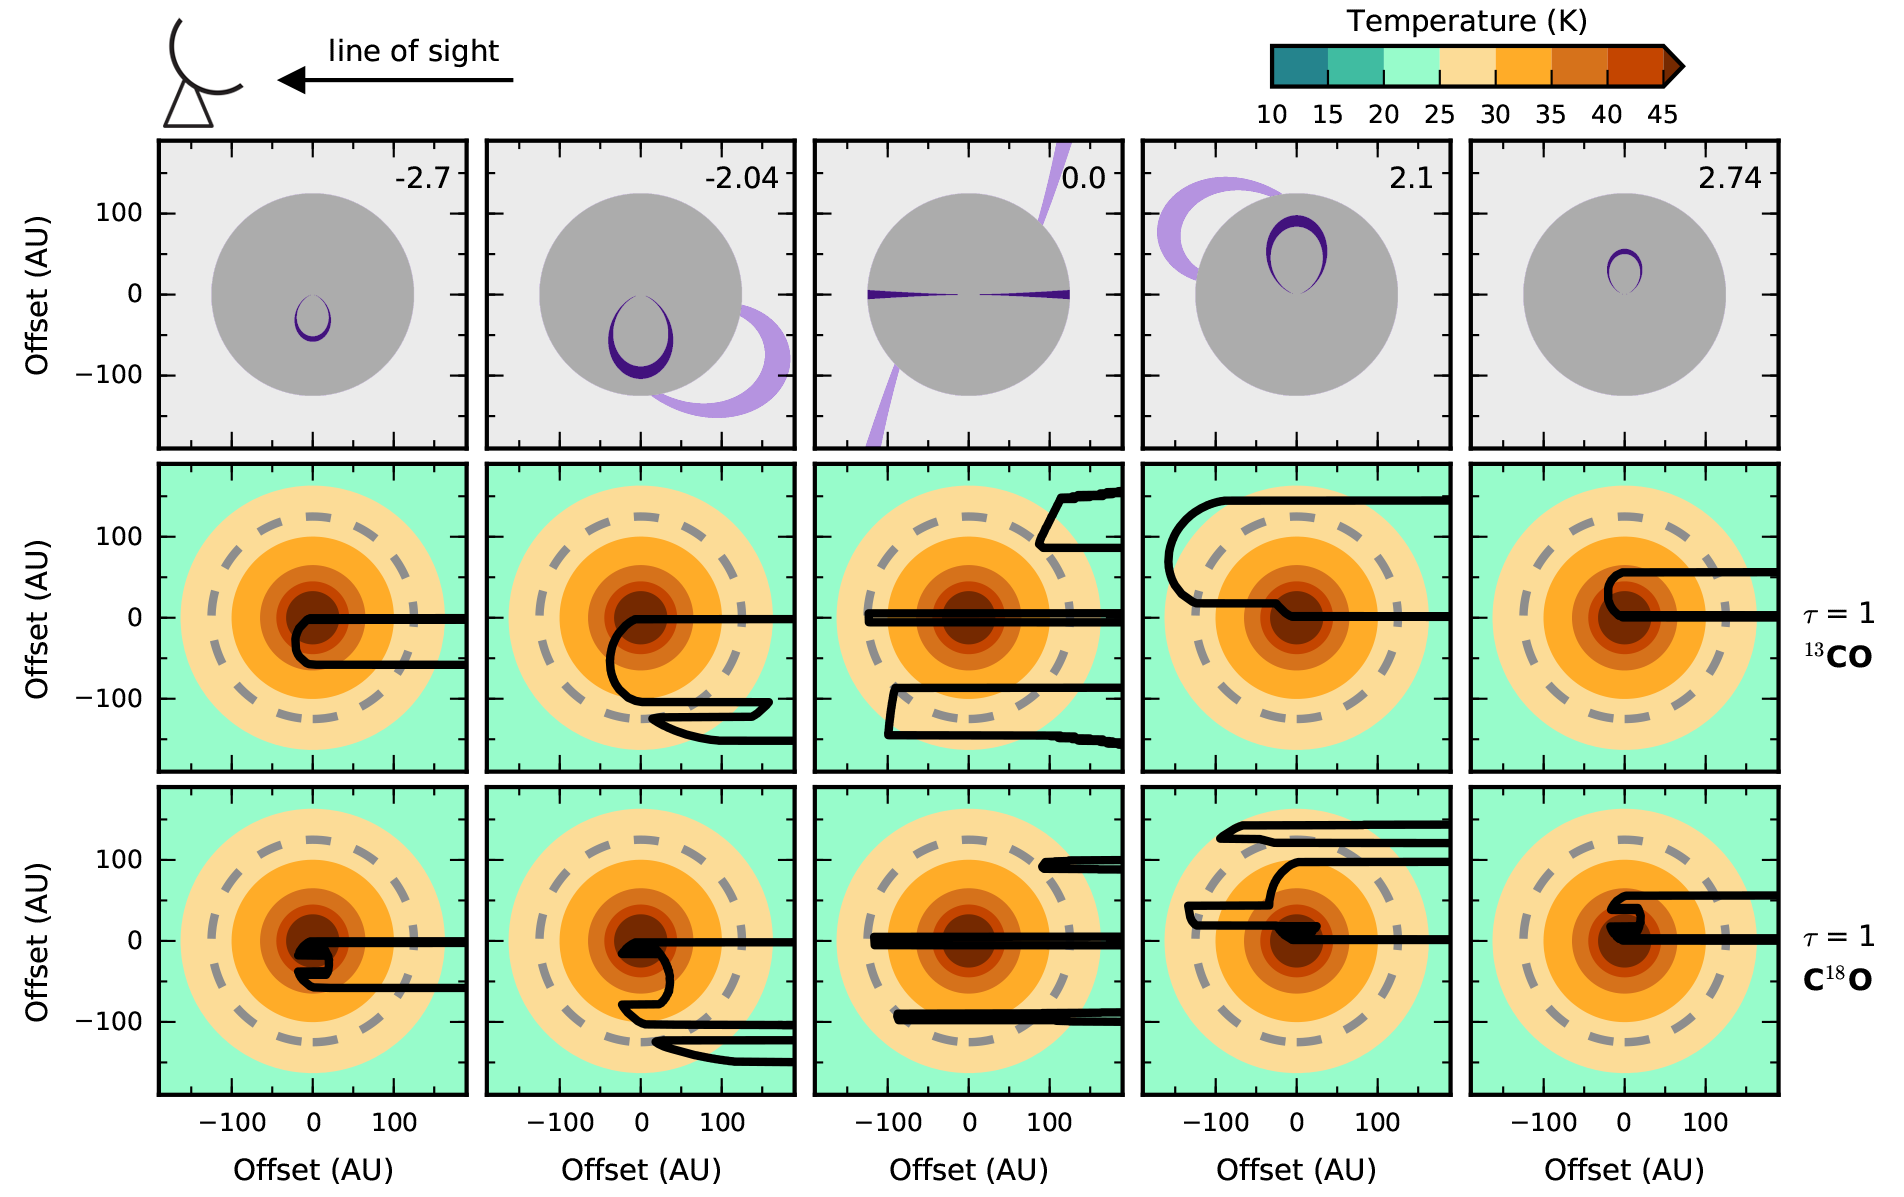
For clarity, we have neglected the dust opacity in Fig. 6. Adopting the dust opacity from T13, that is, cm2 g-1 at 220 GHz, the dust would only become optically thick in the inner 10 AU. If the velocity profile in the envelope is free fall (Fig. 20), the highest envelope velocities are found along the line of sight toward the protostellar position, instead of offset to the north (for redshifted emission) or to the south (for blueshifted emission), as in the infalling rotating case. This changes the location of the contour at velocities that occur in both the disk and envelope (that is, columns two and four in Fig. 6 will look different; see Fig. 21 and Table 2). For blueshifted velocities, the disk will be visible south of the protostar, while envelope emission will be present to the north. For redshifted velocities, emission surrounding the protostar originates from within the envelope, while the emission furthest north is coming from the disk.
In summary, for 0.45 , channels with velocity offsets larger than 2.5 km s-1 are expected to contain only the disk’s emission. In contrast, channels with smaller velocity offsets show emission from both the disk and the inner envelope. The most important consequence of this is that the angular offset of optically thick emission with respect to the protostellar position in these channels does not always directly correspond to the radial position of the emitting material.
Determining exactly where the emission originates is non-trivial and requires knowledge of, amongst others, the disk radius, density structure and CO abundance. Nonetheless, a global view of the temperature in the disk and inner envelope can be obtained through the brightness temperature in the different velocity channels. As shown in Sect. 4.2, for both 13CO and C18O the temperature along the midplane is above 25 K at all velocities, suggesting a warm disk and inner envelope. The highest velocity channels that contain resolved 13CO emission, and were used to construct the radial temperature profile, are = -2.54 and = 2.59 km s-1. For stellar masses , these channels are indeed expected to trace only the disk. The velocity offsets used for C18O are slightly smaller ( = -2.22 and = 2.43 km s-1), and could be contaminated by envelope emission if the stellar mass is 0.45 . However, unlike for 13CO, the redshifted C18O emission is expected to become optically thick mostly in the disk and not already in the envelope. Moreover, the measured temperatures are similar as for 13CO.
Depending on the stellar mass and the envelope velocity structure, a number of redshifted velocity channels are predicted to contain only 13CO emission from the inner envelope (see Table 2). For , these channels have velocity offsets smaller than 1.79 km s-1. In all these channels the 13CO brightness temperature remains above 25 K (see Fig 16). So if this emission indeed originates in the inner envelope, the temperature in that region would be higher than 25 K. However, the power law temperature profile predicts inner-envelope temperatures of 15–22 K. This could mean that there is a jump in the temperature between the disk and inner envelope. Such a jump, albeit stronger, has been suggested by Sakai et al. (2014b) based on observations of SO. Or alternatively, the temperature profile is less steep than shown in Fig. 4, assuming the temperature derived for the inner disk is not underestimated. The inner disk temperature is determined from channels expected to contain only disk emission, and is thus not likely to be underestimated due to envelope contamination (see Fig. 6). A shallower temperature profile would mean a warmer disk with temperatures 25 K for all radii (125 AU).
5 Modeling of the line emission
5.1 13CO and C18O
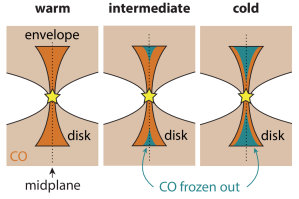
Based on the brightness temperature in the 13CO and C18O channels, the disk and inner envelope are likely to have midplane temperatures above the CO freeze-out temperature of 20 K. However, a power law temperature profile based on the temperature at the highest velocity offsets suggests that there may still be a cold outer region in the disk. To study in more detail the effect of CO freeze-out on the emission, we simulate 13CO and C18O emission for three different scenarios (see Fig. 7). The focus lies on determining whether the observations can show the difference between a completely warm disk and a disk with a cold outer midplane. The first model (‘warm model’) consists of a warm disk that has no CO freeze-out. In the second case (‘intermediate’ model), there is a small region in the outer disk where CO is frozen out, and in the third model (‘cold’ model) the temperature is only high enough to have gaseous CO in the innermost region of the disk and in the surface layers. In all models CO is present in the gas phase in the inner envelope. Models without CO in the envelope cannot reproduce the angular extent of the observed emission.
The exact distribution of CO in the different models is based on a simple parametrization: for K CO is present in the gas phase at a constant abundance of (w.r.t. H), while for K CO is frozen out and the abundance is set to zero. For the warm model we adopt the temperature structure of the T13 model, because the temperature is above 25 K in the entire disk (see Fig. 18). For the intermediate and cold models, the T13 temperature is scaled down by a factor to create regions with K (schematically shown in Fig. 7). For the intermediate model the temperature is lowered by 40% and for the cold model by 60%, resulting in a CO snowline at 71 AU and 23 AU, respectively (see Fig. 18). In the intermediate model, 25% of the mass within 125 AU (disk outer radius) has K. In the cold model this is 70%, roughly consistent with the result from Kama et al. (2016) that in TW Hya 60% of the dust mass has temperatures below 20 K. The cold model thus resembles a Class II disk. Although for the intermediate and cold model the temperature is lowered to create CO freeze-out regions, the fiducial temperature is used for the excitation calculation. This way the emission from the surface layers is not reduced through an excitation effect. If these regions would in fact also be colder, the difference with the fiducial warm model would increase.
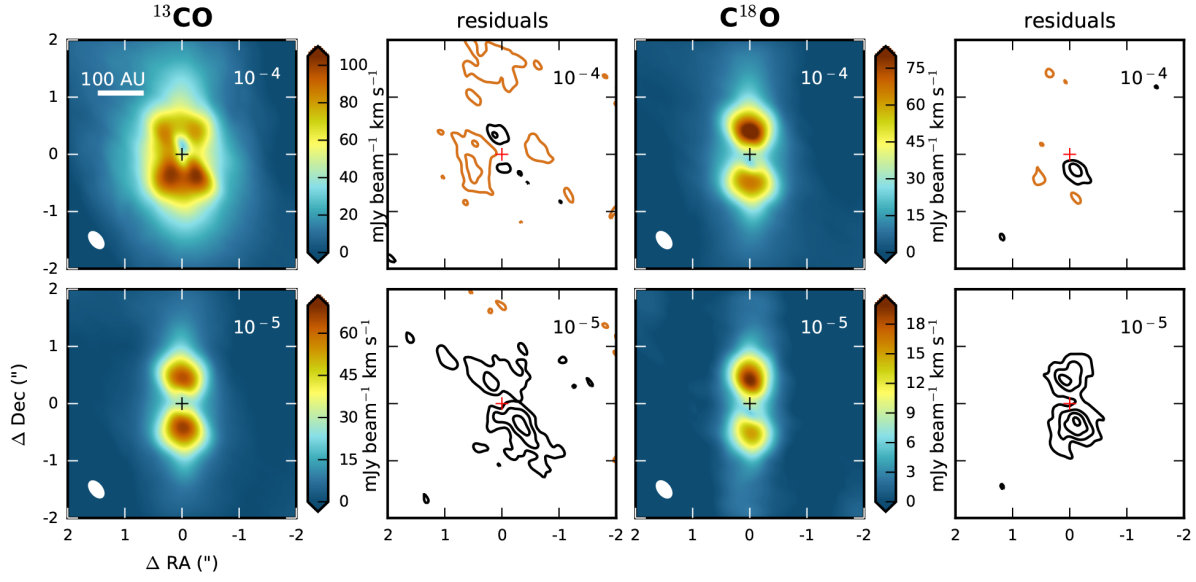
The 13CO and C18O emission for the three models is simulated with the 3D radiative transfer code LIME (Brinch & Hogerheijde 2010). Again, the velocity inside the disk ( 125 AU) is Keplerian and the envelope material has an infalling rotating velocity profile. The inclination is set to 85∘, that is, 5∘ offset from edge-on with the disk and envelope west of the protostar tilted toward the observer (see Fig. 17). This is the same orientation as used by Tobin et al. 2008 and T13, but opposite to the results presented by Oya et al. 2015. However, none of our conclusions are sensitive to how the inclination is defined. Synthetic images with the same beam as the observations are then generated in CASA by using a modified version of the task symobserve that calculates visibilities for the observed -coverage (symobs_custom, Attila Juhász). The continuum subtracted visibilities were then imaged to the noise level of the observations (see Table 1). In addition, emission was simulated for a five hour integration (compared to 25 minutes for the observations) at an angular resolution similar to that of the observations.
The by eye best matching model and lowest residuals are reached for a stellar mass of 0.4 , although the envelope emission in the low and intermediate velocity channels is slightly overproduced for 13CO. This could be because a canonical CO abundance of is too high for the more tenuous envelope where photodissociation may play an important role in destroying CO, unlike in the denser disk midplane where UV radiation cannot penetrate (see e.g., Visser et al. 2009a). Another reason could be because the large-scale cloud emission is not taken into account in the model. The effect of emission being resolved out is not as large in the simulated images as it is in the observations, that is, the simulated images still show some emission in the central most channels while the observations do not. We will therefore restrict the comparison between observations and models to velocities km s-1. Lower stellar masses give lower residuals in the intermediate velocity channels, but cannot reproduce the disk emission, consistent with the results from Ohashi et al. (2014). Since our goal is not to model the CO isotopologue emission exactly, but to focus on the effect of CO freeze-out in the disk, we show the results of the 0.4 models. The only difference between these models and the fiducial model presented in Sect. 4.3 is thus the stellar mass (0.4 instead of 0.45 ). However, the overall conclusions are valid for stellar masses between 0.19 and 0.5 .
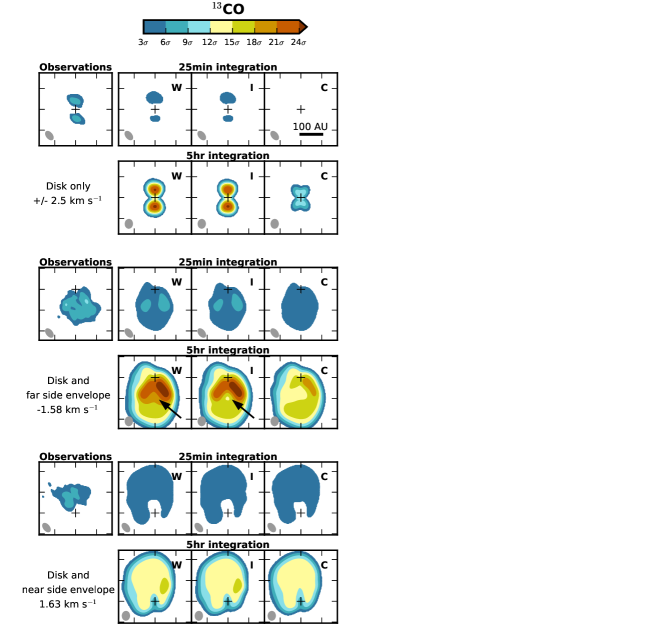
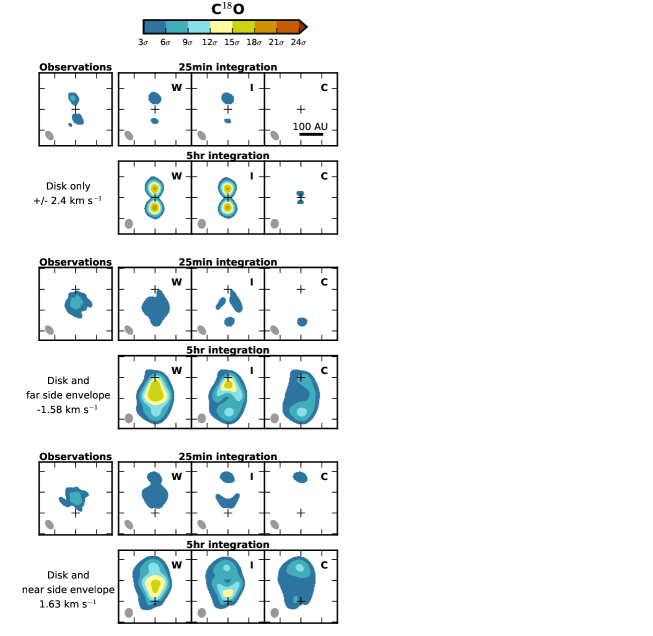
An overview of the moment zero maps for the models with five hour integrations is presented in Fig. 8. Four representative velocity channels are shown in Figs. 9 and 10 for both integration times, along with the observations. The warm disk model matches the observations for both molecules quite well. The model slightly underpredicts (3–6 residuals) the compact emission (), and overpredicts ( residuals) the envelope emission, especially for 13CO, as discussed above. The cold model is clearly the worst match for both species, as it cannot reproduce the observed intensity. In addition, it predicts similar intensities in the disk and inner envelope (see Fig. 8), unlike what is observed (see Fig. 1).
With the current observations, the intermediate disk model with CO frozen out at midplane radii larger than 71 AU would be indistinguishable from the warm disk model using 13CO emission. A five hour integration would yield high enough signal to noise to distinguish both scenarios using intermediate blueshifted velocities (see Fig. 9). However, for C18O the warm model is a better match to the data than the intermediate model (see Fig. 10). This difference can be explained with the C18O isotopologue being less abundant than the 13CO isotopologue. For the blueshifted velocities (see Fig. 6, second column), the 13CO emission becomes optically thick in the inner envelope behind the disk when CO is absent in the outer disk. If the temperature in this region is similar to the temperature in the outer disk, the observed emission will hardly change. The C18O emission on the other is expected to remain optically thin out to larger radii, probing different physical conditions deeper in the envelope. At redshifted velocities (see Fig. 6, fourth column), the 13CO emission becomes already optically thick in the inner envelope, blocking the outer disk from our view. Whether CO is present in the outer disk or not thus has no affect on the observations. The C18O emission does not become optically thick in the envelope, so changes in the disk are visible. The effect of CO being frozen out in the outer disk is therefore likely to be stronger for the C18O than the 13CO emission, and the less abundant C18O seems to be a more sensitive diagnostic of the distribution of gas-phase CO in the disk. Removing CO at disk radii 71 AU does indeed significantly affect the C18O emission, providing a worse match to the observations than the warm disk model. This is amplified for the cold disk model with CO frozen out at radii AU, and for five hour integrations. The intermediate and warm model can be distinguished using 13CO if the reduced temperatures, used to set the CO freeze-out region in the intermediate and cold models, are also used for the excitation calculation. In that case, the blueshifted channels (Fig. 9, middle panels) for the intermediate model are similar to those of the cold model instead of the warm model. A disk with temperatures reduced by 40% (w.r.t the T13 model) throughout is thus unlikely. In summary, these modeling results thus suggest that gaseous CO is likely present in the entire disk.
The accuracy of the midplane temperature derived from the 13CO and C18O observations can be assessed by computing a power law temperature profile from the synthetic images for the warm disk model (25 minutes integration) in the same way as done for the observations. The resulting profiles (Fig. 11, top panel) are much colder than the input midplane temperature of the models, suggesting that the observationally derived temperature is systematically lower than the actual temperature. Moreover, these profiles are also colder than those derived from the observations. This means that the disk midplane may be warmer than the temperature profile derived by T13 from the continuum emission, which has a temperature of 26 K at the disk outer radius, because the underlying temperature profile will be substantially higher than the observationally derived one. This may be because of colder gas along the line of sight. Another effect that plays a role is beam dilution, because concatenating the high resolution data shown here with the data taken in a more compact figuration results in 10 K lower brightness temperatures (0.1 larger beam). Higher resolution observations may thus provide more accurate temperatures.
To examine what temperature would be required to reproduce the observed brightness temperature, models were run with the T13 disk temperature increased by a certain percentage. Increasing the temperature by 30% (hot model) results in a midplane temperature profile similar to that adopted by A17 (see Fig. 11, bottom panel). The power law profile derived for this model from 13CO emission is within the 1 uncertainty for the observations, although the C18O profiles are a few Kelvin colder (Fig. 11). These results suggest that the L1527 disk could be warmer than 35 K.
5.2 CO abundance
The underabundance of gaseous CO in Class II disks, with respect to the ISM abundance of (w.r.t. H), has been attributed to photodissociation in the upper layers of the disk and freeze-out near the outer disk midplane (Dutrey et al. 1997; van Zadelhoff et al. 2001). However, recent detailed studies of in particular TW Hya suggest that on top of this, CO is also depleted in the warm molecular layer and inside its snowline (Favre et al. 2013; Nomura et al. 2016; Schwarz et al. 2016). Moreover, a general carbon depletion was inferred from [C I] lines (Kama et al. 2016). Low CO abundances are also observed for protostellar envelopes (Anderl et al. 2016), and results from large protoplanetary disk surveys with ALMA show that this may be a common feature for Class II disks. For many disks in several star forming regions, CO (isotopologue) emission, and the subsequently derived gas masses and gas-to-dust ratios, are up to two or three orders of magnitude lower than expected (Ansdell et al. 2016, 2017; Barenfeld et al. 2016; Long et al. 2017). The main question now is whether these low CO-derived gas masses are the result of CO depletion or a sign of rapid gas loss (e.g., Miotello et al. 2017). Determining CO abundances during earlier stages of disk evolution may help solve this puzzle.
Given that the 13CO and C18O emission toward L1527 is optically thick, deriving column densities and abundances is difficult. But we can invert this argument and use radiative transfer modeling to assess the CO abundance required for both molecules to be optically thick. Therefore, we made synthetic 13CO and C18O ALMA images for the warm disk model with a constant CO abundance of , instead of as described in Sect. 5.1. The resulting moment zero maps (constructed using velocities km s-1) presented in Fig. 12 suggest that reducing the CO abundance by an order of magnitude would give only a detection of 13CO (peak flux of 67 mJy beam-1 km s-1), while the observed signal-to-noise ratio is (peak flux of 125 mJy beam-1 km s-1 when using the same velocity range as for the simulated images). Moreover, C18O would only be detected at the level (peak flux of 20 mJy beam-1 km s-1), while it is observed at (peak flux of 101 mJy beam-1 km s-1). The 13CO/C18O line ratios (not shown) are also higher than observed; generally larger than 3.5, indicating that the C18O emission is not optically thick and even the 13CO emission becomes optically thin in some regions. A canonical CO abundance thus produces a better match to the observations than an order of magnitude reduction.
Based on modeling of C18O ALMA observations, A17 suggested a local enhancement of C18O at the disk-envelope interface (that is, an ISM abundance between 80 and 88 AU), and a factor 20 lower abundance in the disk. However, none of the results presented here show an immediate need for a reduced CO abundance in the disk compared to the disk-envelope interface. On the contrary, a constant ISM abundance slightly underpredicts the emission within instead of overpredicting it.
5.3 N2D+
N2H+ has been shown to trace cold ( 20 K) and dense ( cm-3) prestellar and protostellar environments where CO is frozen out (e.g., Bergin et al. 2001; Caselli et al. 2002a; Jørgensen et al. 2004). Another chemical effect of low temperatures and CO freeze-out is the enhancement of deuterated molecules, such as N2D+ (e.g., Caselli et al. 2002b; Crapsi et al. 2005; Roberts & Millar 2007). With the resolution provided by ALMA, N2H+ emission has been spatially resolved in a few protoplanetary disks, where it was shown to originate outside the CO snowline (Qi et al. 2013, 2015). Recently, N2D+ has also been observed toward one T Tauri and one Herbig disk (Huang & Öberg 2015; Salinas et al. 2017, respectively). In both cases the measured N2D+/N2H+ ratio of 0.3–0.5 matches the highest values found for protostellar envelopes (Emprechtinger et al. 2009; Tobin et al. 2013a). The latter single dish studies find one of the lowest N2D+/N2H+ ratios for L1527 ( 0.001) in samples of 20 protostars.
So far, no observations of N2H+ have been carried out for the L1527 disk. Based on a small chemical network for N2H+ (van ’t Hoff et al. 2017), abundances of 10-10 are expected for the densities in the T13 model if CO freeze-out would occur. This chemical model incorporates the main formation and destruction processes for N2H+, as well as freeze-out, thermal desorption and photodissociation of CO and N2. An N2H+ abundance of 10-10 is consistent with predictions from full chemical models (e.g., Walsh et al. 2012; Aikawa et al. 2015). If the N2D+/N2H+ ratio in the disk were similar to the value in the envelope (i.e., 0.001), an N2D+ abundance (w.r.t. H) would be expected in the disk. To assess whether the observations are sensitive enough to have detected N2D+ abundances , synthetic images were created for the intermediate and cold disk model. In these models, N2D+ is present at constant abundance throughout the CO freeze-out region. Based on these simulations, only abundances could have been detected with the observations presented here. These findings can also be phrased in terms of column density. For the intermediate model, that is, N2D+ present outside 71 AU, the N2D+ column density along the midplane for an abundance of is cm-2. This is two orders of magnitude lower than the upper limit derived from the observations ( cm-2). Even for the cold model with N2D+ at radii AU, which cannot reproduce the CO observations, the N2D+ column density would still be an order of magnitude below the observed upper limit. The observations thus seem not sensitive enough to completely rule out the presence of N2D+ in the outer disk.
However, Emprechtinger et al. (2009) found that the lowest N2D+/N2H+ ratios were seen at the highest dust temperatures. In particular, the low ratio for L1527 suggests dust temperatures above 25 K on envelope scale. If the deuterium fractionation in the disk is similar to that in the envelope, this would then be in agreement with a warm disk.
6 Discussion
Based on analysis and modeling of the optically thick 13CO and C18O emission observed with ALMA, the young disk around L1527 is likely to be warm enough to prevent CO from freezing out ( 20–25 K). This is in contrast with observations of more evolved Class II disks which are shown to have relatively large cold outer regions where CO is frozen onto dust grains.
The main difficulty in characterizing the physical properties of young disks is disentangling disk emission from emission originating in the envelope. As shown in Sect. 4.3, a rough division can be made kinematically, but it becomes more complicated if the emission is optically thick. In the latter case, the angular offset at which emission is observed no longer correlates to the physical radius at which the radiation is emitted. Therefore, careful analysis is required when characterizing disks that are still embedded in their envelope.
Although an accurate determination of the origin of the optically thick 13CO and C18O emission requires detailed knowledge of the systems physical structure, our inferred power law temperature profile does not depend on these parameters. In the analysis, the midplane velocity component along the line of sight is used to predict the velocities that contain only disk emission. This velocity component depends on the stellar mass, disk radius and envelope velocity profile. For both the T13 model (, AU, and infalling rotating envelope) and the A17 model (, , and a reduced free fall velocity in the envelope), emission at 2.6 km s-1 is expected to originate only in the disk. The infalling rotating velocity profile predicts higher envelope velocities than the reduced free fall profile, but even for a central mass of 0.45 no envelope contamination is expected at 2.6 km s-1. So independent of the assumed model, the brightness temperature at 2.6 km s-1 is likely to probe the temperature in the disk.
6.1 Dust opacity
To study whether the observations can distinguish between a warm and cold disk, we use the best-fit model from T13, which was obtained by fitting 3D radiative transfer models to sub/millimeter dust emission and infrared scattered light. As pointed out by the authors, the most robust parameters are the disk radius and vertical height. Meanwhile, the disk mass and radial density profile are the most degenerate parameters. Both depend on assumptions made for the dust opacity. Interesting in this respect is that the observations of the CO isotopologues presented here hint at the 1.3 mm continuum being optically thick close to the protostar. As can be seen in Fig. 13, the centroids of both the 13CO and C18O emission remain offset from the stellar position even at the highest velocities. This can be caused by the dust being optically thick in this inner region, obscuring the CO emission. For the T13 density structure and dust opacity (3.1 cm2 g-1 at 200 GHz), the continuum becomes optically thick in the inner 10 AU. If the dust is indeed optically thick in the inner disk, the dust mass derived by T13 may be underestimated by a factor of a few. This could lead to our modeled CO isotopologue emission being more optically thin than in the observations, and therefore modeled brightness temperature to be slightly lower than observed. Modeling of higher resolution multi-wavelength observations is needed to better constrain the dust opacity.
6.2 Comparison with other observations
6.2.1 L1527
A good consistency check is to determine whether a warm disk is consistent with the observed luminosity and mass accretion rate. For L1527, mass accretion rates between yr-1 (Tobin et al. 2012, for a 0.19 star assuming ) and yr-1 (Ohashi et al. 1997, for a 0.1 star) have been estimated. Scaling the value derived by Tobin et al. (2012) for a 0.45 star yields a rate of yr-1. According to physical models by Harsono et al. (2015), no CO freeze-out is expected in an embedded disk for accretion rates yr-1. In addition, Frimann et al. (2017) present an expression to predict the size of the C18O-emitting region based on a set of axi-symmetric radiative transfer models for protostellar envelopes:
| (3) |
where is the distance to the source, and the angular coefficient equals diameters of 0.89 or 1.64 for a CO freeze-out temperature of 28 or 21 K, respectively. For a bolometric luminosity of 1.9 (Kristensen et al. 2012), the FWHM of the C18O-emitting region is then expected to be 1.94 or 3.58 for the respective freeze-out temperatures. This is larger than the derived disk diameters of 1.06 (A17) or 1.79 (T13). These models thus suggest that a disk warm enough to retain CO in the gas-phase is consistent with the measured accretion rates and luminosity.
Sakai et al. (2014b) assess the physical conditions in L1527 by using a non-LTE large-velocity-gradient (LVG) code. For regions the kinetic temperature of the cyclic-C3H2 emitting region is found to be between 23 and 33 K. This is consistent with the temperature profile from T13. In the SO emitting region around the postulated centrifugal barrier (100 AU), the gas temperature is suggested to be higher than 60 K. Recent analysis of higher angular resolution SO observations suggest even higher temperatures (200 K) around the centrifugal barrier (Sakai et al. 2017). Due to a low signal-to-noise ratio within 100 AU, the authors cannot derive a temperature in the disk. The highest velocity offset where SO is present is 1.8 km s-1. At these blueshifted velocities the outer edge of the disk and inner region of the envelope are expected to be seen. Although the temperature in the outer disk cannot be determined without knowledge of the disk outer radius, a local temperature enhancement at the disk-envelope interface is expected to be visible. However, the 13CO and C18O observations presented here show no evidence of such high temperatures, despite being present in the gas phase around the centrifugal barrier. In addition, the beam size for the CO isotopologue observations is comparable to or much smaller than the beams for SO (Sakai et al. 2017, 2014b, resp.), so the lower temperatures based on CO are not likely due to beam dilution.
6.2.2 Other Class 0 and Class I disks
Detailed studies of the gas temperature have not been performed for other young disks. Murillo et al. (2015) show that DCO+ emission toward VLA1623 surrounds the disk traced in C18O emission. Since formation of DCO+ is enhanced at temperatures 30 K, this suggests that the temperature in the disk is too high for CO freeze-out. Attempts to assess whether young disks generally lack CO ice may be based on luminosity or the physical structure derived for the envelope. However, both approaches would yield large uncertainties. In the former case because the temperature structure does not only depend on luminosity, but also on the disk mass. In addition, whether the CO freeze-out temperature will be reached in the disk will depend on disk radius. The latter method is not likely to give reliable disk structures as the temperature and density in the inner envelope not necessarily continue smoothly into the disk (Persson et al. 2016). For example, disk shadowing may lower the temperature in the envelope just outside the disk (Murillo et al. 2015). High resolution (line) observations are thus required to derive the temperature in young disks.
The edge-on configuration of L1527 allows for the midplane temperature to be derived from 13CO and C18O emission. For less inclined disks, this will be much harder, if not impossible, since the emission is likely to become optically thick in the inner envelope or disk surface layers. Even less abundant isotopologues as C17O or 13C18O may be used (Zhang et al. 2017), but likely require long integration times. The easiest way to determine the presence of absence of cold CO-depleted gas may therefore be through observations of cold gas tracers such as N2H+, N2D+ or DCO+.
6.2.3 Class II disks
Until recently, thermal structures for Class II disks were derived from radiative transfer modeling of continuum emission, analysis of multiple CO lines (e.g., Dartois et al. 2003; Schwarz et al. 2016), or observations of chemical tracers of CO freeze-out (Qi et al. 2013, 2015; Mathews et al. 2013). These results are generally model-dependent, or limited to the vertical region where the emission originates. With the high spatial and spectral resolution and sensitivity provided by ALMA it is now possible to directly map the 2D temperature structure. Dutrey et al. (2017) present a method to derive the temperature structure (both radially and vertically) of near edge-on disks using position-velocity diagrams. They apply this technique to CO observations of the Flying Saucer disk and find that the overall thermal structure is consistent with a cold ( K) midplane where CO is frozen out and warmer upper layers. For intermediate inclined disks, emission from different regions can be separated due to the Keplerian rotation, given that the spectral resolution is high enough. Pinte et al. (2018) use this strategy to measure the altitude, velocity and temperature of the CO emitting layers in the disk around IM Lupi. Their results are again consistent with a CO-depleted midplane.
Recent surveys of Class II disks have revealed gas-to-dust ratios upto two or three orders of magnitude below the ISM value of 100 (Ansdell et al. 2016, 2017; Barenfeld et al. 2016; Long et al. 2017). Whether this is the result of general gas loss or a depletion of CO on top of freeze-out and photodissociation remains an open question. Detailed studies of TW Hya, one of the few disks for which the gas mass is derived from HD emission, point to an additional depletion of CO (Favre et al. 2013; Schwarz et al. 2016), and carbon in general (Kama et al. 2016). Possible explanations for these low abundances are chemical evolution into more complex species, either in the gas or in the ice, or the lock up of carbon in large icy bodies. Determination of the CO abundance in younger disks may help shed some light on this problem. For example, low CO abundances in embedded disks would make general gas loss a less likely explanation. However, at least for L1527, we find no evidence for an order of magnitude reduction in CO abundance. This suggests that L1527 has not gone through a long dense pre-stellar core phase in which CO has been turned into other species, and hints that the physical or chemical processes that are responsible for observed low CO abundances occur on timescales longer than the Class 0 lifetime, or start at later stages.
6.3 Implications of a warm disk in the embedded phase
An important question in planet formation theory is whether the composition of the planet forming material is inherited from the parental cloud, processed on the way to the disk, or completely reset to atoms, as this will influence planet composition (e.g., Aikawa et al. 1999; Hincelin et al. 2013; Pontoppidan et al. 2014; Eistrup et al. 2016). Physicochemical models by Visser et al. (2009b) have shown that not all ices are directly incorporated into the disk, but can instead have desorbed and even recondensed. In addition, Drozdovskaya et al. (2016) show that processing of ices while the material falls onto the disk can lead to enhancement of CO2 ice and organics, at the expense of CO and methanol ice, respectively. The observed absence of a CO freeze-out region in the L1527 disk thus confirms that the chemical composition of the disk may not be entirely inherited from the dense cloud core, where most CO is frozen out.
In particular, the C/O ratio in the ice will thus not be inherited. The bulk of oxygen is expected to be in H2O and CO2, while CO is a dominant carbon carrier. Therefore, desorption of CO will relatively deplete the ice of carbon, lowering the C/O ratio (Öberg et al. 2011). The C/O ratio of icy grains in a warm disk will thus be lower than in the parental cloud. Furthermore, if planetesimals are formed during the embedded stage, these planetesimals will have lower bulk C/O ratios than their counterparts formed in the cold outer regions of Class II disks. If young disks in general are found to be warm, an interesting question would be how long this warm phase lasts. That is, do disks remain warm throughout the Class I phase, or have they cooled sufficiently before the envelope is fully dissipated? Answering this question requires detailed studies of young disks during both the Class 0 and Class I phase.
7 Conclusions
Temperature is an important parameter for the physical and chemical evolution of disks around young stars, and therefore for the outcome of planet formation. Both observations and models point to Class II disks having a large cold gas reservoir where CO is frozen out. In contrast, models suggest that during earlier stages the disk can be warm enough to prevent CO freeze-out. However, so far the temperature structure of embedded disks remained poorly constrained observationally. In this work we have analyzed archival ALMA data of 13CO, C18O and N2D+ to elucidate the midplane temperature structure of the edge-on Class 0/I disk around L1527. Based on the following results we conclude that this young embedded disk is indeed warm enough (20–25 K) to have CO in the gas-phase throughout the entire disk:
-
•
13CO and C18O emission is detected throughout the disk and inner envelope, while N2D+, which can only be abundant when CO is frozen out, is not detected.
-
•
Deriving the exact radius at which the 13CO and C18O emission originates is non-trivial due to CO being present in both the disk and inner envelope, and the emission being optically thick. However, the channel maps provide a global view of the temperature in the disk and inner envelope, and show temperatures above 25 K along the midplane.
-
•
A radial power law for the midplane temperature extrapolated from the highest velocity channels suggests that the disk is warm (20 K) out to at least 75 AU. Deriving such power law from synthesized images indicates that these observations underestimate the midplane temperature. More accurate temperature measurements are expected for higher resolution observations. Moreover, the temperature derived from the synthesized images is lower than that from the observations. The disk midplane may thus be warmer than the temperature profile derived by T13 from the continuum emission, which has a temperature of 26 K at the disk outer radius (125 AU).
-
•
Radiative transfer modeling for a warm (no CO freeze-out), intermediate (CO snowline at 71 AU) and cold disk (CO snowline at 23 AU) suggest that the less abundant C18O is a more sensitive diagnostic of the CO distribution in the disk than 13CO. The warm model best reproduces the observations for both molecules, while the intermediate model is a worse match for C18O.
In addition, based on radiative transfer modeling using the best-fit model from T13, there is no evidence for a low gas-phase CO abundance (), as has been suggested for some Class II disks, or an increased abundance at the disk-envelope interface, as suggested by A17.
Conclusions about whether young disks in general are warm, and if this is the case, how long this warm phase lasts, will require detailed studies of more disks in both the Class 0 and Class I phase.
Acknowledgements.
We would like to thank the referee for constructive and insightful comments. This paper makes use of the following ALMA data: ADS/JAO.ALMA#2013.1.01086.S. ALMA is a partnership of ESO (representing its member states), NSF (USA) and NINS (Japan), together with NRC (Canada), MOST and ASIAA (Taiwan), and KASI (Republic of Korea), in cooperation with the Republic of Chile. The Joint ALMA Observatory is operated by ESO, AUI/NRAO and NAOJ. Astrochemistry in Leiden is supported by the European Union A-ERC grant 291141 CHEMPLAN, by the Netherlands Research School for Astronomy (NOVA) and by a Royal Netherlands Academy of Arts and Sciences (KNAW) professor prize. M.L.R.H acknowledges support from a Huygens fellowship from Leiden University, and J.J.T acknowledges support from grant 639.041.439 from the Netherlands Organisation for Scientific Research (NWO).References
- Adams & Shu (1986) Adams, F. C. & Shu, F. H. 1986, ApJ, 308, 836
- Aikawa et al. (2015) Aikawa, Y., Furuya, K., Nomura, H., & Qi, C. 2015, ApJ, 807, 120
- Aikawa et al. (1999) Aikawa, Y., Umebayashi, T., Nakano, T., & Miyama, S. M. 1999, ApJ, 519, 705
- Aikawa et al. (2002) Aikawa, Y., van Zadelhoff, G. J., van Dishoeck, E. F., & Herbst, E. 2002, A&A, 386, 622
- Ali-Dib (2017) Ali-Dib, M. 2017, MNRAS, 467, 2845
- ALMA Partnership et al. (2015) ALMA Partnership, Brogan, C. L., Pérez, L. M., et al. 2015, ApJ, 808, L3
- Anderl et al. (2016) Anderl, S., Maret, S., Cabrit, S., et al. 2016, A&A, 591, A3
- Andrews et al. (2013) Andrews, S. M., Rosenfeld, K. A., Kraus, A. L., & Wilner, D. J. 2013, ApJ, 771, 129
- Andrews et al. (2010) Andrews, S. M., Wilner, D. J., Hughes, A. M., Qi, C., & Dullemond, C. P. 2010, ApJ, 723, 1241
- Ansdell et al. (2017) Ansdell, M., Williams, J. P., Manara, C. F., et al. 2017, AJ, 153, 240
- Ansdell et al. (2016) Ansdell, M., Williams, J. P., van der Marel, N., et al. 2016, ApJ, 828, 46
- Aso et al. (2017) Aso, Y., Ohashi, N., Aikawa, Y., et al. 2017, ApJ, 849, 56
- Barenfeld et al. (2016) Barenfeld, S. A., Carpenter, J. M., Ricci, L., & Isella, A. 2016, ApJ, 827, 142
- Bergin et al. (2001) Bergin, E. A., Ciardi, D. R., Lada, C. J., Alves, J., & Lada, E. A. 2001, ApJ, 557, 209
- Brinch et al. (2007) Brinch, C., Crapsi, A., Jørgensen, J. K., Hogerheijde, M. R., & Hill, T. 2007, A&A, 475, 915
- Brinch & Hogerheijde (2010) Brinch, C. & Hogerheijde, M. R. 2010, A&A, 523, A25
- Burke & Brown (2010) Burke, D. J. & Brown, W. A. 2010, Physical Chemistry Chemical Physics (Incorporating Faraday Transactions), 12, 5947
- Caselli et al. (2002a) Caselli, P., Benson, P. J., Myers, P. C., & Tafalla, M. 2002a, ApJ, 572, 238
- Caselli et al. (2002b) Caselli, P., Walmsley, C. M., Zucconi, A., et al. 2002b, ApJ, 565, 344
- Cassen & Moosman (1981) Cassen, P. & Moosman, A. 1981, Icarus, 48, 353
- Chiang & Goldreich (1997) Chiang, E. I. & Goldreich, P. 1997, ApJ, 490, 368
- Chuang et al. (2016) Chuang, K.-J., Fedoseev, G., Ioppolo, S., van Dishoeck, E. F., & Linnartz, H. 2016, MNRAS, 455, 1702
- Codella et al. (2014) Codella, C., Cabrit, S., Gueth, F., et al. 2014, A&A, 568, L5
- Crapsi et al. (2005) Crapsi, A., Caselli, P., Walmsley, C. M., et al. 2005, ApJ, 619, 379
- D’Alessio et al. (1997) D’Alessio, P., Calvet, N., & Hartmann, L. 1997, ApJ, 474, 397
- Dartois et al. (2003) Dartois, E., Dutrey, A., & Guilloteau, S. 2003, A&A, 399, 773
- Davis (2005) Davis, S. S. 2005, ApJ, 620, 994
- Drozdovskaya et al. (2016) Drozdovskaya, M. N., Walsh, C., van Dishoeck, E. F., et al. 2016, MNRAS, 462, 977
- Dutrey et al. (1997) Dutrey, A., Guilloteau, S., & Guelin, M. 1997, A&A, 317, L55
- Dutrey et al. (2017) Dutrey, A., Guilloteau, S., Piétu, V., et al. 2017, A&A, 607, A130
- Eistrup et al. (2016) Eistrup, C., Walsh, C., & van Dishoeck, E. F. 2016, A&A, 595, A83
- Emprechtinger et al. (2009) Emprechtinger, M., Caselli, P., Volgenau, N. H., Stutzki, J., & Wiedner, M. C. 2009, A&A, 493, 89
- Favre et al. (2013) Favre, C., Cleeves, L. I., Bergin, E. A., Qi, C., & Blake, G. A. 2013, ApJ, 776, L38
- Fayolle et al. (2016) Fayolle, E. C., Balfe, J., Loomis, R., et al. 2016, ApJ, 816, L28
- Foster et al. (2013) Foster, J. B., Mandel, K. S., Pineda, J. E., et al. 2013, MNRAS, 428, 1606
- Frimann et al. (2017) Frimann, S., Jørgensen, J. K., Dunham, M. M., et al. 2017, A&A, 602, A120
- Garaud & Lin (2007) Garaud, P. & Lin, D. N. C. 2007, ApJ, 654, 606
- Garrod & Herbst (2006) Garrod, R. T. & Herbst, E. 2006, A&A, 457, 927
- Goldsmith & Langer (1999) Goldsmith, P. F. & Langer, W. D. 1999, ApJ, 517, 209
- Harsono et al. (2015) Harsono, D., Bruderer, S., & van Dishoeck, E. F. 2015, A&A, 582, A41
- Harsono et al. (2014) Harsono, D., Jørgensen, J. K., van Dishoeck, E. F., et al. 2014, A&A, 562, A77
- Hartmann et al. (1998) Hartmann, L., Calvet, N., Gullbring, E., & D’Alessio, P. 1998, ApJ, 495, 385
- Hincelin et al. (2013) Hincelin, U., Wakelam, V., Commerçon, B., Hersant, F., & Guilloteau, S. 2013, ApJ, 775, 44
- Huang & Öberg (2015) Huang, J. & Öberg, K. I. 2015, ApJ, 809, L26
- Huang et al. (2017) Huang, J., Öberg, K. I., Qi, C., et al. 2017, ApJ, 835, 231
- Jørgensen et al. (2004) Jørgensen, J. K., Hogerheijde, M. R., van Dishoeck, E. F., Blake, G. A., & Schöier, F. L. 2004, A&A, 413, 993
- Jørgensen et al. (2009) Jørgensen, J. K., van Dishoeck, E. F., Visser, R., et al. 2009, A&A, 507, 861
- Kama et al. (2016) Kama, M., Bruderer, S., van Dishoeck, E. F., et al. 2016, A&A, 592, A83
- Keene & Masson (1990) Keene, J. & Masson, C. R. 1990, ApJ, 355, 635
- Kenyon et al. (1993) Kenyon, S. J., Calvet, N., & Hartmann, L. 1993, ApJ, 414, 676
- Kenyon & Hartmann (1987) Kenyon, S. J. & Hartmann, L. 1987, ApJ, 323, 714
- Kristensen et al. (2012) Kristensen, L. E., van Dishoeck, E. F., Bergin, E. A., et al. 2012, A&A, 542, A8
- Kwon et al. (2009) Kwon, W., Looney, L. W., Mundy, L. G., Chiang, H.-F., & Kemball, A. J. 2009, ApJ, 696, 841
- Law et al. (2017) Law, C. J., Ricci, L., Andrews, S. M., Wilner, D. J., & Qi, C. 2017, AJ, 154, 255
- Lee (2010) Lee, C.-F. 2010, ApJ, 725, 712
- Lindberg et al. (2014) Lindberg, J. E., Jørgensen, J. K., Brinch, C., et al. 2014, A&A, 566, A74
- Lommen et al. (2008) Lommen, D., Jørgensen, J. K., van Dishoeck, E. F., & Crapsi, A. 2008, A&A, 481, 141
- Long et al. (2017) Long, F., Herczeg, G. J., Pascucci, I., et al. 2017, ApJ, 844, 99
- Looney et al. (2000) Looney, L. W., Mundy, L. G., & Welch, W. J. 2000, ApJ, 529, 477
- Lynden-Bell & Pringle (1974) Lynden-Bell, D. & Pringle, J. E. 1974, MNRAS, 168, 603
- Madhusudhan et al. (2014) Madhusudhan, N., Amin, M. A., & Kennedy, G. M. 2014, ApJ, 794, L12
- Mathews et al. (2013) Mathews, G. S., Klaassen, P. D., Juhász, A., et al. 2013, A&A, 557, A132
- van ’t Hoff et al. (2017) van ’t Hoff, M. L. R., Walsh, C., Kama, M., Facchini, S., & van Dishoeck, E. F. 2017, A&A, 599, A101
- van Zadelhoff et al. (2001) van Zadelhoff, G.-J., van Dishoeck, E. F., Thi, W.-F., & Blake, G. A. 2001, A&A, 377, 566
- Min et al. (2011) Min, M., Dullemond, C. P., Kama, M., & Dominik, C. 2011, Icarus, 212, 416
- Miotello et al. (2014) Miotello, A., Testi, L., Lodato, G., et al. 2014, A&A, 567, A32
- Miotello et al. (2017) Miotello, A., van Dishoeck, E. F., Williams, J. P., et al. 2017, A&A, 599, A113
- Murillo et al. (2015) Murillo, N. M., Bruderer, S., van Dishoeck, E. F., et al. 2015, A&A, 579, A114
- Murillo et al. (2013) Murillo, N. M., Lai, S.-P., Bruderer, S., Harsono, D., & van Dishoeck, E. F. 2013, A&A, 560, A103
- Nomura et al. (2016) Nomura, H., Tsukagoshi, T., Kawabe, R., et al. 2016, ApJ, 819, L7
- Öberg et al. (2011) Öberg, K. I., Murray-Clay, R., & Bergin, E. A. 2011, ApJ, 743, L16
- Öberg et al. (2010) Öberg, K. I., Qi, C., Fogel, J. K. J., et al. 2010, ApJ, 720, 480
- Ohashi et al. (1997) Ohashi, N., Hayashi, M., Ho, P. T. P., & Momose, M. 1997, ApJ, 475, 211
- Ohashi et al. (2014) Ohashi, N., Saigo, K., Aso, Y., et al. 2014, ApJ, 796, 131
- Oya et al. (2015) Oya, Y., Sakai, N., Lefloch, B., et al. 2015, ApJ, 812, 59
- Pagani et al. (2010) Pagani, L., Steinacker, J., Bacmann, A., Stutz, A., & Henning, T. 2010, Science, 329, 1622
- Pascucci et al. (2016) Pascucci, I., Testi, L., Herczeg, G. J., et al. 2016, ApJ, 831, 125
- Persson et al. (2016) Persson, M. V., Harsono, D., Tobin, J. J., et al. 2016, A&A, 590, A33
- Pinte et al. (2018) Pinte, C., Ménard, F., Duchêne, G., et al. 2018, A&A, 609, A47
- Pontoppidan et al. (2014) Pontoppidan, K. M., Salyk, C., Bergin, E. A., et al. 2014, Protostars and Planets VI, 363
- Qi et al. (2015) Qi, C., Öberg, K. I., Andrews, S. M., et al. 2015, ApJ, 813, 128
- Qi et al. (2013) Qi, C., Öberg, K. I., Wilner, D. J., et al. 2013, Science, 341, 630
- Roberts & Millar (2007) Roberts, H. & Millar, T. J. 2007, A&A, 471, 849
- Sakai et al. (2017) Sakai, N., Oya, Y., Higuchi, A. E., et al. 2017, MNRAS, 467, L76
- Sakai et al. (2014a) Sakai, N., Oya, Y., Sakai, T., et al. 2014a, ApJ, 791, L38
- Sakai et al. (2014b) Sakai, N., Sakai, T., Hirota, T., et al. 2014b, Nature, 507, 78
- Salinas et al. (2017) Salinas, V. N., Hogerheijde, M. R., Mathews, G. S., et al. 2017, A&A, 606, A125
- Schoonenberg & Ormel (2017) Schoonenberg, D. & Ormel, C. W. 2017, A&A, 602, A21
- Schwarz et al. (2016) Schwarz, K. R., Bergin, E. A., Cleeves, L. I., et al. 2016, ApJ, 823, 91
- Segura-Cox et al. (2016) Segura-Cox, D. M., Harris, R. J., Tobin, J. J., et al. 2016, ApJ, 817, L14
- Shakura & Sunyaev (1973) Shakura, N. I. & Sunyaev, R. A. 1973, A&A, 24, 337
- Stevenson & Lunine (1988) Stevenson, D. J. & Lunine, J. I. 1988, Icarus, 75, 146
- Takakuwa et al. (2012) Takakuwa, S., Saito, M., Lim, J., et al. 2012, ApJ, 754, 52
- Thi et al. (2004) Thi, W.-F., van Zadelhoff, G.-J., & van Dishoeck, E. F. 2004, A&A, 425, 955
- Tielens & Hagen (1982) Tielens, A. G. G. M. & Hagen, W. 1982, A&A, 114, 245
- Tobin et al. (2013a) Tobin, J. J., Bergin, E. A., Hartmann, L., et al. 2013a, ApJ, 765, 18
- Tobin et al. (2015) Tobin, J. J., Dunham, M. M., Looney, L. W., et al. 2015, ApJ, 798, 61
- Tobin et al. (2008) Tobin, J. J., Hartmann, L., Calvet, N., & D’Alessio, P. 2008, ApJ, 679, 1364
- Tobin et al. (2012) Tobin, J. J., Hartmann, L., Chiang, H.-F., et al. 2012, Nature, 492, 83
- Tobin et al. (2013b) Tobin, J. J., Hartmann, L., Chiang, H.-F., et al. 2013b, ApJ, 771, 48
- Torres et al. (2007) Torres, R. M., Loinard, L., Mioduszewski, A. J., & Rodríguez, L. F. 2007, ApJ, 671, 1813
- Ulrich (1976) Ulrich, R. K. 1976, ApJ, 210, 377
- van der Tak (2011) van der Tak, F. 2011, in IAU Symposium, Vol. 280, The Molecular Universe, ed. J. Cernicharo & R. Bachiller, 449–460
- van der Tak et al. (2007) van der Tak, F. F. S., Black, J. H., Schöier, F. L., Jansen, D. J., & van Dishoeck, E. F. 2007, A&A, 468, 627
- Visser et al. (2009a) Visser, R., van Dishoeck, E. F., & Black, J. H. 2009a, A&A, 503, 323
- Visser et al. (2009b) Visser, R., van Dishoeck, E. F., Doty, S. D., & Dullemond, C. P. 2009b, A&A, 495, 881
- Walsh et al. (2012) Walsh, C., Nomura, H., Millar, T. J., & Aikawa, Y. 2012, ApJ, 747, 114
- Walsh et al. (2015) Walsh, C., Nomura, H., & van Dishoeck, E. 2015, A&A, 582, A88
- Whitney et al. (2003) Whitney, B. A., Wood, K., Bjorkman, J. E., & Wolff, M. J. 2003, ApJ, 591, 1049
- Wilson & Rood (1994) Wilson, T. L. & Rood, R. 1994, ARA&A, 32, 191
- Yang et al. (2010) Yang, B., Stancil, P. C., Balakrishnan, N., & Forrey, R. C. 2010, ApJ, 718, 1062
- Yen et al. (2017) Yen, H.-W., Koch, P. M., Takakuwa, S., et al. 2017, ApJ, 834, 178
- Yen et al. (2013) Yen, H.-W., Takakuwa, S., Ohashi, N., & Ho, P. T. P. 2013, ApJ, 772, 22
- Zhang et al. (2017) Zhang, K., Bergin, E. A., Blake, G. A., Cleeves, L. I., & Schwarz, K. R. 2017, Nature Astronomy, 1, 0130
Appendix A 13CO/C18O line ratio
Figure 14 shows the 13CO/C18O line ratios from RADEX calculations for different temperatures and CO column densities.
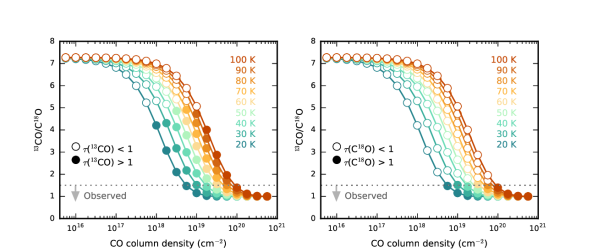
Appendix B Brightness temperature
The observed brightness temperature for 13CO and C18O (as shown in Fig. 3) for all channels are presented in Figs. 16 and 16, respectively. The central channels in which most emission is being resolved out are omitted.
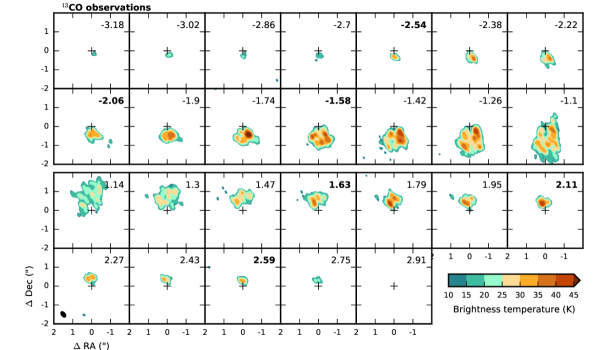
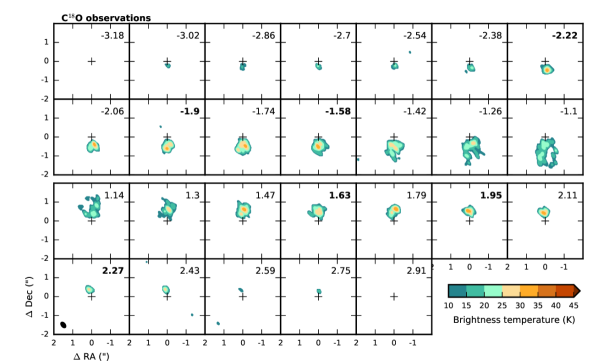
Appendix C Physical model for disk and envelope
To analyse the observed CO isotopologue emission and make synthetic images, we adopt for the physical structure the best fit model from T13. This model is the result of fitting a large grid of 3D radiative transfer models to the thermal dust emission in the sub/millimeter, the scattered light image, and the multi-wavelength SED. A full description of the modeling can be found in Whitney et al. (2003), Tobin et al. (2008) and T13, while a brief summary is given below.
The model consists of a Keplerian disk embedded within an infalling rotating envelope. For the envelope, the UCM model is adopted (Ulrich 1976; Cassen & Moosman 1981), which describes the collapse of an isothermal, spherically symmetric, and uniformly rotating cloud. It assumes free fall with each particle conserving angular momentum. As a result, particles move along parabolic paths, with the velocity at point given by:
| (4) |
| (5) |
| (6) |
where is the inclination of the particle’s orbital plane relative to the rotation axis. can be found analytically by solving the following equation:
| (7) |
where is the centrifugal radius, that is the radius at which the radial velocity is equal to the rotation velocity.
The envelope density structure is spherical at large radii, but becomes flattened near the centrifugal radius due to rotation:
| (8) |
where is the mass infall rate of the envelope onto the disk. Inside , , while outside , . The bipolar outflow cavities extend from the central protostar to the outer radius of the envelope. To reproduce the scattered light morphology, a dual-cavity structure was required, with the cavity being more narrow in the inner 100 AU and wider at larger radii (see Fig. 18, and Tobin et al. 2008 for details). Inside the outflow cavity the density is set to zero.
The disk has a Keplerian velocity profile, that is,
| (9) |
This means that at radii larger than the velocity structure is given by Eqs 4–6, while at smaller radii Eq. 9 is adopted. A standard flared accretion density structure was assumed for the disk (Shakura & Sunyaev 1973; Lynden-Bell & Pringle 1974; Hartmann et al. 1998), that is,
| (10) |
where the scaleheight is given by
| (11) |
To fit the multi-wavelength continuum observations, a grid of models was created by T13 in which the envelope properties were kept constant, while varying the disk properties (radius, flaring, radial density profile, scale height and mass). In addition, the dust spectral index was varied (see T13 for details on the dust properties). A protostellar mass of 0.5 was adopted, but no parameters directly depend on this value. The mass infall rate was taken to be yr-1. The accretion luminosity was set to = 1.75 and the protostellar luminosity to 1.0 . For creating the continuum images, an inclination of 85∘ was used such that the west side of the disk and envelope is nearest to the observer (see Fig. 17). The best-fitting disk model has a disk radius of = 125 AU. The disk was found to be highly flared (, and = 48 AU), and have . The 2D density and temperature (calculated from the dust radiative transfer) structure are presented in Fig. 18, and Fig. 19 shows the corresponding radial profiles for the midplane.
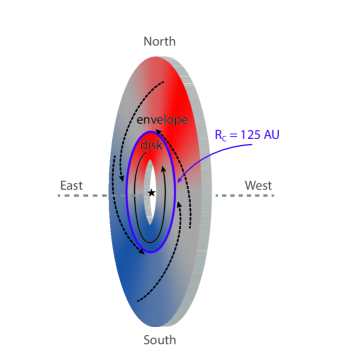
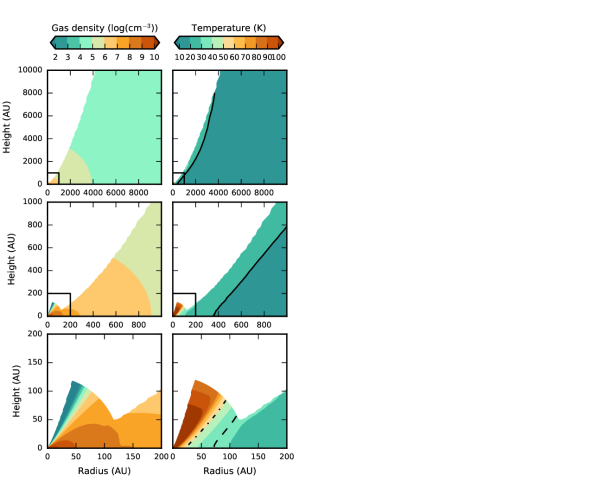
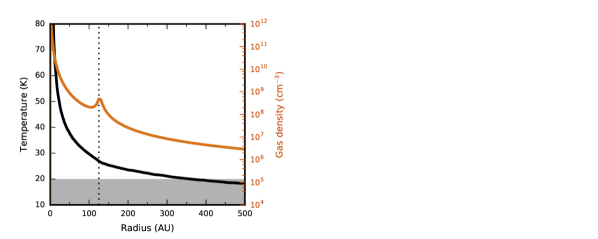
Appendix D Free fall velocity
Figure 20 presents the midplane velocity structure along the line of sight as shown in Fig. 5, but for a free fall,
| (12) |
rather than a infalling rotating velocity profile (Eqs. 4–6) in the envelope. The surface for 13CO and C18O in five representative velocity channels is shown in Fig. 21.