Rotation of Low-Mass Stars in Upper Scorpius and Rho Ophiuchus with K2
Abstract
We present an analysis of K2 light curves (LCs) for candidate members of the young Upper Sco (USco) association 8 Myr) and the neighboring Oph embedded cluster (1 Myr). We establish 1300 stars as probable members, 80% of which are periodic. The phased LCs have a variety of shapes which can be attributed to physical causes ranging from stellar pulsation and stellar rotation to disk-related phenomena. We identify and discuss a number of observed behaviors. The periods are 0.2-30 days with a peak near 2 days and the rapid period end nearing break-up velocity. M stars in the young USco region rotate systematically faster than GK stars, a pattern also present in K2 data for the older Pleiades and Praesepe systems. At higher masses (types FGK), the well-defined period-color relationship for slowly rotating stars seen in the Pleiades and Praesepe is not yet present in USco. Circumstellar disks are present predominantly among the more slowly rotating Ms in USco, with few disks in the sub-day rotators. However, M dwarfs with disks rotate faster on average than FGK systems with disks. For four of these disked Ms, we provide direct evidence for disk-locking based on the K2 LC morphologies. Our preliminary analysis shows a relatively mass-independent spin-up by a factor of 3.5 between USco and the Pleiades, then mass-dependent spin-down between Pleiades and Praesepe.
1 Introduction
Early empirical studies of the angular momentum evolution of relatively low mass stars were based on spectroscopic projected rotational velocities () of A and F stars in nearby open clusters (e.g., Kraft 1965; Kraft 1967a,b; Abt et al. 1969) because those were the stars amenable to study with photographic plates as detectors. The striking dichotomy between high-mass rapid rotators and low-mass slow rotators required strong angular momentum loss in Solar analogs (Weber & Davis 1967). Early theoretical models of angular momentum evolution (e.g., Belcher & MacGregor 1976), therefore, concentrated on main sequence (MS) stars and ages 100 Myr. Subsequently, high resolution spectra using image-tube detectors of pre-main-sequence stars (Kuhi 1978) suggested a range of rotational velocities at few Myr ages, while rotation periods for K dwarfs in the Pleiades (age 125 Myr) suggested a wide range in rotation on the zero-age main sequence (ZAMS) for low mass stars (van Leeuwen & Alphenaar 1982). This led both observers and theoretical modellers to push their angular momentum studies to much younger ages. On the observational side, we now have rotation data for low mass, 1-2 Myr old stars in Taurus (e.g., Bouvier et al. 1993, 1997a) and Orion (e.g., Rebull 2001; Herbst et al. 2002). On the theoretical side, beginning with Endal & Sofia (1981), theoretical models of the angular momentum evolution of low mass stars generally began at ages near 1 Myr and followed the evolution to the MS and beyond. In order to account for the wide range of rotation rates on the MS at low masses, those models generally added extra free parameters related to the range in lifetimes of primordial disks and star-disk angular momentum regulation mechanisms (e.g., Collier Cameron et al. 1995; Bouvier et al. 1997b; Tinker et al. 2002); rapid rotators on the ZAMS were ascribed to stars with very short-lived circumstellar disks whereas the stars that arrive on the ZAMS as slow rotators were linked to stars with the longest lived disks.
A problem with the existing angular momentum models is simply that there are too many free parameters: observed pattern requires a model of internal angular momentum transport, loss from magnetized solar-like winds, and a treatment of star-disk interactions. One way to better confront the models would be to identify a pre-main-sequence stellar population where the stars are still high up on their evolutionary tracks but old enough that their disks are no longer present – that is, a nearby, populous, star-forming region with an age of order 10 Myr. At such an age, whatever effects disks and accretion have on pre-main-sequence rotation rates would have already taken place; theoretical models that begin at such an age could have many fewer free parameters and thus might hopefully be more amenable to placing strong constraints on the remaining free parameters. Cool main sequence stars (M dwarfs) are also either fully convective or nearly so. This allows modelers of these stars to sidestep complex issues around internal angular momentum transport, such as core-envelope coupling timescales (Pinsonneault 1997).
NASA’s K2 mission (Howell et al. 2014) has recently provided high quality, long duration, high cadence light curves (LCs) for more than a thousand low mass members of the 8 Myr old Upper Scorpius association. Upper Sco (USco) provides a nearly ideal match to the desired template post-disk pre-main sequence population needed to better test the theoretical angular momentum evolution models. It is nearby ( 140 pc), populous and at approximately the desired age, though the precise age is likely between 3 and 10 Myr and still a subject of debate (see, e.g., Feiden 2016 [10 Myr], Herczeg & Hillebrand 2015 [5 Myr], Pecaut et al. 2012 [11 Myr], Slesnick et al. 2008 [4 Myr], Preibisch et al. 2002 [5 Myr]). Not quite ideal is that a small fraction of the low mass members of Upper Sco are still actively accreting and have not lost their primordial disks (e.g., Carpenter et al. 2006, 2009; Cody et al. 2017, 2018 submitted). Even for those stars, however, their disks will only last a few Myr more and their rotation rate at 8 Myr will be a reasonable reflection of what it will be when the disk goes away.
In this paper, we provide rotation periods derived from the K2 Campaign 2 data for both the Upper Sco association and for its nearby 1 Myr old neighbor Oph. Much of our current analysis is very similar to that we conducted in the Pleiades (Rebull et al. 2016a,b, Stauffer et al. 2016b; papers I, II, and III, respectively) and Praesepe (Rebull et al. 2017; paper IV). Somers et al. (2017) presented an early version of these USco results, and provided a theoretical discussion of the correlation between mass and rotation.
In Section 2, we summarize the data we amassed, including information about the K2 data, literature information collection for the targets, member selection, dereddening, disk identification. Section 3 begins with period identification and interpretation, and comparison of our periods to those from the literature. This section ends with the color-magnitude diagrams for USco and Oph. Section 4 discusses the influence of disks on the period distribution of USco, including evidence for disk locking in these LCs. Section 5 presents the distributions of periods and periods against color as a proxy for mass. We also compare USco to the Pleiades (papers I-III) and Praesepe (paper IV). In Section 6, we include aspects of the analysis of the USco and Oph LCs and periods in the same fashion as we did for the Pleiades in papers I-III and for Praesepe in paper IV. Finally, we summarize our results in Section 7.
2 Data
2.1 K2 Data
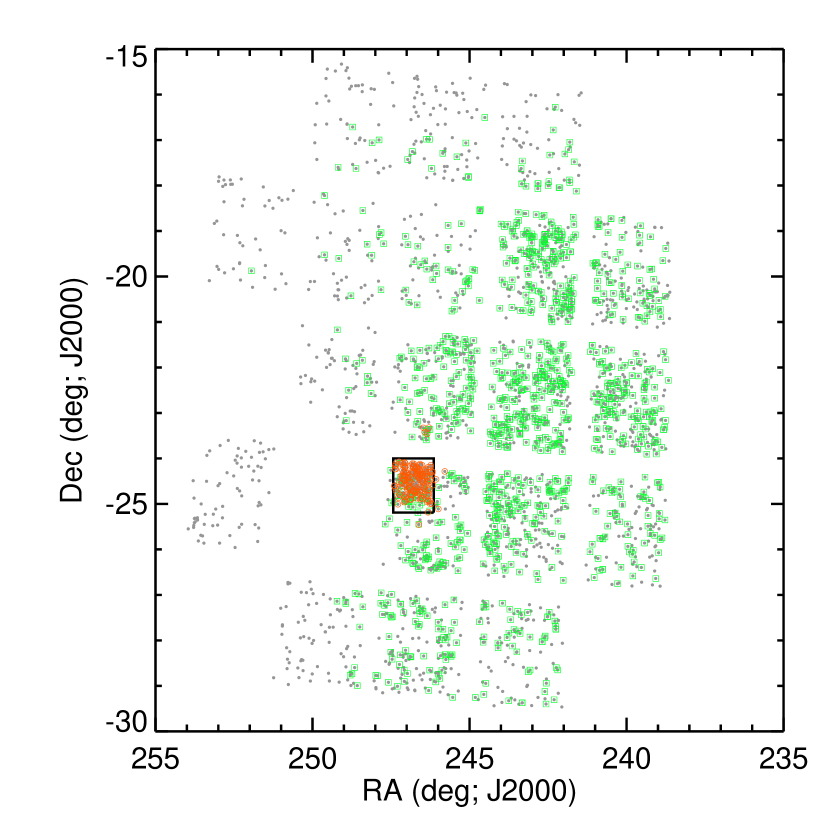
USco and Oph were observed in K2 campaign 2, from 2014 Aug 23 to 2014 Nov 13 (82 d). There are 2631 objects with K2 LCs that have been claimed to be candidate members of USco or Oph. Figure 1 shows the distribution of these objects with K2 LCs on the sky; note the gaps between detectors. All of the LCs shown were observed in the long-cadence (30 min exposure) mode.
As discussed in papers I and IV, K2 data can be challenging to reduce because of the relatively large pixel sizes () and because the whole spacecraft slowly drifts and then repositions regularly every 0.245 d. Because Campaign 2 was relatively early in the repurposed K2 mission, many artifacts were present in these light curves that were not seen in later campaigns, presenting additional challenges; for example, there is a 1.97 d period in about 1% of the light curves that is most likely spacecraft-related. We removed all of the periods that we belive are instrumental111We did not find any 0.22 or 1.75 spurious periods, which were found by Saylor et al. 2017..
For each target, we selected the best LC from up to three different available LC versions. (1) A version with moving apertures with magnitudes computed for several different aperture sizes, using custom software developed by co-author Cody. (2) The ‘self-flat-fielding’ approach used by Vanderburg & Johnson (2014) and the K2SFF pipeline as obtained from MAST, the Mikulski Archive for Space Telescopes. (3) The LCs from the EVEREST2 pipeline (Luger et al. 2016, 2017), which uses pixel level decorrelation, as obtained from MAST. There are no pre-search data conditioning (PDC) versions for this campaign. We removed any data points corresponding to thruster firings and any others with bad data flags set in the corresponding data product. Many of the LC versions, particularly the EVEREST2 version, had large-scale structure remaining in the LCs that complicated the period searching; for those LCs, we applied a least-squares (Savitzky-Golay) polynomial smoothing filter (e.g., Press et al. 1992), as implemented in the IDLastro library222https://idlastro.gsfc.nasa.gov.
We inspected LCs from each reduction approach, and we selected the visually ‘best’ LC from among the LC versions. Any periodic signals are generally unambiguous, and are generally detected in all the LC versions.
Because this field is in the general direction of the Galactic Center (), the surface density of targets is very high and source confusion is a concern. By inspection of the region using IRSA’s Finder Chart tool333http://irsa.ipac.caltech.edu/applications/finderchart, as well as the diagnostic information provided by the various K2 data reduction pipelines, 75% (of the entire set of 2600 LCs) are likely isolated enough that the LC is likely correctly tied to that source. The rest are confused to varying degrees and some LC versions wandered off the target; sometimes special handling (e.g., using a very small aperture) was required to extract a viable period for the target of choice. In a very few cases, there is obvious source confusion in the K2 aperture; when this resulted in two periods or two targets close together whose LCs yielded functionally the same two periods, we attempted to assign the period(s) to the appropriate component. In a still smaller subset, we did not have enough confidence in this process to assign periods to individual components. The five EPIC numbers we omitted as duplicates or spatially unresolved with K2 are 204514548, 204350687, 204986988, 204949182, and 203760606; this leaves 2626 LCs to analyze.
2.2 Literature Photometry
We assembled information from the USco and Oph literature (Preibisch et al. 1998, 2001, 2002, Wilking et al. 2005, Erickson et al. 2011, Slesnick et al. 2006, Kraus & Hillenbrand 2007, Lodieu et al. 2011, Luhman & Mamajek 2012, Rizzuto et al. 2011, 2012, 2015). To assemble additional, uniform photometry, we queried many all-sky or large-scale surveys, including the Gaia DR1 release (Gaia Collaboration 2016) for their magnitudes, and the APASS database (Henden et al. 2016), particularly for magnitudes. For more optical data, we queried the recently released Pan-STARRS1 database (Chambers et al. 2016) and the Sloan Digital Sky Survey (SDSS; e.g., Ahn et al. 2014). We added to this infrared data from the Two-Micron All Sky Survey (2MASS; Skrutskie et al. 2006) and the Deep Near-Infrared Southern Sky Survey (DENIS; Foqué & Bertin 1995). For mid-IR data from the Spitzer Space Telescope (Werner et al. 2004), we included measurements from the Spitzer Enhanced Imaging Products, SEIP444http://irsa.ipac.caltech.edu/data/SPITZER/Enhanced/SEIP/overview.html, as well as from FEPS (Meyer et al. 2006). We included data from the Widefield Infrared Survey Explorer (WISE; Wright et al. 2010) at 3.5, 4.6, 12, and 22 m, and AKARI (Murakami et al. 2007) data at 9, 18, 65, 90, 140, and 160 m. Both WISE and AKARI are all-sky surveys, but have different sensitivities; nearly all of the stars considered here have WISE detections, but only 50 are detected with AKARI at 9 and 18 m, and there are only 5 detections at AKARI’s longer wavelengths. Finally, we incorporated Herschel Space Observatory Highly Processed Data Products (HPDP) for PACS 70 and 160 m (Marton et al. 2017). PACS did not conduct an all-sky survey; there are detections for 80 targets.
Papers I-IV use as a proxy for mass, and we wish to do the same here. We therefore need to either collect values of and or infer . We could obtain directly measured for nearly everything from 2MASS; for a very small handful of stars, is only available from DENIS, not 2MASS. We could find for about 60% of the stars, either from the literature (largely SIMBAD) or APASS, so we use those where they exist. Generally, these measurements are good to a few hundredths, though the provenance of the data and intrinsic variablity of the stars may mean the uncertainty is larger. If is not available and a Gaia magnitude is available, then was interpolated from as in paper IV; we estimate errors on these estimates to be 0.017-0.085 mag. For stars redder than , the relation from paper IV is linearly extrapolated to . Gaia-derived is used for about 30% of the sample. Similarly, if no Gaia mag is available, but a Pan-STARRS1 is available, then can be calibrated via an empirical relation between and ; this affects 8% of the sample, and errors on these estimates are probably comparable to those from Gaia-derived colors. If there is still no estimate of , then we use the is interpolated as part of the membership analysis described in Appendix A (this is done for 2% of the sample). As a last resort, if the SED is well-populated in the optical using literature photometry, a magnitude is interpolated from the SED, and compared to the observed (this is done for 3% of the sample). Essentially all (98.8%) of the 2626 targets thus have a derived or interpolated .
Table 1 includes, for the probable members (identified in the next section, 2.3), the relevant supporting photometric data, including the observed or interpolated , plus the periods we derive (in Section 3.1) and the IR excess assessments (Sec. 2.5). A similar table with all the probable non-members (NM) appears in Appendix B.
| Label | Contents |
|---|---|
| EPIC | Number in the Ecliptic Plane Input Catalog (EPIC) for K2 |
| coord | Right ascension and declination (J2000) for target |
| othername | Alternate name for target |
| Vmag | V magnitude (in Vega mags), if observed |
| Kmag | magnitude (in Vega mags), if observed |
| vmk-obs | , as directly observed, if and exist |
| vmk-used | used (observed or inferred; see text) |
| ev-k | adopted for this star (see § 2.4) |
| Kmag0 | dereddened magnitude (in Vega mags), as inferred (see §2.4) |
| vmk-dered | (dereddened ), as inferred (see § 2.4; rounded to nearest 0.1 to emphasize the relatively low accuracy) |
| uncertaintycode | two digit code denoting origin of and (see §2.2 and 2.4): First digit (origin of ): 1= measured directly from the literature (including SIMBAD) and from 2MASS; 2= from APASS and from 2MASS; 3= inferred from Gaia and from 2MASS (see §2.2); 4= inferred from Pan-STARRS1 and from 2MASS (see §2.2); 5= inferred from membership work (see §2.3; rare); 6= inferred from well-populated optical SED and from 2MASS (see §2.2); -9= no measure of . Second digit (origin of leading to ): 1=dereddening from diagram (see §2.4); 2=dereddening back to expected for spectral type; 3=used median =0.7 (see §2.4); -9= no measure of |
| P1 | Primary period, in days (taken to be primary rotation period; (see text) |
| P2 | Secondary period, in days |
| P3 | Tertiary period, in days |
| P4 | Quaternary period, in days |
| Membership | USco gold, silver, bronze, or ROph gold, silver, bronze (see §2.3) |
| Disk | Whether an IR excess (a disk) is present or not (see §4) |
| DiskStart | Where the IR excess starts or the limit of our knowledge of where there is no excess (see §4) |
| dipper | indicator of whether LC matches dipper characteristics (see §3.2.4) |
| burster | indicator of whether LC matches burster characteristics (see §3.2.4) |
| single/multi-P | indicator of whether single or multi-period star |
| dd | indicator of whether or not it is a double-dip LC (see §6.2 and E) |
| ddmoving | indicator of whether or not it is a moving double-dip LC (see §6.2 and E) |
| shch | indicator of whether or not it is a shape changer (see §6.2 and E) |
| beat | indicator of whether or not the full LC has beating visible (see §6.2 and E) |
| cpeak | indicator of whether or not the power spectrum has a complex, structured peak and/or has a wide peak (see §6.2 and E) |
| resclose | indicator of whether or not there are resolved close periods in the power spectrum (see §6.2 and E) |
| resdist | indicator of whether or not there are resolved distant periods in the power spectrum (see §6.2 and E) |
| pulsator | indicator of whether or not the power spectrum and period suggest that this is a pulsator (see §6.2 and E) |
2.3 Membership Summary
Because of the source surface density in the direction of USco and Oph, and because the net proper motion of the clusters ( mas yr-1) is relatively small, it is not a trivial undertaking to extract members from the background/foreground population. We investigated several possibilities for sifting members (proper motions from various sources, various color combinations); our final approach is summarized in Appendix A.
In the end, for USco, there are 1133 likely members; overall, 86% are periodic (see Sec. 3.1 below). For Oph, there are 180 likely members, with 60% periodic. We expect to find a higher fraction of periodic LCs among the member stars, so the relatively high fraction of periodic objects lends support to our membership lists. We also expect to find fewer periodic stars among the disked sample (see Sec. 2.5 below); there are more disks among Oph, so the lower periodic fraction there makes sense.
This process leaves 1313 LCs (50% of the entire sample) that are tied to objects that we believe are likely to be NM. However, specifically because the membership lists were difficult to obtain, and because upcoming data releases (e.g., Gaia) will shed more light on membership, we analyzed all of these light curves in the same way, and provide information on the remaining 1313 LCs in Appendix B. Future investigators coming to different conclusions about membership can thus include the objects (and their periods) as presented in the Appendix for a reanalysis.
2.4 Dereddening
The reddening in the direction of USco and Oph is very uneven and can be substantial. Spectral types are available for 60% of the members; generally these are biased towards the earlier (brighter) types and USco members. In order to deredden the ensemble, specifically the colors, we took the approach summarized here.
magnitudes are available for 99% of the entire sample, so we can place nearly all of the stars on a vs. diagram. Expected colors for young stars can be found in Pecaut & Mamajek (2013). We can move about three-quarters of the sample back along the reddening law derived by Indebetouw et al. (2008) to that Pecaut & Mamajek relation. For some red stars, the placement of the star on the color-color diagram suggests that the star is likely to be subject to an IR excess, and so we deredden back to the T Tauri locus from Meyer et al. (1997). Note that there is a discontinuity between the end of the Pecaut & Mamajek relation and the beginning of the T Tauri locus (noted in Meyer et al. 1997); this results in a small gap in the dereddened distibution between 0.9 and 1.0. Most stars have 0.95; only the stars that have the largest disks result in 1, and few of those are periodic, so it does not affect our results, and we have chosen to leave the colors as they are derived.
The reddening derived from the colors can be converted to via (Cardelli et al. 1989).
For those stars with spectral types, the reddening derived in this fashion is broadly consistent with the reddening based on a comparison of spectral types and the expected colors from Pecaut & Mamajek (2013). The mode of the entirety of the spectral-type-derived reddening values is 0.70.
If it was available, we took first the reddening derived from the diagram (64% of the sample). If there is no value available from the diagram, or the value derived from that is consistent with zero or unphysical, but there is a spectral type, then we take the reddening from an explicit comparison of the spectral type and the expected colors from Pecaut & Mamajek (2013). This is the case for 15% of the sample. For Oph members with spectral types, because the reddening is so high, we explicitly enforced that the reddening is drawn from a comparison to the Pecaut & Mamajek (2013) colors. Note that for all cases where the colors are forced to match those from the spectral type (most obvious in the Oph sample), the values are ‘quantized’ specifically because they are forced to match the colors corresponding to that spectral type; this manifests as ‘lines’ of sources at a given . For the remaining 20% of the objects with no estimate of to this point, we assigned the modal reddening of .
The dereddened we used for each object is included in Table 1 for the members and in Appendix B for the NM. However, to emphasize the net uncertainty, the “vmk-dered” column in Table 1 has been rounded to the nearest 0.1 mag. The values used in plots here can be recovered by using the (“ev-k”) and (“vk-used”) columns.
Net errors are hard to quantify after all of these steps. Table 1 (and its analogous Table 3 for NM) include a 2-digit code indicating the origin of the value and the method by which the was dereddened to (see Table 1 or 3 for specific definitions). For most values of , the uncertainty in is probably a few hundredths of a magnitude at most. For dereddening in the diagram, via internal comparisons and uncertainties not just on the assumed photospheric colors but also uncertainties in spectral typing, we estimate that the typical uncertainty for USco members could be conservatively 0.4 mag, and that for Oph members is likely worse at 0.9 mag. Dereddening based on spectral type is likely comparable, as is assuming a median reddening; uncertainties are larger in Oph, even when there is a spectral type, because the extinction is large enough that there is likely to be larger uncertainties on the (optical) spectral type estimates.
2.5 Disk Indicators
Both USco and Oph are young enough that a significant fraction of the members have disks. One of our goals for this paper is to compare the rotation rates of the stars with disks to those without them. For that purpose, we prefer to have a list of stars with disks that is as complete as possible. To accomplish this, we tag a star as a disk candidate if it has a plausibly real excess at any IR wavelength. Our process for doing this is detailed in this subsection. The wavelength at which the IR excess begins is included in Table 1 (and in the Appendix in Table 3 for the NM).
For each of the targets, we constructed SEDs from the assembled photometry. For WISE, we used IRSA’s Finder Chart tool to inspect the WISE images to see if the detections in the catalog reflect what can be seen in the images. MIPS data are not widely available because MIPS only observed about 300 of the USco/ Oph members (and mostly just in 24 m), but are useful (and sensitive) when they exist. Just 14 were observed with MIPS at 70 m; for 6 stars, the IR excess begins at 70 m. AKARI provides additional detections for about 70 member sources that are consistent with the rest of the assembled SED, and occasionally reveal IR excesses that start at 9 m. PACS provides many more detections at 70 and 160 m, but did not reveal any new IR excesses that were not already identified based on other IR data.
For the ensemble of true WISE detections (99% of the members at 3.5 m; 50% of the members at 22 m), we examined the distributions of [3.4][22] and [3.4][12]. For those 400 objects for which there were MIPS 24 m detections (300 of the members), we examined the distribution of . For all three colors ([3.4][22], [3.4][12], ), we calculated both the color and the significance, e.g., for 3.4 and 12 m is
| (1) |
For 3.5 (early M), can be taken to be 0; for 3.56.5, is not zero. We took the set of all USco/ Oph stars and assessed the distribution of as a function of , fitting a line to the distribution of non-disked stars to predict . We obtain a fit similar to (and slightly larger than, e.g., more conservative than) Pecaut & Mamajek (2013). For the latest stars we have here, the intrinsic photospheric color can be as much as 0.4-0.5 mag. We then assessed the ensemble of information available for all sources (e.g., all points 2 m, shape of SED, etc.). For example, if the significance of the excess () at 12 m is 5, and the source looks ok (e.g., circular, unaffected by artifacts) in the images at 12 m, then we took it as an excess. If the IR excess is large enough (e.g., [3.4][12]1.3 mag), and there is corroborating information from another wavelength, then we took it as an excess even if 5. There are some for which, at wavelengths 10 m, we have only 12 and 22 m points, and 5 at 12 m, but 5 from [22]; those were not taken as disks because it is unlikely that a dust disk could create an excess at 12 but not 22 m. Because the SEIP likely underestimates [24] errors, and because the band was not observed at the same time as the [24] band, we required a higher significance at 24 m. If was 10, then we took the excess as significant; if then there is a large enough excess to consider as real even if wasn’t quite 10.
For the sample, then, we could identify clear disk candidates and clear non-disk candidates (at least, non-disks given the available data, which often extend to 12 or 22 m); for some, the data do not extend very far into the IR. Finally, there are some for which it is not clear whether or not there is a significant excesss. Among the USco members, 208 (18%) are clear disk candidates, and 42 (4%) may have disks; this leaves 871 (77%) for which there is no disk (and 12=1% with no information). For Oph, 85 (47%) are clear disks, and 15 (8%) may have disks, leaving 78 (43%) with no disk (and 2=1% with no data). These rates are all consistent with Oph being younger than USco. Note that the disk excess criteria are conservative and that the non-disked sample will have contamination from weaker ( excess) disks. Note also that the lowest mass bin is likely incomplete in the non-disks due to sensitivity issues (stars with excesses are more likely to be detected than stars without excesses). Note also that this disked sample is not statistically rigorous, since the sample draws from many surveys and wavelengths, and in order to be considered at all, they must be a detection in K2, which is affected not only by extinction but pixel mask selection.
3 Periods and Color-Magnitude Diagrams
This section starts the analysis of data described in the prior section. We first discuss period finding and interpretation. We end with color-magnitude diagrams for various subsets of the two clusters.
3.1 Finding Periods in the K2 LCs
Our approach for finding periods was identical to that which we used in the Pleiades and Praesepe (papers I, II, and IV). In summary, we used the Lomb-Scargle (LS; Scargle 1982) approach as implemented by the NASA Exoplanet Archive Periodogram Service555http://exoplanetarchive.ipac.caltech.edu/cgi-bin/Periodogram/nph-simpleupload (Akeson et al. 2013). We also took advantage of the new Infrared Science Archive (IRSA) Time Series Tool666http://irsa.ipac.caltech.edu/irsaviewer/timeseries, which uses the same underlying code as the Exoplanet Archive service, but allows for interactive period selection. We looked for periods between 0.05 and 35 d, with the upper limit being set by roughly half the campaign length. Because the periods are typically unambigous, false alarm probability (FAP) levels are calculated as exactly 0 for 97% of the periods we present here (and the remaining FAP levels are typically ).

3.2 Interpretation of Periods
In this section, we describe the different kinds of periodicities in the LCs, and which we retain as likely rotation periods, . Each subsection below describes different subsets of the sample of stars with detected periods and whether we interpret those periods as the stellar rotation period or not.
For completeness, we note that there are some objects (18% of the probable members) that we do not detect to be periodic. Aside from spot coverage and effects, since we expect our membership list to have some contamination by (older) field stars, it is likely that some/many of the aperiodic stars are actually non-members. As for our work in Papers I and IV, there are some LCs with some repeated patterns, but which seemed to be more ‘timescales’ than rotation periods (see Appendix C).
3.2.1 Light Curves Consistent with Photospheric Spots
Nearly three-quarters (76%) of the periodic LCs from cluster members have LCs consistent with rotational modulation of non-axi-symmetrically distributed star spots. Most often, these light curves are roughly sinusoidal in shape; see the first row of Fig. 2. However, other shapes are also possible. A star where a single spot dominates the light curve and where that spot passes fully to the back-side of the star as seen from Earth for part of the period will have a phased light curve showing a constant brightness then a broad flux dip. A star with two or more dominant spot groups at different longitudes (and latitudes) can produce double peaked light curves, which happens in about 10% of the cluster members here (see, e.g., Davenport et al. 2015, or papers I-IV for examples from the Pleiades and Praesepe). For stars with one period, the period we used was usually the strongest peak in the periodogram. In certain cases (most notably the ones with two peaks/dips per cycle), it was clear that a peak other than the strongest was the most appropriate period to take as the primary .
3.2.2 Multiple Periods
In about 20% of the members, we found more than one period in the LC. We retain up to four periods in our database, but for much of the analysis here (e.g., plots of vs. ), only one period can be used. For stars with two (or more) periods that we believe are due to rotation, we plot only one point at the period we believe corresponds to the actual rotation period of the star dominating the measurement.
Those periods that result in sinusoidal phased LCs are also most likely to be spot-modulated stellar rotation rates. In some cases, as for papers II and IV, particularly for the M stars, two clear periods in a LC reflect binaries, where each period corresponds to the rotation rate of one of the stars in the binary (see Sec. 6.1 below and in papers II and IV, as well as Stauffer et al. in prep). In other cases, particularly for G and K stars, latitudinal differential rotation may result in two distinct periods if there are spot groups at significantly different latitudes on the stellar surface (see discussion in paper II); the LC shapes could also be due to starspot evolution. These LC shapes are less common in these young stars than it was in the Pleiades and Praesepe (papers II and IV).
In a few cases, the LCs have very short periods and often there is a forest of periodogram peaks; these stars are all earlier types. As discussed in paper II, these are most likely to be pulsators, generally of the Scuti or Dor type. The strongest peak in some cases may be related to rotation, so those periods are left in the distributions but flagged when necessary and flagged in the tables (just as we did in papers II and IV). If there is just one period, we do not have enough information to classify it as a pulsator beyond just its very short period; none of the objects like this are members. Ripepi et al. (2015) identifies EPICs 203931628, 204175508, and 204494885 as Scutis and EPIC 204054556 as a Dor; these are also identified as pulsators here. Ripepi et al. also identify EPIC 204638251 as a Scuti, so we have tagged it as a pulsator here. For EPIC 204760247 (=HD 142883, a USco member B star), the period is likely to be a slow pulsation; see David et al. in prep.
3.2.3 Highly Structured LCs Not Due to Spots or Pulsation
There are about 40 Upper Sco and Oph members which share very unusual characteristics. Those shared characteristics include: (a) with possibly one or two exceptions, these stars show no evidence of IR excess and hence no significant primordial circumstellar disk; (b) all are inferred to be very low mass stars, with spectral types generally M3.5 to M5; (c) all have phased LC shapes with much more structure than can be explained by cold spots; (d) all have short periods, almost all less than 1.5 d (with most of them having periods 0.7 d). Furthermore, only young stars have been found to exhibit these light curve morphologies. We have discussed many of these stars in two previous papers (Stauffer et al. 2017, 2018). While there is no detailed physical model to explain these light curve morphologies, their photometric variability almost certainly must be due to gas and dust orbiting the star in a stable configuration at the star’s Keplerian co-rotation radius. We have therefore retained the periods associated with these stars as indicative of the stellar rotation periods.
Appendix D collects all of these objects together, with a few example LCs. Note that four of these stars are not included in our list of probable cluster members (EPICs 204364515, 205046529, 205110559 and 204296148). All of these stars failed our proper motion membership criteria given the set of proper motions we employed. However, we note that two of these stars (EPICs 204364515 and 205046529) were considered as members by Preibisch et al. (2002), Kraus & Hillenbrand (2007) and Luhman & Mamajek (2012), and both have strong Li 6708 absorption features (which at spectral type M4 assures they are younger than 15 Myr). We suspect the other two are also likely members and simply have relatively poor proper motion data.
3.2.4 Bursters, Dippers, and Other Disk-Related Behavior
Among the 350 USco/ Oph stars we identify as having disks, we detect periods for 276 stars. Of those, 185 have light curves that appear consistent with rotational modulation by photospheric spots. Of the remaining periodic disked stars, 74 have LC morphologies which resemble the dippers from NGC 2264, and just 17 have LC morphologies dominated by accretion bursts (Cody et al. 2014; Stauffer et al. 2014, 2015, 2016a). In the remainder of this paper, we associate these periods with the rotation period of the stars; our reasoning for this is as follows.
Dippers are fading events. The photometric variability in dippers (such as the prototype AA Tau, Bouvier et al. 1999) can be interpreted as originating from variable extinction to our line of sight linked to warps in their inner circumstellar disk (Terquem & Papaloizou 2000), to dust entrained in funnel flows (Blinova et al. 2016), or to waves of various sorts excited by the interaction between the stellar magnetosphere and the inner disk (Romanova et al. 2013). Stable disk warps, however, are only expected for the case where the stellar rotation period and the inner disk rim orbital period are locked to each other (Terquem & Papaloizou 2000; Long et al. 2005), leading to the expectation that most of the periodic dippers (AA Tau analogs) we detect have = (Romanova et al. 2013). Dippers in USco are discussed in Ansdell et al. (2016), Hedges et al. (2018), and Cody et al. (2018).
In general, bursters are sudden brightening events and are interpreted as a result of accretion instabilities. When the bursting behavior is periodic, it is thought to be due to hot spots on the stellar surface tied to relatively long-lived accretion columns rotating into and out of view (Blinova et al. 2016). These hot spots may shift in position with time on the surface of the star and thus may have somewhat wandering periods (Romanova et al. 2013). We assign = for these stars, even though this may not always be the case. Because very few of our disked-star periods arise from stars where bursts are the dominant variability type, this choice should have no affect on any of our conclusions. Bursters in USco are discussed in Cody et al. (2017, 2018).
We have identified dippers and bursters in our sample independently from the papers noted above. The objects selected to be included in these categories differ from those in the other papers because we used different selection criteria, different light curves, and a different set of candidate members. Based on our criteria, we identify about 2% of the USco members as bursters and about 6% of the USco members as dippers; for Oph, the fractions are 7 and 9%, respectively. An example burster and dipper appear in Figure 2.
In §4.2 below, we provide direct evidence for “disk-locking” in a small number of the USco disked stars that show both sinusoidal waveforms from photospheric spots and narrow extinction dips having the same period (also see Stauffer et al. 2015).
There are USco/ Oph stars for which there is a periodic signal with shorter-timescale variations superimposed. These additional variations are likely disk-related in that they are probably superpositions of both accretion-related brightening and disk occultation-related fading. We interpret the period as being a result of spot modulation, and so we retain these periods as rotation periods. These kinds of LCs make up only about 2% of the member sample, and they all have disks. An example of this kind of LC is given in Figure 2.
3.2.5 Periods That Are Not Rotation Periods
We removed from this distribution any periods that are unlikely to be rotation or rotation-related, such as eclipsing binaries (see, e.g., David et al. 2016, 2018 submitted). However, the was retained for those objects for which we can determine a (as distinct from the binary period).
There is one object, EPIC 203497438 (CD-25 11199), which is not likely to be a USco or Oph member, which appears to have a burst every 23.5 d; this might be a ‘heartbeat binary’ (e.g., Thompson et al. 2012). Because this period is not likely to be rotation (and the star unlikely to be a member), we have removed its period from the dataset.
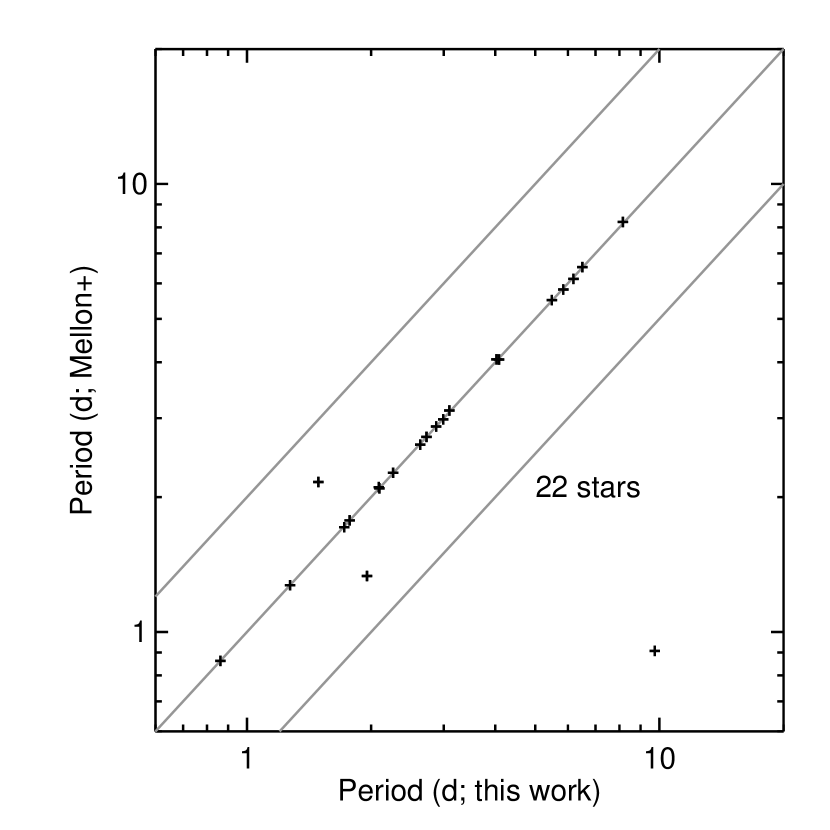
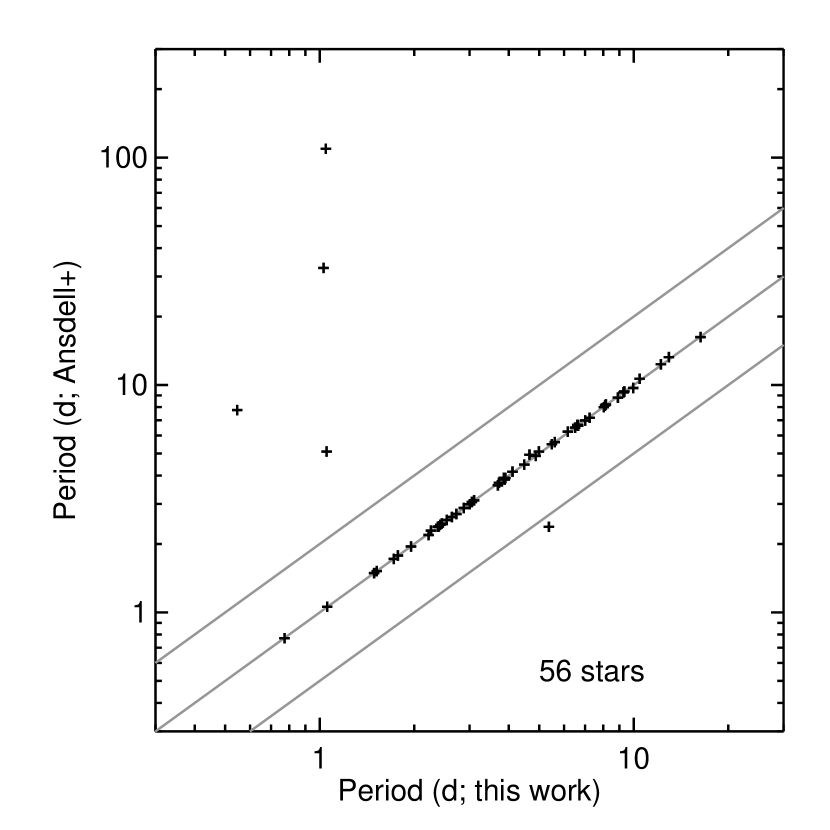
3.3 Comparison to Literature Periods
In this section, we identify stars in common between our study and two literature studies (Mellon et al. 2017 and Ansdell et al. 2018), and compare the resultant periods. Our periods match or can be explained when they do not match. Scholz et al. (2015) also present periods from K2 data, but only for 16 brown dwarfs. Our periods match very well the periods obtained there. We conclude that our approach to obtaining periods is working at least as well as those published elsewhere in the literature.
Mellon et al. (2017) used SuperWASP to monitor stars in the Sco-Cen OB association. While covering a much larger area on the sky than K2, the SuperWASP data only provide periods for relatively bright stars, leading to there only being 22 stars in common with our study. Figure 3 shows that there is good agreement in derived periods between the two studies. There are only 3 stars with discrepant periods. For EPIC 204794876 (2MASSJ16014743-2049457), we report 2 periods (1.490 and 2.153 d), Mellon et al. report only one (2.161 d), and Ansdell et al. (2018) obtain 1.49 d. This target is likely to be a binary, with the two periods we recover corresponding one to each star. For EPIC 204894575 (2MASSJ16025396-2022480 2), we report 1.954 and Mellon et al. report 1.333; Ansdell et al. report 1.95d. For our LC, our period is correct, and there is no evidence of a 1.333 d period. This is a K6 star, so surface differential rotation of this magnitude is unlikely; this could also be a binary where one star did not have organized enough spots/spot groups to create a periodic signature in our LC. Lastly, EPIC 204447221 (2MASSJ16094098-2217594) is an interesting case; we report a 9.742 d period and Mellon et al. report a period 10 times faster, 0.907 d. Our light curve does not seem to be subject to source confusion; it has a very obvious, long period, though the waveform changes shape over the campaign, and there is no evidence for oscillations less than a day. The factor of 10 difference in periods is too large to be explained by differential rotation. It is not clear why these results are so discrepant between the two data sets.
Ansdell et al. (2018) used KELT (as well as the K2 C2 data analyzed here) to explore rotation in USco. There are 56 stars in common between the studies. Figure 3 shows that there is again good agreement between the two studies. There are five stars where there is disagreement, only three of which fall in the boundaries of Fig. 3. The two outside the boundaries are EPIC 204819202 (2MASSJ15554141-2043150) and EPIC 204054556 (HD144729). For the former (204819202), we report a period of 1.028d; they report a period of 32.720 d. Our LC has no evidence of even a long-term trend, much less a period of 30 d; our period is correct for our LC. For the latter (204054556), we find many peaks in the periodogram and report the top four periods; this star is also noted as a Dor-type pulsator (Ripepi et al. 2015). We could not have recovered the 100d period from Ansdell et al. because our campaign is not long enough; in any case, a 100d period for an F3 dwarf would make it a very anomalously slowly rotating star for that mass. EPIC 204637622 (2MASSJ16042097-2130415) is one of the remaining three stars whose periods do not agree but are close enough to appear in Fig. 3. In this case, there are several stars in close proximity. Most of the K2 LCs are drawn off from the target to a nearby brighter star (which is 204638512), and that brighter star has a period of 5 d. When a LC extraction is done using a much smaller aperture centered on the target star, different periods are obtained for 204637622, 1.052 and 1.385 d. Ansdell et al. report the 5d period, which we believe belongs instead to 204638512. We find several periods for EPIC 205080616 (2MASSJ16082324-1930009), but the LC is contaminated by nearby EPIC 205080360. EPIC 205080360 has an unambiguous period of 2.381 d, which matches the period reported by Ansdell et al.. We have removed the 2.38d period from EPIC 205080616, leaving just two periods. Finally, for EPIC 205141287 (GSC06209-01215), we find multiple periods and the Ansdell et al. period is the second period we report.
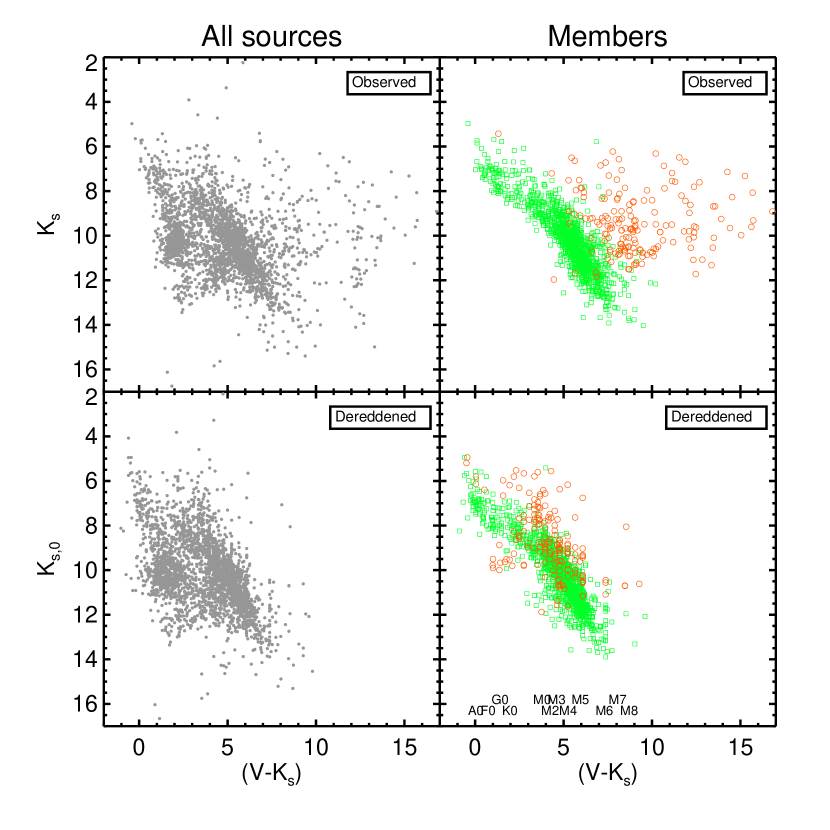
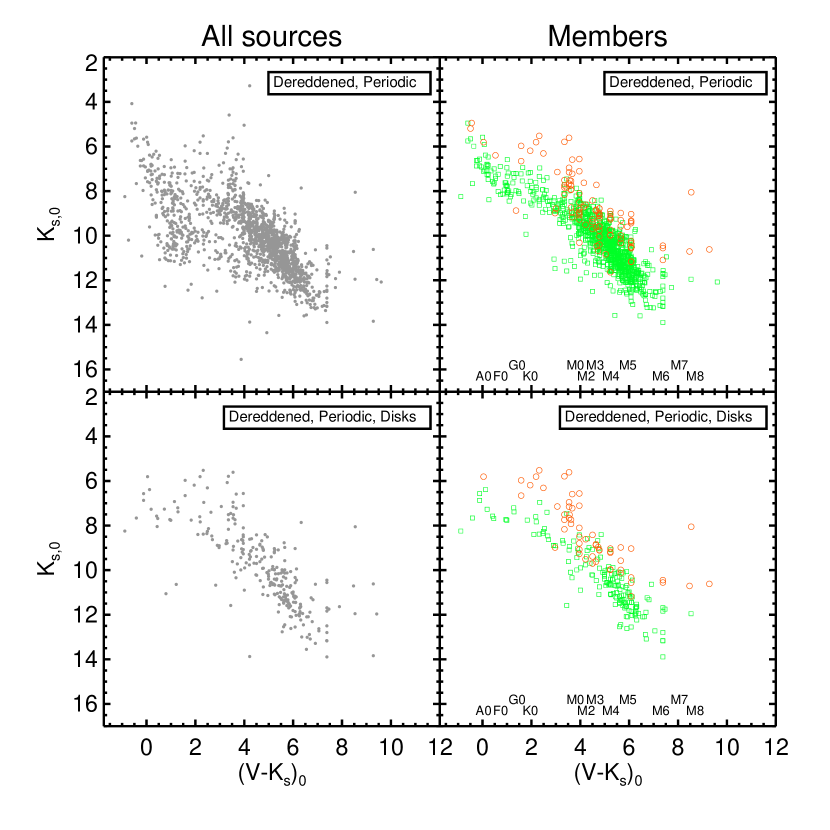
3.4 Color-Magnitude Diagrams
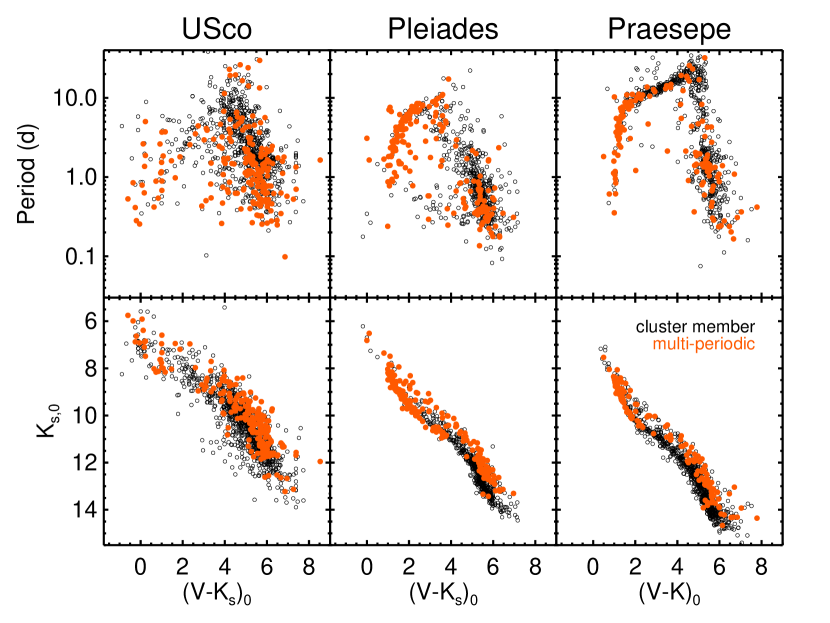
Figure 4 shows color-magnitude diagrams (CMDs) for the entire sample and for just the subset of members of USco and Oph. The members span a broader swath of the CMD than the Pleiades or Praesepe did, because the USco and Oph stars are young and for the most part still above the main sequence (MS). Members of Oph are further above the MS than most of the USco stars, even in the dereddened version of the diagram. The ensemble of all stars has much more scatter in the CMDs, consistent with there being many more NM stars included. Figure 5 has just the subset of objects that are periodic. A high fraction of the USco members are periodic (85%); a lower fraction of the Oph members are periodic (60%) because disks are more common there and can obscure periodicities. Among the periodic sample, 18% of USco periodic members have unambiguous disks, and 56% of Oph periodic members have unambiguous disks.
In papers I and IV, we omitted stars that were too bright or faint to result in viable K2 LCs. As seen in Figs 4 and 5, the limits are not as clear-cut in USco and Oph. Objects with 5 and 14 effectively are dropped by the member selection in USco; for Oph, there is an additional restriction that 14, with the result that there are few members with 11.
4 The Influence of Disks
4.1 Context
When it first became possible to measure the rotation rates of the G, K, and early M stars in young open clusters like the Pleiades and Alpha Persei (Stauffer & Hartmann 1987; Stauffer et al. 1989), it was discovered that those stars showed a bimodal rotation distribution. Many of the stars in that mass range were relatively slow rotators, but there also existed a population of very fast rotators. That bimodal rotation distribution was initially a mystery. Eventually, the consensus explanation for that distribution was that it arose because of interaction between the star and its primordial circumstellar disk during contraction onto the MS. While the star continues to accrete from its primordial disk, the stellar surface is forced to rotate at the same rate as the inner edge of its disk (Ghosh & Lamb 1977; Königl 1991); this process, which prevents the star from spinning up as it contracts, is commonly referred to as disk-locking. When the disk dissipates, the rotation lock is removed and the star is then free to spin up. Thus, the slowly rotating population in young clusters like the Pleiades is linked to stars with relatively long-lived primordial disks, whereas the rapid rotators are more likely to have lost their disk much earlier. The rapidly rotating population required a modification of existing angular momentum loss prescriptions. Simple Skumanich-style laws predicted no very rapid rotators on the main sequence (Pinsonneault et al. 1990), a problem solved by introducing a saturation threshhold (MacGregor & Brenner 1991).
Because primordial disks are believed to have lifetimes generally less than 10 Myr, one has to go to young, star-forming regions to search for direct evidence for the disk-locking hypothesis. There have been many papers devoted to that goal, primarily using data from the Orion Nebula Cluster or NGC 2264 (e.g., Rebull et al. 2006; Herbst & Mundt 2005; Cieza & Baliber 2007; Biazzo et al. 2009; Rodriguez-Ledesma et al. 2010; Dahm et al. 2012; Davies et al. 2014; Venuti et al. 2017). Those studies generally find evidence claimed to be supportive of disk-locking. This has most often been illustrated in plots of period versus some measure related to presence of absence of a primordial disk, with stars lacking disks showing a wide range in rotation (including rapid rotators) while stars with disks show a narrower period distribution weighted towards slow rotators. Another way of expressing this correlation has been to plot the fraction of stars with disks as a function of measured period, with diskless stars predominating at short periods and disked stars predominating at long periods. These previous studies have essentially assumed that the periods that have been measured for young disked stars are rotation periods; for the ground-based data used in those papers, that assumption was necessary because the quality of the light curves was sufficient to detect periodicity but not to separately identify spotted stars and (for example) AA Tau-type analogs. Two of the above papers (Biazzo et al. 2009 and Dahm et al. 2012) instead used high-resolution spectra to determine spectroscopic rotation rates ( values). Their finding of highly significant correlations betweeen rotation rate and IR excess provide support to the assumption that the measured periods for young disked stars are indeed stellar rotation periods. The CoRoT light curves for NGC 2264 (Venuti et al. 2017) and The K2 light curves for USco/ Oph provide the first photometric time series dataset where, in most cases, one can separate periodic variability due to spots on the star’s photosphere from periodic variability due to variable (disk-related) extinction. As discussed in §3.2.4, when searching for correlations between IR excess and period in our data, we adopt the assumption that the periods we identify as due to variable extinction are equivalent to the stellar rotation period. However, in the following section, we also use our K2 Campaign 2 data to provide new, direct evidence that at least for some YSOs with disks the stellar rotation period is indeed the same as the inner disk orbital period.
4.2 Direct Evidence for Disk Locking from our K2 Light Curves
Direct evidence in favor of disk locking can be established from high quality light curves if one can identify stars with disks whose light curves show signatures arising separately from the disk and from the stellar photosphere and where both sets of features share the same period. Using CoRoT light curves for stars in the 2 Myr old NGC 2264 star forming region, Stauffer et al. (2014) found two disked stars (Mon-21 and Mon-56) that showed well-defined spotted-star light curves superposed on which were periodic, narrow flux dips best interpreted as arising from dust structures near their inner disk rims. The periods associated with both signatures were the same, thereby identifying these systems as stars whose photospheric rotation rate are locked to the Keplerian rotation rate of their inner disks.

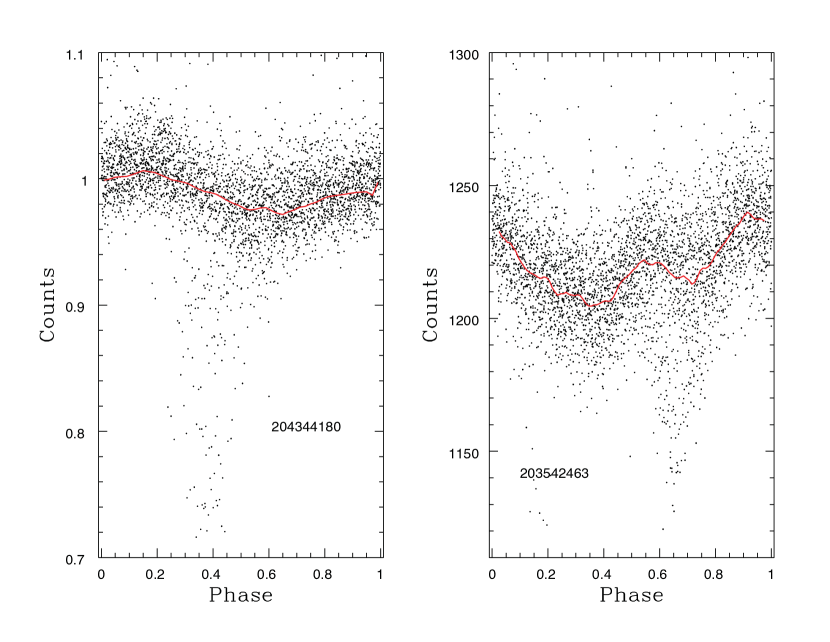
We have 290 young stars with IR excesses in our member catalogs for USco and Oph, 77% of which show at least one significant period in their Lomb-Scargle periodogram. We find that 10 of these systems show possible evidence for disk locking; we discuss four of the best examples and illustrate their light curve morphologies here; see Figure 6. These four stars are EPICs 203770366, 204344180777The K2 light curve for EPIC 204344180 had been previously noted to contain both spot and flux-dip signatures by Scholz et al. 2015; they also concluded this provided evidence in favor of disk locking for that star., 203542463, and 203860592. The first three of these stars are late-type (M5 to M6.5) members of USco; the last star (EPIC 203860592) is a member of Oph with spectral type K5. Fig. 6 shows three versions of the K2 light curves for each of these stars. The left panel of each row shows the complete, detrended light curve for the star. Each star shows a stable, periodic pattern extending over the full duration of the K2 campaign, consistent with that expected for a spotted star – sinusoidal for three of the stars; “double-dip” for EPIC 203542463. Amplitudes for the spotted-star variability range from 2.5% to 15%, and periods from 1.6 to 6 days – typical values for stars of their spectral type and age. In all four cases, superposed on the stable spotted-star variability are intermittently occurring, narrow flux dips whose amplitudes are comparable to the spotted star signature, or in some cases much larger than that.
The middle panels of Fig. 6 show phase-folded light curves for these four stars, where the black points are the data and the red curve is a median fit to the phased light curve. For all four stars, the narrow flux dips align in phase, indicating that they share the same period as the spot waveform. Because the spotted-star light curve amplitude is small for EPIC 204344180 and 203542463, we provide an expanded version of their phased light curves in Figure 7.
The rightmost panels of Fig. 6 show the result of subtracting the median fit to the spotted-star waveform from the original light curve, now emphasizing the narrow dips that are present for all four stars. The red vertical bars are displaced from each other by intervals of periods from the first vertical bar. Only a portion of the light curves are shown in order to better illustrate that the narrow flux dips are well-aligned with the bars marking the period cadence. For EPIC 203860592, an additional set of blue vertical bars mark points displaced 0.5 in phase from the red bars (corresponding to the dimples at the tops of the light curve near day 2080 in the left-panel of the figure for 203860592). For this star, we speculate that we are seeing extinction dips due to accretion columns intersecting our line of sight to the star directed towards both of its magnetic poles.
If disk locking is ubiquitous for stars with disks, why do we not see more examples of these types of light curves? We believe the answer is that for most of the other stars with disks, the signatures due to accretion bursts or variable extinction from disk warps are much higher amplitude than that due to photospheric spots, and so the spot signatures are masked.
4.3 Evidence for Period Locking from Period Distributions


The simplest method to use the period data to search for evidence of disk locking is to make histograms comparing the period distributions of the disked and disk-free coeval populations. Figure 8 provides such histograms for our K2 data for both Oph and USco. Note that only secure disks and secure non-disks are included in these plots; stars for which there were insufficent data or ambiguous evidence for an IR excess are omitted. Our sample for Oph is too sparse to reach a definitive conclusion, but at least for the late-type stars, the disk-free stars are preferentially faster rotating than the disked stars, though not by a large amount. This is perhaps not unexpected since at this very young age, disk locking (even if present) would not have had long to operate. In contrast, the USco histograms show a much more significant difference. For both the cooler and warmer stars, the disk-free stars show a distribution peaking near = 1 day, with a broad tail to longer periods; a KS test finds that the high mass and low mass USco disk-free stars are consistent with being drawn from the same population. The disked stars in either color range show few or no stars with 1 day, and have a mean period larger than for the disk-free stars. Both KS and AD tests of the later Oph stars suggests that there is a 0.2-0.4% chance that the periods from the disked and non-disked populations are from the same distribution; similarly, for USco, there is a % chance that the disked and non-disked populations are from the same distribution. Thus, the K2 USco period data confirms the results found previously in Orion and other clusters: stars with disks rotate on average more slowly.


For the late-type USco stars, there is a prominent peak in the period histogram of the disked stars at a period near 2d888We checked all of the 2 d LCs extensively to be sure they are real. We have removed all of the instrumental 1.97d periods as noted above.. Figure 9 illustrates this feature in another way, comparing periods for the disked and non-disked stars of USco as a function of color for just the M stars (the full range of colors will be discussed in Sec. 5). Particularly among the latest type USco members (5, spectral type M4), the two groups of stars show a striking dichotomy in this diagram, with the stars with 1 day being almost entirely disk-free and the stars with 1.5 days being predominantly disked. The sharp peak in the disked stars distribution evident in Fig. 8 is also prominent here. The three late dM stars with K2 light curve evidence for disk-locking in Fig. 6 are part of this group, linking the direct evidence for disk-locking from the light curves to the somewhat indirect evidence provided by the period distributions.
Rebull et al. (2006, Figure 3) combined data from Spitzer’s IRAC camera and ground-based rotation periods for Orion stars to demonstrate a correlation between IR excess (hence disk presence/absence) and rotation at 1-2 Myr. We provide similar diagrams for four mass ranges in USco using IR data from WISE and K2 rotation periods in Figure 10. The USco plots mirror the Orion results very well, showing the well-defined disk-free (no IR excess) population with a wide range of rotation periods, extending well below =1 day, and the stars with disks (with IR excesses) having a narrower distribution of period and avoiding the period range 1.5 day. Our plots highlight something not obvious in previous studies of young star rotation. There is a narrow peak in periods between 1.5 and 2 d for disked stars with 5 (mass 0.2 M☉), compared to the broader distribution (weighted to larger periods) at higher mass. There is more that can be gleaned from this Figure; see Sec. 6.1.
Despite the fact that USco should be old enough that (primordial) disk locking should no longer dominate the stellar rotation, our results show that at low masses, a fairly large fraction of USco members still have disks. For the four color ranges given in Fig. 10, and considering only those objects with either strong evidence for no IR excess or strong evidence for an IR excess (at any band), the disk fractions are 18, 24, 19, and 64%, respectively (where errors are calculated as per the appendix in Burgasser et al. 2003). Disks are both significantly more common among, and evidently more important for the rotation rates of, the latest stars here. However, it is important to note that there is likely a bias against disk-free stars being detected at these lowest masses, just because of the sensitivity of the longer-wavelength data; moreover this sample is biased in other ways as well, in that the stars have to have been selected to have a K2 LC, be bright enough to have a viable K2 LC (bias against high extinction), and have a periodic signal (likely bias against disks).
4.4 Comparison to Previous Studies
Several previous studies have claimed to find evidence that the correlation between disk presence and rotation was strongest for “high mass” stars and was weaker or not present for very low mass stars or brown dwarfs (Lamm et al. 2005; Rodriguez-Ledesma et al. 2010; Davies et al. 2014; Scholz et al. 2015). Our data do not support that conclusion. If anything, Figure 10 shows the strongest correlation between IR excess and rotation for the lowest mass group of stars. The very low mass, disked stars in USco do have comparatively short periods (relative to the higher-mass disked stars in the above papers), but that is probably indicative that their inner disk edges are comparatively nearer to the star rather than that disk locking for them is ineffective (see also discussion of this point in Davies et al. 2014). The conversion from observed color or spectral type to mass also remains a significant problem for pre-MS populations, and care must be taken when comparing different studies that the same or consistent mass scales are being used.
Based on VLT FLAMES high resolution spectra for a sample of 0.25 M☉ Orion stars, Biazzo et al. (2009) concluded that disked stars in that mass range had been disk-locked in the past but no longer were locked by Orion age (and presumably would not be locked at later but still young ages). For the same mass range (our Figures 6 and 10), we find strong evidence that disked stars at 8 Myr do exhibit disk-locking. We infer that our stars in this mass range are still accreting based on their strong IR excesses; it would be useful to confirm that fact using high-resolution spectroscopy, and thereby more directly confront the Biazzo et al. conclusion.
5 Period-Color Distributions
Now, we explore the distribution of as a function of as a proxy for mass over the full range of stars we have, FGKM. We compare these K2 results for Oph (2 Myr) and USco (8 Myr) with those from papers I-IV on the Pleiades (125 Myr; papers I-III) and Praesepe (790 Myr; paper IV). Note that for stars with more than one period, we have taken the first period and the measured as representative of the same star (likely the primary if it is a multiple); both the assumed and first period are listed in Table 1. Even if the star is a multiple identified only from additional periods and position in the CMD, we don’t include subsidiary companions separately in this analysis.
5.1 Distribution of vs. : Oph and USco
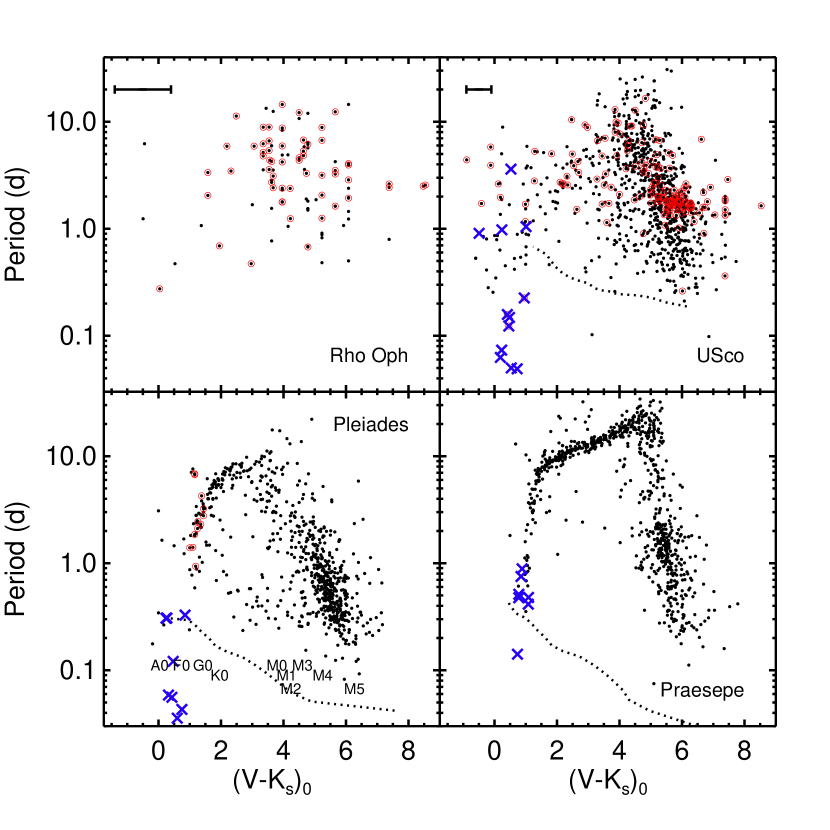
Figure 11 shows vs. for stars in all four of the clusters ( Oph, 1 Myr; USco, 8 Myr; Pleiades, 125 Myr; & Praesepe, 790 Myr). These include all stars in the K2 FOV for which we derive a period that we interpret as due to rotation. We discuss just Oph and USco in this subsection. Recall that the apparent quantization of some stars’ (most apparent in Oph and in some of the latest USco stars) is a result of our dereddening to the expected color for that spectral type when our more frequently used dereddening procedure was not possible; see §2.4.
There are far fewer stars available in Oph than in the other clusters, but it is clear that most of the stars are rotating relatively slowly, and a large fraction of the periodic stars also have disks. There is significantly less obvious structure in the Oph panel than the other panels, most likely as a result of the smaller sample size, high extinction and resultant larger uncertainty on (see Sec. 2.4 above). There are some apparent echoes of the structure from USco seen in Oph: the slowest rotators are early M, and there is a steep decrease in for later Ms and for earlier FGKs. We do not discuss the Oph rotational data further.
USco, in contrast, will be discussed extensively in the rest of this section. USco stars are rotating quickly, on average. Examination of the period-color plot for USco shows that there are strong mass dependent trends. Later M stars rotate much faster than early M stars. At earlier spectral types, the USco stars show a larger dispersion in period at a given color than the older clusters, but with the same general trend for the mean period to increase as one goes from F to G to K. The earliest types with the fastest periods may be pulsation periods rather than rotation periods.
5.2 Evolution of vs. Across Clusters
We now have rotation periods for 1000 stars at each of three important ages. USco, at 8 Myr, is about the time when most primordial circumstellar disks go away. Pleiades, 125 Myr, is roughly the age when low mass stars arrive on the MS. Praesepe, 790 Myr, is after MS angular momentum loss has significantly altered the ZAMS rotational velocities. These datasets improve upon what was available up until now not only by providing larger samples, but more importantly by providing rotation periods from F stars down to nearly the hydrogen-burning mass limit, and doing so for nearly complete sets of stars (within the K2 FOV) for each of the clusters. In Somers et al. (2017), we have recently used the USco and Pleiades rotational data for the M dwarfs in those two clusters to highlight the strong dependence of rotation on mass for M0.5 M☉ at early ages and how those data constrain angular momentum loss from winds prior to the ZAMS. Here we provide a qualitative summary of the rotational velocity evolution of stars over the full mass range of our data for the age sequence from USco to Pleiades to Praesepe.
Figure 11 includes Pleiades and Praesepe. Throughout the subsequent discussion, we assume that the stars in these three clusters represent snapshots in time of the same population, though that may not be the case (Coker et al. 2016).
The primary conclusion we draw from Figure 11 is that the basic dependence of period on color (and hence, loosely speaking, on mass) is already set in place by 8 Myr, but with the scatter in period at a given mass decreasing as age increases. For FGK stars (mass from 1.5 to 0.5 M☉; 1 3.5), this dependence corresponds to a monotonically increasing period to lower mass. M stars (0.5 M☉; 3.5) show the opposite trend, with a strongly decreasing period as mass decreases. Between USco and Pleiades age, spin-up from pre-MS contraction and angular momentum loss from winds compete throughout the entire mass range. In the FGK range, angular momentum loss from winds dominates and most stars spin down to longer periods; for the M dwarfs, pre-MS contraction wins and the predominant effect is for periods to decrease with time. Between Pleiades and Praesepe ages, pre-MS contraction is only still in process at the lowest masses and angular momentum loss from winds shifts the distribution to longer periods at all masses except possibly for the lowest mass M dwarfs here (6), where the mean rotation period appears to be very similar at Pleiades and Praesepe ages.
The much larger scatter in period at a given color in USco is probably due to a combination of astrophysical and observational influences. The colors in USco have larger uncertainties compared to the other clusters due to the larger extinction corrections and possibly due to variable extinction or accretion for the stars with long-lived disks. The non-simultaneity of the Gaia and 2MASS mags, combined with the larger variability amplitudes at 8 Myr, compared to the older clusters will also lead to larger uncertainties in the inferred for USco stars. A plausible age spread across the K2 FOV in USco could also broaden the period distribution at a given mass, whereas that same age spread at Pleiades or Praesepe age would have a negligible effect on their period distributions. The significantly larger contamination of our USco catalog by NM will also add scatter to its period distribution, particularly by adding slowly rotating field stars. However, the decrease in scatter in the period distribution with age likely has another astrophysical component. As originally noted by Skumanich (1972), a standard (non-saturated) wind will cause faster rotating stars to spindown more rapidly than their slowly rotating counterparts – thereby causing an initial spread in rotation rate at a given mass to decrease with time.
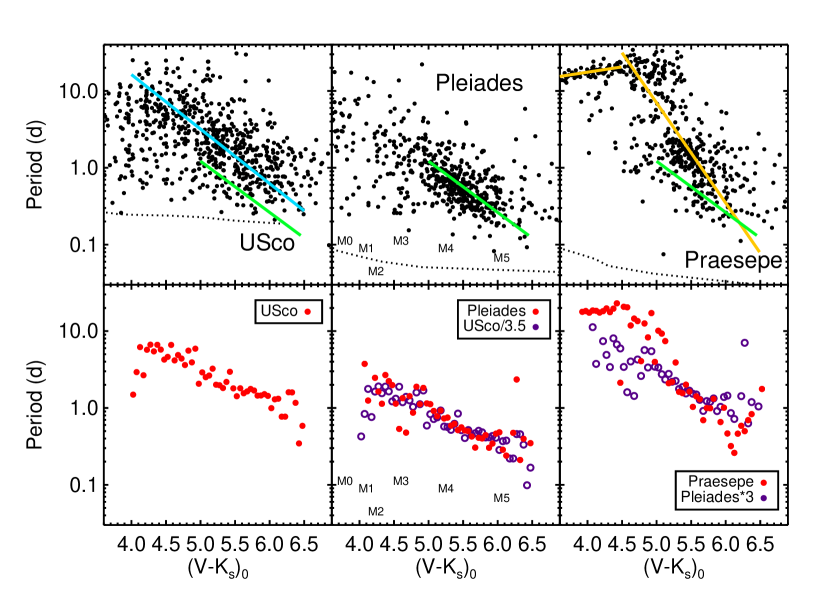
The rotational velocity evolution of FGK stars has been reasonably well constrained previously using ground-based data. In contrast, the early evolution of the rotational velocities for the full range of M stars has not been well-studied using previous data because only K2 has been able to provide rotation periods throughout the 0.5 to 0.1 M☉ range for such large samples of stars, at a range of ages, and with only a small fraction of stars without period determinations. We highlight just the M dwarfs in our three clusters in Figure 12, which omits disk candidates. As can be seen in the top row, in all three clusters, the mean rotation period decreases with increasing color (decreasing mass). To illustrate in a qualitative way the evolutionary trends with mass and age, we provide several lines to guide the eye in the top row of Figure 12 over the color range where there is a well-defined locus of points (46.5). The USco M stars are fit by a line given by . The Pleiades M stars are fit by . This is a slope that is functionally indistinguishable from that in USco; the USco relation is about a factor of 3.5 times faster than that from the Pleiades. That is, .999Somers et al. 2017 finds a factor of 3 rather than 3.5. This implies that M dwarfs spin up between 8 and 125 Myr by a factor of 3.5, more or less independently of mass, if the difference in mapping from to mass at those two ages is ignored.
In Praesepe, the early M stars compose a large fraction of the slowest rotating stars in the cluster; by M3, the relationship is falling fast as color increases. No simple scaling of the Pleiades line will match the Praesepe distribution as well as the scaling matched the USco line. The early Ms in Praesepe have clearly spun down by a larger factor and the latest Ms in Praesepe rotate only slightly more slowly than their Pleiades counterparts.
As a somewhat more quantitative way to compare the M dwarf rotation period distributions in the three clusters and to justify our claims for the amount of period evolution between the clusters, we have computed median periods in bins of 0.05 mag in ; see the bottom row of of Figure 12. The red points in Fig. 12 are the distributions as observed, but subtle comparisons between clusters is somewhat difficult. Thus, the bottom row also includes a scaled version of the prior (younger) cluster overplotted. The similarity in the slope of the period-color trend between USco/3.5 and the Pleiades is evident. The Pleiades distribution is multiplied by 3 to match the mid-M Praesepe distribution; Praesepe has a significantly steeper period-color slope, again as we had concluded previously.
The K2 rotation data we have presented for these two clusters provide the basis for a much more quantitative comparison of theoretical models of angular momentum evolution between 8 and 800 Myr than we have attempted here. In Somers et al. (2017) we have provided a preliminary comparison; in a future paper, we plan to critically assess the ability of the entire K2 clusters period data to constrain angular momentum losses from the winds of low mass stars.
5.3 Breakup Velocities
Figures 11 and 12 include curves corresponding to the rotational breakup period using the formula provided in Maeder (2009, Ch. 2), masses, , and radii from Siess et al. (2000) isochrones, and conversions from to from Pecaut & Mamajek (2013). Several of the most rapidly rotating high-mass stars in all three clusters can be identified as pulsators. But there are other short- high-mass stars that cannot be summarily categorized as pulsators, at least based on the (sometimes quite limited) evidence we have besides the very small . However, given that the period we have would correspond to a rotation rate exceeding the predicted breakup rate, we assume these periods must be pulsation periods (or erroneous).
By Praesepe age, even though the most rapidly rotating 0.1 M☉ M stars have periods around a quarter day, those periods are quite far from the predicted breakup speed at 790 Myr. At Pleiades age, the most rapidly rotating very low mass stars have periods near a tenth of a day, still about a factor of two slower than the predicted breakup period for 125 Myr. However, for Upper Sco age, the most rapidly rotating low mass M stars have rotation periods very near or coincident with the predicted breakup period at 8 Myr. For FGK and early M stars, nearly all stars seem to have solved their “angular momentum problem” by USco age (and have periods well removed from the predicted breakup curve). However, the USco plot suggests that at least some of the lowest mass, young M stars may have their rotation periods set by bumping up against that rotation limit.
If one extrapolates the solid line tracing the locus of vs. color for USco M stars and the dashed curve for the breakup period to redder colors, they would meet at 7.0, corresponding approximately to the main sequence hydrogen burning mass limit. This could suggest that the rapid and similar rotational velocities of most brown dwarfs arise because most of them hit their limiting rotational velocity at an age 10 Myr.
6 Linkages to Analysis in Papers I-IV
As discussed above, the USco and Oph stars and LCs have many characteristics that make them, importantly, different than the other clusters we have analyzed with K2 in papers I-IV. However, there are also many characteristics of the USco and Oph LCs that are comparable to those in Praesepe and the Pleiades, and a comparison of the clusters using the same approach as in papers I-IV can be illuminating. We discuss these analyses in this section.
6.1 Single- and Multi-Periodic Sources: Distribution with Color
As can be seen in Table 2, over all stars, about 20% of the USco and Oph stars with periodic signals also have at least one plausible additional period. As noted above, this is quite comparable to the fractions of multiply periodic stars in the Pleiades and Praesepe.
In the Pleiades and Praesepe, our interpretation of the physical origin of the multiple periods depended strongly on color (hence mass). For the highest mass stars, in most cases multiple periods were ascribed to pulsation. At intermediate mass (spectral type G or K), where there were two close periods or a complex peak in the periodogram, we interpreted that as a signature of spot evolution or latitudinal differential rotation on a single star (this was the signature seen in 80% of the GK stars with multiple periods). A few GK stars showed two widely separated periods, which we interpreted as indicative of binary stars. For the M dwarfs, in most cases, we interpreted multiple periods as indicative of the rotation periods of the members of binary or triple systems. We based these interpretations on the nature of the periodogram morphologies, placement of the objects in CMDs, and previous studies predicting significant latitudinal differential rotation for young GK dwarfs but mostly solid-body rotation for M stars (see paper II). We expect these same general trends to be present in Upper Sco, but because the CMD for Upper Sco members has much more scatter than for the older clusters, it is harder to cleanly separate binary and single stars and thus harder in particular to determine the primary cause for multiple periods among the GK dwarfs. For 1 (F stars), where the fraction of stars with multiple periods rises to 63%, we assume pulsation dominates. For 4 (M dwarfs), we expect most of the multiple period stars to be binaries.
Careful examination of Figure 13 suggests that the fraction of M stars that are identified as binaries in this way is different for USco than for the other two clusters. That is, there appears to be a larger fraction of red points in the USco plot. Quantitatively, for the color range 4.0 6.5 where our periods are reasonably complete in all three clusters, the fraction of stars with two detected K2 periods is 20% (175 of 709) in USco, 14% in Pleiades (68 of 501), and 13% in Praesepe (63 of 496). This excess of K2 binaries at young ages agrees with other studies that have found a higher multiplicity fraction at young ages (e.g., Ghez et al. 1993; Prato 2007; Jaehnig et al. 2017). There are astrophysical biases, however, that favor finding more sources with two K2 periods among the USco M dwarfs compared to the Pleiades and Praesepe samples. First, because all three clusters are at similar distance but USco is much younger, at a given mass its M dwarfs are much brighter; the larger number of photons should allow us to detect fainter (lower mass) binary companions and thus make us sensitive to more companions. Second, the 8 Myr isochrone is shallower than the ZAMS, and thus at a given (mass) a companion star will be relatively brighter in USco than in the other two clusters – again favoring detection of lower systems in USco. Third, optical light curve amplitudes for a given mass and period are higher at young, pre-main-sequence ages than on the ZAMS, which also favors being able to find fainter companions. Therefore, our finding a higher fraction of binaries in USco compared to the other two clusrers may reflect these biases, in addition to a possibly higher absolute binary fraction.
Assuming that the M stars with multiple periods are in fact multiples, there are potentially interesting correlations in our USco data between multiplicity and disks. In the bottom two panels of Figure 10 (which is just the M stars), we have identified stars with multiple periods (likely binaries). Two correlations are evident between rotation and binarity among the M stars in USco. First, the stars with disks are less frequently identified as binaries in this way compared to the disk-free stars. Second, at least among the M dwarfs, the binary fraction is higher among the more rapidly rotating stars. Using binomial statistics, for the latest M stars we have here (mid-M), the probability that the disked stars and non-disked stars were drawn from a parent population with a common binary fraction is less than 1 part in a thousand. The probability that the slowly rotating half and the rapidly rotating half of the non-disked, mid-M (latest we have here) stars share the same binary fraction is also less than 1 part in a thousand. The observed distributions of those quantities for the early M stars show similar trends, but not at a statistically significant level. The correlation between rotation and binarity for USco and our other K2 clusters will be discussed at greater length in a future paper (Stauffer et al. 2018 in prep).
6.2 LC and Periodogram Categories
In paper II and IV, we classified the LC and periodogram morphologies. For convenience, the classes we presented in those earlier papers are summarized in Appendix E.
We expect the observed morphologies to reflect trends predicted by stellar evolution theory. As stars contract towards the main sequence, they will spin up from momentum conservation and spin down from winds. Disk-related phenomena should be seen only in the pre-main-sequence. As discussed earlier, the net evolutionary effects are a spin up from USco to the Pleiades, followed by a spin down from the Pleiades to Praesepe. There is also a convergence in rotation rates for hotter stars as they get older.
We observe phenomena that we interpret as interactions with gas/dust disks only in the young systems USco and Oph. As described above, there are dippers and bursters, and disk-affected light curves, in these two young clusters. There are many of the scallop shell (and related categories) LCs in these youngest clusters; these are discussed in Appendix D and Stauffer et al. (2017, 2018). There are a few of these scallops in the Pleiades, and none in Praesepe.
The older clusters, the Pleiades and Praesepe, have LC and periodogram morphologies that also can be found in USco and Oph. Table 2 summarizes the numbers and sample fractions of the various LC types as defined in the Pleiades and Praesepe. Except for Oph, at least 85% of the members are periodic. The presence of disks and accretion in the USco sample apparently does not preclude period derivation at the same rates as in the older clusters. Of the periodic sample, as noted above, similar fractions (20%) are multi-periodic. There is more scatter across the clusters in nearly all of the remaining categories, but the distributions are roughly comparable. Moving double-dip, shape changers, and complex peaks happen overall most frequently in Praesepe. Double dips, moving double dips, and beaters happen least frequently overall in USco and Oph; perhaps enhanced disk or activity influence in these clusters make it more likely to find a single sinusoid-family LC, as opposed to a clean enough “2 similar dips per cycle” that defines the double-dip category. The fact that the fractions are overall roughly comparable tells us that there is no large change in the surface phenomena exhibited by young stars over two orders of magnitude in age. There are likely to be, however, color dependencies; see next section.
| Category | Praesepe | Pleiades | USco | Oph | ||||||||
|---|---|---|---|---|---|---|---|---|---|---|---|---|
| Number | Frac. of | Frac. of | Number | Frac. of | Frac. of | Number | Frac. of | Frac. of | Number | Frac. of | Frac. of | |
| sample | periodic sample | sample | periodic sample | sample | periodic sample | sample | periodic sample | |||||
| Periodic | 809 | 0.86 | 1.00 | 759 | 0.92 | 1.00 | 969 | 0.86 | 1.00 | 108 | 0.60 | 1.00 |
| Single period | 645 | 0.69 | 0.80 | 559 | 0.68 | 0.74 | 751 | 0.66 | 0.78 | 86 | 0.48 | 0.80 |
| Multi-period | 164 | 0.17 | 0.20 | 200 | 0.24 | 0.26 | 217 | 0.19 | 0.22 | 22 | 0.12 | 0.20 |
| Double-dip | 163 | 0.17 | 0.20 | 107 | 0.13 | 0.14 | 132 | 0.12 | 0.14 | 6 | 0.03 | 0.06 |
| Moving double-dip | 121 | 0.13 | 0.15 | 31 | 0.04 | 0.04 | 32 | 0.03 | 0.03 | 0 | 0.00 | 0.00 |
| Shape changer | 297 | 0.32 | 0.37 | 114 | 0.14 | 0.15 | 277 | 0.24 | 0.29 | 48 | 0.27 | 0.44 |
| Orbiting clouds? | 0 | 0 | 0 | 5 | 0.01 | 0.01 | 28 | 0.02 | 0.03 | 6 | 0.03 | 0.06 |
| Beater | 77 | 0.08 | 0.10 | 135 | 0.16 | 0.18 | 107 | 0.09 | 0.11 | 10 | 0.06 | 0.09 |
| Complex peak | 68 | 0.07 | 0.08 | 89 | 0.11 | 0.12 | 8 | 0.01 | 0.01 | 0 | 0.00 | 0.00 |
| Resolved, close peaks | 68 | 0.07 | 0.08 | 126 | 0.15 | 0.17 | 150 | 0.13 | 0.15 | 12 | 0.07 | 0.11 |
| Resolved, distant peaks | 71 | 0.08 | 0.09 | 39 | 0.05 | 0.05 | 84 | 0.07 | 0.09 | 10 | 0.06 | 0.09 |
| Pulsator | 17 | 0.02 | 0.02 | 8 | 0.01 | 0.01 | 12 | 0.01 | 0.01 | 0 | 0.00 | 0.00 |
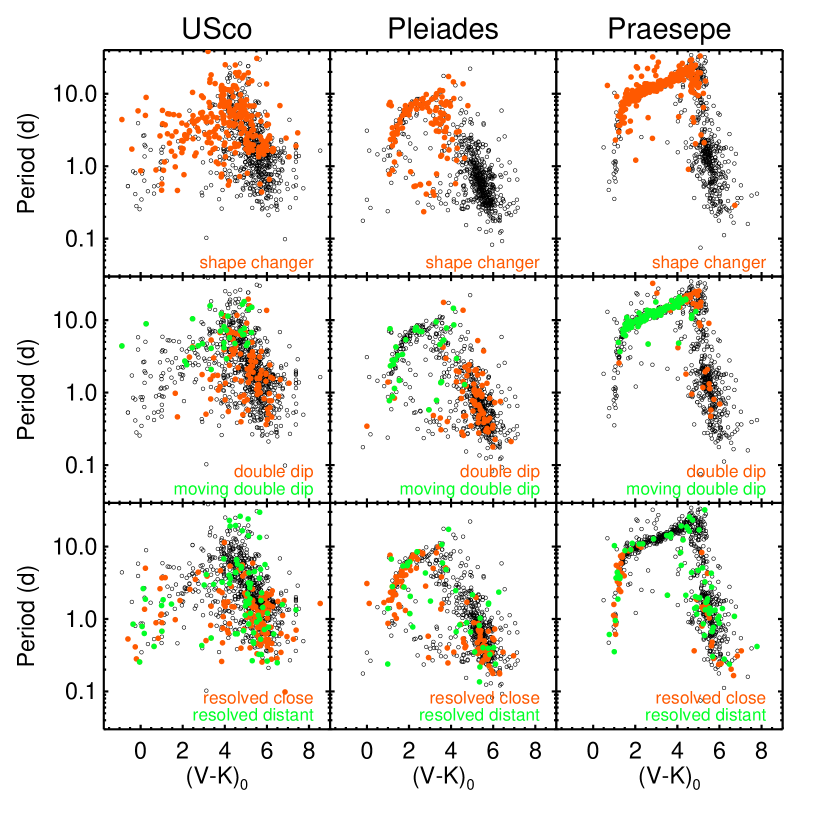
6.3 vs. : LC Categories
Figure 14 shows where stars fall in the vs. diagram for 3 of the LC types where there are differences across the three most well-populated clusters (USco, Pleiades, Praesepe).
The USco shape changers and to some extent the moving double-dip stars seem to extend to redder colors than in the other clusters. Assuming that we have correctly interpreted the shape changers and the moving double-dip LCs as spot evolution and/or surface differential rotation, then these phenomena are found on lower mass stars at USco age compared to the other clusters.
There are more double-dip M stars in USco and the Pleiades than Praesepe. Assuming that double-dip LCs originate from two, stable spots/spot groups on opposite hemispheres, this implies that the M star magnetic field structures are more stable over 70 d to lower masses in USco than the older clusters.
Resolved close peak sources tend to be quite localized to the earlier types in Praesepe and the Pleiades; they are more equally distributed in USco. If these LCs can be interpreted as multiple stable spots/spot groups and surface differential rotation, then again, these phenomena may be found on lower mass stars at USco age compared to the other clusters. On the other hand, these could also be M star binaries; see Stauffer et al. (2018).
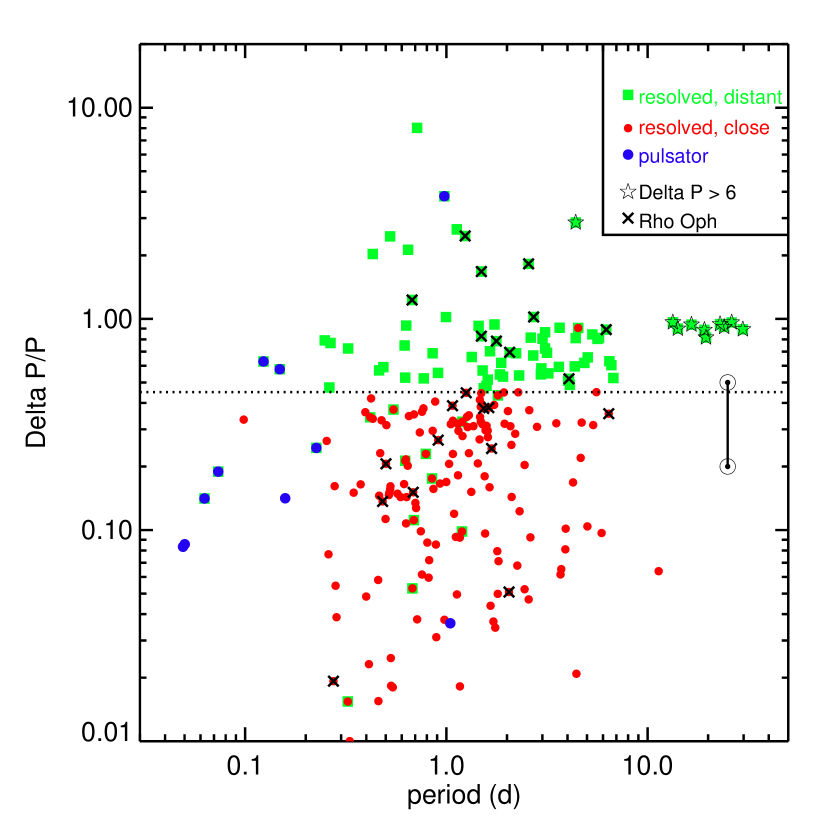
6.4 distributions
As for the other clusters, we calculated the metric for stars with resolved multi-period peaks; see Figure 15. We take the closest peak to the , subtract the smaller from the larger, and divide by the . The distribution here, like that for Praesepe (paper IV), has relatively little structure as compared to the Pleiades (paper II). It might be the case, as we postulated for Praesepe, that the 70 d K2 campaigns are not quite long enough to capture enough complete cycles of the longer periods in USco (and Praesepe) to resolve peaks in the periodogram. The Pleiades stars are, on average, rotating the fastest that these stars will ever rotate, so there are enough cycles (on average) to resolve the peaks and place them on this diagram.
As for Praesepe (paper IV), there are several M stars with multiple periods where the difference between the two periods exceeds 6d; these must be unresolved binaries. These systems include some of the most slowly rotating stars in the USco ensemble. They also appear high in the CMD on average, supporting the idea that they are binaries.
7 Summary and Conclusions
In this paper, we have presented our analysis of rotation rates for USco (8 Myr) and Oph (1 Myr). While the data reduction and collection of ancillary data from the literature and archives was relatively straightforward (and similar to methods we used in papers I-IV), determining cluster members and dereddening was harder in these clusters, and as a result, there may be more non-members, and more scatter in our proxy for mass in USco and Oph, than there were in the Pleiades (125 Myr; papers I-III) and Praesepe (790 Myr; paper IV). Disks are much more important in USco and Oph, both in terms of their influence on the LC shapes and the rotation rates themselves; we identified disks via an IR excess at any available band. Bursters (sudden brightenings) and dippers (sudden fadings) can both be found in our LCs.
Our analysis places USco (and Oph, though it has many fewer stars) in context with the Pleiades and Praesepe (Fig. 11). We now have rotation periods for 1000 stars at each of three important ages: 8 Myr (USco) is about the time when most primordial circumstellar disks go away; 125 Myr (Pleiades) is roughly the age when low mass stars arrive on the MS; 790 Myr (Praesepe) is after MS angular momentum loss has significantly altered the ZAMS rotational velocities. Given our results, the basic dependence of period on color (and hence, loosely speaking, on mass) is already set in place by 8 Myr, but with the scatter in period at a given mass decreasing as age increases; we note that some of the scatter in USco may be due to the larger uncertainties in reddening corrections and membership. For the FGK stars, the Pleiades distribution is bimodal, with a dominant ‘slow sequence.’ The USco distribution is more unimodal and requires more spin-up for the rapid rotators and more spin-down for the slow rotators in order to match the Pleiades distribution. Because of strong structural evolution, for these stars we caution that a full interpretation requires theoretical modeling outside the scope of this paper.
The rotation rates for the M stars have been probed for the first time using K2. The relationship between color (mass) and log has the same slope between USco and the Pleiades; . M dwarfs spin up between 8 and 125 Myr by a factor of 3.5, more or less independently of mass. In contrast, no simple scaling of the Pleiades or USco relationship matches the Praesepe distribution as well. The early Ms in Praesepe have clearly spun down by a larger factor and the latest Ms in Praesepe rotate only slightly more slowly than their Pleiades counterparts.
Very few stars in the Pleiades or Praesepe rotate near breakup; in contrast, in USco, the most rapidly rotating low mass M stars have rotation periods very near or coincident with the predicted breakup period at 8 Myr. Some stars in USco may have their rotation rates set by this limit.
Disks have a significant influence on the rotation rates in USco. There are several instances in our set of LCs where dipping behavior is synchronized with the spot-modulated variations, indicating that dipping (from the inner disk) is locked to the stellar rotation rate (from the spot-modulation). There is a clear pile-up of disked M stars with rotation rates near 2 d. Stars with disks rotate on average more slowly than stars without, consistent with results from other young clusters.
The LCs and periodograms from USco and Oph can be analyzed using a similar approach as we used for the Pleiades (papers I-IV) and Praesepe (paper IV). We can place the objects into the same LC/periodogram categories as previously defined. There are very similar fractions of multi-periodic stars; there are significantly more of the scallop shell (and related categories) LCs in the youngest clusters. Other categories appear at roughly the same rates as for the older clusters. Multi-periodic M stars are likely to be binaries in all of these clusters.
References
- Abt et al. (1969) Abt, H., Clements, A., Doose, L., & Harris, D. 1969, AJ74, 1153
- Akeson et al. (2013) Akeson, R., et al., 2013, PASP, 125, 989
- An et al. (2007) An, D., Terndrup, D., Pinsonneault, M., et al., 2007, ApJ655, 233
- Ansdell et al. (2016) Ansdell, M., Gaidos, E., Rappaport, S., Jacobs, T., 2016, ApJ, 816, 69
- Ansdell et al. (2018) Ansdell, M., Oelkers, R., Rodriguez, J., et al., 2018, MNRAS, 473, 1231
- Baraffe et al. (2015) Baraffe, I., Homeier, D., Allard, F., Chabrier, G., 2015, A&A, 577, A42
- Belcher et al. (1976) Belcher, J. & MacGregor, K. 1976, ApJ, 210, 498
- Biazzo et al. (2009) Biazzo, K., Melo, C., Pasquini, L., et al. 2009, A&A, 508, 1301
- Blinova et al. (2016) Blinova, A., Romanova, M., & Lovelace, R. 2016, MNRAS, 459, 2354
- Bouvier et al. (1993) Bouvier, J., Cabrit, S., Fernandez, M. et al., 1993, A&A, 272, 176
- Bouvier et al. (1997a) Bouvier, J., Wichmann, R., Grankin, K. et al., 1997a, A&A, 318, 495
- Bouvier et al. (1997b) Bouvier, J., Forestini, M., & Allain, S. 1997b, A&A, 326, 1023
- Burgasser et al. (2003) Burgasser, A. J., Kirkpatrick, J. D., Reid, I. N., Brown, M. E., Miskey, C. L., & Gizis, J. E. 2003, ApJ, 586, 512
- Cardelli et al. (1989) Cardelli, J., Clayton, G., & Mathis, J., 1989, ApJ, 345, 245
- Carpenter et al. (2006) Carpenter, J., Mamajek, E., Hillenbrand, H., Meyer, M., 2006, ApJ, 651, 49
- Carpenter et al. (2009) Carpenter, J., Mamajek, E., Hillenbrand, H., Meyer, M., 2009, ApJ, 705, 1646
- Chambers et al. (2016) Chambers, K., Magnier, E., Metcalf, N., et al., 2016, arXiv:1612.05560
- Cieza & Baliber (2007) Cieza, L. & Baliber, N. 2007, ApJ, 671, 605
- Cody et al. (2016) Cody, A. M., Stauffer, J., Baglin, A., Micela, G., Rebull, L., et al., 2014, AJ, 147, 82
- Cody et al. (2017) Cody, A. M., Hillenbrand, L., David, T., Carpenter, J., Everett, M., & Howell, S., 2017, ApJ, 836, 41
- Coker et al. (2016) Coker, C., Pinsonneault, M., & Terndrup, D. 2016, ApJ, 833, 122
- Collier Cameeron et al. (1995) Collier Cameron, A., Campbell, C. & Quaintrell, H. 1995, A&A, 298, 133
- Dahm et al. (2012) Dahm, S., Slesnick, C. & White, R. 2012, ApJ, 745, 56
- Davenport et al. (2015) Davenport, J., Hebb, L., & Hawley, S., 2015, ApJ, 806, 212
- David et al. (2016) David, T., Hillenbrand, L., Cody, A. M., Carpenter, J., Howard, A., 2016, ApJ, 816, 21
- Davies et al. (2014) Davies, C., Gregory, S., & Greaves, J. 2014, MNRAS, 444, 1157
- Endal & Sofia (1981) Endal, A. & Sofia, S. 1981, ApJ, 243, 625
- Epchtein et al. (1999) Epchtein, N., Deul, E., Derriere, S., Borsenberger, K., Egret D., et al., 199, A&A, 349, 236
- Erickson et al. (2011) Erickson, K., Wilking, B., Meyer, M., Robinson, J., Stephenson, L., 2011, AJ, 142, 140
- Feiden (2016) Feiden, G., 2016,A&A, 593, 99
- Foque & Bertin (1995) Foqué, P., & Bertin, E., 1995, ApL&C, 31, 31,
- Gaia Collaboration et al. (2016) Gaia Collaboration, Brown, A., Vallenari, A., Prusti, T., de Bruijne, J.H.J., et al., 2016, A&A, 595, 2
- Ghez et al. (1993) Ghez, A., Neugebauer, G., & Matthews, K., 1993, PASP, 105, 951
- Ghosh & Lamb (1977) Ghosh, P., & Lamb, F. 1977, ApJ, 217, 578.
- Herczeg & Hillenbrand (2015) Herczeg, G., and Hillenbrand, L., 2015, ApJ, 808, 23
- Henden et al. (2016) Henden, A., Templeton, M., Terrell, D., Smith, T. C., Levine, S., Welch, D., 2016, yCat, 2336, 0
- Herbst et al. (2002) Herbst, W., Bailer-Jones, C., Mundt, R., et al., 2002, A&A, 396, 513
- Herbst & Mundt (2005) Herbst, W., & Mundt, R., 2005, ApJ, 633, 967
- Howell et al. (2014) Howell, S, et al., 2014, PASP, 126, 398
- Indebetouw et al. (2005) Indebetouw, R., Mathis, J., Babler, B., Meade, M., Watson, C., et al., 2005, ApJ, 619, 931
- Irwin & Bouvier (2009) Irwin, J. & Bouvier, J. 2009, IAUS, 258, 363
- Jaehnig et al. (2017) Jaehnig, K., Bird, J., Stassun, K., Da Rio, N., Tan, J., Cotaar, M., Somers, G., 2017, ApJ, 851, 14
- Konigl (1991) Königl, A. 1991, ApJ, 370, 39
- Kraft (1965) Kraft, R. 1965, ApJ, 142, 681
- Kraft (1967a) Kraft, R. 1967, ApJ, 150, 551
- Kraft (1967b) Kraft, R. 1967, ApJ, 148, 129
- Kraus & Hillenbrand (2007) Kraus, A. & Hillenbrand, L., 2007, ApJ, 662, 413
- Lamm et al. (2005) Lamm, M., Mundt, R., Bailer-Jones, C. A. L., Herbst, W., 2005, A&A, 430, 1005
- Lodieu et al. (2011) Lodieu, N., Dobbie, P., Hambly, N., 2011, A&A, 527, 24
- Long et al. (2005) Long, M., Romanova, M., Lovelace, R., 2005, ApJ, 634, 1214
- Luger et al. (2016) Luger, R., Agol, E., Kruse, E., et al. 2016, AJ, 152, 100
- Luger et al. (2017) Luger, R., Kruse, E., Foreman-Mackey, D., Agol, E., Saunders, N., 2017, AJ, submitted (arXiv:1702.05488)
- Luhman & Mamajek (2012) Luhman, K., & Mamajek, E., 2012, ApJ, 758, 31
- Mader (2009) Mader, A., 2009, “Physics, Formation and Evolution of Rotating Stars”, Springer Berlin Heidelberg http://adsabs.harvard.edu/abs/2009pfer.book…..M
- Marton et al. (2017) Marton, G., Calzoletti L., Perez Garcia, A., Kiss, C., Paladini, R., et al., 2017, Explanatory Supplement, http://irsa.ipac.caltech.edu/data/Herschel/PPSC/docs/HPPSC_Explanatory_Supplement.pdf
- MacGregor & Brenner (1991) MacGregor, K., Brenner, M., 1991, ApJ, 376, 204
- Mellon et al. (2017) Mellon, S, Mamajek, E., Oberst, T, & Pecaut, M., 2017, ApJ, 844, 66
- Meyer et al. (1997) Meyer, M., Calvet, N.,& Hillenbrand, L., 1997, AJ, 114, 288
- Meyer et al. (2006) Meyer, M., Hillenbrand, L., Backman, D., et al., 2006, PASP, 118, 1690
- Muiños & Evans (2014) Muiños, J., & Evans, D., 2014, AN, 335, 367
- Murakami et al. (2007) Murakami, H., Baba, H., Barthel, P., et al., 2007, PASJ, 59, 369
- Pecaut et al. (2012) Pecaut, M., Mamajek, E., & Bubar, E., 2012, ApJ, 746, 154
- Pecaut & Mamajek (2013) Pecaut, M., & Mamajek, E., 2013, ApJS, 208, 9
- Pinsonneault (1997) Pinsonneault, M., 1997, ARA&A, 35, 557
- Pinsonneault et al. (1997) Pinsonneault, M., Kawaler, S., Demarque, P., 1990, ApJS, 74, 501
- Prato (2007) Prato, L., 2007, ApJ, 657, 338
- Preibisch et al. (2002) Preibisch, T., Brown, A., Bridges, T., Guenther, E., Zinnecker, H., 2002, AJ, 124, 404
- Preibisch et al. (2001) Preibisch, T., Guenther, E., Zinnecker, H., 2001, AJ, 121, 1040
- Preibisch et al. (1998) Preibisch, T., Guenther, E., Zinnecker, H., Sterzik, M., Frink, S., Roeser, S., 1998, A&A, 333, 619
- Press et al. (1992) Press, W., Teukolsky, S., Veterling, W., Flannery, B., 1992, “Numerical Recipes in C”, Cambridge University Press.
- Rebull (2001) Rebull, L., 2001, AJ, 121, 1676
- Rebull et al. (2006) Rebull, L., Stauffer, J., Megeath, S. T., Hora, J. L., Hartmann, L., 2016a, AJ, 152, 113
- Rebull et al. (2016a) Rebull, L., Stauffer, J., Cody, A., et al., 2016a, AJ, 152, 113
- Rebull et al. (2016b) Rebull, L., Stauffer, J., Bouvier, J., et al., 2016b, AJ, 152, 114
- Rebull et al. (2017) Rebull, L., Stauffer, J., Hillenbrand, L., et al., 2017, ApJ, 839, 92
- Ripepi et al. (2015) Ripepi, V., Balona, L., Catanzaro, G., Marconi, M., Palla, F., & Giarruso, M., 2015, MNRAS, 454, 2606
- Rizzuto et al. (2011) Rizzuto, A., Ireland, M., Robertson, J., 2011, MNRAS, 416, 3108
- Rizzuto et al. (2012) Rizzuto, A., Ireland, M., Zucker, D., 2012, MNRAS, 421, 97
- Rizzuto et al. (2013) Rizzuto, A., Ireland, M., Robertson, J., Kick, Y, Tuthill, P., et al., 2013, MNRAS, 436, 1694
- Rizzuto et al. (2015) Rizzuto, A., Ireland, M., Kraus, A., 2015, MNRAS, 448, 2737
- Rodriguez-Ledesma et al. (2010) Rodríguez-Ledesma, M., Mundt, R., & Eisloffel, J. 2010, A&A, 515, 13
- Roeser et al. (2010) Roeser, S., Demleitner, M., Schilbach, E., 2010, AJ, 139, 2440
- Romanova et al. (2013) Romanova, M., Ustyugova, G., Koldoba, A., & Lovelace, R. 2013, MNRAS, 430, 699
- Saylor et al. (2017) Saylor, D. A., Lépine, S., Crossfield, I., Petigura, E., 2017, AJ, in press (arXiv:1710.09909)
- Scholz et al. (2015) Scholz, A., Kostov, V., Jayawardhana, R., Muzic, K., 2015, ApJ, 809, 29
- Scargle (1982) Scargle, J. D. 1982, ApJ, 263, 835
- Siess et al. (2000) Siess, L., Dufour, E., Forestini, M., 2000, A&A, 358, 593
- Skumanich (1972) Skumanich, A. 1972, ApJ, 171, 565
- Skrutskie et al. (2006) Skrutskie, M., Cutri, R. M., Stiening, R., et al., 2006, AJ, 131, 1163
- Slesnick et al. (2006) Slesnick, C., Carpenter, J., Hillebrand, L., 2006, AJ, 131, 3016
- Slesnick et al. (2008) Slesnick, C., Hillebrand, L., Carpenter, J., 2008, ApJ, 688, 377
- Somers et al. (2017) Somers, G., Stauffer, J., Rebull, L., Cody, A. M., Pinsonneault, M., 2017, ApJ, 850, 134
- Stauffer & Hartman (1987) Stauffer, J. & Hartmann, L. 1987, ApJ, 318, 227
- Stauffer et al. (1989) Stauffer, J., Hartmann, L., & Jones, B. 1989, ApJ, 346, 160
- Stauffer et al. (2014) Stauffer, J., Cody, A. M., Baglin, A., Alencar, S., et al., 2014, AJ, 147, 83
- Stauffer et al. (2015) Stauffer, J., Cody, A. M., McGinnis, P., Rebull, L., et al., 2015, AJ, 149, 130
- Stauffer et al. (2016a) Stauffer, J., Cody, A. M., Rebull, L., Hillenbrand, L., et al., 2016a, AJ, 151, 60
- Stauffer et al. (2016b) Stauffer, J., Rebull, L., Bouvier, J., et al., 2016b, AJ, 152, 142
- Stauffer et al. (2017) Stauffer, J., Collier Cameron, A., Jardine, M., et al., 2017, AJ, 153, 152
- Stauffer et al. (2018) Stauffer, J., Rebull, L., David, T., et al., 2018, AJ, in press
- Terquem & Papaloizou (2000) Terquem, C., & Papaloizou, J. 2000, A&A, 360, 1031
- Thompson et al. (2012) Thompson, S., Everett, M., Mullally, F., Barclay, T., Howell, S., et al., 2012, ApJ, 735, 86
- Tian et al. (2017) Tian, H., Gupta, P., Sesar, B., Rix, H-.W., et al., 2017, ApJS, 232, 4
- Tinker et al. (2002) Tinker, J., Pinsonneault, M., & Terndrup, D. 2002, ApJ, 564, 877
- Van Leeuwen (1982) van Leeuwen, F. and Alphenaar, P. 1982, ESO Messenger, 28, 15
- Vanderburg & Johnson (2014) Vanderburg, A., & Johnson, J., 2014, PASP, 126, 948
- Venuti et al. (2017) Venuti, L., Bouvier, J., Cody, A., Stauffer, J. et al. 2017, A&A, 581, 66
- Weber & Davis (1967) Weber, E. J., & Davis, L., 1967, ApJ, 148, 217
- Werner et al. (2004) Werner, M., Roellig, T., Low, F., et al., 2004, ApJS, 154, 1
- Wilking et al. (2005) Wilking, B., Meyer, M., Robinson, J., Greene, T., 2005, AJ, 130, 1733
- Wright et al. (2010) Wright, E., Eisenhardt, P. R. M., Mainzer, A. K., et al., 2010, AJ, 140, 1868
- Zacharias et al. (2017) Zacharias, N., Finch, C., Frouard, J., et al., 2017, AJ, 153, 166
Appendix A New Upper Sco Membership Catalog for K2 Campaign 2 Targets
More than a thousand stars were included in the observation list for K2 campaign 2 (K2C2) because they were candidate or known members of Upper Sco or Oph. However, thousands of other K2C2 targets were simply selected as low mass stars in the direction of Upper Sco (often with the hope of finding transiting exoplanets); some of these stars could potentially also be Upper Sco members. We therefore used a two step process in order to identify likely USco and Oph members to include in our study of those clusters.
In the first step, we conducted a literature search to identify all stars cited as probable members of the two clusters and for which there was either spectroscopic confirmation of that membership or IR data indicating the presence of a circumstellar disk. The papers we used for this purpose included Preibisch et al. (1998, 2001, 2002), Wilking et al. (2005), Erickson et al. (2011), Slesnick et al. (2006), Kraus & Hillenbrand (2007), Lodieu et al. (2011), Luhman & Mamajek (2012), and Rizzuto et al. (2011, 2012, 2015). We also accepted literature members whose Gaia TGAS DR1 proper motions and parallaxes supported membership. We then cross-correlated this list with the list of stars which had been targeted as Upper Sco members during Campaign 2 of the K2 mission, resulting in a list of 700 “confirmed” literature members of Upper Sco and 50 “confirmed” members of Oph.
Next, for the entire set of 13,400 stars observed during K2C2, we compiled accurate photometry and proper motions from a variety of all-sky surveys. Specifically, for all these stars, we compiled Gaia magnitudes and 2MASS magnitudes. Where Gaia did not provide a magnitude, we compiled magnitudes from the DENIS survey (Foqué & Bertin 1995, Epchtein et al. 1999) and/or magnitudes from the Carlsberg meridian catalog (Muiños & Evans 2014). We further compiled proper motions for all the K2C2 stars from the GPS1 (Tian et al. 2017), UCAC5 (Zacharias et al. 2017) and PPMXL (Roeser et al. 2010) catalogs.
From the catalog photometry, we derived a measured color for each star, for those stars which were included in the Gaia DR1 data release. From this set of stars, we derived polynomial relations between and and . For those stars not in the Gaia DR1 catalog, we used those polynomial relations to provide estimates of . In this way, we were able to provide either measured colors or estimates of for more than 98% of the stars in the K2C2 target list.
We also wanted to derive a single proper motion value to attach to each of the K2C2 stars. Each of the proper motion surveys had different magnitude ranges over which they provided data. For each catalog, we plotted vector point diagrams for the entire K2C2 set, and noted the centroid position of the cloud of points at the expected position for Upper Sco. Those centroids differ slightly from one catalog to the next, which we assume is due to small zero-point offsets between the catalogs. We applied small offsets to the catalog motions to remove those zero point offsets. Then, where we had data from all three catalogs, we checked to see if one of them was significantly discrepant from the others – in which case, we did not consider that proper motion measurement and we averaged the values from the other two catalogs. Where we had proper motions from two catalogs, we just took the average. This process resulted in our having relatively homogenous proper motion estimates for 98.5% of the K2C2 stars.
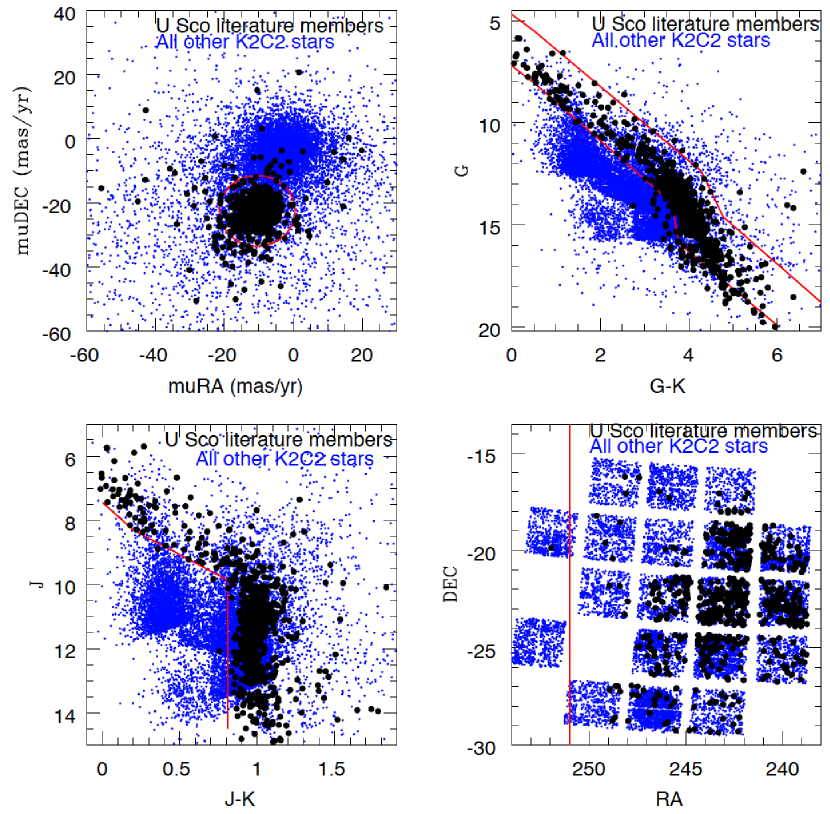
For USco, we next plotted the “confirmed” member stars in vs. and vs. color-magnitude diagrams, a spatial plot, and a vector-point diagram, and demarcated regions in these parameter spaces which enclosed the majority of the literature members (see Figure 16). We designated the 551 literature members that satisfied all of these criteria as our “gold” members of Upper Sco. Because there is high probability that all of the literature members are indeed Upper Sco or Oph members, we designated as “silver” members of Upper Sco those 71 stars from the literature sample that had proper motions in our compilation within 15 mas yr-1 from the expected Upper Sco motion. Finally, we identified as “bronze” Upper Sco members the 511 additional stars from the K2C2 target list that fell within the expected regions in all four diagrams of Figure 16. The final Upper Sco catalog includes 1133 stars.
For Oph, a similar process resulted in 88 stars for our catalog of candidate members of Oph; 19 gold, 31 silver, and 46 bronze. However, the process to this point has excluded many very embedded Oph members. We realized that a pure proper motion and CMD-based selection will omit embedded stars because the data used for the proper motions do not exist for the very embedded sources. There are many such sources near the cluster ( between 246.14 and 247.43; between 25.19 and 24, e.g., the box in Fig. 1) that were not already identified as USco members above, but whose suggests high extinction. We additionally selected sources (assigned to the bronze confidence level) that were in that spatial box in Fig. 1, with inferred 2.0 or 1.0, and which had 14. By imposing the requirement, we eliminate all stars foreground to the Oph clouds.We assume that within that spatial range, the molecular cloud has enough dust column density to extinct all background stars by enough so that they would be optically invisible (or at least too faint for a useful K2 light curve). Because these stars are very embedded, stars with 14 often have effectively useless optical K2 LCs; those that we omitted that still have detectable are included in the non-member catalog below. Any field star that happens to have wandered inside the molecular cloud would get accepted as a member using this approach, but we assume that is at most a handful of stars – and they mostly will not be periodic.
Figures 17 and 18 show the distributions of the gold, silver, and bronze samples in the CMD and the vs. plots. The gold/silver/bronze membership status is included in Table 1. For USco, there are 1133 total members, 551 gold, 71 silver, and 511 bronze, with 94%, 75%, and 78% periodic of the gold, silver, and bronzer samples, rsepectively. For Oph, there are 180 total members, 19 gold, 29 silver, and 132 bronze; the periodic fractions are 100%, 83%, and 49%, respectively. We expect to find a higher fraction of periodic LCs among the member stars, which is reflected in the higher periodic fraction of the gold samples, lower periodic fraction in the silver samples, and still lower periodic fraction in the bronze samples.


Appendix B Non-Members
The process of finding probable cluster members leaves 1313 LCs (50% of the entire sample) that are tied to objects that we believe are likely to be NM. However, since we analyzed all of these light curves in the same way, we provide information on the remaining 1313 LCs here. As membership improves (e.g., Gaia DR2), membership may be re-evaluated. In this section, we provide in Table 3 the same contents as in Table 1 above (save for the column on cluster membership), but for NM. The values included here should be good on the whole, but more outliers may be present because after a certain point, we focused on deep analysis of the members.
In terms of the various metrics provided in Sec. 2, spectral types are available for 14% of the NM. WISE detections are found for 30% of the NM. Nine percent of the NM have clear disks, and 4% may have disks. For the entire sample, there are 413 (16%) disk candidates, leaving 87% without disks. This lower disk fraction is consistent with a higher fraction of NMs in this sample. About 34% of the NM are periodic; the much lower fraction of periodic sources is consistent with this sample largely being NM. About a third of the periodic LCs from the NMs are sinusoidal and therefore likely to be starspots; 84% of the periods are 10 d.
| Label | Contents |
|---|---|
| EPIC | Number in the Ecliptic Plane Input Catalog (EPIC) for K2 |
| coord | Right ascension and declination (J2000) for target |
| othername | Alternate name for target |
| Vmag | V magnitude (in Vega mags), if observed |
| Kmag | magnitude (in Vega mags), if observed |
| vmk-obs | , as directly observed (if and exist), or as inferred (see text) |
| vmk-used | used (observed or inferred; see text) |
| ev-k | adopted for this star (see § 2.4) |
| Kmag0 | dereddened magnitude (in Vega mags), as inferred (see §2.4) |
| vmk-dered | (dereddened ), as inferred (see § 2.4; rounded to nearest 0.1 to emphasize the relatively low accuracy) |
| uncertaintycode | two digit code denoting origin of and (see §2.2 and 2.4): First digit (origin of ): 1= measured directly from the literature (including SIMBAD) and from 2MASS; 2= from APASS and from 2MASS; 3= inferred from Gaia and from 2MASS (see §2.2); 4= inferred from Pan-STARRS1 and from 2MASS (see §2.2); 5= inferred from membership work (see §2.3; rare); 6= inferred from well-populated optical SED and from 2MASS (see §2.2); -9= no measure of . Second digit (origin of leading to ): 1=dereddening from diagram (see §2.4); 2=dereddening back to expected for spectral type; 3=used median =0.7 (see §2.4); -9= no measure of |
| P1 | Primary period, in days (taken to be rotation period) |
| P2 | Secondary period, in days |
| P3 | Tertiary period, in days |
| P4 | Quaternary period, in days |
| Disk | Whether an IR excess (a disk) is present or not |
| DiskStart | Where the IR excess starts or the limit of our knowledge of where there is no excess |
| single/multi-P | indicator of whether single or multi-period star |
| dd | indicator of whether or not it is a double-dip LC (see §6.2 and E) |
| ddmoving | indicator of whether or not it is a moving double-dip LC (see §6.2 and E) |
| shch | indicator of whether or not it is a shape changer (see §6.2 and E) |
| beat | indicator of whether or not the full LC has beating visible (see §6.2 and E) |
| cpeak | indicator of whether or not the power spectrum has a complex, structured peak and/or has a wide peak (see §6.2 and E) |
| resclose | indicator of whether or not there are resolved close periods in the power spectrum (see §6.2 and E) |
| resdist | indicator of whether or not there are resolved distant periods in the power spectrum (see §6.2 and E) |
| pulsator | indicator of whether or not the power spectrum and period suggest that this is a pulsator (see §6.2 and E) |
Appendix C Timescales
As in papers I-IV, some LCs have some repeated patterns that we cannot identify with certainty as a rotation period. These ‘timescales’ tend to be longer than most of the rotation periods. Sometimes, there is not enough data to go 1 complete cycle. Table 4 summarizes the timescales for the stars out of the entire ensemble. Note that some also appear in the list of periodic stars, but with a shorter period that we believe to be the rotation period; the longer-term variability is unlikely to be rotation.
| EPIC | RA, Dec (J2000) | Timescale (d) | Cluster Membership | Notes |
|---|---|---|---|---|
| 205195088 | 155533.06-185526.8 | 35 | … | |
| 204230552 | 155537.64-230910.0 | 10 | … | |
| 203284437 | 155617.21-263817.1 | 13 | USco, silver | |
| 203866225 | 155710.94-243753.2 | 10 | … | listed as periodic in the master table; could legitimately be timescale instead |
| 204422391 | 155744.90-222351.2 | 35 | … | |
| 203799428 | 155811.60-245313.2 | 20 | … | |
| 204533829 | 155813.62-215652.3 | 9 | … | |
| 204475702 | 155829.62-221111.9 | 42 | USco, bronze | |
| 203549979 | 155852.11-254538.7 | 21 | … | |
| 204081030 | 155856.96-234436.0 | 24 | … | listed as periodic in the master table; could legitimately be timescale instead |
| 203382710 | 155912.91-261936.7 | 12 | … | |
| 204083945 | 160021.12-234354.0 | 19 | … | |
| 204398735 | 160142.53-222924.0 | 32 | … | |
| 204539201 | 160202.59-215531.5 | 35 | … | |
| 204819741 | 160220.29-204306.1 | 35 | … | |
| 204136937 | 160257.18-233110.5 | 11 | … | |
| 204083104 | 160312.80-234406.0 | 8 | … | |
| 205217672 | 160314.92-184823.3 | 5 | … | |
| 205590575 | 160642.32-163245.9 | 35 | … | |
| 204824869 | 160733.16-204141.5 | 25 | … | |
| 205358744 | 160836.58-180249.9 | 20 | USco gold | also periodic with another real p |
| 205661119 | 160844.17-160006.5 | 20 | … | |
| 203800848 | 160904.61-245254.2 | 20 | … | |
| 205558283 | 160920.41-164640.3 | 5 | USco, bronze | |
| 203799913 | 160940.18-245307.0 | 26 | … | listed as periodic in the master table; could legitimately be timescale instead |
| 205527458 | 160954.85-165936.0 | 20 | … | |
| 203401494 | 161014.08-261546.9 | 20 | … | |
| 202544694 | 161023.37-291700.1 | 24 | … | |
| 203933869 | 161044.64-242113.5 | 30 | … | |
| 204902065 | 161052.59-202042.4 | 35 | USco, bronze | |
| 204908189 | 161113.30-201903.2 | 7 | USco, gold | |
| 203866727 | 161135.20-243745.5 | 35 | … | |
| 205660462 | 161211.41-160025.5 | 25 | … | |
| 205599786 | 161240.04-162841.0 | 20 | … | |
| 203678376 | 161255.87-251858.3 | 44 | USco, bronze | |
| 203649180 | 161318.96-252503.2 | 20 | … | |
| 203329658 | 161337.92-262949.9 | 35 | USco, bronze | |
| 202742196 | 161427.75-283157.4 | 20 | … | |
| 205562347 | 161510.84-164457.9 | 20 | … | |
| 203379868 | 161815.72-262012.2 | 15 | … | |
| 202639739 | 161820.40-285500.1 | 20 | … | listed as periodic in the master table; could legitimately be timescale instead |
| 205471638 | 162136.58-172204.6 | 10 | USco, bronze | |
| 205659671 | 162136.94-160048.2 | 30 | … | |
| 205438739 | 162250.74-173447.4 | 16 | … | |
| 203870911 | 162251.13-243645.4 | 18 | … | PERIODIC? |
| 205498192 | 162306.82-171131.5 | 35 | … | |
| 203871153 | 162312.58-243641.6 | 35 | … | |
| 202891973 | 162352.28-275913.5 | 7 | USco, bronze | |
| 203555168 | 162415.50-254434.7 | 20 | USco, gold | also periodic with another real p |
| 203929472 | 162446.80-242221.0 | 15 | ROph, silver | |
| 205528856 | 162505.96-165903.2 | 25 | USco, bronze | |
| 203927310 | 162523.46-242254.1 | 10 | ROph, bronze | |
| 205556278 | 162534.87-164732.5 | 35 | … | |
| 203824768 | 162550.54-244736.0 | 7 | … | |
| 203899767 | 162601.60-242944.9 | 35 | ROph, bronze | |
| 203803804 | 162610.91-245215.5 | 10 | ROph, bronze | |
| 204885348 | 162626.47-202520.0 | 10 | … | |
| 203954364 | 162637.13-241559.9 | 20 | … | |
| 205191051 | 162654.80-185643.4 | 15 | … | listed as periodic in the master table; could legitimately be timescale instead |
| 203061783 | 162702.52-272326.3 | 25 | … | |
| 203445235 | 162725.34-260653.5 | 35 | … | |
| 203870022 | 162738.32-243658.5 | 12 | ROph, silver | |
| 204640326 | 162751.03-213001.0 | 23 | … | |
| 205157696 | 162810.26-190657.9 | 35 | USco, bronze | |
| 203979600 | 162812.15-240927.4 | 25 | … | |
| 203925443 | 162814.75-242322.5 | 35 | … | |
| 203944388 | 162823.30-241833.8 | 10 | … | |
| 203065453 | 162823.57-272241.2 | 26 | … | |
| 203905577 | 162825.09-242819.6 | 20 | … | |
| 202800225 | 162850.18-281906.7 | 20 | USco, bronze | |
| 203844132 | 162921.38-244310.5 | 24 | … | |
| 203873636 | 162932.33-243606.4 | 18 | … | |
| 203782748 | 162936.23-245653.0 | 20 | USco, silver | |
| 202816688 | 163001.49-281529.5 | 10 | USco, bronze | |
| 205125047 | 163056.32-191648.5 | 20 | USco, bronze | |
| 205073944 | 163228.42-193200.0 | 13 | USco, bronze | |
| 205634171 | 163235.87-161257.8 | 35 | … | |
| 205074126 | 163258.72-193156.3 | 35 | … | |
| 204416606 | 163428.77-222512.6 | 20 | … | |
| 204276894 | 163439.22-225814.8 | 35 | … | |
| 205140183 | 163519.69-191216.3 | 25 | … | |
| 204248248 | 163650.90-230456.6 | 10 | … | |
| 203262247 | 164019.37-264239.7 | 35 | … | |
| 204478680 | 164054.04-221030.2 | 35 | … | |
| 202767998 | 164113.58-282611.5 | 10 | … | |
| 203762955 | 164634.27-250111.2 | 20 | … | |
| 205035963 | 164917.71-194256.7 | 15 | … | listed as periodic in the master table; could legitimately be timescale instead |
| 205011893 | 165004.50-194949.8 | 10 | … | |
| 205370897 | 165104.97-175846.1 | 16 | … | |
| 205389454 | 165116.71-175243.4 | 35 | … |
Appendix D Scallop Shells and Flux Dips
Stauffer et al. (2017) identified 23 M dwarfs in USco and Oph that have unusually shaped phased K2 light curves. Eleven of these stars were described as “scallop-shells”, because their phased light curves showed multiple scallops or undulations. The remaining stars show one or several flux dips in their phased light curves. With few or no exceptions, these stars are weak-lined T Tauris, with no evidence of on-going accretion or IR excesses from circumstellar dust. All are rapid rotators, with most having P 1 d, and many having P 0.5 d. For about half of the group, their light curve morphology is stable over the duration of the K2 campaign; for many of the others in the group, small portions of the phased light curve shape change abruptly during the campaign. The phased light curve shapes have too much small-scale structure to be explained by rotational modulation of photospheric starspots. Instead, Stauffer et al. (2017) proposed that these stars have clumpy tori of gas and dust located at the Keplerian co-rotation radius, and that variable extinction for the fraction of such stars where the torus is aligned with our line of sight gives rise to the observed light curve morphologies. David et al. (2017) discuss one of these stars in detail. Stauffer et al. (2018) identify an additional 8 stars in USco and Oph with similar light curve morphologies, as well as three additional similar stars in Taurus using K2 Campaign 13 data.
In Table 5, we list all of the USco and Oph stars identified as belonging to this category in Stauffer et al. (2017, 2018). We also list 10 additional stars whose phased light curves have features that may fall in this category, but where the features are less obvious or the signal-to-noise ratio of the light curve is relatively poor or where other K2 artifacts make interpretation of the light curve difficult. Figure 19 shows two examples of the scallop-shell light curve class, plus light curves for four of the stars we newly identify as possible members of the class in Table 5. Figure 20 shows a color-magnitude diagram and a period-color diagram highlighting all of the stars in Table 5. These diagrams emphasize both that all of the members of the class are low mass stars and that the majority of them are very rapid rotators.

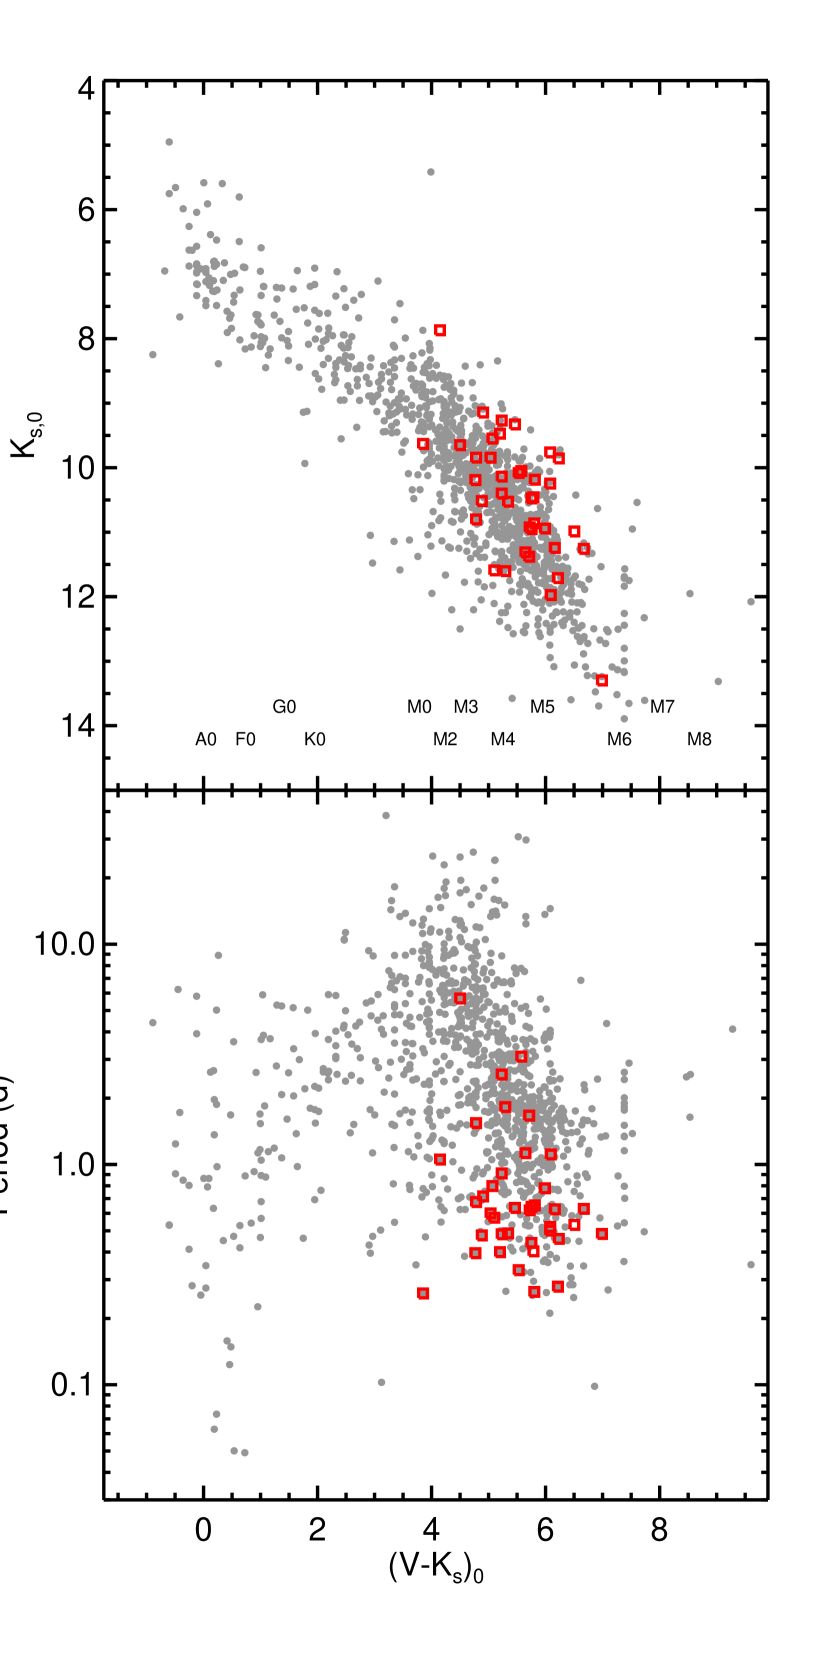
| EPIC | Coordinates (J2000) | Other name | (mag) | (mag) | 0 (mag) | (mag) | (d)aaAn asterisk denotes that, in the case of multiple periods, this is the period that has scallop shell or flux dip candidate properties. | (d)aaAn asterisk denotes that, in the case of multiple periods, this is the period that has scallop shell or flux dip candidate properties. | Where introduced |
|---|---|---|---|---|---|---|---|---|---|
| 204882444 | 155505.13-202607.8 | 2MASSJ15550513-2026077 | 9.74 | 5.32 | 9.65 | 4.58 | 0.3829 | … | new here |
| 204918279 | 155625.09-201616.2 | 2MASSJ15562511-2016159 | 9.86 | 6.67 | 9.80 | 6.23 | 0.4594 | 0.4665* | Stauffer et al. (2017) |
| 204787516 | 155723.90-205145.5 | 2MASSJ15572391-2051453 | 9.80 | 5.21 | 9.80 | 5.19 | 0.4868 | … | new here |
| 204066898 | 155836.21-234802.1 | UCAC3133-177729 | 10.19 | 5.47 | 10.10 | 4.77 | 0.3956* | 0.5386 | Stauffer et al. (2017) |
| 203462615 | 155938.05-260323.6 | 2MASSJ15593807-2603233 | 10.25 | 6.24 | 10.23 | 6.08 | 0.5201* | 0.4421 | Stauffer et al. (2017) |
| 204270520 | 160026.30-225941.4 | 2MASSJ16002631-2259412 | 11.34 | 6.49 | 11.28 | 6.07 | 0.5123 | … | new here |
| 204364515 | 160121.55-223726.7 | UCAC222721716 | 10.05 | 5.98 | 10.00 | 5.57 | 3.0863 | 1.4560* | Stauffer et al. (2017) |
| 204897050 | 160140.97-202208.3 | UScoCTIO56 | 10.86 | 6.55 | 10.77 | 5.80 | 0.2639 | … | Stauffer et al. (2017) |
| 204099739 | 160839.08-234005.6 | 2MASSJ16083908-2340055 | 9.15 | 5.33 | 9.09 | 4.90 | 0.7158 | 0.7428* | Stauffer et al. (2018) |
| 202724025 | 160856.94-283557.7 | 2MASSJ16085695-2835573 | 9.63 | 5.67 | 9.40 | 3.85 | 0.2595* | 0.2795 | Stauffer et al. (2017) |
| 204783273 | 160937.06-205253.2 | 2MASSJ16093706-2052529 | 11.98 | 6.28 | 11.95 | 6.09 | 1.1105 | … | new here |
| 203849738 | 160952.87-244153.5 | 2MASSJ16095287-2441535 | 10.93 | 6.17 | 10.87 | 5.72 | 0.6190 | … | Stauffer et al. (2017) |
| 205024957 | 161010.99-194604.2 | [PBB2002]UScoJ161011.0-194603 | 11.38 | 6.19 | 11.32 | 5.71 | 1.6656 | … | Stauffer et al. (2017) |
| 205046529 | 161026.38-193951.0 | 2MASSJ16102639-1939513 | 10.40 | 7.77 | 10.08 | 5.23 | 2.5619 | 1.8358* | Stauffer et al. (2017) |
| 203692610 | 161031.61-251602.1 | EPIC203692610 | 11.60 | 5.71 | 11.55 | 5.29 | 1.8210 | … | Stauffer et al. (2017) |
| 204060981 | 161056.18-234929.2 | … | 9.47 | 5.80 | 9.40 | 5.20 | 0.3996* | 0.3802* | Stauffer et al. (2018) |
| 204117263 | 161102.10-233550.7 | 2MASSJ16110212-2335504 | 10.95 | 6.11 | 10.91 | 5.75 | 0.6423 | … | Stauffer et al. (2017) |
| 205374937 | 161118.12-175728.9 | 2MASSJ16111813-1757286 | 9.33 | 6.03 | 9.26 | 5.46 | 0.6345* | 0.5436 | Stauffer et al. (2017) |
| 203645396 | 161142.60-252551.4 | 2MASSJ16114261-2525511 | 11.26 | 7.37 | 11.17 | 6.67 | 0.6287* | 0.4928 | new here |
| 204367193 | 161154.38-223649.3 | 2MASSJ16115439-2236491 | 13.30 | 7.45 | 13.24 | 6.99 | 0.4835 | … | Stauffer et al. (2017) |
| 203534383 | 161402.97-254853.3 | 2MASSJ16140298-2548531 | 11.71 | 7.05 | 11.60 | 6.22 | 0.2784* | 0.3234 | Stauffer et al. (2017) |
| 205110559 | 161519.71-192107.0 | EPIC205110559 | 10.46 | 7.06 | 10.30 | 5.79 | 0.4031 | … | Stauffer et al. (2017) |
| 204143627 | 161559.25-232936.2 | 2MASSJ16155926-2329363 | 11.31 | 6.00 | 11.27 | 5.65 | 1.1250 | … | Stauffer et al. (2017) |
| 204082531 | 161620.10-234414.4 | 2MASSJ16162012-2344141 | 10.19 | 5.81 | 10.19 | 5.81 | 0.6513* | 0.4256 | new here |
| 205267399 | 161841.87-183240.1 | … | 10.08 | 5.70 | 10.06 | 5.53 | 0.3311 | 0.3344* | Stauffer et al. (2018) |
| 203636498 | 162105.09-252742.6 | … | 10.94 | 6.34 | 10.90 | 5.99 | 0.7794 | … | Stauffer et al. (2018) |
| 202873945 | 162139.90-280306.9 | EPIC202873945 | 11.24 | 7.38 | 11.09 | 6.16 | 0.6258 | … | Stauffer et al. (2017) |
| 204321142 | 162235.29-224743.3 | … | 10.52 | 7.09 | 10.23 | 4.88 | 0.4763 | … | new here |
| 205483258 | 162324.52-171727.3 | 2MASSJ16232454-1717270 | 9.65 | 4.98 | 9.59 | 4.50 | 5.6670 | … | Stauffer et al. (2017) |
| 204296148 | 162451.80-225342.8 | EPIC204296148 | 10.99 | 8.02 | 10.79 | 6.50 | 0.5314* | 0.4717 | Stauffer et al. (2017) |
| 204185983 | 162552.83-231936.3 | V*V2304Oph | 7.87 | 6.03 | 7.63 | 4.15 | 1.0529 | … | Stauffer et al. (2018) |
| 203897692 | 162556.09-243014.8 | 2MASSJ16255609-2430148 | 9.76 | 9.17 | 9.23 | 5.00 | 0.5011 | 0.6043* | Stauffer et al. (2018) |
| 203354381 | 162627.86-262515.1 | … | 9.85 | 5.66 | 9.77 | 5.03 | 0.5993 | … | Stauffer et al. (2018) |
| 203962559 | 162650.48-241352.2 | 2MASSJ16265048-2413522 | 10.80 | 7.93 | 10.44 | 5.08 | 1.5402 | … | Stauffer et al. (2017) |
| 203821589 | 162759.96-244819.2 | 2MASSJ16275996-2448193 | 9.27 | 8.15 | 8.84 | 4.83 | 0.9105 | 0.6677* | Stauffer et al. (2018) |
| 203956650 | 162832.56-241524.4 | 2MASSJ16283256-2415242 | 9.84 | 10.46 | 8.97 | 3.70 | 0.6752* | 1.5052 | new here |
| 203927435 | 162843.04-242252.3 | 2MASSJ16284304-2422522 | 10.14 | 8.34 | 9.68 | 4.74 | 0.4820* | 0.4162 | Stauffer et al. (2017) |
| 203050730 | 163105.78-272546.4 | 2MASSJ16310579-2725460 | 10.53 | 5.62 | 10.49 | 5.34 | 0.4865* | 0.7740 | Stauffer et al. (2017) |
| 203185083 | 163435.13-265803.2 | 2MASSJ16343514-2658030 | 10.48 | 6.26 | 10.41 | 5.75 | 0.4401 | … | Stauffer et al. (2017) |
| 202687442 | 163458.64-284410.4 | … | 11.59 | 5.80 | 11.50 | 5.10 | 0.5727 | … | new here |
| 204884822 | 163506.25-202528.5 | 2MASSJ16350625-2025282 | 9.55 | 5.72 | 9.46 | 5.07 | 0.7983 | … | new here |
Appendix E LC and Periodogram Categories
In paper II and IV, we classified the LC and periodogram shapes; we use these same categorizations here. Briefly, the classes we presented are summarized here (see papers II or IV for examples):
-
•
Single period – only one period we believe to be real in the LC; interpreted as arising from spots/spot groups rotating into and out of view.
-
•
Multi-period – more than one period we believe to be real in the LC; interpretation varies (see other classifications).
-
•
Double dip – two peaks appear in the periodogram, but only one period is real, with the phased LC having two dips or humps (with different shapes) per cycle; interpreted as arising from two spots/spot groups rotating into and out of view.
-
•
Moving double dip – the phased LC has two dips or humps per cycle, but a minimum or maximum of one dip/hump moves with respect to the other; interpreted as arising from surface differential rotation, where one spot/spot group is moving with respect to another spot/spot group, or spot/spot group evolution.
-
•
Shape changer – the shape of the LC changes over time; interpreted as arising from spot/spot group evolution and/or surface differential rotation.
-
•
Beaters – the reduced LC (final fluxes, just prior to period searching) has signatures of two periods beating (e.g., changing envelope over the campaign); interpreted as arising from spot/spot group evolution and/or surface differential rotation, but could also be nearly synchronized binaries, with one spot per star.
-
•
Complex peak – the peak in the periodogram is wider than expected for that period, or it has multiple maxima within the main peak; interpreted as arising from spot/spot group evolution and/or surface differential rotation, but could also be nearly synchronized binaries, with one spot per star.
-
•
Resolved, close peaks – two distinct peaks in the periodogram, close together; interpreted as arising from binarity (one spot per star) or from surface differential rotation with spots/spot groups at different latitudes. (Note that resolved close peaks in M stars are more likely to be binaries, and resolved close peaks in earlier type stars are more likely to be surface differential rotataion.)
-
•
Resolved, distant peaks – two distinct peaks in the periodogram, far apart; interpreted as arising from binarity (one spot per star).
-
•
Scallops and flux dips – narrow flux dips, unusual but repeatable shapes in their phased LCs, some of which change shape slightly after a flare; interpreted as arising from orbiting clouds of material and/or dusty debris near the Keplerian co-rotation radius (see Stauffer et al. 2017, 2018).
-
•
Pulsator – multiple peaks in the periodogram at very short periods; interpreted as due to pulsation.