Are Donation Badges Appealing? A Case Study of Developer Responses to Eclipse Bug Reports
Abstract
Eclipse, an open source software project, acknowledges its donors by presenting donation badges in its issue tracking system Bugzilla. However, the rewarding effect of this strategy is currently unknown. We applied a framework of causal inference to investigate relative promptness of developer response to bug reports with donation badges compared with bug reports without the badges, and estimated that donation badges decreases developer response time by a median time of about two hours. The appearance of donation badges is appealing for both donors and organizers because of its practical, rewarding and yet inexpensive effect.
I Introduction
Donations play an important role in open source software (OSS) projects. LibreOffice, an OSS project, reported in 2016 that they had received 200,000 donations in three years, and emphasized that a large open source software project does not need a single large corporate sponsor, so long as it can rely on a large and diverse ecosystem of OSS community [1]. This makes the management of effective donation programs all the more important to maintain sustainable OSS projects.
Despite the criticality of donations in OSS, very few studies have been undertaken on monetary donations to OSS projects, paying much less attention on their effect. The factors that impact donations were investigated with public records of SourceForge, with a result that a decision to donate was influenced by relational commitment with the OSS platform [2]. Another study identified the composition of the donor groups and the committer group, although small in number, committers donated more than other of the groups [3].
Eclipse started its donation program Friends of Eclipse in December 2007. Showing badges started in November 2014 on the Bugzilla issue tracking system [4]. Currently, donors who contribute 35 USD or more qualify for the Friend of Eclipse status for one year, and are recognized on Bugzilla issue tracking system of a friend of Eclipse badge (hereafter called donation badges).
However, little is known about the impacts of donation badges. In particular, how badges might benefit the donors. Based on the framework for causal inference [5], we study how promptly developers respond to bug reports that have donation badges compared with bug reports without donation badges. The analysis revealed that the donation badges decreased response time by about two hours in median. Our findings suggest that the appearance of donation badges has a practical rewarding effect for individual donors. We theorize that this behavior can be explained as an effective and inexpensive signaling system, where developers use technical and social information as signals to evaluate potential contributions [6]. We believe that other OSS organizers are able to adopt this strategy to manage their developer ecosystems.
II Causal Inference in Brief
Causal inference stems from social science that explores cause and effects as its main concern [7]. In Econometrics differences-in-differences methods are one of key analytical elements for causal inference [7]. We adopted this element in our analysis, as outlined the figure below. Differences in differences (DID) statistically visualizes actual and counterfactual scenarios, thereby enabling a causality analysis. For the inquiry of the effects of a treatment in statistics, one cannot see both results with and without a treatment based on one individual only. DID addresses this problem by comparing two groups, one with a treatment and one without it.
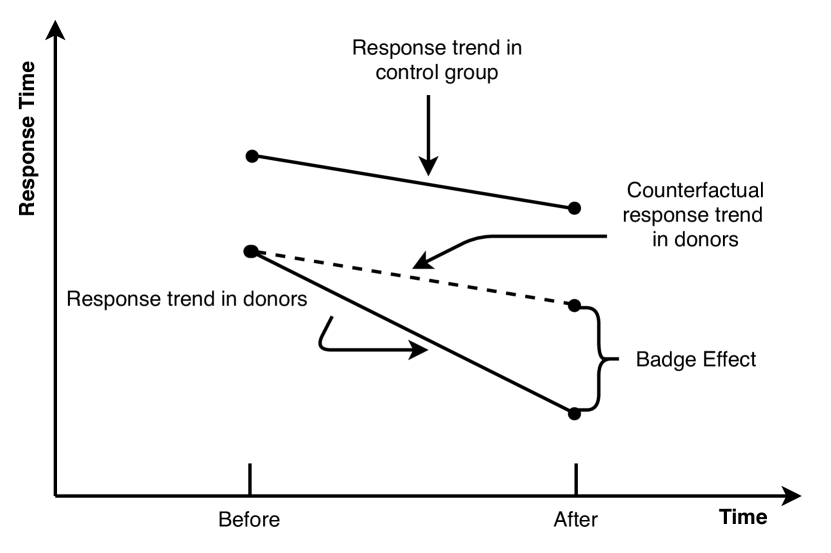
Figure 1 shows how DID is used to understand the effect of donation badges. We illustrate the response times of two groups at the period of before and after the donation badge program was introduced. Donors refer to all contributors that received badges. As shown in the figure, the counterfactual response trend (i.e., dotted line) is coefficient to the response trend in the control group. Using that counterfactual response trend and response trend in donors (i.e., positive and negative coefficient values), we infer the effect of donation badges. For instance, a negative coefficient value indicates a faster response time while a slower response time is indicated by a positive coefficient value.
To improve our results, the DID is extended to quantile differences in differences (QDID), to describe better the relationships at median and other quantiles (only median is studied in this paper because of the space limitation). Although half of the reports got responses in one day, the average time is almost two months because of some outliers (i.e., the max value is more than four years).
Since DID depends on the common trends assumption [7], selecting a proper control group is necessary. Matching is a statistical technique, for every member of donors, to find a control member with similar observable characteristics, and is used to reduce selection bias by equating groups. We use propensity score matching as it is a popular matching technique.
III Approach
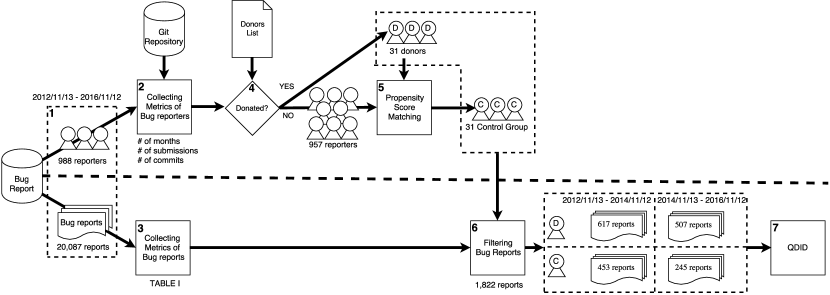
Our analysis is composed of two phases as shown in Figure 2. First, we select two groups of reporters, that is, a donors and a control group whose members have not donated (upper side), then two groups of bug reports in two time periods are identified, which are submitted by reporters in the above two reporter groups (lower side). We designed the analysis with the two phases instead of simply preparing two groups of bug reports (with and without donor badges) because the latter can cause a bias in selecting bug reports from specific reporters.
Step 1: Bug report collection. From the discussion of proposing donation badges [4], we speculate that November 13, 2014 can be identified as the date of initially implementing donation badges. So we first identify reporters who had submitted at least once in both periods, that is, two years earlier and later than the donation badge implementation. We then collected bug reports submitted by the above reporters in a period between the date two years earlier and two years later than the implementation. Then, we removed bug reports whose first response comments were made by the same reporters or bug reports that were assigned to the original reporters. Bug reports whose first responses had not come in three days were removed. This is to exclude forgotten or intentionally postponed (weeks to years for the first responses) bug reports. Furthermore, we analyze the impact at the hourly unit, by focusing on relatively promptly responded reports. Consequently, we are left with of reports after the removal.
Step 2: Bug reporter metrics. Metrics of bug reporters are used in the propensity score matching (step 5). The number of months worked in Bugzilla, the number of bug report submissions in the periods of before and after implementation, and the number of commits worked in Git repositories, are measured for all reporters.
| Metric | Description | Coeffs (Errors) | t value | Pr (>|t|) |
|---|---|---|---|---|
| (Intercept) | 2.237 (1.120) | 1.998 | 0.046 | |
| Donor | Reporter is a donor or not | 2.259 (0.834) | 2.708 | 0.007 |
| Period | Submitted time is before or after the badge introduction | -1.598 (1.227) | -1.302 | 0.193 |
| Badge | It has a donation badge or not | -2.219 (1.061) | -2.092 | 0.037 |
| Enhancement | Severity is enhancement or not | 0.668 (0.815) | 0.820 | 0.412 |
| Windows | Issue is related to Windows or not | 1.119 (0.692) | 1.617 | 0.106 |
| Linux | Issue is related to Linux or not | 0.675 (0.949) | 0.711 | 0.477 |
| MacOS | Issue is related to MacOS or not | 0.793 (0.907) | 0.875 | 0.382 |
| Component | Response days in median for the belonging components | 0.317 (0.198) | 1.603 | 0.109 |
| Community | # of contributors in the belonging components | 0.000 (0.001) | 0.105 | 0.917 |
| Time | A numerical order of time in months | 0.152 (0.117) | 1.303 | 0.193 |
| Relationship | # of reports in which the reporter and the first responder have worked together | 0.005 (0.005) | 0.894 | 0.371 |
| AIC = 4025, Pseudo = 0.011 | ||||
Step 3: Bug report metrics. Metrics of bug reports (shown in Table I) are used in QDID (step 7). In addition to essential variables for DID (donor, period, and badge), possible factors, which affect developer response time (in hours), were explored. Several categorical variables were considered: severity metrics of seven severity levels (trivial to blocker and enhancement) and metrics related to operating systems. It is reported that bugs with higher severity were fixed faster [8], and operating systems where bugs were found were reported to influence bug fixing time [9]. Component metric measures the median of response time in component. We found in our pilot study, that developer response times vary with different components. Community metric represents the size of contributors in community of the component. Time metric is a numerical order of time in months, which was used in [10]. We prepared this metric to consider the impact of time. Relationship metric mean to consider social and personal relationships between reporters and responders. Ortu et al. found that emotional comments could influence fixing time [11]. However, we did not add emotional factors because it is reported that existing sentiment analysis tools are not always applicable to software engineering domains [12]. From the above metrics, we select a subset of metrics based on the Akaike information criterion (AIC). Table I shows such subset that derived the minimum AIC value. For a response variable, response time was also measured as a hour interval between the moment a bug is reported and when it gets its first response comment.
Step 4: Classifying donors or not. Names, the date of donations, and the amount of donations are summarized in a donor list. From the above information, we can identify the periods of donation badge appearance in bug reports for each donor. When duplicate names but different email addresses appear in bug reports, we removed them because we could not associate reporters and donor names uniquely. Consequently, 31 donors were identified.
Step 5: Propensity Score Matching. We used the well-known nearest neighbor matching algorithm in propensity score matching. From 957 reporters who had not donated, 31 reporters matched with the 31 donors are identified as a control group.
Step 6: Filtering Bug Reports. Bug reports submitted by 31 donors or 31 members in a control group are used in QDID. As shown in Figure 2, those bug reports are labeled with two time periods and two groups.
Step 7: Quantile Difference in Differences. Using the collected bug report metrics shown in Table I, QDID is performed. We report its results of 5th decile.
IV Results and Discussion
Table I shows coefficient values with p-values at 5th decile (median). Only the Badge metric has a statistically significant positive effect (i.e., negative coefficient) on developer response time. Its coefficient value indicating the estimated donation badge effect is about minus two hours. Note that the effect size is relatively small (Pseudo ). Since donation badges have been introduced only a few years ago, further analysis with longer histories is important.
From the results, readers can infer three findings from Table I. (1) the response time is faster after contributors gained a donation badge. This is evident by the negative coefficient of the Badge metrics as shown in the table. Furthermore, (2) badges did not have negative effects: all responses to both donors and contributors became faster after badges were introduced. This is evident by the negative coefficient of the Period metrics. Finally, (3) the control group is not unfairly selected: donors had longer response times compared to the control group. This is evident by the positive coefficient of the Donor metrics.
Why do donation badges cause faster response times? We assume that a donation badge works as a signal, which is a perceivable indicator of hidden technical and social qualities [6]. In detail, donors are likely to contribute long-term instead of being one-time contributions, Furthermore, they are more receptive and willing to help communities. Thus, responders may infer and react to these qualities.
Considering the median of developer response time in 1,822 studied bug reports is 3.5 hours, decreasing time by two hours is not trivial. This could be a practical rewarding effect for individual donors. For the organizers managing a developer ecosystem, donation badges has appeal because of the potential benefits at an inexpensive cost. Since there is no project-specific metric nor assumption, we believe that our findings are not only limited to the current Eclipse project.
V Conclusion
Applying a framework of causal inference from Econometrics, we investigated the causal effect of donation badges on Bugzilla, one of benefits for donors. We estimated that donation badges decrease developer response time for bug reports by about two hours in median. Our findings show the appearance of donation badges is appealing for both contributors and organizers. Other OSS organizers are able to adopt this strategy to manage their developer ecosystems.
References
- [1] I. Vignoli. (2016) 200,000 thanks. [Online]. Available: https://blog.documentfoundation.org/blog/2016/02/25/200000-thanks/
- [2] S. Krishnamurthy and A. K. Tripathi, “Monetary donations to an open source software platform,” Research Policy, vol. 38, no. 2, pp. 404–414, 2009.
- [3] K. Nakasai, H. Hata, S. Onoue, and K. Matsumoto, “Analysis of donations in the eclipse project,” in Proc. of the 8th International Workshop on Empirical Software Engineering in Practice, ser. IWESEP ’17. 2017, pp. 18–22.
- [4] Bug434249. (2014) Add decorator for friends of eclipse. [Online]. Available: https://bugs.eclipse.org/bugs/show_bug.cgi?id=434249
- [5] G. W. Imbens and D. B. Rubin, Causal Inference for Statistics, Social, and Biomedical Sciences: An Introduction. Cambridge University Press, 2015.
- [6] J. Tsay, L. Dabbish, and J. Herbsleb, “Influence of social and technical factors for evaluating contribution in github,” in Proc. of the 36th International Conference on Software Engineering, 2014, pp. 356–366.
- [7] J. D. Angrist and J.-S. Pischke, Mostly harmless econometrics: An empiricist’s companion. Princeton university press, 2008.
- [8] H. Zhang, L. Gong, and S. Versteeg, “Predicting bug-fixing time: An empirical study of commercial software projects,” in Proc. of the 35th International Conference on Software Engineering, 2013, pp. 1042–1051.
- [9] F. Zhang, F. Khomh, Y. Zou, and A. E. Hassan, “An empirical study on factors impacting bug fixing time,” in Proc. of the 19th Working Conference on Reverse Engineering, 2012, pp. 225–234.
- [10] Y. Zhao, A. Serebrenik, Y. Zhou, V. Filkov, and B. Vasilescu, “The impact of continuous integration on other software development practices: A large-scale empirical study,” in Proc. of the 32nd IEEE/ACM International Conference on Automated Software Engineering, 2017, pp. 60–71.
- [11] M. Ortu, B. Adams, G. Destefanis, P. Tourani, M. Marchesi, and R. Tonelli, “Are bullies more productive?: Empirical study of affectiveness vs. issue fixing time,” in Proc. of the 12th Working Conference on Mining Software Repositories, 2015, pp. 303–313.
- [12] R. Jongeling, P. Sarkar, S. Datta, and A. Serebrenik, “On negative results when using sentiment analysis tools for software engineering research,” Empirical Softw. Engg., vol. 22, no. 5, pp. 2543–2584, Oct. 2017.