ACTIVE GALACTIC NUCLEUS FEEDBACK IN AN ELLIPTICAL GALAXY WITH THE MOST UPDATED AGN PHYSICS (II): HIGH-ANGULAR MOMENTUM CASE
Abstract
This is the second paper of our series of works of studying the effects of active galactic nuclei (AGN) feedback on the cosmological evolution of an isolated elliptical galaxy by performing two-dimensional high-resolution hydrodynamical numerical simulations. In these simulations, the inner boundary is chosen so that the Bondi radius is resolved. Physical processes like star formation, SNe Ia and II are taken into account. Compared to previous works, the main improvements is that we adopt the most updated AGN physics, which is described in detail in the first paper of this series (Yuan et al., 2018, Paper I). These improvements include the discrimination of the two accretion modes of the central AGN and the most updated descriptions of the wind and radiation in the two modes. In Paper I, we consider the case that the specific angular momentum of the gas in the galaxy is very low. In this paper, we consider the case that the specific angular momentum of the gas is high. In the galactic scale, we adopt the gravitational torques raised due to non-axisymmetric structure in the galaxy as the mechanism of the transfer of angular momentum of gas, as proposed in some recent works. Since our simulations are axisymmetric, we make use of a parameterized prescription to mimic this mechanism. Same as Paper I, we investigate the AGN light curve, typical AGN lifetime, growth of the black hole mass, AGN duty-cycle, star formation, and the X-ray surface brightness of the galaxy. Special attention is paid to the effects of specific angular momentum of the galaxy on these properties. We find that some results are qualitatively similar to those shown in Paper I, while some results such as star formation and black hole growth do show a significant difference due to the mass concentration in the galactic disk as a consequence of galactic rotation.
1 Introduction
It is now believed that most massive galaxies harbor supermassive black holes in their central regions, and these black holes play a crucial role in the evolution of their host galaxies. The underlying mechanism is known as active galactic nuclei (AGN) feedback, which implies that the changes of the density and temperature of ISM in the galaxy due to the radiation and outflow from the AGN and subsequently the changes of star formation and black hole fueling (Fabian, 2012; Kormendy & Ho, 2013, and references therein).
To evaluate the effects of AGN feedback on galaxy evolution by numerical simulations, ideally we should simulate from the central black hole to the whole galaxy, from the BH Schwarzschild radius of to the galaxy scale of . However, the ratio of the size scale of the black hole and the host galaxy is more than ten orders of magnitudes, thus it is not feasible to cover such a large dynamical range even with a state-of-art supercomputer. Therefore, different works in the literature focus on different spatial scales. Most of the works focus on the scale much larger than the black hole accretion flow. In this case, the AGN is difficult to resolve and a so-called “sub-grid” model to describe the AGN physics has been developed and widely used in many simulation works.
It is obvious that in this case, it is crucial to have the correct description of the output from the central AGN. Then the first important parameter is the mass accretion rate of the AGN. Many works focus on very large scales so that it is difficult to resolve the Bondi radius and calculate the accretion rate directly. In this cases, the accretion rates have to be estimated in some way thus the value can be underestimated or overestimated significantly (e.g., see Negri & Volonteri 2017 and references therein, see also Korol et al. 2016; Ciotti & Pellegrini 2017) Some other works, which focus on relatively smaller scales, overcome this problem by resolving the Bondi radius (Ciotti & Ostriker, 1997, 2001, 2007; Ciotti et al., 2009b; Shin et al., 2010; Ostriker et al., 2010; Novak et al., 2011, 2012; Gan et al., 2014; Ciotti et al., 2017). In these works, the inner boundary is set to be a few pc, which is smaller than the Bondi radius, so we can directly calculate (rather than estimate) the mass accretion rate at the inner boundary. The outer boundary is large enough to reach kpc, allowing the study of the evolution of the whole galaxy and even the circum-galactic medium (CGM).
Once the mass accretion rate is reliably calculated, the output of the AGN, namely the radiation and wind (jet is neglected in our work), is determined by the accretion physics adopted (e.g., see the review of accretion theory by Yuan & Narayan 2014). Most recently, by taking into account the recent developments of the theory of black hole accretion, Yuan et al. (2018, hereafter Paper I) have presented the most updated descriptions of the AGN outputs. In this work, the authors have investigated the AGN feedback effects in an isolated elliptical galaxy by performing two dimensional hydrodynamical numerical simulations. The inner boundary of the simulation is chosen so that the Bondi radius is resolved and the accretion rate is precisely determined. They discriminate between the cold and hot accretion modes according to the value of the accretion rate, and present proper descriptions of wind and radiation emitted from the accretion flow in the two modes. Their numerical results indicate that these updates of the AGN physics are crucial for determining the effects of AGN feedback. The updated AGN physics is described in detail in Paper I and will be briefly reviewed it in § 3 of the present paper.
In Paper I, the specific angular momentum of the gas in the galaxy is assumed to be very small. Although elliptical galaxies are primarily pressure-supported rather than rotation-supported, the angular momentum of the gas in many galaxies is likely not small. Recent kinematic surveys have revealed that 80% of early-type galaxies (ETGs) belong to regular rotators, characterized by oblate axisymmetric shapes that reflect underlying disk-like components (Krajnović et al., 2011, 2013; Emsellem et al., 2011). Even in the slowly rotating ETGs, a mid-plane HI disk, indicative of the presence of a stellar disk, is frequently detected (Serra et al., 2014).
The goal of this work is to extend Paper I by considering the case of higher angular momentum. In this case, the new physics required to include in the study compared to Paper I is the physical mechanism of angular momentum transport. As we will describe later, it seems as if different mechanisms play their respective roles on different scales. On the galactic scale, one of the most promising mechanism is the gravitational torque raised by the non-axisymmetric structure of stars in the galaxy, proposed in Hopkins & Quataert (2010, 2011). Since our simulation is two dimensional, it is impossible to include such a mechanism from first principles. Instead we adopt a phenomenological approach by using the -description, similar to the case of black hole accretion disk (Shakura & Sunyaev, 1973). This -description was devised with a physically motivated, dimensionless scaling of the kinematic viscosity such that the strength of the angular momentum transport process would be represented in dimensionless fashion by . The detailed implement in our work is presented in § 4.1.
In the present work, we ignore AGN activity triggered by an external mechanism, such as galactic mergers. Although the mergers may be effective in triggering AGN activity (Mihos & Hernquist, 1996; Di Matteo et al., 2005), there are reasons that the assumption of an isolated galaxy is worth considering. First, the observations indicate that BH growth in massive galaxies is likely driven by internal secular processes rather than by significant mergers, at least since redshift (Schawinski et al., 2011; Kocevski et al., 2012; Fan et al., 2014). Secondly, even in the absence of merging, the total amount of gas injected from the pure stellar evolution is large enough to produce a BH two orders of magnitudes more massive than what is observed (Ciotti & Ostriker, 2012). In the future, we will examine the effect of the galactic merging on the evolution of the central black hole and its host galaxy. It is speculated that the gas contents may be enhanced, which then possibly induce both star formation and AGN activity especially in early evolution time.
As the second paper of a series of project, in this work we extend the work of Paper I to the case of an elliptical galaxy which is partly rotation-supported rather than fully pressure-supported. The paper is organized as follows. In § 2, we describe the detailed model of the galaxy. In § 3, we briefly review the updated AGN physics that we adopt in the simulation. In § 4, we present the numerical setup and treatment of angular momentum transport. In § 5, we describe the simulation results, including the AGN light curve, growth of black hole mass, star formation, and X-ray emission of the galaxy. Summary and conclusion are presented in § 6.
| model | k | Mechanical | Radiative | |
|---|---|---|---|---|
| Feedback | Feedback | |||
| k001 | 0 | 0.1 | o | o |
| k01 | 0.1 | 0.1 | o | o |
| k03 | 0.3 | 0.1 | o | o |
| k052 | 0.5 | 0.1 | o | o |
| k07 | 0.7 | 0.1 | o | o |
| k09 | 0.9 | 0.1 | o | o |
| k05noFB | 0.5 | 0.1 | x | x |
| k05windFB | 0.5 | 0.1 | o | x |
| k05radFB | 0.5 | 0.1 | x | o |
| k05alp-2 | 0.5 | 0.01 | o | o |
2 Galaxy Models
In this section, we briefly introduce the key features of the galaxy models, with respect to the stellar population and evolution, the dynamical structure, and the galactic rotation. To isolate the problem, we set the many aspects of the simulations to be same as that in Gan et al. (2014, see also for more detailed description), except for the treatment of galactic rotation (see §2.2).
2.1 Stellar Evolution
In elliptical galaxies, the gas is supplied by evolved stars predominantly in the phases of the red giant, asymptotic giant branch, and planetary nebula. The total mass of gas injected from the pure passive stellar evolution is two orders of magnitudes larger than the BH mass observed in elliptical galaxies (Ciotti & Ostriker, 2012). In our simulation, the gas density is initially set to be low so that the gas is mainly supplied from stellar evolution, i.e. “secular evolution”.
Following the description in Pellegrini (2012), the total mass loss rate of a stellar population is computed by
| (1) |
where is the mass loss rate for an evolved star, which is approximated as the single burst stellar population synthesis model (Maraston, 2005),
| (2) |
where is the galactic stellar mass in solar mass unit at an age of 12 Gyrs, is the age in units of 12 Gyrs. For all models, we set the galactic stellar mass to and the coefficient is set to be 3.3, which is indicative of Kroupa initial mass function. The recycled rate of gas from SNIa is , where is the evolution of the explosion rate with time. The approximate mass loss rate, eq. (1), is reliable for solar metal abundance.
2.2 Galactic structure
The galaxy models are built following the procedure described elsewhere (Ciotti et al., 2009a), and refer to an isolated elliptical galaxy placed on the Fundamental Plane with a projected stellar velocity dispersion, considering spherically symmetric dark matter halo and stellar profile. The stellar density profile is described by the Jaffe profile (Jaffe, 1983),
| (3) |
where and are the total stellar mass and the scale length of the galaxy, respectively. In this paper, we set the total stellar mass to and the scale length to kpc, which corresponds to the projected half-mass radius (i.e., effective radius) of kpc. The dark halo profile is set by the total density profile scaling as at large radii, which is consistent with observed profiles (Czoske et al., 2008; Dye et al., 2008; Auger et al., 2010; Sonnenfeld et al., 2013).
We adopt the central velocity dispersion of . For the minimum halo model, the systematic rotational velocity, of the galaxy is computed as
| (4) |
In this model, the gas flows under the total gravitational potential of
| (5) |
As discussed in § 2.1, most of gas is supplied by stellar evolution. Therefore, the angular momentum of the gas, which is ejected through the stellar wind (i.e., mass losses from asymptotic giant branch stars), is initially set by the rotating motion of stellar components. We introduce the rotation factor, , to set the degree of the stellar rotation, which is described as,
| (6) |
where the isotropic 1-dimensional stellar velocity dispersion without the contribution of the central black hole,
| (7) |
where . We perform the subsets of simulations with 0.1, 0.3, 0.5, 0.7, 0.9 (see Table 1), and thus the supplied gas from the stellar evolution rotates with sub-Keplerian velocity. However, as it falls into the mid-plane disk, the angular momentum of the infalling gas reaches the Keplerian value (see Figure 8).
From the perspective of energetics, the thermalization of the stellar mass losses due to the stellar velocity dispersion should be taken into account (Parriott & Bregman, 2008). The amount of the thermalization heating decreases as the stellar rotation velocity increases since the ordered motion becomes dominant, compared to the random motion of the stars. The detailed description of the thermalization is discussed in § 4.1.
A central black hole also contributes to the gravitational potential, with its dominance limited to the central region. The initial BH mass is chosen by the empirical correlation between the black hole mass and the bulge mass in (Kormendy & Ho, 2013), which is
| (8) |
Given our fiducial galactic stellar mass, the initial black hole mass is set to for all models.111We note here that there is some uncertainty in this value and eq. (12) of Kormendy & Ho (2013): for our chosen value of , the corresponding black hole mass is .
Various shapes and internal kinematics of galaxy models were taken into account in the previous study of X-ray haloes in ETGs (Negri et al., 2014). In that work, they adopted axisymmetric galaxy models, for which the galaxies are flattened by either non-isotropic stellar velocity dispersion or rotation. However, they ignored the effects of AGN feedback, which likely plays a significant role in producing X-ray radiation in the central region (see Paper I, ). As a following work, Ciotti et al. (2017) applied this axisymmetric galaxy model to the numerical study of AGN feedback. In that work, the flattening was set to occur by the non-isotropic stellar velocity dispersion without consideration of the galactic rotation. Although our galaxy model is spherically symmetric to isolate the problem with Paper I, in the present work, we consider both galactic rotation and AGN feedback to understand their respective roles in the evolution of the black hole and its host galaxy. In the following study, the axisymmetric galaxy models will be also taken into account.
2.3 Angular momentum transport
The inflow of gas into the galactic center is essential to manipulate active star formation and switch on the AGN activity. The triggers of such inflows are diverse and the dominant one depends on the scale: on a galactic scale, tidal torques driven by major mergers or cosmological infall lead to rapid gas inflow into the central kpc (Hernquist, 1989; Barnes & Hernquist, 1991, 1996). Minor mergers and/or disk instabilities, which cause bar and spiral structures, may also produce similar gravitational torques (Hernquist & Mihos, 1995; Bournaud et al., 2005; Younger et al., 2008). Once gas reaches sub-kpc scales, it cools rapidly, which can cause a non-axisymmetric gravitational instability and torque, and thus a large fraction of the gas can flow toward the central region at 0.01 pc (Bertin & Lodato, 2001; Lodato & Rice, 2004; Hopkins & Quataert, 2010, 2011). Near the central BH, it is believed that MHD turbulence, produced by magnetorotational instability, is responsible for the angular momentum transport (Balbus & Hawley, 1991, 1998).
In our simulation, we consider the secular evolution of elliptical galaxies without merger events. As we will discuss, for most of our simulation, as the gas cools down, it forms a mid-plane disk at the scale of kpc, within which the gravitational torques by non-secondary instabilities are favored to be the dominant mechanism for the angular momentum transport (Hopkins & Quataert, 2010, 2011). However, since we perform the simulations in two dimensions without considering self-gravity of the gas, we technically cannot include the non-axisymmetric torque. As an alternative approach, we make use of stress tensor, , with the viscosity -prescription (Shakura & Sunyaev, 1973) to mimic the gravitational disturbances exerting on the gas. (see § 4.1 for the detailed description). While the proper value is largely uncertain, we set it to the fiducial value of for most runs. For this value of , in our fiducial model, k05, the gas inflows at 100s pc of disk is . This value is roughly consistent with the median value of the inflow rate obtained in Hopkins & Quataert (2011), although the latter has larger scatter.
Hopkins & Quataert (2010) showed that a gas-rich galaxy merger can induce the gas inflow rate up to at 300 pc. Compared to the case of gas-rich galaxy merger, it is not surprising that gas inflow rate in our results is small because we focus on the “secular” evolution of galaxy, which is gas-poor initially. Even for the model without galactic rotation, the model k00, the large-scale inflow is a few , which is larger than in the model k05, but is still smaller than in the case of gas-rich merger, mainly due to the dearth of initial gas in our galactic model. However, as we will discuss, in the present work, the gas inflow rate is large enough to trigger a luminous AGN.
3 Physical model of AGN Feedback
We adopt the most updated “sub-grid” AGN physics presented in Paper I. For completeness, we briefly review it as follows.
The first important thing to note is that depending on the value of accretion rate, black hole accretion is divided into two modes. When the accretion rate is relatively high, it belongs to the cold accretion mode. The most luminous AGN, such as quasars, are in this mode. When the accretion rate is lower, it shifts to the hot accretion mode, in which AGNs spend most of their time. The two modes are bounded by a critical luminosity,
| (9) |
The cold and hot accretion modes are described by the standard thin disk (Shakura & Sunyaev, 1973) and the hot accretion flows, respectively (Yuan & Narayan, 2014). These are two completely different accretion modes in the sense of the dynamics and radiation of the accretion flows. For the cold mode, many mechanisms seem to play a role in producing wind, such as thermal, magnetic, and radiation (line-force) (see Proga, 2003), and theoretically the wind production is still a partially solved problem. Therefore, we adopt the observational results of Gofford et al. (2015) to describe the wind properties. The mass, momentum and energy fluxes of the winds are described by,
| (10) |
| (11) |
| (12) |
where is the bolometric luminosity of the AGN. The velocity of wind is described by,
| (13) |
and we set the maximum wind velocity of .
The radiation from the thin disk is well known, and is approximated as,
| (14) |
where is the BH accretion rate, is the speed of light, and is the radiative efficiency. Here we assume the value of the efficiency in cold mode is 0.1, implying that the BH is moderately spinning. This value also agrees with the empirical studies of Yu & Tremaine (2002) and Soltan (1982). In addition to luminosity, another important parameter to describe the radiative heating to the ISM of the host galaxy by Compton scattering is the Compton temperature of the radiation. In the cold mode, its value is (Sazonov et al., 2004).
The black hole mass accretion rate in the cold mode is calculated by
| (15) |
where is the mass inflow rate in the accretion disk around the black hole with the instantaneous viscous timescale, yr (see Paper I, for more detailed description).
In the hot accretion mode, the geometry of the accretion flow is usually an inner hot accretion flow plus an outer truncated thin disk (Yuan & Narayan, 2014). The truncation radius is described by,
| (16) |
where is the Schwarzschild radius, which is . In contrast to the case of the cold accretion mode, wind production in the hot mode is theoretically well studied (e.g., Yuan et al., 2012, 2015; Bu et al., 2016) but the observational constraints are much worse due to the lack of observational data. Using the trajectory approach, Yuan et al. (2015) have carefully calculated the fluxes of mass, momentum, and energy of wind based on the GRMHD simulation of black hole accretion:
| (17) |
| (18) |
| (19) |
where is the Bondi radius and the wind velocity is approximated as
| (20) |
where is the Keplerian velocity.
The black hole accretion rate in the hot mode is computed by
| (21) |
Since hot accretion flows are optically thin, the radiation output from hot accretion flows is much more complicated than that from the cold mode (Yuan & Narayan, 2014). In this case, the radiative efficiency is no longer a constant. The radiative efficiency as a function of accretion rate is studied in Xie & Yuan (2012), which gives the following fitting formula
| (22) |
where the value of and are given in Xie & Yuan (2012). Here we summarize the set of () that is adopted for the current work.
| (27) |
The Compton temperature is higher than that of the cold mode, due to the difference of the emitted spectrum between cold and hot modes. Its value is K and K for the range of and , respectively (Xie et al., 2017).
4 Numerical Setup
We perform two-dimensional hydrodynamic simulations with ZEUS-MP2 (Hayes et al., 2006) in spherical coordinates (r,). The grid resolution is 120x30. The grid bin size in the radial direction increases logarithmically and the range covers 2.5 pc 250 kpc. A simulation with such a large dynamical range is computationally expensive, hence we choose the two-dimensional simulation assuming the axisymmetry. However, this approximation has a difficulty in resolving instabilities and non-axisymmetric features such as spiral structures. In following work, we will extend this work to three-dimensions. We note that the Bondi radius is determined by the physical properties at the galactic center: (Bondi, 1952), where is the sound speed of the gas at the inner boundary. The Bondi radius varies during simulations, and for most of time it is well resolved, which enables us to estimate the proper BH accretion rate.
Galaxy mergers may be responsible for inducing star formation in the central region, and fueling the BH and thus providing the power source to the quasar state at early cosmic times (e.g. Mihos & Hernquist, 1996; Di Matteo et al., 2005; Cortijo-Ferrero et al., 2017). The rapid growth of the BH and the formation of elliptical galaxies possibly via merging process is beyond the scope of the current paper. However, observations indicates that the hosts of AGNs are likely to evolve secularly rather than being involved in an ongoing merger since z2 (Schawinski et al., 2011; Kocevski et al., 2012; Fan et al., 2014). We assume that in the simulation, the galaxy is well-established initially and evolves secularly. The simulations begin at a galaxy age of 2 Gyr, which corresponds to the redshift , and for the comprehensive study, the evolution time spans 14 Gyr.
4.1 Hydrodynamics
The evolution of the galactic gas flow is computed by integrating the time-dependent Eulerian equations for mass, momentum, energy conservations:
| (28) |
| (29) |
| (30) |
where and are the gas mass, momentum and internal energy per unit volume, respectively. The gas pressure is , where the specific heats is . Here is the mass source from the stellar evolution, and is the recycled gas from supernovae (SNe) II. We let the source term evolve passively with Salpeter initial mass function (Salpeter, 1955). and are feedback from SNe I and SNe II, respectively: , where the kinetic energy of a single SNIa is and the thermalization efficiency , of which we adopt the value as a plausible one for low density and hot medium we adopt the value of 0.85 (see Mathews, 1989; Tang & Wang, 2005). When gas turns into stars, we eliminate the corresponding mass, momentum, and energy () to conserve quantities, but also add new mass and energy from SNII explosions (). Under the assumption of Salpeter initial mass function, the mass and the energy returned in SNII events for each star formation episode is 20% of the newly born star and their ejection timescale is years. All parameters in the description of the stellar feedback are same for every models (see Negri et al. 2015, Ciotti et al. 2017 for more detailed description of stellar feedback).
In the energetics of the gas flows, the thermalization of the stellar mass loss, interacting with the pre-existing hot ISM due to the stellar velocity dispersion, is important. Since in our galactic model, the stars have a certain degree of the ordered motion, the thermalization heating, , is computed by the trace of the velocity dispersion, which is expressed as,
| (31) | |||||
in which the reduction factor takes into account the effect of ordered rotation.
In eq. (29), we assume that the divergence of the tensor is strongest at the azimuthal components, which can be approximated as
| (32) |
where, in spherical coordinates, the stress components are
| (33) |
| (34) |
Here is the coefficient of shear viscosity, where is the kinematic viscosity coefficient,
| (35) |
where is the sound speed, is the Keplerian angular velocity, and is the viscosity parameter formulated by Shakura & Sunyaev (1973). Note that since in this work, the simulation is performed with axisymmetric two dimensional coordinates, we neglect the derivative terms of directions and approximate the tensors to eqs. (33)&(34). The numerical treatment of angular momentum transport by anomalous tensor is referred to Stone et al. (1999). We adopt the value as a fiducial model, and for the comparison, we also perform a subset of test simulations with an order of magnitude smaller value of (see § 5.2).
5 Results
In this work, we allow for the possibility of high angular momentum of gas, deposited by the rotating stars. The rotation speed of stars is determined by the parameter , which varies from 0 (k00; no-rotation) to 0.9. Similarly with Paper I, we also carry out a subset of simulations to compare the results from one with both radiative feedback and mechanical feedback (k00, k01, k03, k05, k07, k09), and one with purely radiative feedback (k05radFB), and one with purely mechanical feedback (k05windFB), and one without AGN feedback (k05noFB). Note that for the models with no/partial feedback, the rest configurations are same as k05. All these models are listed in Table 1.
5.1 Overview of the Evolution
In Paper I, where the specific angular momentum of the gas in the galaxy is assumed to be very small, the overall evolution of the AGN is as follows. In the early stage, the gas is enriched by stellar mass loss, and when it reaches sufficient density, the ISM undergoes radiative cooling and produces cold shells and filamentary structures. These structures are unstable due to the Rayleigh-Taylor instability, then become disrupted in a short time. The disrupted gas flows inward toward the center and triggers the AGN activity. The strong radiation and winds produced by the AGN heat the medium and expel the gas out of the central region, and thus suppress the black hole accretion. The AGN activity is then reduced. As the ISM is replenished by stellar winds and gradually cools down, the AGN cycle will start over. This is the evolutionary track of the AGN cycle, which was inferred by the numerical results with the slowly rotating (or non-rotating) galaxy models in the previous studies.
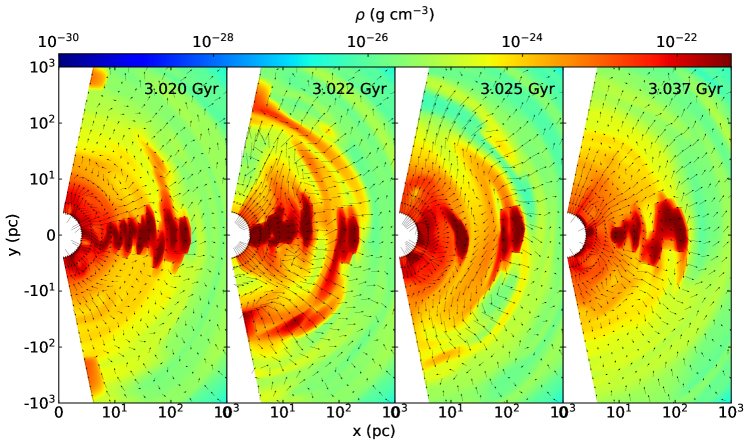
In the present paper, we focus on the case of much higher angular momentum of the gas in the galaxy. While the general evolution picture of AGN activity is qualitatively similar, the details are significantly different. Figure 1 shows the overview of AGN cycle in the rotating galaxy. From the left plot, it shows the density map and gas streams in pre-burst, ongoing-burst, post-burst, and quiescent periods, respectively. While the gas with low angular momentum accretes onto the BH from random directions, the gas with high angular momentum collapses into the mid-plane and flows toward the center along the disk (left-most panel). Since the density of the disk is high, on the path toward the BH, the gas is largely consumed by the active star formation in the disk. The relative predominance between the BH accretion rate and the star formation rate will be discussed in § 5.4.
The gas in the disk likely loses its angular momentum via the various physical mechanisms, invoked by multiple mechanisms such as magnetorotational instability (Stone & Pringle, 2001), thermal instability (Bertin & Lodato, 2001), gravitational instability (Toomre, 1964; Gammie, 2001) and non-axisymmetric gravitational torque (Hopkins & Quataert, 2010, 2011; Anglés-Alcázar et al., 2017). It is believed that no single mechanism is dominant over the range of a few kpc to the BH event horizon, and their relative importance depends on the scale of interest (Dorodnitsyn et al., 2016, references there in). As the gas loses its angular momentum and accretes onto the central BH, the AGN activity is triggered (second panel). Similar to the case of the non-rotating model, the AGN feedback influences the surrounding medium by both the radiation and the mechanical winds. The radiation heats the central region, within which the cold disk is likely photo-ionized and heated. The AGN winds blowing out with a certain inclination angle is capable of generating turbulence, which disturbs the cold disk inside-out (third panel). Recently, Tacchella et al. (2015) found evidence that the star formation in the galactic disk is suppressed from the inside out. Our numerical results indicate that the energy released from the central AGN drives such inside-out star formation features. Finally, stellar mass loss replenishes the galaxy and the gas falls to the mid-plane again (right-most panel), and a new AGN cycle starts over. We note that the key difference of the AGN cycle between the slowly rotating galaxy and the rapidly rotating galaxy is the presence of the mid-plane disk, which alters the gas fueling channel to the central black hole. Many elliptical galaxies are indeed observed to contain central disks (e.g., Serra et al., 2014).
5.2 Light Curve of AGN Luminosity
Figure 2 shows the evolution of light curves of AGN luminosity. The k00 model represents the model without galactic rotation and k01, k05, k09 models represent the models, in which the degree of the angular momentum increases in order.
The overall shape of the light curves are similar for every model with the full AGN feedback, indicating that the effects of rotation on the galactic evolution may not be significant. However, there are several aspects that show the trends, as the level of angular momentum is varied. It is notable that as the galaxy rotates slower, the AGN burst occurs more frequently at early evolution times, and the peak of the burst tends to be higher. This is because the lower angular momentum provides a weaker barrier to hamper the BH accretion, producing the stronger AGN burst.
For most of the time, the AGN stays in the hot mode (i.e. low accretion regime; ) as is observed. In the left panel of Figure 2, the horizontal dashed lines represent the mean value of the light curves in the hot mode. We found that the mean value increases gradually as the host galaxy rotates faster. In the most rapidly rotating model, k09, the mean value is a factor of 6 larger than in the non-rotating model, k00. This is because, in the case of lower angular momentum, the AGN activity can reach to a higher level due to the easier accretion of the gas. Consequently, the AGN can produce stronger radiation and winds, which expel the gas surrounding the black hole more strongly. This results in a longer period of time during which the accretion rate is very small.
In the right panel of Figure 2, we plot the AGN light curve over a shorter time interval to compare the shape of the curve lines in different models. As discussed, all models with AGN feedback have a similar shape, which is characterized by intermittent AGN bursts. The typical life time of the AGN feedback is similar between the rotating models and the non-rotating model, which is (see Paper I for the detailed discussion).
In the model without AGN feedback, k05noFB, the light curve variability does not imply AGN activity but simply indicates the variation of corresponding mass accretion rate. While the mass accretion rate for the model without feedback in a non-rotating galaxy shows monotonic decrease (see noFB in Paper I), the rate in model k05noFB still strongly fluctuates. This is likely because, as in the case of black hole accretion flows, when the angular momentum of the gas is present, the motion of the gas is convectively unstable, and such an instability produces turbulence and episodic accretion.
In the model k05noFB, The light curve shows intermittent breaks (e.g. from 4.3 Gyr to 6 Gyr). The reason is as follows. The density in the mid-plane disk is very high. Without the influence of AGN feedback, which can heat and disturb the disk by wind and radiation, the star formation and thus the stellar feedback by the supernova are prone to be violent. Such violent stellar feedback can destroy the disk and expel large amount of gas outward, which causes a strong decrease of the black hole accretion rate. If the galaxy rotates slower, the disk will shrink and thus the stellar feedback will be weaker. Therefore, these intermittent breaks take place only for the rapidly rotating galaxy without AGN feedback. However, we may need to be careful that in our two dimensional simulation, the stellar feedback on the disk can be overestimated. In the case of three dimensional hydrodynamical simulations, the disk can fragment and thus the effects of the stellar feedback may not be strong enough to expel the gas, forming galactic fountain (Biernacki & Teyssier, 2017). We will investigate this issue in a following study having full three dimensional simulation.
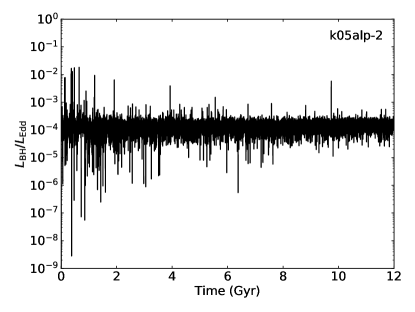
The BH accretion and the feedback are manipulated by the inflow of gas. For the rotating galaxy, such inflow is feasible only when the angular momentum of gas is transported outward. As a result, the value of the viscosity parameter is of particular importance. While the value remains uncertain, we set the value to 0.1 for most simulations. For comparison, we also carry out one run with (k05alp-2) otherwise the same as the model k05. Figure 3 shows the AGN light curve for this model. Compared to the result shown in Figure 2, we can see that the mean luminosity is significantly lower. This is because, when is smaller, the accretion timescale becomes longer, thus the gas will stay in the disk for a longer time. Consequently, more gas will be consumed due to star formation and thus the black hole accretion rate becomes smaller.
5.3 Mass Growth of Black Hole
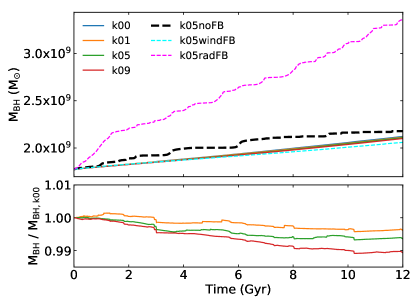
Mass accretion onto the BH is likely controlled by both AGN activity and galactic properties. As discussed in Paper I, the BH mass growth is regulated dominantly by mechanical feedback (i.e. AGN wind), which expels gas out of central region during the bursts. Unlike the AGN wind, the irradiation by AGN plays a complicated role. The radiative pressure drives gas outward, reducing the BH accretion. However, the radiative heating also suppresses the star formation, preventing the gas depletion before it reaches the central BH, and thus increasing the BH accretion simultaneously. The numerical results show that the latter effect is dominant, hence the radiative feedback, in general, increases the BH growth rates. In Figure 4, the final BH mass in the model with pure radiative feedback (k05radFB; of the magenta dashed line) is two times larger than that in the rest of models, implying that pure radiative feedback is not effective in controlling the growth of the black hole mass. On the contrary, the mechanical feedback plays the dominant role as we see that the BH mass growth in the model k05windFB is similar to the full AGN feedback model (k05). This result was also found in the Choi et al. (2012) simulations which had lower resolution but were 3D and included cosmological effects. In our work, we found that such primary roles for mechanical feedback and radiative feedback in regulating the BH mass growth are similar for the models of non-rotating galaxy and rotating galaxy.
For the full feedback models, the difference of BH mass growth in the different galactic rotation models may not be significant, however we found a monotonic change with the rotation speed. The bottom panel of Figure 4 shows the relative growth rate between the rotating galaxy (k01, k05, k09) and the non-rotating galaxy (k00). It is clear that as the galaxy rotates faster, the BH accretion is more suppressed. This is attributed to the angular momentum, which prevents the gas from flowing inward.
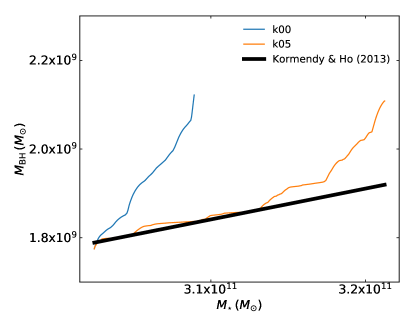
It is believed that both the BH mass and the stellar mass may increase dramatically mainly through galaxy merging at high redshift epochs (e.g., Mihos & Hernquist, 1996; Di Matteo et al., 2005; Cortijo-Ferrero et al., 2017; Goulding et al., 2017). However, the mergers are unlikely to dominate BH growth and the relation has weak redshift evolution since (Kocevski et al., 2012; Fan et al., 2014; Yang et al., 2017). Thus far, the previous numerical studies for AGN feedback in an early type galaxy have a critical drawback that in most of the results, the BH growth over the galactic evolution is considerably larger than what is expected by the observed relation (Kormendy & Ho, 2013). For example, in Gan et al. (2014), the final BH mass of models with AGN feedback is , which is 530 times larger than the initial mass, while the stellar mass increases only several per cents of the initial mass. In Figure 5, we show the relation from our numerical data and the fitted formula from observation (Kormendy & Ho, 2013). We found that in our updated model, the AGN feedback is effective in suppressing the BH growth and the result is consistent with the expected relationship: in previous work, the ratio of BH mass growth, , is an order of magnitude larger than in the current result (e.g., Gan et al., 2014; Ciotti et al., 2017). In addition, we note that, when the host galaxy rotates faster, the black hole mass growth is more suppressed as a consequence of more active star formation in the mid plane disk, consuming more fuel before it accretes. (see § 5.4 for more detailed discussion of the correlation between the angular momentum of the accreting gas and the star formation). We argue that the scatters shown in the observed correlation between the black hole mass and the stellar mass in the host galaxy may be ascribed to the degree of the galactic rotation. This also may provide clues for the long-standing question why and how BHs are no longer able to grow above the critical value, , which is inconclusive (e.g, King, 2016). In order to shed light on this problem, larger parameter studies (e.g., various initial gas density) are required. We will discuss it in future work.
5.4 Star Formation
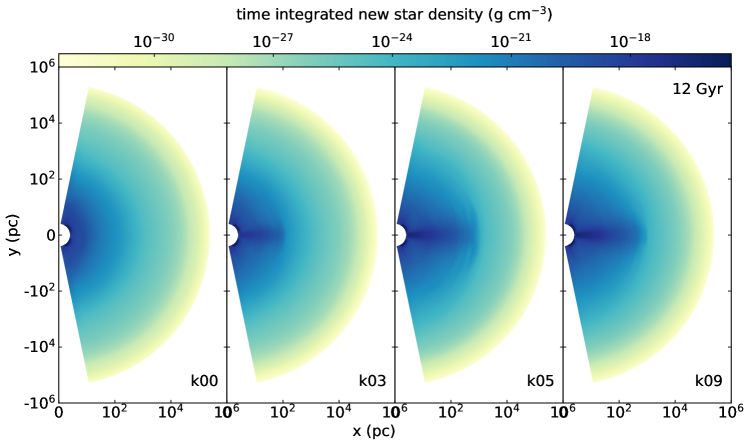
Figure 6 shows the density of the newly born stars, which is time-integrated up to the end of runs. In a non-rotating galaxy (k00), stars form massively when the cold shells and filaments fall back onto the central region, resulting in quite spherically symmetric and centrally concentrated distribution (left-most column). However, as we can see the right three columns, if the host galaxy rotates, stars form dominantly at the cold mid-plane disk, whose size increases with the rotation speed. The mid-plane disk spreads up to 0.1, 0.3, 0.5 kpc for the models k03, k05, k09, respectively.
Figure 7 shows the time-integrated mass of newly born stars as a function of radius. The left panel shows -integrated total mass of new stars within each given radial bins. Note that in our grid configuration, the bin size increases as the radius (see § 4). We can see that for rotating galaxies there are two peaks for each curve. The outer peaks are purely due to the geometry effect, as explained in our Paper I. The inner peaks are absent in the case of non-rotating galaxy and become present due to the rotation of the galaxy. From model k03 to k05, with the increase of the galaxy rotation, the amplitude of the peaks increases and the corresponding radius of the peaks becomes larger: the peak value of the model k05 (mild rotator) is an order of magnitude larger than that of the model k03 (slow rotator). To understand these results, we note that the peak location corresponds to the edge of mid-plane disk shown in Figure 6. The overall star formation density in the disk is very high, since star formation is strong there. This explains the presence of the peaks and why the location of the peak of the model k03 is smaller. But interestingly, both the magnitude and location of the peaks “saturate” from model k05 to k09.
For the model without AGN feedback, k05noFB, the star formation occurs actively within 10 pc. We can see from the left panel of Figure 6 that the mass of the new stars in this model is up to two orders of magnitudes larger than the models with AGN feedback. It is because the surface density of the disk is high due to the lack of disturbance by wind and radiation from the AGN. If the entire disk were stable over the evolution time, the total mass of new stars in k05noFB would be larger than that in the other models. However, as discussed, the violent stellar feedback occurs intermittently, which expels large amounts of gas, reducing the total mass of new stars at pc.
The right panel of Figure 7 shows the enclosed mass of the newly born stars within a given radius at the end of the run. It is clear that as the galaxy rotates faster, the total mass of new stars becomes larger: the total masses of the newly born stars for the model k00 and k05 are and , which correspond to 2% and 6% of the initial galactic stellar mass, respectively. It is because higher angular momentum leads the gas to stay longer at the mid-plane disk, inducing more active star formation.
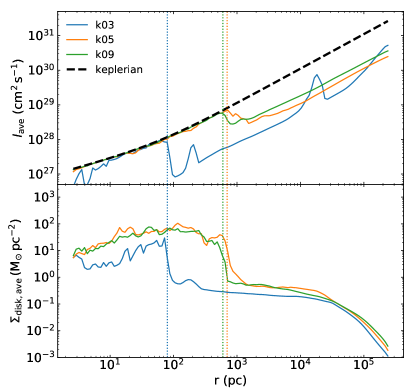
The detailed disk properties are illustrated by the radial profiles of the specific angular momentum, , and the disk surface density, . The results are shown in Figure 8. For the radial profiles, we average the data samples that lie in the time interval between 2 Gyr and 3 Gyr. The disk surface density is computed within above/below the equator (see the black dashed line in Figure 10). Once the gas falls onto the mid-plane disk, the gas follows the Keplerian motion under the given gravitational potential. The size of the disk is initially determined by the angular momentum of the gas, but grows gradually due to the outward transport of angular momentum(Bu & Yuan, 2014). For the slowly rotating model (k03), the sharp cut-off in the radial profiles occurs at the radius of 80 pc, which is an order of magnitude smaller than the fast rotators (k05 and k09). However, in our results, the disk of the galaxies that rotate faster than k05 model are no longer stretched further, which produces saturation of the star formation activity in the disk for the models k05 and k09 (see Figure 7).
It is notable that the disk surface density of the model k03 is significantly lower than that of the fast rotators (k05 and k09). This is mainly because the mid-plane disk in the slowly rotating galaxy tends to be disrupted easily. We found that in a large fraction of time, the mid-plane disk disappears in the k03 model, and thus the averaged value of the surface density for the integrated time interval becomes small. Such a short duration is ascribed to the AGN activity, which is more violent when the host galaxy rotates slower, as we discussed in § 5.2. As a result, such relatively strong AGN feedback disrupts the disk easily, attenuating the star formation activities in the disk, which is seen in Figure 7.
Since the interplay between the AGN activity and star formation is complicated, to determine whether the AGN feedback induces or suppresses the star formation, the time evolution of the star formation rate should be examined. The left panel of Figure 9 shows the specific star formation rate (sSFR) over the galactic evolution, which is computed by star formation rate normalized by the stellar mass of the galaxy. As discussed in Paper I, the star formation rate is quite episodic as a consequence of the effects of AGN feedback. The horizontal dotted line is the quiescence limit (Franx et al., 2008), below which the star formation is considered as being quenched. It is interesting to point out that even for the model without AGN feedback, the star formation rate fluctuates significantly. Such fluctuation is not by AGN feedback but by both the accretion process, which is intrinsically fluctuating, and the stellar feedback. Compared to the model with AGN feedback, the sSFR in the model without AGN feedback is relatively low. However, this does not imply that AGN feedback induces star formation: without AGN feedback, stellar feedback becomes violent intermittently, and expels large amount of gas outward. In the right panel of Figure 9, the histogram shows that the typical value of the specific star formation rate for all models is a few .
Smethurst et al. (2018) showed observational evidence that, while the rapid quenching of star formation (1 Gyr) is dominant for slowly rotating galaxies; the star formation in fast rotators remains active for a longer evolution time. They argued that it is attributed to the different nature of the quenching mechanisms: the slowly rotating galaxies may be formed in major mergers, but the rapidly rotating galaxies are involved in multiple processes, such as secular evolution and minor mergers. However, Lagos et al. (2017) showed that the merged galaxies, which are slowly rotating due to the loss of angular momentum as a consequence of merging, still need to be quenched by feedback, otherwise the continuing gas inflow and star formation dominates over the negative effect of mergers. Our results show that AGN feedback effectively suppresses star formation activities in slowly rotating galaxies (see the model k00 in Figure 9). In rapidly rotating galaxies, the negative effect of AGN feedback on the star formation activity is relatively weak, as we see that for the models k05 and k09, the histogram of the specific star formation rate spreads out to the high values.
In order to examine whether the inflowing gas ends up accreting onto the BH against the depletion by massive star formation along its way, we compare the time scale between infall, , and star formation, :
| (36) |
| (37) |
where is the cooling time scale,
| (38) |
where is the internal energy of the gas, is the number density and is the cooling rate, which is calculated from recent atomic database222http://atomdb.org/. is the dynamical time scale:
| (39) |
where and are Jeans’ time scale and rotational time scale, respectively:
| (40) |
| (41) |
where is the Keplerian velocity.
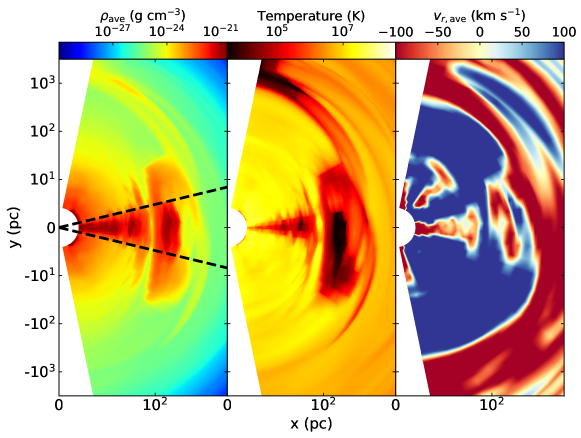
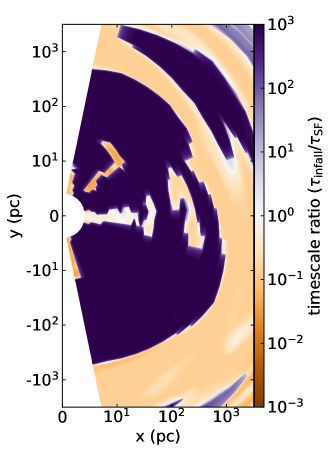
To examine different timescales, we need information concerning density, temperature, and radial velocity. These are calculated and shown in Figure 10. The results are from the data averaged for some periods, showing the mid-plane cold disk, along which the gas flows inward with the radial velocity of km/s. Using this averaged dataset, we examine the time scale ratio between the infalls and the star formation, , from the eqs. (36)&(37). The results for model k05 are shown in Figure 11. From this figure, we find that the infalling time scale is comparable to the star formation time scale over the entire disk in our fiducial model, k05. Consequently, in this model, a large fraction of infalling gas ends up with accreting onto the black hole against the depletion by star formation, triggering AGN activity as seen in Figure 2.
It should be noted that, in our simulation, star formation is computed by without consideration of temperature and/or Jean’s mass limiters. Here is the star formation efficiency and we adopt a value of . The absence of the limiters may lead to an overestimate of star formation in high temperature and low density regions (e.g., the regions at large radii, ). We examined that this does not affect our results significantly, but will be taken into account in future work.
5.5 AGN Duty Cycle
Following the procedure illustrated in Ciotti et al. (2017) for the low-rotation case, Figure 12 shows the percentage of the total simulation time spent above (right panel) and below (left panel) the given Eddington ratio. In left panel, the vertical dotted lines indicate the Eddington ratio below which the AGN spends 80% of the total time. Every model spends most of the time at a low accretion regime (hot mode), which is consistent with the low detectability of active galaxies (e.g, Greene & Ho, 2007).
In the right panel of Figure 12, the solid and dashed lines represent duty cycle profiles for the entire evolution time and the last 2 Gyrs, respectively, during which the AGN spend time above the given Eddington ratio. The observational constraints are indicated by symbols: downward-pointing triangles are from Heckman et al. (2004), circles from Greene & Ho (2007), upward-pointing triangles from Kauffmann & Heckman (2009), and squares are from Ho (2009). Those data points are appropriate for comparing with the low-redshift results (i.e., dashed lines). The overall duty cycle is similar for all models, but we note that, as the galaxy rotates faster, the highest AGN luminosity which the AGN can reach becomes smaller gradually: the maximum AGN luminosity of k09 model is , which is a half of the maximum luminosity of k00 model. The results show that all models lie below the observation data but not by a large factor. In our numerical configuration, we assume that the gas is initially rarefied in the background medium, ignoring the presence of the gas that inflows from the intracluster medium or the gas that forms before 2 Gyr. Hence, we speculate that our numerical result of AGN duty cycle in Figure 12 likely represents the case of lower limit.
Soltan (1982), Caplar et al. (2015) and Kollmeier et al. (2006) argued that while AGNs spend most of time in the low Eddington regime, they emit significant fraction of energy in the high Eddington regime. The left panel of Figure 13 shows the percentage of the total energy emitted above the given Eddington ratios. We found that as the galaxy rotates faster, the fraction of emitted energy with the high Eddington ratio decreases. The total energy emitted in the cold mode (i.e., ) in the model k09 is several per cents of the entire energy emitted via AGN feedback, which is an order of magnitude smaller than that in the model k00. This trend also can be seen in the fractional distribution of the Eddington ratios (the right panel of Figure 13). It is clear that the angular momentum plays a role in reducing the strength of AGN feedback and that all our models emit less energy at high Eddington ratios than do real observed massive black holes.
5.6 X-ray Properties of the Gas
We compute X-ray luminosity within the energy band range of 0.3-8 keV (the Chandra sensitive band).
| (42) |
where the emissivity is computed by , and are the number densities of electrons and hydrogen atoms, and is the cooling function. We make use of the spectral fitting package with the assumption of the collisional ionization equilibrium XSPEC333http://heasarc.gsfc.nasa.gov/docs/xanadu/xspec/ (spectral model APEC) to calculate the cooling function (Smith et al., 2001).
The X-ray output is mostly emitted from the hot gas in the central region, where the effects of AGN feedback are likely dominant. The left panel of Figure 14 shows X-ray luminosity, as a function of evolution time. We found that for all models with AGN feedback, the strongly oscillates due to the AGN activity, and lies in the range in general. For most of models, the dominant X-ray luminosity band is (see the right panel of Figure 14). As discussed in Paper I, such values are consistent with observations (see also Pellegrini et al., 2018).
6 Summary and Conclusions
In this work, we have investigated the interplay between the AGN outputs released from the small scale BH accretion and its host galaxy on a large scale. The primary goal is to understand the role of the angular momentum of accreting gas in such interplay. We performed two-dimensional hydrodynamic simulations, in which the spatial range covers from several pc to kpc. The galaxy model (stellar distribution and dark matter) and physical processes (e.g., star formation, Type Ia and Type II supernovae) are described in Paper I. We adopt the most updated “sub-grid” AGN physics as described in detail in Paper I, in which there are two modes of black hole accretion according to the mass accretion rate (i.e., hot and cold), and the description of wind and radiation are different in the two modes.
The high angular momentum is a natural barrier for BH accretion due to angular momentum conservation. Most previous numerical studies of AGN feedback have assumed a galaxy model with a very low level of angular momentum. However, the restriction is not a good approximation for most galaxies, even for early type galaxies. In this work, we remove this restriction and investigate carefully how the level of angular momentum affects the interplay between AGN and its host galaxy. In order to transport angular momentum, we adopt the -viscosity model with an anomalous stress tensor. The fiducial value of the viscosity parameter is set to for most models in this work.
The main results are described below:
-
•
The general evolution picture of the AGN cycle in a rotating galaxy is qualitatively similar to that in a non-rotating galaxy. However, the details are significantly different. The important new feature is the presence of the mid-plane disk for the rotating galaxy, due to the angular momentum. As a result, the gas fueling mainly occurs through the mid-plane, unlike to the case of non-rotating galaxy, in which the gas fuels the black hole in a random direction.
-
•
We found that as the galaxy rotates slower, the AGN bursts occur more frequently at early evolution times, and the peak of the AGN light curve tends to be higher. The angular momentum of the gas plays a role in reducing the AGN activity by two aspects: first, the mass accretion rate is reduced due to the presence of angular momentum. Second, it forms a mid-plane disk, within which a large fraction of gas is consumed via star formation before the gas reaches the BH.
-
•
The reduced AGN activity in the case of a rapidly rotating galaxy tends to disturb the mid-plane disk less strongly than in a slowly rotating galaxy. Consequently, as the host galaxy rotates faster, stars form dominantly at the mid-plane disk, and the total mass of new stars increases.
-
•
The overall profile of duty cycle is similar for all models with different levels of angular momentum, and it is somewhat below the observed data. Since we assume that the initial gas density is rarefied in the simulation, our results likely represent the minimum AGN activity in a given galactic environment. Too little energy is emitted at high Eddington ratio compared to observations, which is likely also due to this assumption.
-
•
The X-ray luminosity is, in general, similar for all models, and the value is in a good agreement with the observed data.
Acknowledgments
DY and FY are supported in part by the National Key Research and Development Program of China (Grant No. 2016YFA0400704), the Natural Science Foundation of China (grants 11573051, 11633006, 11650110427, 11661161012), the Key Research Program of Frontier Sciences of CAS (No. QYZDJSSW-SYS008), and the Astronomical Big Data Joint Research Center co-founded by the National Astronomical Observatories, Chinese Academy of Sciences and the Alibaba Cloud. ZG is supported by the Natural Science Foundation of Shanghai (grant 18ZR1447200). This work made use of the High Performance Computing Resource in the Core Facility for Advanced Research Computing at Shanghai Astronomical Observatory.
References
- Anglés-Alcázar et al. (2017) Anglés-Alcázar, D., Davé, R., Faucher-Giguère, C.-A., Özel, F., & Hopkins, P. F. 2017, MNRAS, 464, 2840, doi: 10.1093/mnras/stw2565
- Auger et al. (2010) Auger, M. W., Treu, T., Bolton, A. S., et al. 2010, ApJ, 724, 511, doi: 10.1088/0004-637X/724/1/511
- Balbus & Hawley (1991) Balbus, S. A., & Hawley, J. F. 1991, ApJ, 376, 214, doi: 10.1086/170270
- Balbus & Hawley (1998) —. 1998, Reviews of Modern Physics, 70, 1, doi: 10.1103/RevModPhys.70.1
- Barnes & Hernquist (1996) Barnes, J. E., & Hernquist, L. 1996, ApJ, 471, 115, doi: 10.1086/177957
- Barnes & Hernquist (1991) Barnes, J. E., & Hernquist, L. E. 1991, ApJ, 370, L65, doi: 10.1086/185978
- Bertin & Lodato (2001) Bertin, G., & Lodato, G. 2001, A&A, 370, 342, doi: 10.1051/0004-6361:20010224
- Biernacki & Teyssier (2017) Biernacki, P., & Teyssier, R. 2017, ArXiv e-prints. https://arxiv.org/abs/1712.02794
- Bondi (1952) Bondi, H. 1952, MNRAS, 112, 195, doi: 10.1093/mnras/112.2.195
- Bournaud et al. (2005) Bournaud, F., Jog, C. J., & Combes, F. 2005, A&A, 437, 69, doi: 10.1051/0004-6361:20042036
- Bu & Yuan (2014) Bu, D.-F., & Yuan, F. 2014, MNRAS, 442, 917, doi: 10.1093/mnras/stu917
- Bu et al. (2016) Bu, D.-F., Yuan, F., Gan, Z.-M., & Yang, X.-H. 2016, ApJ, 823, 90, doi: 10.3847/0004-637X/823/2/90
- Caplar et al. (2015) Caplar, N., Lilly, S. J., & Trakhtenbrot, B. 2015, ApJ, 811, 148, doi: 10.1088/0004-637X/811/2/148
- Choi et al. (2012) Choi, E., Ostriker, J. P., Naab, T., & Johansson, P. H. 2012, ApJ, 754, 125, doi: 10.1088/0004-637X/754/2/125
- Ciotti et al. (2009a) Ciotti, L., Morganti, L., & de Zeeuw, P. T. 2009a, MNRAS, 393, 491, doi: 10.1111/j.1365-2966.2008.14009.x
- Ciotti & Ostriker (1997) Ciotti, L., & Ostriker, J. P. 1997, ApJ, 487, L105, doi: 10.1086/310902
- Ciotti & Ostriker (2001) —. 2001, ApJ, 551, 131, doi: 10.1086/320053
- Ciotti & Ostriker (2007) —. 2007, ApJ, 665, 1038, doi: 10.1086/519833
- Ciotti & Ostriker (2012) Ciotti, L., & Ostriker, J. P. 2012, in Astrophysics and Space Science Library, Vol. 378, Astrophysics and Space Science Library, ed. D.-W. Kim & S. Pellegrini, 83
- Ciotti et al. (2009b) Ciotti, L., Ostriker, J. P., & Proga, D. 2009b, ApJ, 699, 89, doi: 10.1088/0004-637X/699/1/89
- Ciotti & Pellegrini (2017) Ciotti, L., & Pellegrini, S. 2017, ApJ, 848, 29, doi: 10.3847/1538-4357/aa8d1f
- Ciotti et al. (2017) Ciotti, L., Pellegrini, S., Negri, A., & Ostriker, J. P. 2017, ApJ, 835, 15, doi: 10.3847/1538-4357/835/1/15
- Cortijo-Ferrero et al. (2017) Cortijo-Ferrero, C., González Delgado, R. M., Pérez, E., et al. 2017, MNRAS, 467, 3898, doi: 10.1093/mnras/stx383
- Czoske et al. (2008) Czoske, O., Barnabè, M., Koopmans, L. V. E., Treu, T., & Bolton, A. S. 2008, MNRAS, 384, 987, doi: 10.1111/j.1365-2966.2007.12784.x
- Di Matteo et al. (2005) Di Matteo, T., Springel, V., & Hernquist, L. 2005, Nature, 433, 604, doi: 10.1038/nature03335
- Dorodnitsyn et al. (2016) Dorodnitsyn, A., Kallman, T., & Proga, D. 2016, ApJ, 819, 115, doi: 10.3847/0004-637X/819/2/115
- Dye et al. (2008) Dye, S., Evans, N. W., Belokurov, V., Warren, S. J., & Hewett, P. 2008, MNRAS, 388, 384, doi: 10.1111/j.1365-2966.2008.13401.x
- Emsellem et al. (2011) Emsellem, E., Cappellari, M., Krajnović, D., et al. 2011, MNRAS, 414, 888, doi: 10.1111/j.1365-2966.2011.18496.x
- Fabian (2012) Fabian, A. C. 2012, ARA&A, 50, 455, doi: 10.1146/annurev-astro-081811-125521
- Fan et al. (2014) Fan, L., Fang, G., Chen, Y., et al. 2014, ApJ, 784, L9, doi: 10.1088/2041-8205/784/1/L9
- Franx et al. (2008) Franx, M., van Dokkum, P. G., Förster Schreiber, N. M., et al. 2008, ApJ, 688, 770, doi: 10.1086/592431
- Gammie (2001) Gammie, C. F. 2001, ApJ, 553, 174, doi: 10.1086/320631
- Gan et al. (2014) Gan, Z., Yuan, F., Ostriker, J. P., Ciotti, L., & Novak, G. S. 2014, ApJ, 789, 150, doi: 10.1088/0004-637X/789/2/150
- Gofford et al. (2015) Gofford, J., Reeves, J. N., McLaughlin, D. E., et al. 2015, MNRAS, 451, 4169, doi: 10.1093/mnras/stv1207
- Goulding et al. (2017) Goulding, A. D., Greene, J. E., Bezanson, R., et al. 2017, PASJ, doi: 10.1093/pasj/psx135
- Greene & Ho (2007) Greene, J. E., & Ho, L. C. 2007, ApJ, 667, 131, doi: 10.1086/520497
- Hayes et al. (2006) Hayes, J. C., Norman, M. L., Fiedler, R. A., et al. 2006, ApJS, 165, 188, doi: 10.1086/504594
- Heckman et al. (2004) Heckman, T. M., Kauffmann, G., Brinchmann, J., et al. 2004, ApJ, 613, 109, doi: 10.1086/422872
- Hernquist (1989) Hernquist, L. 1989, Nature, 340, 687, doi: 10.1038/340687a0
- Hernquist & Mihos (1995) Hernquist, L., & Mihos, J. C. 1995, ApJ, 448, 41, doi: 10.1086/175940
- Ho (2009) Ho, L. C. 2009, ApJ, 699, 626, doi: 10.1088/0004-637X/699/1/626
- Hopkins & Quataert (2010) Hopkins, P. F., & Quataert, E. 2010, MNRAS, 407, 1529, doi: 10.1111/j.1365-2966.2010.17064.x
- Hopkins & Quataert (2011) —. 2011, MNRAS, 415, 1027, doi: 10.1111/j.1365-2966.2011.18542.x
- Jaffe (1983) Jaffe, W. 1983, MNRAS, 202, 995, doi: 10.1093/mnras/202.4.995
- Kauffmann & Heckman (2009) Kauffmann, G., & Heckman, T. M. 2009, MNRAS, 397, 135, doi: 10.1111/j.1365-2966.2009.14960.x
- King (2016) King, A. 2016, MNRAS, 456, L109, doi: 10.1093/mnrasl/slv186
- Kocevski et al. (2012) Kocevski, D. D., Faber, S. M., Mozena, M., et al. 2012, ApJ, 744, 148, doi: 10.1088/0004-637X/744/2/148
- Kollmeier et al. (2006) Kollmeier, J. A., Onken, C. A., Kochanek, C. S., et al. 2006, ApJ, 648, 128, doi: 10.1086/505646
- Kormendy & Ho (2013) Kormendy, J., & Ho, L. C. 2013, ARA&A, 51, 511, doi: 10.1146/annurev-astro-082708-101811
- Korol et al. (2016) Korol, V., Ciotti, L., & Pellegrini, S. 2016, MNRAS, 460, 1188, doi: 10.1093/mnras/stw1029
- Krajnović et al. (2011) Krajnović, D., Emsellem, E., Cappellari, M., et al. 2011, MNRAS, 414, 2923, doi: 10.1111/j.1365-2966.2011.18560.x
- Krajnović et al. (2013) Krajnović, D., Alatalo, K., Blitz, L., et al. 2013, MNRAS, 432, 1768, doi: 10.1093/mnras/sts315
- Lagos et al. (2017) Lagos, C. d. P., Theuns, T., Stevens, A. R. H., et al. 2017, MNRAS, 464, 3850, doi: 10.1093/mnras/stw2610
- Lodato & Rice (2004) Lodato, G., & Rice, W. K. M. 2004, MNRAS, 351, 630, doi: 10.1111/j.1365-2966.2004.07811.x
- Maraston (2005) Maraston, C. 2005, MNRAS, 362, 799, doi: 10.1111/j.1365-2966.2005.09270.x
- Mathews (1989) Mathews, W. G. 1989, AJ, 97, 42, doi: 10.1086/114955
- Mihos & Hernquist (1996) Mihos, J. C., & Hernquist, L. 1996, ApJ, 464, 641, doi: 10.1086/177353
- Negri et al. (2015) Negri, A., Pellegrini, S., & Ciotti, L. 2015, MNRAS, 451, 1212, doi: 10.1093/mnras/stv968
- Negri et al. (2014) Negri, A., Posacki, S., Pellegrini, S., & Ciotti, L. 2014, MNRAS, 445, 1351, doi: 10.1093/mnras/stu1834
- Negri & Volonteri (2017) Negri, A., & Volonteri, M. 2017, MNRAS, 467, 3475, doi: 10.1093/mnras/stx362
- Novak et al. (2011) Novak, G. S., Ostriker, J. P., & Ciotti, L. 2011, ApJ, 737, 26, doi: 10.1088/0004-637X/737/1/26
- Novak et al. (2012) —. 2012, MNRAS, 427, 2734, doi: 10.1111/j.1365-2966.2012.21844.x
- Ostriker et al. (2010) Ostriker, J. P., Choi, E., Ciotti, L., Novak, G. S., & Proga, D. 2010, ApJ, 722, 642, doi: 10.1088/0004-637X/722/1/642
- Parriott & Bregman (2008) Parriott, J. R., & Bregman, J. N. 2008, ApJ, 681, 1215, doi: 10.1086/588033
- Pellegrini (2012) Pellegrini, S. 2012, in Astrophysics and Space Science Library, Vol. 378, Astrophysics and Space Science Library, ed. D.-W. Kim & S. Pellegrini, 21
- Pellegrini et al. (2018) Pellegrini, S., Ciotti, L., Negri, A., & Ostriker, J. P. 2018, ArXiv e-prints. https://arxiv.org/abs/1802.02005
- Proga (2003) Proga, D. 2003, ApJ, 585, 406, doi: 10.1086/345897
- Salpeter (1955) Salpeter, E. E. 1955, ApJ, 121, 161, doi: 10.1086/145971
- Sazonov et al. (2004) Sazonov, S. Y., Ostriker, J. P., & Sunyaev, R. A. 2004, MNRAS, 347, 144, doi: 10.1111/j.1365-2966.2004.07184.x
- Schawinski et al. (2011) Schawinski, K., Treister, E., Urry, C. M., et al. 2011, ApJ, 727, L31, doi: 10.1088/2041-8205/727/2/L31
- Serra et al. (2014) Serra, P., Oser, L., Krajnović, D., et al. 2014, MNRAS, 444, 3388, doi: 10.1093/mnras/stt2496
- Shakura & Sunyaev (1973) Shakura, N. I., & Sunyaev, R. A. 1973, A&A, 24, 337
- Shin et al. (2010) Shin, M.-S., Ostriker, J. P., & Ciotti, L. 2010, ApJ, 711, 268, doi: 10.1088/0004-637X/711/1/268
- Smethurst et al. (2018) Smethurst, R. J., Masters, K. L., Lintott, C. J., et al. 2018, MNRAS, 473, 2679, doi: 10.1093/mnras/stx2547
- Smith et al. (2001) Smith, R. K., Brickhouse, N. S., Liedahl, D. A., & Raymond, J. C. 2001, ApJ, 556, L91, doi: 10.1086/322992
- Soltan (1982) Soltan, A. 1982, MNRAS, 200, 115, doi: 10.1093/mnras/200.1.115
- Sonnenfeld et al. (2013) Sonnenfeld, A., Treu, T., Gavazzi, R., et al. 2013, ApJ, 777, 98, doi: 10.1088/0004-637X/777/2/98
- Steidel et al. (2003) Steidel, C. C., Adelberger, K. L., Shapley, A. E., et al. 2003, ApJ, 592, 728, doi: 10.1086/375772
- Stone & Pringle (2001) Stone, J. M., & Pringle, J. E. 2001, MNRAS, 322, 461, doi: 10.1046/j.1365-8711.2001.04138.x
- Stone et al. (1999) Stone, J. M., Pringle, J. E., & Begelman, M. C. 1999, MNRAS, 310, 1002, doi: 10.1046/j.1365-8711.1999.03024.x
- Tacchella et al. (2015) Tacchella, S., Carollo, C. M., Renzini, A., et al. 2015, Science, 348, 314, doi: 10.1126/science.1261094
- Tang & Wang (2005) Tang, S., & Wang, Q. D. 2005, ApJ, 628, 205, doi: 10.1086/430875
- Toomre (1964) Toomre, A. 1964, ApJ, 139, 1217, doi: 10.1086/147861
- Xie & Yuan (2012) Xie, F.-G., & Yuan, F. 2012, MNRAS, 427, 1580, doi: 10.1111/j.1365-2966.2012.22030.x
- Xie et al. (2017) Xie, F.-G., Yuan, F., & Ho, L. C. 2017, ApJ, 844, 42, doi: 10.3847/1538-4357/aa7950
- Yang et al. (2017) Yang, G., Brandt, W. N., Vito, F., et al. 2017, ArXiv e-prints. https://arxiv.org/abs/1710.09399
- Younger et al. (2008) Younger, J. D., Hopkins, P. F., Cox, T. J., & Hernquist, L. 2008, ApJ, 686, 815, doi: 10.1086/591639
- Yu & Tremaine (2002) Yu, Q., & Tremaine, S. 2002, MNRAS, 335, 965, doi: 10.1046/j.1365-8711.2002.05532.x
- Yuan et al. (2012) Yuan, F., Bu, D., & Wu, M. 2012, ApJ, 761, 130, doi: 10.1088/0004-637X/761/2/130
- Yuan et al. (2015) Yuan, F., Gan, Z., Narayan, R., et al. 2015, ApJ, 804, 101, doi: 10.1088/0004-637X/804/2/101
- Yuan & Narayan (2014) Yuan, F., & Narayan, R. 2014, ARA&A, 52, 529, doi: 10.1146/annurev-astro-082812-141003
- Yuan et al. (2018) Yuan, F., Yoon, D., Li, Y.-P., et al. 2018, ApJ, 857, 121, doi: 10.3847/1538-4357/aab8f8