IcoRating: A Deep-Learning System for Scam ICO Identification
Abstract
Cryptocurrencies (or digital tokens, digital currencies, e.g., BTC, ETH, XRP, NEO) have been rapidly gaining ground in use, value, and understanding among the public, bringing astonishing profits to investors. Unlike other money and banking systems, most digital tokens do not require central authorities. Being decentralized poses significant challenges for credit rating. Most ICOs are currently not subject to government regulations, which makes a reliable credit rating system for ICO projects necessary and urgent.
In this paper, we introduce IcoRating, the first learning–based cryptocurrency rating system. We exploit natural-language processing techniques to analyze various aspects of 2,251 digital currencies to date, such as white paper content, founding teams, Github repositories, websites, etc. Supervised learning models are used to correlate the life span and the price change of cryptocurrencies with these features. For the best setting, the proposed system is able to identify scam ICO projects with 0.83 precision.
We hope this work will help investors identify scam ICOs
and attract more efforts in automatically evaluating and analyzing ICO projects.
111Author contributions: J. Li designed research;
Z. Sun, Z. Deng, F. Li and P. Shi
prepared the data;
S. Bian and A. Yuan contributed analytic tools;
P. Shi and Z. Deng labeled the dataset;
J. Li, W. Monroe and W. Wang designed the experiments;
J. Li, W. Wu, Z. Deng and T. Zhang performed the experiments;
J. Li and T. Zhang wrote the paper; W. Monroe and A. Yuan proofread the paper.
222Author Contacts:
Jiwei Li (corresponding author):
jiweili@shannonai.com;
William Yang Wang: william@cs.ucsb.edu
Will Monroe: wmonroe4@stanford.edu
Arianna Yuan: xfyuan@stanford.edu
1 Introduction
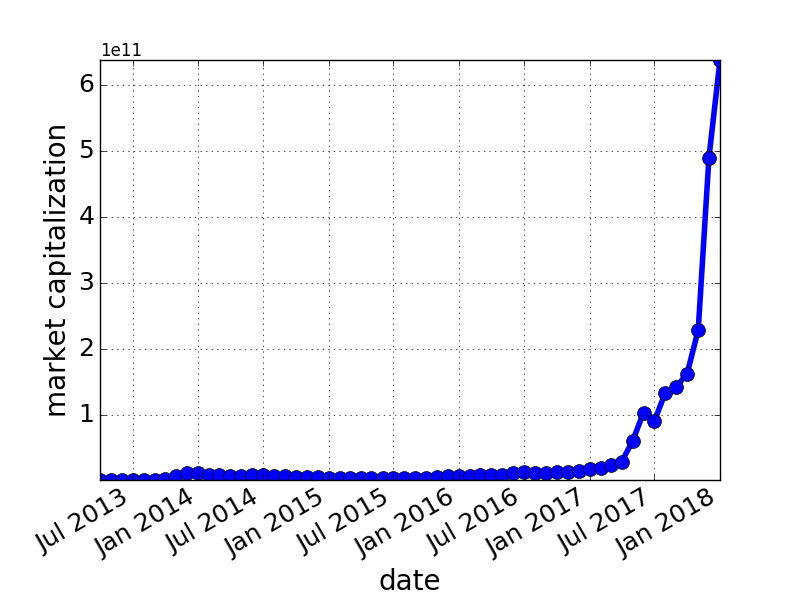
Cryptocurrencies (e..g, BTC, ETH, NEO) are gaining unprecedented popularity and understanding. As opposed to centralized electronic money and central banking systems, most digital tokens do not require central authorities. The control of these decentralized systems works through a blockchain, which is an open and distributed ledger that continuously grows. The market capitalization of cryptocurrencies has increased by a significant margin over the past 3 years, as can be seen from Figure 1. According to data provider Cryptocurrency Market Capitalizations,333https://coinmarketcap.com/, the peak daily trading volume of cryptocurrencies is close to the average daily volume of trade on the New York Stock Exchange in 2017.
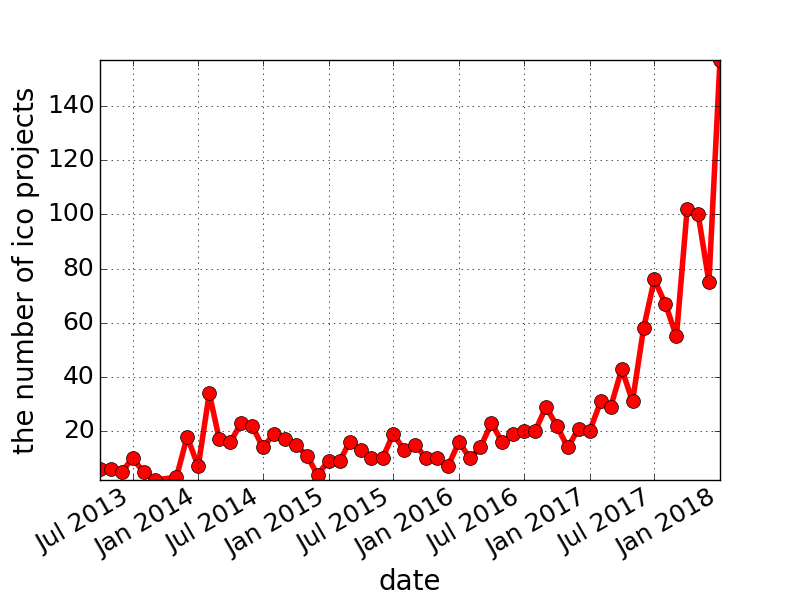
Because of their decentralized nature, the crowdfunding of digital coins does not need to go through all the required conditions of Venture Capital investment, but through initial Coin Offerings (ICOs) Chohan (2017). In an ICO, investors obtain the crowdfunded cryptocurrency using legal tender (e.g., USD, RMB) or other cryptocurrencies (e.g., BTC, ETH), and these crowdfunded cryptocurrencies become functional units of currency when the ICO is done. A white paper is often prepared prior to launching the new cryptocurrency, detailing the commercial, technological and financial details of the coin. As can be seen in Figure 2, the number of ICO projects grew steadily from July 2013 to January 2017, and skyrocketed in 2017.
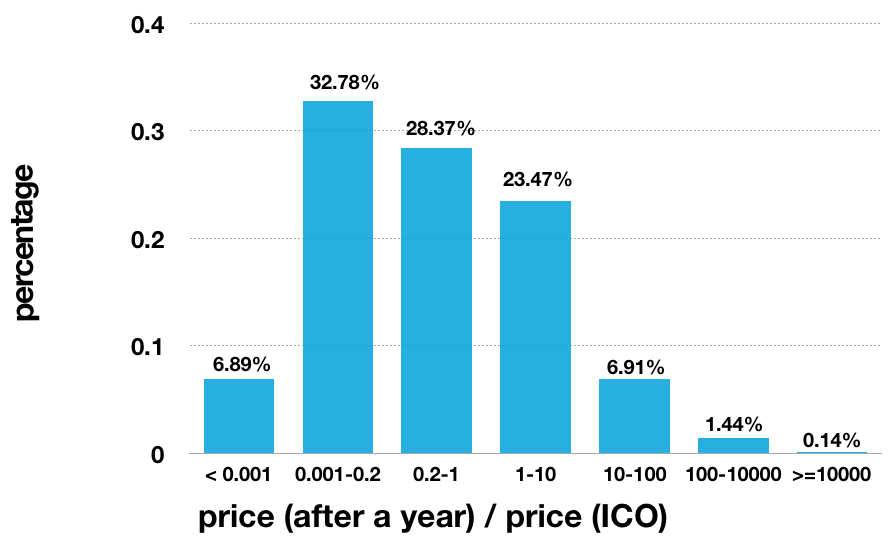
Despite the fact that ICOs are able to provide fair and lawful investment opportunities, the ease of crowdfunding creates opportunities and incentives for unscrupulous businesses to use ICOs to execute “pump and dump” schemes, in which the ICO initiators drive up the value of the crowdfunded cryptocurrency and then quickly “dump” the coins for a profit. Additionally, the decentralized nature of cryptocurrencies poses significant challenges for government regulation. According to Engadget,444https://www.engadget.com/ 46 percent of the 902 crowdsale-based digital currencies in 2017 have already failed. Figures 3 and 4 show an even more serious situation. Each bucket on the x axis of Figures 3 and 4 denotes a range of price change, and the corresponding value on the y axis denotes the percentage of ICO projects. As can be seen, of existing ICO projects suffered a price fall of more than after half a year, and this fraction goes up to after one year. About of projects fell more than after half a year, increasing to an astonishing value of after a year. Though it is not responsible to say that every sharply-falling ICO project is a scam, it is necessary and urgent to build a reliable ICO credit rating system to evaluate a digital currency before its ICO.

In this paper, we propose IcoRating, a machine-learning based ICO rating system. By analyzing 2,251 ICO projects, we correlate the life span and the price change of a digital currency with various levels of its ICO information, including its white papers, founding team, GitHub repository, website, etc. For the best setting, the proposed system is able to identify scam ICO projects with a precision of 0.83 and an F1 score of 0.80.
IcoRating is a machine learning–based system. Compared against human-designed rating systems, IcoRating has two key advantages. (1) Objectivity: a machine learning model involves less prior knowledge about the world, instead learning the causality from the data, in contrast to human-designed systems that require massive involvement of human experts, who inevitably introduce biases. (2) Difficulty of manipulation by unscrupulous actors: the credit rating result is output from a machine learning model through black-box training. This process requires minor human involvement and intervention.
IcoRating can contribute to the cryptocurrency community in two aspects. First, we hope that this work would encourage more efforts invested in designing reliable, automatic and difficult-to-be-manipulated systems to analyze and evaluate the quality of ICO projects. Second, IcoRating can potentially help investors identify scam ICO projects and make rational investment in cryptocurrency.
The rest of this paper is organized as follows: we give a brief outline of cryptocurrencies, blockchains and ICOs in Section 2. We describe the construction of a dataset of ICO projects in Section 3, and provide some basic analysis of the data. In Section 4, we describe the machine learning model we propose。 Experimental results and qualitative analysis are illustrated in Section 5, followed by a short conclusion in Section 6.
2 Cryptocurrencies, Blockchains, and ICOs
In this section, we briefly describe relevant information on cryptocurrencies, blockchains, and ICOs.
Cryptocurrencies
A cryptocurrency is “a digital asset designed to work as a medium of exchange that uses cryptography to secure its transactions”.555Quoted from https://en.wikipedia.org/wiki/Cryptocurrency. Most cryptocurrencies use decentralized control. The first decentralized cryptocurrency is Bitcoin (BTC for short) Nakamoto (2008), created in 2009 by an unknown person or group of people under the name Satoshi Nakamoto. Since the design of BTC, various types of cryptocurrencies have been created, the most well-known of which include Ethereum Dienelt (2016), Ripple Carson (2014), EOS Stanley (2017) and NEO Go (2017).
Blockchains
A cryptocurrency’s transactions are validated by a blockchain. One can think a blockchain as a distributed ledger, which continuously grows and records all transactions between two parties permanently. Each record is called a block, which contains a cryptographic hash pointer that links to a previous block, a timestamp and transaction data. The ledger is owned in a distributed way by all participants, and the record cannot be altered without the alteration of all subsequent blocks of the network. Transactions are broadcast to all nodes in the network. Blockchains use various time-stamping schemes such as proof-of-work Dwork and Naor (1992) or proof-of-stake Vasin (2014).
The concept of blockchain eliminates the risks of data being held centrally: it has no central point of failure and data is transparent to every participant involved.
ICOs
An initial coin offering (ICO)666https://en.wikipedia.org/wiki/Initial_coin_offering is a means of crowdfunding centered around cryptocurrency. In an ICO, crowdfunded cryptocurrency (mostly in the form of tokens) is transferred to investors in exchange for legal tender or other cryptocurrencies. These tokens become functional units of currency that can be exchanged for goods or other cryptocurrencies when the ICO’s funding goal is met.
ICOs provide a crowdfunding opportunity for early-stage projects to avoid the regulations required by venture capitalists, bank and stock exchanges. They also provide investment opportunities beyond venture capital or private equity investments, which have dominated early-stage investment opportunities. On the other hand, because of the lack of regulations, ICOs pose significant risks for investors. Different countries have different regulations on ICOs and cryptocurrencies. For example, the government of the People’s Republic of China banned all ICOs, and the U.S. Securities and Exchange Commission (SEC) indicated that it could have the authority to apply federal securities law to ICOs Higgins (2017), while the government of Venezuela launched its own cryptocurrency called petromoneda.
3 Datasets Construction, Processing and Analysis
We collected information for 2,251 past ICO projects, including the white papers, website information, GitHub repositories at the time of ICO, and founding teams. We obtained the data from various providers including CryptoCompare,777http://cryptocompare.com/ CoinMarketCap888https://coinmarketcap.com/ and CoinCheckup.999http://coincheckup.com/
3.1 Analysis on White Papers
The white paper is a crucial part of an ICO project. It describes how the crowdfunding is intended to work, such as the landscape of the ICO project, how the tokens will be allocated or how the crowdfunded money will be spent. Out of the 2,251 ICO projects, we were able to obtain 1,317 white papers. We transform white paper PDFs to texts using the PDFMiner API.101010https://github.com/euske/pdfminer
| Doc | Ave Word | Std Word | Max Word | Min Word |
|---|---|---|---|---|
| 1,317 | 7,834 | 7,060 | 13,721 | 685 |
| Doc | Ave Sent | Std Sent | Max Sent | Min Sent |
| 1,317 | 953 | 1,434 | 6,228 | 38 |
We show the statistics for ICO white papers in Table 1, including average, standard deviation, maximum and minimum numbers of words and sentences in the white paper. A conspicuous feature of Table 1 is the high variance in the length of white papers, with a maximum of 6,228 sentences and a minimum of 38. More concretely, the number of sentences in 10 randomly sampled white papers is [886, 143, 38, 967, 3379, 6228, 496, 2057, 3075, 298]. Though the length of a white paper does not necessarily reflect the quality of an ICO project, we can see the large variance in content among ICO white papers.
| 1. sample |
| 2. sample |
| 3. for each white paper : |
| (i) sample topic |
| (ii) for each word in document |
| sample |
LDA

We run a Latent Dirichlet Allocation (LDA) model Blei et al. (2003) on the collected white papers. LDA is a generative statistical model that explains text documents with word clusters called “topics” based on word-to-word co-occurrence. Each document is presented as a probabilistic distribution of latent topics, and each latent topic is characterized by a probabilistic distribution over words. The generative process of LDA is shown in Figure 5 and the figure of this process is illustrated in Figure 6.
| topic1 | topic2 | topic3 | topic4 | topic5 | topic6 |
| bet | doctor | jesus | cryptocurrency | purchase | game |
| bets | medical | motherland | hash | consumer | casino |
| gambling | medicalchain | christ | cryptonote | goods | gaming |
| blackjack | health | buddhist | key | wages | gamemaker |
| player | patients | john | crypto | prices | virtual |
| lounge | clinical | christians | security | finance | weapons |
| dicing | alzheimer | mothership | private | deficit | play |
| poker | records | church | scratchpad | pay | gift |
| seed | healthcare | mediation | charitable | transaction | equipment |
| gamble | diabetes | buddha | signature | cost | player |
| Ethbet111111https://ethbet.io/ | Medicalchain121212https://medicalchain.com/en/ | Jesus131313https://jesuscoin.network/ | Tokenbox141414https://tokenbox.io/ | Bitserial151515https://bitserial.io/ | Funfair161616https://funfair.io/ |
| Edgeless171717https://edgeless.io/ | Ai-doctor181818http://aidoc.me/ | Lotos191919https://lotos.network/ | Biblepay | GoldReward202020https://goldreward.io/ | Enjin212121 |
We use collapsed Gibbs sampling and run 100 iterations on the dataset. We show top words for different LDA topics in Table 2, along with the white papers/cryptocurrencies that are assigned to that topic with the highest probability.
We can see a clear semantic domain represented by each topic: ICOs for gambling, games, medical care, religion, machine-networks, cryptography, insurance, etc.
3.2 Founding-Teams
Out of 2,251 ICO projects, we were able to collect the information of 1,230 founding teams. The following passage illustrates the type of descriptions used for founding teams in our dataset:
Justin Sun, born in 1990, master of University of Pennsylvania, bachelor of Peking University, founder and CEO of mobile social application Peiwo and TRON, the former chief representative for Greater China of Ripple. 2011 Asia Weekly Cover People; 2014 Davos Global Shaper; 2015 CNTV new figure of the year; 2017 Forbes Asia 30 under 30 entrepreneurs;2015/2017 Forbes China 30 Under-30s; The Only Millennial Student in the first batch of entrepreneurs at Hupan University, an elite business school established by Jack Ma, the founder of Alibaba Group.
3.2.1 Extracting Features from Bios
We aim to automatically extract the most important characteristics from bios of founding team members. We treat this as an NLP tagging problem Toutanova et al. (2003); Huang et al. (2015); Miller et al. (2004); Tjong Kim Sang and De Meulder (2003). Most tagging models are supervised or semi-supervised approaches, which require first designing annotation guidelines (including selecting an appropriate set of types to annotate), then annotating a large corpus.
We define 5 categories of tags: born-date, university, degree, companies and awards received. We annotated 500 bios of different people and split the dataset into 0.8/0.1/0.1 for training, dev and testing. Features we employ include:
-
•
Word level features:
-
–
Unigrams, Bigrams
-
–
Word window size of 3
-
–
POS features
-
–
NER features
-
–
-
•
Letter level word features
-
–
Starts with a capital letter?
-
–
Has all capital letters?
-
–
Has all lower case letters?
-
–
Has non initial capital letters?
-
–
Has numbers?
-
–
Is all numbers?
-
–
Letter prefixes and suffixes
-
–
-
•
Dictionaries
-
–
A dictionary of world companies. We use Freebase API222222https://developers.google.com/freebase/v1/ to augment the dataset by using synonyms.
-
–
A dictionary of world universities. Freebase API is used as well.
-
–
POS features and NER features are pre-extracted using the Stanford NLP toolkit Toutanova et al. (2003); Manning et al. (2014).
We use a CRF-based tagging model Toutanova et al. (2003); Huang et al. (2015); Lafferty et al. (2001). Accuracy for each category is shown in Table 3.
| born-date | 0.952 |
| university | 0.985 |
| degree | 0.892 |
| company | 0.912 |
| award | 0.842 |
| all | 0.947 |
4 IcoRating: A supervised-learning model
In this section, we detail the deep learning model for ICO rating. The model uses very little prior knowledge about ICO projects, but rather learns the importance of various features from the collected real-world dataset.
4.1 IcoRating, a supervised-learning-based rating model
The model we use here is a supervised learning model. In a standard supervised-learning setting, we wish to find a model , that maps an input to an output :
| (1) |
Input
The input is an ICO project, which includes different aspects of its publicly available information.
Output
The output is a binary variable indicating whether an ICO project is a scam. We use a learning model to predict the proportional price change of any given currency after a year of its ICO. Out of the collected 2,251 projects, we are able to collect the information of 1,482 projects with known price history and ICOs conducted at least one year before this work was done.
At training time, we use the price change of an ICO project in a year as training signals, trying to predict this price change given its ICO information. The predicting function is learned by maximizing the distance between the predicted price change and the gold-standard price change:
| (2) | ||||
where , and price(t) denotes the price of a currency after one year of its ICO.
At test time, we can use to predict the price change, and think a project is a scam if the predicted price is less than percent of its ICO price:
| (3) |
can be set as requested. In this paper it is set to 0.01, 0.1 and 1.
We split the obtained ICO projects into training, dev, and testing in a 0.8/0.1/0.1 ratio. For each value of , an ICO project in the training dataset is paired with a gold-standard label . is a binary value, indicating whether the project is a scam project. The value of can be different with respect to different split bar .
To note, it is inevitably easier to use the distance between predicted prices and gold-standard prices for evaluation. But the value of this distance looks more obscure to the readers/investors. We thus transform the predicted price change to a more interpretable binary value , in which case the evaluation can be transformed to whether a model is able to correctly predict a scam ICO project.
4.2 Features
One of the key parts in supervised learning models is how to represent the input . In this subsection, we will detail how we transform each aspect of an ICO (e.g., white paper, founding team, website) into a machine-readable vector .
4.2.1 White papers
We transform each white paper into a vector representation using deep learning methods. Each white paper consists a sequence of sentences , , where denotes the number of sentences in the current white paper . Each sentence consists of a sequence of words , , where denotes the number of words in sentence . Each word is associated with a vector .
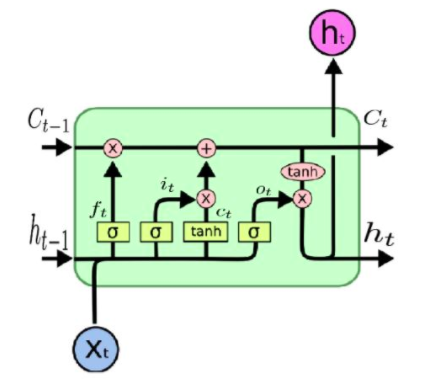
We adopt a hierarchical LSTM model Serban et al. (2017); Li et al. (2015b) to map a white paper to a vector representation . We first obtain representation vectors at the sentence level by passing the vectors for each sentence’s words through four layers of LSTMs Hochreiter and Schmidhuber (1997); Gers et al. (1999). An LSTM associates each timestep with an input, memory and output gate, respectively denoted as , and . For notational clarity, we distinguish and , where denotes the vector for individual text units (e.g., words or sentences) at time step while denotes the vector computed by the LSTM model at time by combining and . denotes the sigmoid function. The vector representation for each time step is given by:
| (4) |
| (5) |
| (6) |
where The vector output at the ending time-step is used to represent the entire sentence as
| (7) |
The representation for the current document/paragraph is obtained by sum over the presentation of all its containing sentences:
| (8) |
The best values for the LSTM parameters are unknown. The most straightforward way to learn the LSTM parameters is directly through the objective function in Eq. 2. Unfortunately, training an LSTM model on a few thousand examples can easily lead to overfitting. We thus adopt an unsupervised approach, in which we train a skip-thought model Kiros et al. (2015); Tang et al. (2017). The skip-thought model is an encoder-decoder model based on sequence-to-sequence generation techniques Sutskever et al. (2014); Luong et al. (2015); Chung et al. (2014). The parameters of the LSTM are trained to maximize the predicted probability of each word in neighboring sentences given the current sentence. Our skip-thought model is exactly the same as Kiros et al. (2015) with the only difference being that word embeddings are initialized using 300-dimensional Glove vectors Pennington et al. (2014). Given a pre-trained auto-encoder, we use the encoder to obtain sentence level representations using Eqs. 3, 4 and 5, then obtain document-level representations using Eq. 8.
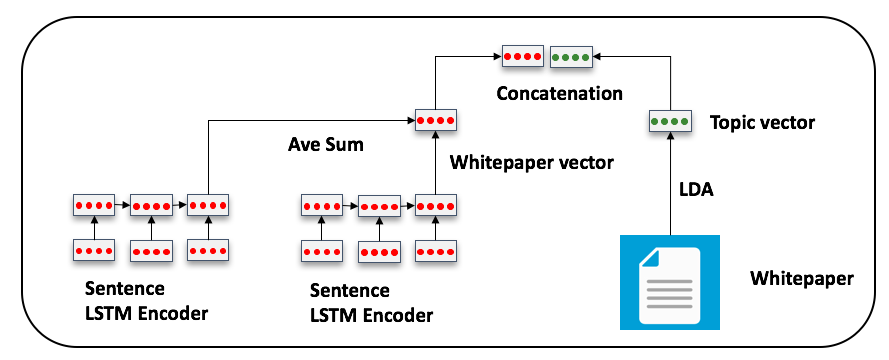
We also use the topic weights from the LDA model as white paper features. Let be the number of LDA topics, which is 50 in this work. Each document can be represented as a vector describing a multinomial distribution over the 50 topics. We concatenate the deep learning vector and the LDA vector. The entire process is illustrated in Figure 7.
4.3 Founding Teams
We map the founding team of an ICO project to the following features:
Neural Network Features
Again, we use a hierarchical neural model to map the bios of founding teams to a neural vector representation.
Manually Designed Features
For each person, we obtained his or her full name, fed the name into the Google+ API,252525https://developers.google.com/+/api/ and crawled the information. One key challenge here is that one name can be mapped to multiple Google+ accounts. We assume a person’s name is correctly mapped to a Google+ account if the company extracted from this person’s bio can be found in their Google+ account.
Based on the information extracted (both from Section 3.2 and crawled Google+ accounts), we include the following features:
-
•
Whether founding team’s bios can be found
-
•
Degree
-
•
Company the person previously works for
-
•
Age
-
•
Number of jobs the person had in the past 3 years before ICO
-
•
Whether the person is involved in other ICO projects
4.4 Project Websites
We crawled the websites of each project and were able to retrieve information from 1,087 project websites. We map the website text to a vector representation using a hierarchical LSTM as described above. We also use a binary feature indicating whether an ICO project has a website.
4.5 GitHub Accounts
We crawled the GitHub repository (if it exists) of each ICO project. A binary variable indicating whether an ICO project has a GitHub repository is included in the feature vector. We handle GitHub README files similarly to the white papers, using an encoder-decoder model to map the file to a vector representation. Additional features include the number of branches, the number of commits, the total lines of code, and the total number of files. We only consider the version before the time of ICO.
4.6 Other Features
Additional features we consider include:
-
•
Platform, e.g., ETH.
-
•
Total supply.
-
•
Unlimited or hard cap: an unlimited cap allows investors to send unlimited funding to the project’s ICO wallet.
4.7 Regression
By concatenating white paper features, founding team features, website features and GitHub features, each ICO project is associated with a vector . The predicted price change is given by:
| (9) |
is the weight vector learned through Eq. 2 with stochastic gradient decent Bottou (2010) using with batch size set to 30. regularization is added. The number of iterations is treated as a hyperparameter to be tuned on the dev set.
5 Experiments
We present experimental results and qualitative analysis in this section.
5.1 Results
| Feature type | Precision | Recall | F1 |
|---|---|---|---|
| white paper | 0.26 | 0.92 | 0.41 |
| GitHub | 0.24 | 0.93 | 0.38 |
| founding team | 0.24 | 0.72 | 0.36 |
| website | 0.22 | 0.75 | 0.34 |
| white paper + | 0.34 | 0.93 | 0.49 |
| GitHub | |||
| white paper + | 0.36 | 0.94 | 0.52 |
| GitHub + | |||
| founding team | |||
| white paper + | 0.37 | 0.95 | 0.53 |
| GitHub + | |||
| founding team + | |||
| website + | |||
| other features |
| Feature type | Precision | Recall | F1 |
|---|---|---|---|
| white paper | 0.62 | 0.75 | 0.68 |
| GitHub | 0.56 | 0.76 | 0.64 |
| founding team | 0.41 | 0.72 | 0.52 |
| website | 0.42 | 0.68 | 0.52 |
| white paper + | 0.70 | 0.80 | 0.75 |
| GitHub | |||
| white paper + | 0.72 | 0.82 | 0.76 |
| GitHub + | |||
| founding team | |||
| white paper + | 0.73 | 0.84 | 0.78 |
| GitHub + | |||
| founding team + | |||
| website + | |||
| other features |
| Feature type | Precision | Recall | F1 |
|---|---|---|---|
| white paper | 0.72 | 0.69 | 0.70 |
| GitHub | 0.74 | 0.68 | 0.71 |
| founding team | 0.65 | 0.60 | 0.62 |
| website | 0.63 | 0.59 | 0.61 |
| white paper + | 0.77 | 0.74 | 0.75 |
| GitHub | |||
| white paper + | 0.80 | 0.76 | 0.78 |
| GitHub + | |||
| founding team | |||
| white paper + | 0.83 | 0.77 | 0.80 |
| GitHub + | |||
| founding team + | |||
| website + | |||
| other features |
Tables 4, 5 and 6 present results for scam ICO project identification with respect to different values of scam bar . As the value of increases from 0.01 to 0.1, then to 1, the proportion of the scam projects increases, giving progressively higher precision and lower recall. The white paper and GitHub repository are the most important two classes of features, achieving approximate F1 scores of 0.7 when is set to 0.1 and 0.5. By adding more features, we are able to get progressively better precision and recall. The model achieves 0.83 precision, 0.77 recall and 0.80 F1 score in predicting scam ICO projects in the setting, when all features are considered.
5.2 Qualitative Analysis
We need to rationalize the output from the model. Deep learning models are hard to be rationalized directly Lei et al. (2016); Mahendran and Vedaldi (2015); Weinzaepfel et al. (2011); Vondrick et al. (2013). This is because neural network models operate like a black box: using vector representations (as opposed to humaninterpretable features) to represent inputs, and applying multiple layers of non-linear transformations.
Various techniques have been proposed to make neural models interpretable Koh and Liang (2017); Montavon et al. (2017); Mahendran and Vedaldi (2015); Li et al. (2015a, 2016). The basic idea of these models is to build another learning or visualization model on top of a pre-trained neural model to for interpretation. We adopt two widely used methods for neural model visualization purposes:
First-derivative Saliency
has been widely used for visualizing and understanding neural models Montavon et al. (2017); Simonyan et al. (2013); Li et al. (2015a). The basic idea of this saliency method is to compute the contribution of each cell/feature/representation to the final decision using the derivative of the final decision with respective to an input feature.
More formally, for a supervised model, an input is associated with a class label . A trained neural model associates the pair (x, y) with a score . The saliency of any feature is given by:
| (10) |
Suppose that one aspect (denoted by , e.g., whitepaper) of an ICO project is represented by a vector vector(). For example, the vector for a whitepaper is the concatenation of its topic vector output from LDA and the neural vector output from the hierarchical LSTM model. The saliency of the aspect is thus the average sum of its containing vector units:
| (11) |
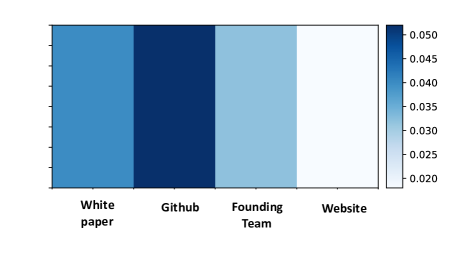
The saliency of different four aspects are illustrated in Figure 9. As can be seen, whitepaper and github are the most salient aspects.
Feature Erasing
One problem with the first-derivative saliency method is that it is able to show which feature is important (in other words, salient), but cannot tell how positively or negatively a particular feature contributes to a decision. We thus adopt the representation erasing strategy for neural model visualization, which has been used in a variety of previous work Li et al. (2016). The basic idea of this method is as follows: how much a feature/cell/representation contributes to a decision is determined by the negative effect of erasing pieces of the representation.
More formally, for a pre-trained supervised model, denotes the score that the label of scam project is assigned to the input . denotes the score that the label of scam project is assigned to the input with feature being erased. If is a significant feature that leads the input ICO project to be a scam, should be larger than . Let denote the influence of feature on class (a scam ICO project), which is given as follows:
| (12) |
A negative value of means feature positively contributes to the input being thought as a scam project. By computing the derivative with respect to each LDA topic, we are also able to rank LDA topics by the risking of being a scam. We manually labeled 10 LDA topics, each of which has a clear meaning. We compute the influence score of each human-defined topic, as can be seen in Table 7. ICOs on gaming, gambling and entertainment are more likely to scams than exchange, payment and smart contract.
| Topic | Score |
|---|---|
| Gaming | -1.62 |
| Gambling | -1.23 |
| Entertainment | -1.17 |
| Religion | -0.81 |
| Medical Care | -0.23 |
| Insurance | -0.12 |
| Payments | -0.02 |
| Exchange | 0.14 |
| Smart Contract | 0.22 |
| Cryptography | 0.28 |
6 Conclusion
ICOs have become one of the most controversial topics in the financial world. For legitimate projects, they provide fairness in crowdfunding, but a lack of transparency, technical understanding and legality gives unscrupulous actors an incentive to launch scam ICO projects, bringing significant loss to individual investors and making the world of cryptofinance fraught with danger.
In this paper, we proposed the first machine learning–based scam-ICO identification system. We find that a well designed neural network system is able to identify subtle warning signs hidden below the surface. By integrating different types of information about the ICO, the system is able to predict whether the price of an cryptocurrency will go down. We hope the proposed system will help investors identify scam ICO projects and attract more academic and public-sector work investigating this problem.
References
- Blei et al. (2003) David M Blei, Andrew Y Ng, and Michael I Jordan. 2003. Latent Dirichlet allocation. Journal of Machine Learning Research 3(Jan):993–1022.
- Bottou (2010) Léon Bottou. 2010. Large-scale machine learning with stochastic gradient descent. In Proceedings of COMPSTAT’2010, Springer, pages 177–186.
- Carson (2014) Biz Carson. 2014. Two us banks are ready to embrace the ripple protocol, allowing instant global money transfers. Gigaom .
- Chohan (2017) Usman Chohan. 2017. Initial coin offerings (icos): Risks, regulation, and accountability .
- Chung et al. (2014) Junyoung Chung, Caglar Gulcehre, KyungHyun Cho, and Yoshua Bengio. 2014. Empirical evaluation of gated recurrent neural networks on sequence modeling. arXiv preprint arXiv:1412.3555 .
- Dienelt (2016) J Dienelt. 2016. Understanding ethereum. New York, NY: CoinDesk .
- Dwork and Naor (1992) Cynthia Dwork and Moni Naor. 1992. Pricing via processing or combatting junk mail. In Annual International Cryptology Conference. Springer, pages 139–147.
- Gers et al. (1999) Felix A Gers, Jürgen Schmidhuber, and Fred Cummins. 1999. Learning to forget: Continual prediction with LSTM .
- Go (2017) Jorge Go. 2017. Neo: The vanguard of a digitized china. Titan Digital Asset Group .
- Higgins (2017) Stan Higgins. 2017. Sec: Us securities laws ’may apply’ to token sales. New York, NY: CoinDesk .
- Hochreiter and Schmidhuber (1997) Sepp Hochreiter and Jürgen Schmidhuber. 1997. Long short-term memory. Neural Computation 9(8):1735–1780.
- Huang et al. (2015) Zhiheng Huang, Wei Xu, and Kai Yu. 2015. Bidirectional LSTM-CRF models for sequence tagging. arXiv preprint arXiv:1508.01991 .
- Kiros et al. (2015) Ryan Kiros, Yukun Zhu, Ruslan R Salakhutdinov, Richard Zemel, Raquel Urtasun, Antonio Torralba, and Sanja Fidler. 2015. Skip-thought vectors. In Advances in Neural Information Processing Systems. pages 3294–3302.
- Koh and Liang (2017) Pang Wei Koh and Percy Liang. 2017. Understanding black-box predictions via influence functions. arXiv preprint arXiv:1703.04730 .
- Lafferty et al. (2001) John Lafferty, Andrew McCallum, and Fernando CN Pereira. 2001. Conditional random fields: Probabilistic models for segmenting and labeling sequence data .
- Lei et al. (2016) Tao Lei, Regina Barzilay, and Tommi Jaakkola. 2016. Rationalizing neural predictions. arXiv preprint arXiv:1606.04155 .
- Li et al. (2015a) Jiwei Li, Xinlei Chen, Eduard Hovy, and Dan Jurafsky. 2015a. Visualizing and understanding neural models in nlp. arXiv preprint arXiv:1506.01066 .
- Li et al. (2015b) Jiwei Li, Minh-Thang Luong, and Dan Jurafsky. 2015b. A hierarchical neural autoencoder for paragraphs and documents. arXiv preprint arXiv:1506.01057 .
- Li et al. (2016) Jiwei Li, Will Monroe, and Dan Jurafsky. 2016. Understanding neural networks through representation erasure. arXiv preprint arXiv:1612.08220 .
- Luong et al. (2015) Minh-Thang Luong, Hieu Pham, and Christopher D Manning. 2015. Effective approaches to attention-based neural machine translation. arXiv preprint arXiv:1508.04025 .
- Mahendran and Vedaldi (2015) Aravindh Mahendran and Andrea Vedaldi. 2015. Understanding deep image representations by inverting them .
- Manning et al. (2014) Christopher Manning, Mihai Surdeanu, John Bauer, Jenny Finkel, Steven Bethard, and David McClosky. 2014. The Stanford CoreNLP natural language processing toolkit. In Proceedings of the 52nd Annual Meeting of the Association for Computational Linguistics: System Demonstrations. pages 55–60.
- Miller et al. (2004) Scott Miller, Jethran Guinness, and Alex Zamanian. 2004. Name tagging with word clusters and discriminative training. In Proceedings of the Human Language Technology Conference of the North American Chapter of the Association for Computational Linguistics: HLT-NAACL 2004.
- Montavon et al. (2017) Grégoire Montavon, Wojciech Samek, and Klaus-Robert Müller. 2017. Methods for interpreting and understanding deep neural networks. Digital Signal Processing .
- Nakamoto (2008) Satoshi Nakamoto. 2008. Bitcoin: A peer-to-peer electronic cash system .
- Pennington et al. (2014) Jeffrey Pennington, Richard Socher, and Christopher Manning. 2014. Glove: Global vectors for word representation. In Proceedings of the 2014 conference on empirical methods in natural language processing (EMNLP). pages 1532–1543.
- Serban et al. (2017) Iulian Vlad Serban, Alessandro Sordoni, Ryan Lowe, Laurent Charlin, Joelle Pineau, Aaron C Courville, and Yoshua Bengio. 2017. A hierarchical latent variable encoder-decoder model for generating dialogues. In AAAI. pages 3295–3301.
- Simonyan et al. (2013) Karen Simonyan, Andrea Vedaldi, and Andrew Zisserman. 2013. Deep inside convolutional networks: Visualising image classification models and saliency maps. arXiv preprint arXiv:1312.6034 .
- Stanley (2017) Aaron Stanley. 2017. Unpacking the big promises behind a possible blockchian contender. New York, NY: CoinDesk .
- Sutskever et al. (2014) Ilya Sutskever, Oriol Vinyals, and Quoc V Le. 2014. Sequence to sequence learning with neural networks. In Advances in neural information processing systems. pages 3104–3112.
- Tang et al. (2017) Shuai Tang, Hailin Jin, Chen Fang, Zhaowen Wang, and Virginia R de Sa. 2017. Rethinking skip-thought: A neighborhood based approach. arXiv preprint arXiv:1706.03146 .
- Tjong Kim Sang and De Meulder (2003) Erik F Tjong Kim Sang and Fien De Meulder. 2003. Introduction to the CoNLL-2003 shared task: Language-independent named entity recognition. In Proceedings of the Seventh Conference on Natural Language Learning at HLT-NAACL 2003-Volume 4. Association for Computational Linguistics, pages 142–147.
- Toutanova et al. (2003) Kristina Toutanova, Dan Klein, Christopher D Manning, and Yoram Singer. 2003. Feature-rich part-of-speech tagging with a cyclic dependency network. In Proceedings of the 2003 Conference of the North American Chapter of the Association for Computational Linguistics on Human Language Technology-Volume 1. Association for Computational Linguistics, pages 173–180.
- Vasin (2014) Pavel Vasin. 2014. Blackcoin’s proof-of-stake protocol v2. URL: https://blackcoin. co/blackcoin-pos-protocol-v2-whitepaper. pdf .
- Vondrick et al. (2013) Carl Vondrick, Aditya Khosla, Tomasz Malisiewicz, and Antonio Torralba. 2013. Hoggles: Visualizing object detection features. In Computer Vision (ICCV), 2013 IEEE International Conference on. IEEE, pages 1–8.
- Weinzaepfel et al. (2011) Philippe Weinzaepfel, Hervé Jégou, and Patrick Pérez. 2011. Reconstructing an image from its local descriptors. In Computer Vision and Pattern Recognition (CVPR), 2011 IEEE Conference on. IEEE, pages 337–344.