Volvox barberi flocks, forming near-optimal,
two-dimensional,
polydisperse lattice packings
Abstract
Volvox barberi is a multicellular green alga forming spherical colonies of 10000-50000 differentiated somatic and germ cells. Here, I show that these colonies actively self-organize over minutes into “flocks” that can contain more than 100 colonies moving and rotating collectively for hours. The colonies in flocks form two-dimensional, irregular, “active crystals”, with lattice angles and colony diameters both following log-normal distributions. Comparison with a dynamical simulation of soft spheres with diameters matched to the Volvox samples, and a weak long-range attractive force, show that the Volvox flocks achieve optimal random close-packing. A dye tracer in the Volvox medium revealed large hydrodynamic vortices generated by colony and flock rotations, providing a likely source of the forces leading to flocking and optimal packing.
Introduction
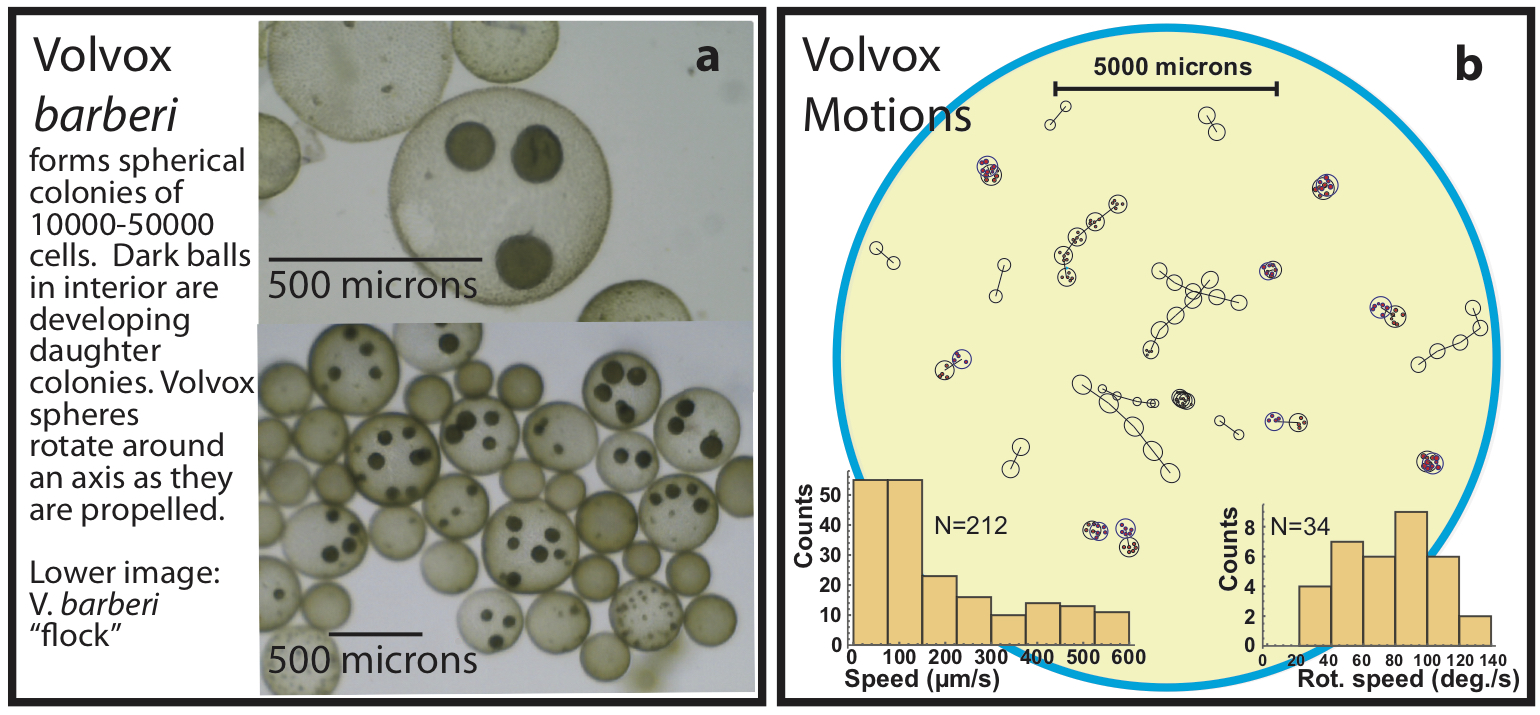
The remarkable multicellular green alga Volvox barberi Kirk (2005) forms spherical colonies of 10,000 to 50,000 cells embedded in a glycol-protein based extra cellular matrix (ECM) and connected by cytoplasmic bridges that may have a role in the transport of nutrients and information Hoops et al. (2006). Colonies have a surface population of somatic cells that specialize in flagellar beating, and a smaller population of germ cells that undergo cell divisions to form daughter colonies. Each V. barberi somatic cell bears two apical flagella projecting outside the colony boundary, and a chloroplast to enable photosynthesis. The synchronized beating of the flagella of the somatic cells moves the colony forward in a spiral motion – the colony advances while rotating around a fixed, body-centered axis Kirk (2005). Anton van Leeuwenhoek first described Volvox in 1700, and Linnaeus named them for their hypnotic rolling motion in 1758. Volvox is remarkable for the collective behavior and coordination shown by the large number of individual cells within each colony, and is a model organism for studying the transition from uni-cellularity to multi-cellularity with differentiated cell types Kirk (2005); Herron (2016); Matt and Umen (2016). Strikingly, the coordination of the many cells in a Volvox colony may be based on hydrodynamic interactions only Brumley et al. (2014, 2015) without chemical signaling between cells.
Collective behaviors are mechanisms used by groups of living organisms to support critical functions including self-defense, mating, and predation. These behaviors occur when a whole group reacts together by means of intercommunication or signaling (see examples in Camazine (2003)). Examples of collective behavior, at the organismal level, include migration of populations and congregation of individuals for protection, as seen in flocking by birds and schooling by fish (see, e.g., Camazine (2003)). Microorganisms can also show collective behavior (see, e.g., Drescher et al. (2009); Petroff et al. (2015) and references therein) but their interactions are often dominated by viscous forces (e.g., fluid drag) unlike larger organisms which are dominated by inertial forces. Here, I show that V. barberi colonies, which are themselves composed of many individual cells acting together, show collective behavior at a higher level of organization. Entire colonies can dynamically gather into large populations that move together, even while individual colonies can continue to rotate separately. When such V. barberi flocks form, the colonies aggregate into geometric lattices.
In mathematics, objects are considered optimally packed when they gather so that as many fit into a given space as possible. Optimal packing varies greatly with the shape and size of objects, and with the number of dimensions. For example, optimal packing of equal-sized squares in a two-dimensional space places them next to each other column by column, row by row. For circles of the same size, optimal packing forms an equilateral triangular lattice, i.e., lines connecting the centers of touching circles form equilateral triangles (see Conway and Sloane (2013)). In three-dimensional space, equal-sized cubes can stack tightly into larger blocks while uniform spheres pack into a face-centered cubic lattice Hales (2005). In other cases, e.g. if circles (in 2d) or spheres (in 3d) are polydisperse, that is, if they have varying sizes, the best packing is not known, but numerical simulations have shown that random close-packed spheres achieve a packing that is nearly optimal Torquato and Stillinger (2010). I show here that V. barberi flocks have a log-normal distribution of colony radii, and form lattices which are nearly identical structurally to random close-packings in molecular dynamics simulations of weakly-attracting spheres with the same radius distribution. The characteristic feature of both the Volvox and simulation lattices is a log-normal distribution of lattice vertex angles. This shows that Volvox barberi gather into flocks that are near-optimally packed for their polydisperse radius distribution.
Results
Volvox barberi colonies gather into large flocks
Samples of V. barberi were placed in culture wells and imaged every second using a high-resolution camera in time-lapse series (see Methods). The motile somatic cells of each colony were organized in a spherical external matrix ranging in diameter from to (Fig. 1a). These colonies moved very quickly, at speeds of up to (Fig. 1b). This meant that flagellar beating by the somatic cells could move Volvox colonies by more than a body length each second, the equivalent of 300 km/h for a Boeing 747 jet plane. While swimming, individual colonies rotated along a body-centered axis. Rotational speeds were also observed to be very high, as much as degrees/s (Fig. 1b). Many colonies moved and rotated individually, but sometimes gathered into remarkable congregations consisting of more than a hundred colonies arranged in stable geometric lattices moving and rotating collectively within the medium (Fig. 1a, bottom). Individual colonies often continued to rotate separately within these lattices indicating that colonies remained independent, and were not simply stuck or mechanically attached. This new form of collective organization can be termed a “flock”, recalling collective behaviors in animals like birds and fish. Further experiments were carried out to characterize the aggregation dynamics and structure of this new form of micro-organismal self-organization.
Aggregation in V. barberi cultures
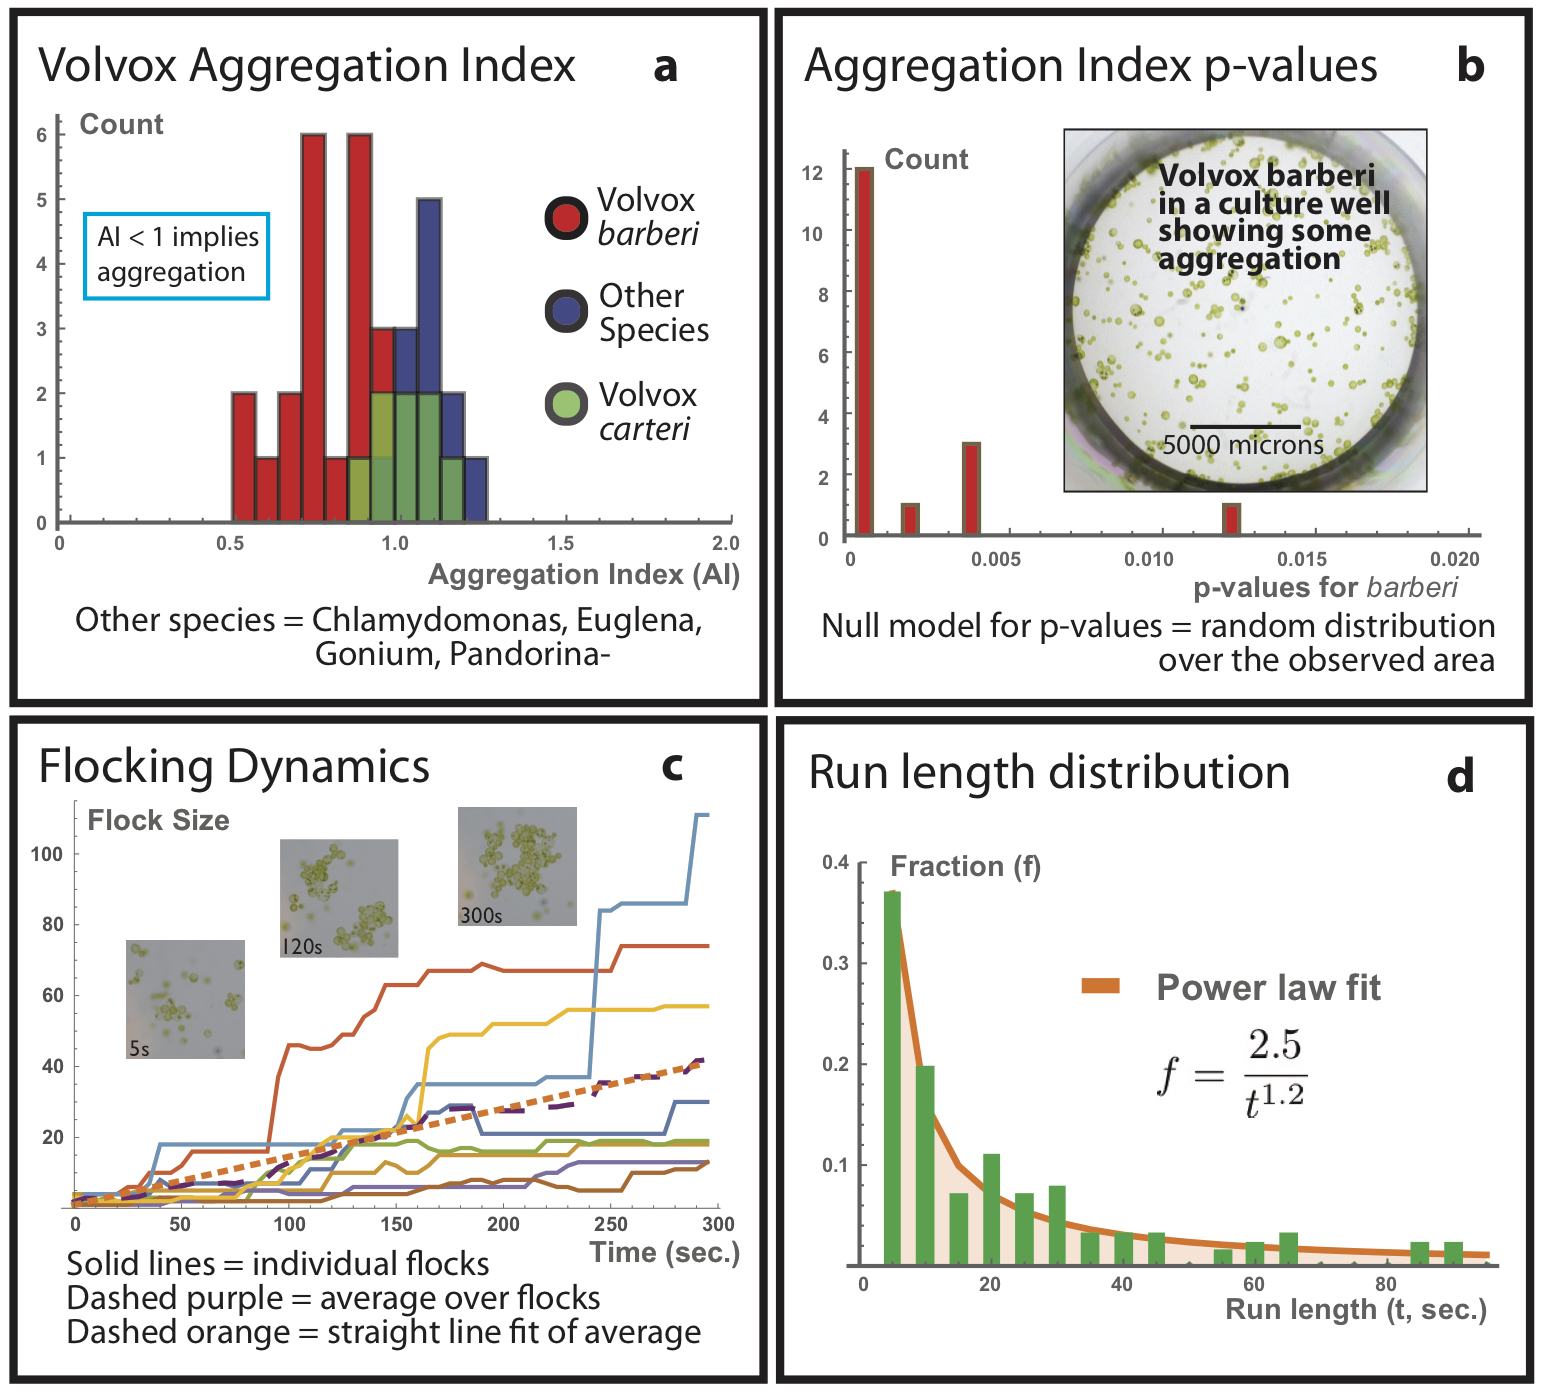
First, the Clark-Evans Aggregation Index (AI) Clark and Evans (1954) was applied to test whether V. barberi colonies in culture wells that did not develop full-fledged flocks were nevertheless attracting each other to some degree. The Clark-Evans index compares the average distance between nearest neighbors in a sample to the expected nearest-neighbor distance if the organization is random (see Methods). Thus, implies aggregation, implies random organization, and implies a more evenly spaced, or dispersed, distribution. Fig. 2a compares the measured AI values for samples of Volvox barberi, and additional species: Volvox carteri, representatives of two other colonial volvocine genera (Gonium pectorale and Pandorina morum), one unicellular volvocine (Chlamydomonas reinhardi) and one unicellular, non-volvocine protist (Euglena gracilis). For V. barberi the AI values were mostly much less than 1, suggesting a strong tendency for the colonies to group together. By contrast, the V. carteri AI values clustered around 1, suggesting a random organization, while the other species generally had AI values slightly greater than 1, suggesting a somewhat more even spacing. Results for the other species confirm that aggregation in V. barberi is not simply a consequence of the experimental setup. Clark and Evans also provided a formula to compute a p-value measuring the probability that a random organization would result in a sample with an AI value as measured or more extreme (see Methods). Almost all the p-values for barberi were less than (Fig. 2b) implying that the results did not arise by chance.
Dynamics
Some samples continued to show strong aggregation over extended periods of time, and eventually gathered into large two-dimensional sheets – flocks. The dynamics of the flocking process were measured using time-lapse photography (see Methods). Over 300 seconds period, flocks changed in shape and size, starting at 2-4 colonies per flock and growing to sizes above 100 (Fig. 2c). The fraction of run-lengths (seconds of constant flock size) of duration was well described by a power law as (determined by a least-squares fit, Fig. 2d). During periods of growth, individual colonies joined the flock or whole flocks joined together to make a single, bigger, flock. Occasionally, individual colonies broke from the main flock to make space for another colony, and move to another location along the perimeter of the flock. On average, flocks grew at a rate of 0.13 Volvox colonies per second. Once a large flock had formed it could persist for hours before separating again into individual colonies.
Geometry of large flocks
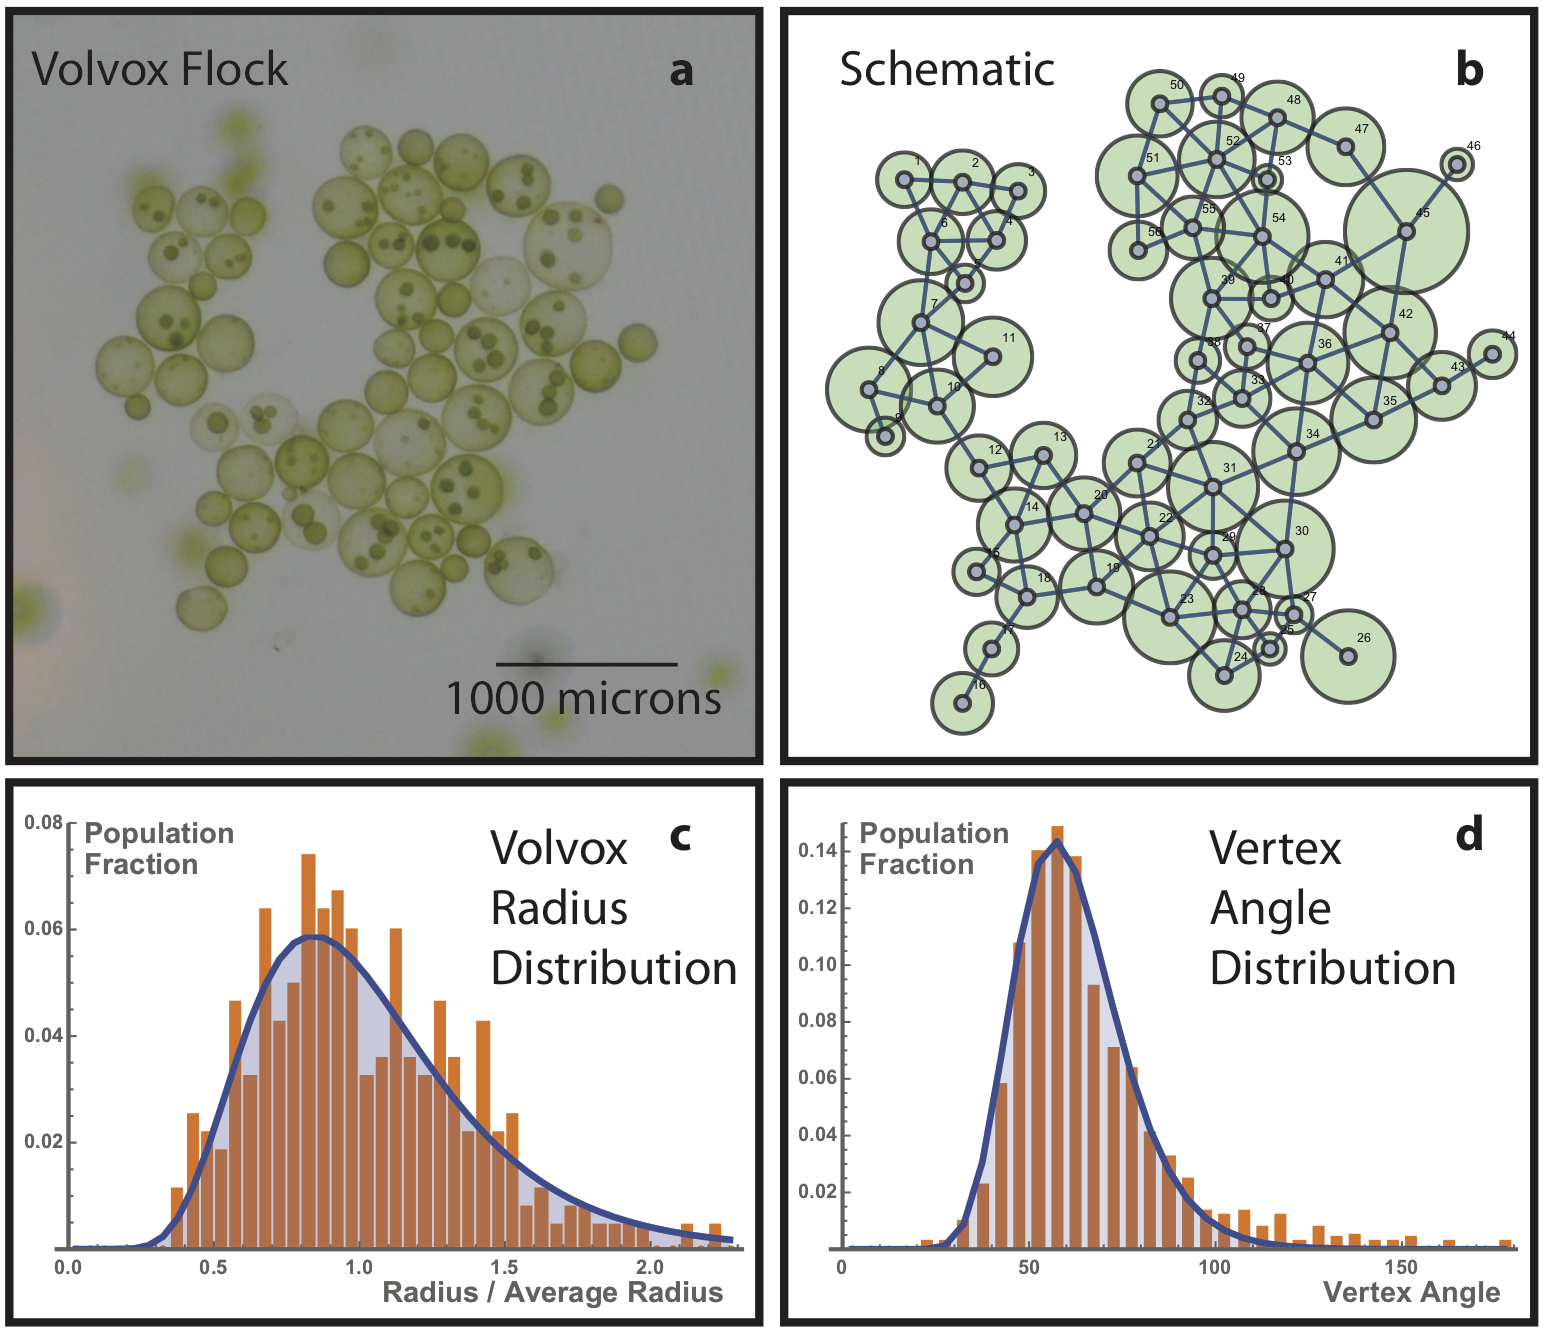
As flocks grew, they formed fixed, almost crystalline, two-dimensional lattices whose structure remained stable despite the overall motion of the flock and the separate rotations of individual colonies in it (Fig. 3a). To characterize the geometry of these lattices, a contact network was constructed – a lattice formed by points at the centers of Volvox colonies with lines connecting touching pairs (Fig. 3b). The contact diagram is closely related to the Delaunay tessellation of packed spheres, and simply removes lines in the tessellation that do not run between touching elements. Contact networks are known to be important in determining when a packing of spheres is rigid Torquato and Stillinger (2010). In the contact networks of Volvox flocks most lattice cells were triangular, with the occasional appearance of other polygons (such as quadrilaterals and pentagons). As seen in Fig. 3b, the Volvox were polydisperse (i.e. have varying radii) which affects the lattice structure. The distribution of the relative radius (x = radius/average radius) was skewed towards large values and was well-described by a log-normal function (Fig. 3c; see Methods). Similarly, the distribution of angles at vertices in the contact network was skewed towards larger angles and was also well-described by a log-normal function (Fig. 3d). When viewed with the naked eye, colonies in Volvox flocks seemed as tightly organized as possible.
Optimal two-dimensional polydisperse sphere packing in Volvox flocks
Optimal packing is the property of objects being as tightly organized into a given space as possible, e.g., packing the most oranges into a crate. Optimal packing of objects depends on their size and shape distributions and the number of dimensions in which they are assembled. Although Volvox are three-dimensional, their flocks formed two-dimensional sheets, so the relevant packing problem is for circles (Volvox cross-sections). However, even in two dimensions the optimal packing of circles of two or more sizes is unknown. Random close-packing achieves an excellent approximation to the optimum Torquato and Stillinger (2010).
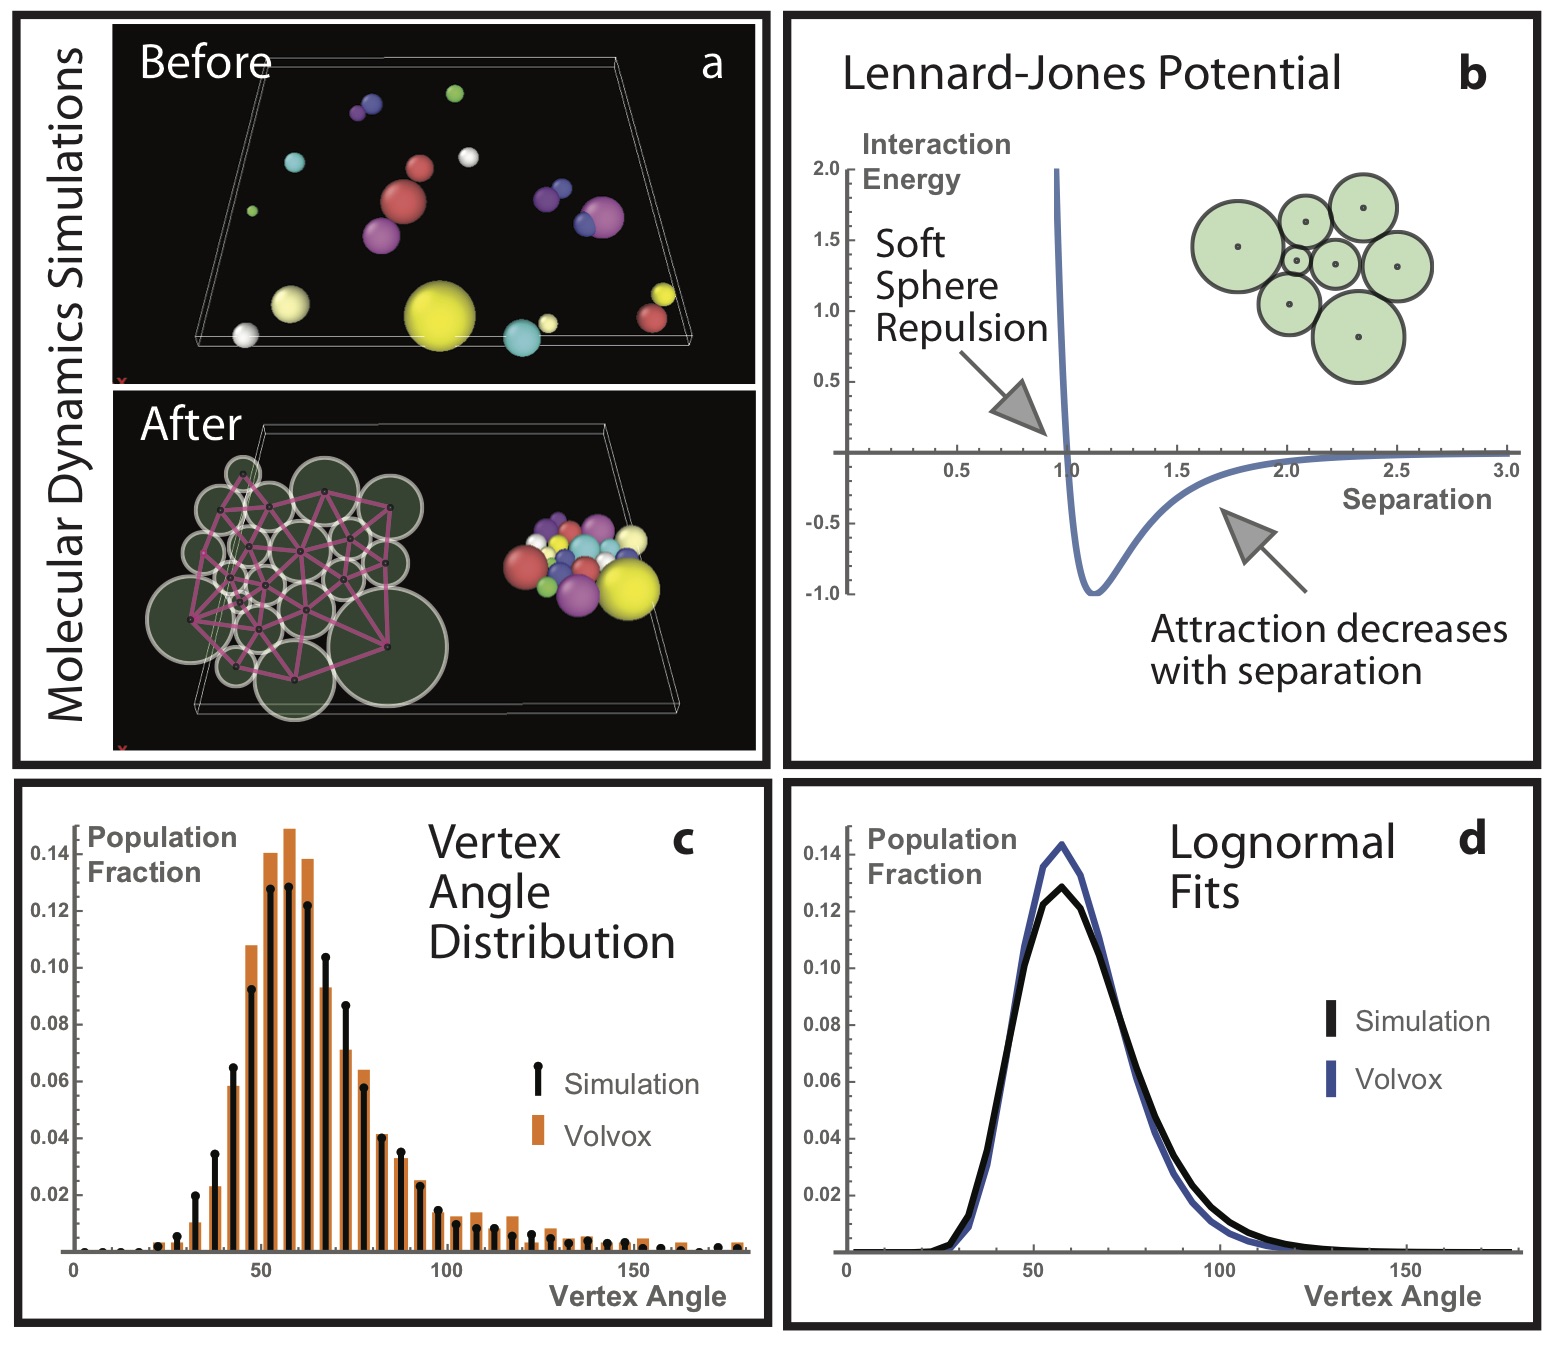
To determine the random close-packed organization of spheres with diverse sizes like Volvox (Fig. 3c), a molecular dynamics simulation was constructed (see Methods). Each simulation was initialized with randomly placed spheres matched to the size distribution of each flock (Fig. 4a, Before), and allowed the spheres to interact via weak pairwise long-range attractive forces determined by Lennard-Jones potentials (Fig. 4b; Methods). At short distances the spheres experienced repulsion. Pairs attained their lowest energy when they were separated by the sum of their radii. These soft spheres moved in two dimensions with random initial velocities and were slowly cooled by the simulation software so that their mutual attraction settled them into a packed configuration (Fig. 4a, After). The resulting angle distribution for the contact diagrams of the jammed final configurations matched the Volvox angle distribution (Fig. 4c). This was confirmed by fitting a log-normal curve to the simulation angles – the fit parameters (Fig. 4d caption) were almost identical to the parameters of the fit to the Volvox angles (Fig. 3d, caption). This suggests that Volvox barberi flocks achieve random-close packing, which in general gives the closest known approximation tooptimal packing of polydisperse spheres.
Volvox vortices: a candidate mechanism for flocking
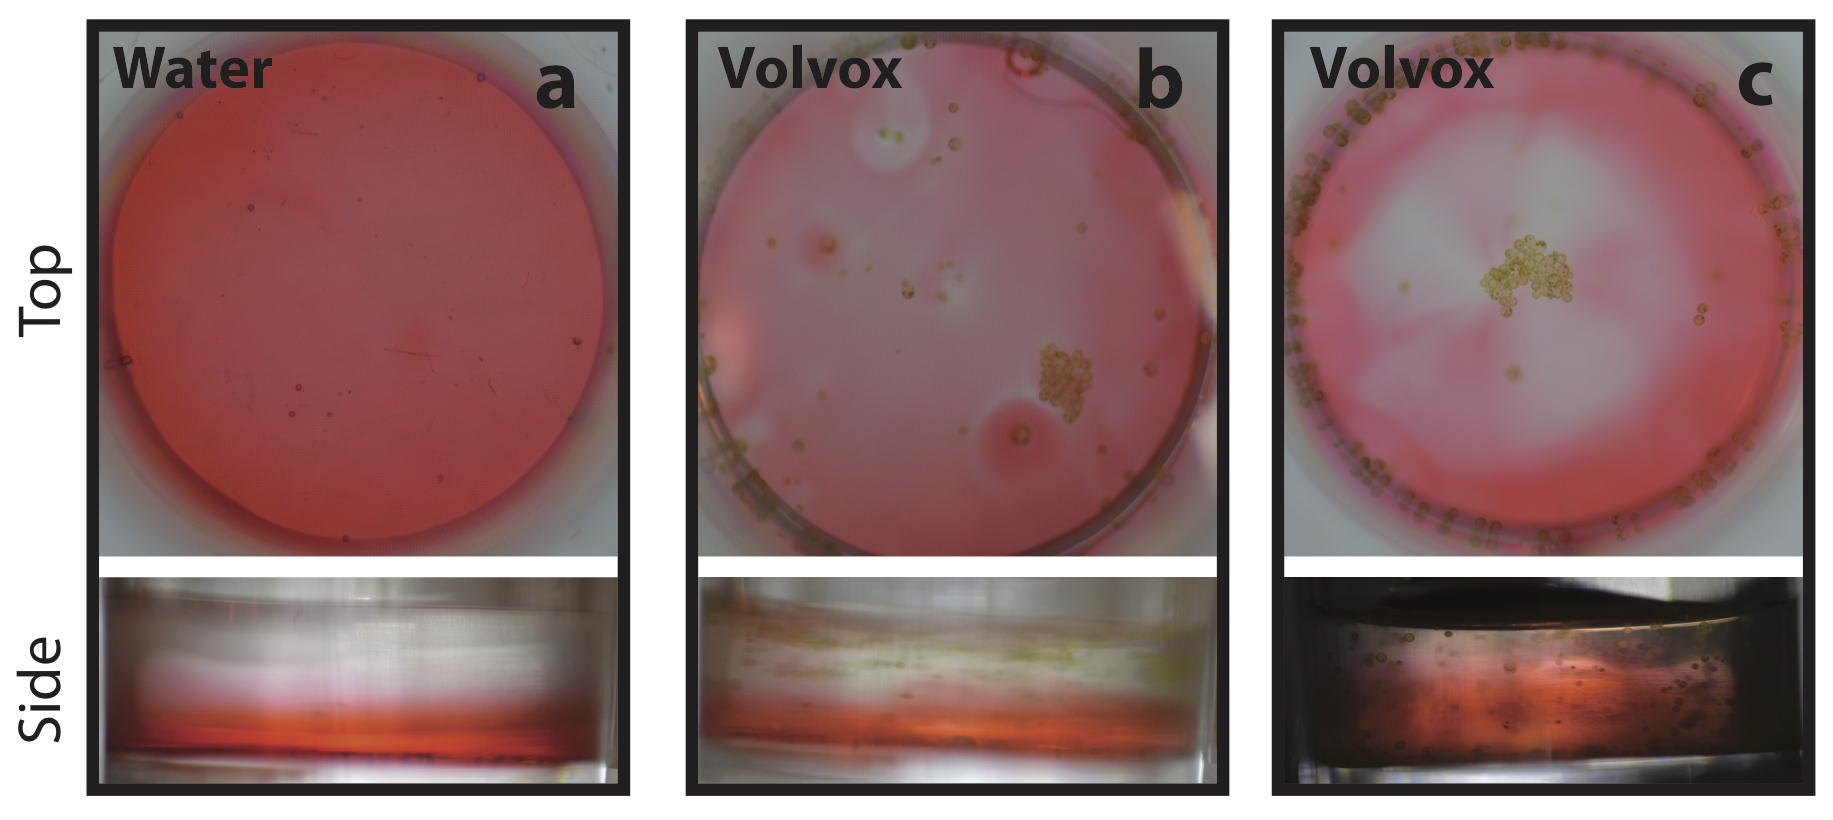
What mechanism enables Volvox to flock? It is known that another species of Volvox – V. carteri is capable of using fluid forces created by flagellar beating to form waltzing pairs Drescher et al. (2009). I hypothesized that V. barberi, being one of the fastest species of Volvox Solari et al. (2008), could exert similar attractive forces strong enough to pull V. barberi into well-packed sheets. To test for these attractive forces, a dye tracer was placed into culture wells containing either Volvox in medium or clear water (as a control). The dye was left to dilute over the course of 5 minutes, while the culture wells were imaged every second from above. After five minutes the final state of the well was recorded from above and from the side (see Fig. 5). In every control with just water, the dye spread evenly across the culture well when viewed from above, while also forming a uniform layer at the bottom of the well when viewed from the side (Fig. 5a, upper and lower). In culture wells with Volvox, however, movements of the colonies created streaks and patches in the liquid, clearings where the dye tracer was pushed out (Fig. 5b and c). When large, rotating flocks formed, they created large, almost circular clearings in the liquid that spanned many flock diameters, here termed vortices (Fig. 5c). When the Volvox culture wells were viewed from the side, there was again a uniform band of dye at the base of the well. This showed that the large vortices associated to flocks were cylindrical. In some cases, it was possible to see spindles of dye pointing towards the center of the flock. These spindles may be channels where fluid drawn into the flock vortex was pulling dye from the periphery into the center, where it was spun around before being evenly diffused back into the liquid. The same forces could pull free-swimming Volvox colonies into the flock.
Discussion
This paper showed that Volvox barberi, a multicellular colonial alga, is capable of a remarkable form of dynamical self-organization, here called flocking, where as many as a hundred Volvox colonies gather into packed two-dimensional lattices over a period of minutes. Flocks grow in size as individual colonies attach to them, or as two flocks join. Once formed, flocks can last for more than an hour before they break apart again into individual colonies. The Volvox, which have a lognormal radius distribution, form a contact network composed mostly of triangles, which in turn have a lognormal vertex angle distribution. A molecular dynamics simulation showed that Volvox achieve a random close-packing which is nearly optimal for the radius distribution.
In larger species such as birds it has been shown that weak signals between pairs of organisms can be sufficient to organize the complete flock Bialek et al. (2012). Here dye-tracing demonstrated that rotating Volvox barberi flocks generate vortices that range over many flock diameters, providing a possible mechanism for aggregation of colonies. Drescher et al. showed that colonies of another species, Volvox carteri, use fluid flows generated by flagellar beating to form waltzing pairs near the boundaries of culture wells Drescher et al. (2009). Similarly, it could be that Volvox barberi rotating in the same direction produce vortices whose flows cancel near the midpoint between colonies leaving a space that the Volvox can easily move into. Alternatively, counter-rotating Volvox may produce faster fluid flows in the space between them; by the Bernoulli principle (which also controls airplane wing design) the faster moving fluid would create a lower pressure causing the slower exterior fluid to push colonies together. These two alternatives could be distinguished by careful imaging of attracting pairs, and by theoretical models of the hydrodynamics of fluid flows created by Volvox colonies.
Recently, Petroff et al. reported that a fast-moving, single-celled bacterium, Thiovulum majus, can form active two-dimensional crystals Petroff et al. (2015). Thiovulum are spheres of a stereotyped diameter (8.5 m). Thus their active crystals are arranged in a regular hexagonal packing (i.e. an equilateral triangular contact network). Like Volvox, Thiovulum rotates as it moves, and the resulting fluid drag is thought to create tornado-like flows that form the active crystal. V. barberi colonies are much larger (up to 500 m in diameter) and contain tens of thousands of beating flagella; hence they can potentially generate much more powerful fluid flows. Importantly, Volvox colonies have varying diameters, perhaps because each colony may be in various stages of its life cycle of producing and dispersing daughter colonies. Because of this polydispersity it is impossible for Volvox to arrange into a regular lattice. Instead, experiments here showed that the Volvox lognormal radius distribution gave rise to a lognormal angle distribution in the contact diagram, which matches the outcome of random close-packing. Thus Volvox barberi may provide an experimental model for studying how optimal packing can be dynamically achieved in nature. For example, the dependence of the optimal lattice on the size distribution could be tested by selecting colonies of specific sizes from a sample and then repeating the experiments in this study.
Why should Volvox barberi flock? Flocking may be a passive consequence of fluid flows produced by moving Volvox when they are placed in the artificial environment of a culture well. However, this seems unlikely since V. carteri, which was also included in this study, and is known to produce strong hydrodynamic flows, did not flock. Additionally, V. barberi colonies continued to rotate and move independently of their flock, and sometimes broke off, moved and reattached elsewhere where they fit better. This dynamic re-organization to produce better packed lattices suggests that flocking involves more than the accidental cohesion of Volvox that happen to be in proximity. Alternatively, flocks may form because of forces arising simply from the tension and meniscus shape of the surface of the liquid in the culture well. This also seems unlikely since the focusing depth of the camera indicated that flocking tended to occur at levels below the surface. Furthermore, colonies were always able to easily break off from the main flock without adhering to the surface of the medium. We can test if meniscus shape has an effect on flocking by placing cultures of V. barberi in containers with varying shapes, sizes and affinities for the medium in order to vary the geometry of the liquid surface. In addition, the surface tension could be changed by modifying viscosity of the medium. If a trend is observed where fewer or more flocks form in containers with a greater surface tension or more strongly curved meniscus geometries, then it is likely that surface tension has an effect.
On the other hand, flocking may have some functional value. For example, a spinning flock could stir the liquid to create a large mixing zone, which would be beneficial for acquiring soluble nutrients. There may also be a kind of safety in numbers in the face of predation from rotifers, or other stresses. This could be tested by measuring if flocking occurs more often, or for more prolonged periods of time, if predators are present in the culture well or under conditions of stress. Another function of the observed flocking might be collective phototaxis in which multiple light-seeking Volvox colonies associate together to increase their overall buoyancy or to maintain stability in the face of random fluid motions. This would enable the flock to rise and position itself near the surface more effectively, so that the population as a whole would have access to as much light as possible in order to photosynthesize. To test this, we could compare rates of flocking at different light exposure levels, or by changing the angle at which light enters the culture well. It would be fascinating to establish whether the visually beautiful phenomenon of Volvox flocking serves an adaptive function.
Methods
Strain maintenance:
Volvox barberi, Euglena gracilis, Chlamydomonas reinhardi, Gonium pectorale, and Pandorina morum (-) were acquired from Carolina Biological and maintained in Woods Hole growth medium Stein (1973). V. carteri (Eve strain, HK10) was provided by Dr. James Umen of the Donald Danforth Plant Science Center, St. Louis, MO. Samples were maintained at room temperature (70 degrees Fahrenheit) in sterile, air-filtered culture flasks, under fluorescent illumination from below with a 12/12 day/night cycle.
Imaging and time-lapse photography:
Prior to imaging, 0.3 ml of a sample was placed in a plastic culture well (ThermoFisher Scientific) measuring 1.5 cm wide. Illumination was provided by a white LCD screen placed below the culture well. Imaging was carried out from above with a Nikon D3200 camera equipped with a macro-lens and stabilized on a tripod. Time-lapse sequences were set to take an image every one or five seconds for 300 seconds. To measure flocking dynamics, the largest developing flock was followed. Still images of wells without evident flocks were used for the Aggregation Index analysis.
Clark-Evans Aggregation Index:
To measure aggregation, photographs were analyzed using GraphClick, a freely available image analysis program. Each image was calibrated to convert pixel distances into microns by comparison with the known diameter of the culture well (1.5 cm). Points were marked on the center and edge of each visible colony. Colony radii were measured as Euclidean distances between center and edge points on each colony. Nearest neighbor distances were measured between centers of closest colony pairs. The Clark-Evans Aggregation Index Clark and Evans (1954) was calculated as:
| (1) |
where is the average distance to the nearest neighbor, is the expected distance to nearest neighbor if the organization were random, and is the Aggregation Index. These quantities are computed from the number of Volvox (), the distance from the colony indexed by to its nearest neighbor (), and the two-dimensional population number density of the Volvox (). Clark and Evans (1954) also provided a formula for computing a p-value measuring the probability that random organization would give rise to a sample with an which is more extreme that a given value. To compute the p-value I first calculated a z-score Clark and Evans (1954):
| (2) |
A standard statistical package in the Mathematica (Wolfram) computing environment converted the z-score into a probability.
Flock Geometry:
I characterized the geometry of flocks in terms of the Volvox colony radius distribution, and the vertex angles of the Volvox contact network. Radii were measured as described in the Aggregation Index methods above. Custom software (available upon request) produced a contact network consisting of lines connecting the centers of touching Volvox. To determine touching pairs, the software checked if the distance between colonies was less than or equal to the sum of their radii. Occasionally, small errors in the marked locations of colony centers (see above) led to extra or omitted lines in the contact diagram; these were corrected through manual curation. Vertex angles were computed by using the cosine rule:
| (3) |
where and are the lengths of two adjacent lines ( and ) of the contact diagram forming a vertex with an interior angle . If and belong to a triangle in the contact network, then is the length of the opposite side from angle . If and belong to a higher polygon, the polygon is first triangulated, and is the length of the line that would be opposite in an appropriate triangulation.
Lognormal distributions:
The radius and angle distributions were fit with log normal distributions
| (4) |
where is the variable being measured, and and are respectively the mean and standard deviation of the natural log of computed in this distribution. The mean of is . The lognormal distribution is skewed towards large values of like the radius and contact network vertex angle distribution. Fits were carried out by minimizing the squared difference between measured data and this function.
Simulations:
Computational modeling was carried out in the freely available LAMMPS molecular dynamics software package. Each simulation involved many circular particles in two dimensions, with radii matched to the Volvox in a given flock. The particles attracted each other through Lennard-Jones pairwise potentials (Fig.4b), described by the equation
| (5) |
Here sets the arbitrary units of potential energy; was set to . The potential vanishes when , and is minimized when . I carried out the studies in two dimensions, rather than three, because inspection showed that the Volvox were flocking in a fixed plane. The Lennard-Jones potential is repulsive at short distances (potential decreasing with distance), attractive above a critical distance (potential increasing with distance), and vanishes at large separations. This potential was originally designed to describe interactions between neutral atoms Jones (1924), but was used here as a simple model of weak long-range attraction with short-range repulsion. The LAMMPS input scripts permit choosing separate parameters for the interaction potentials of each pair of particles. These parameters were chosen to ensure that an isolated pair would come to equilibrium at late times at a separation equal to the sum of their radii. This was achieved by fixing in the equation above so that the pairwise potentials were minimized at the sum of the corresponding radii. Simulations were initialized with particles at random positions, random initial velocities and a finite temperature. The simulation cooled the particles slowly so that they could rearrange themselves while attracting each other as they approached equilibrium. These dynamics are not intended to precisely model the forces exerted by Volvox on each other, but rather to provide a generic setting where polydisperse, two-dimensional spheres achieve close packing by attracting each other weakly over long distances (here through the Lennard-Jones potential) while rearranging themselves (here through fluctuations induced by finite temperature).
Dye tracer studies of Volvox vortices:
Red food coloring (FD&C Reds 3 and 40 suspended in water, propylene glycol, and propylparaben; McCormick & Co.) was diluted in a proportion of about one drop of coloring per ml of water. Three drops of diluted dye mixture were placed, using a pipette, at the edge of a culture well that contained either Volvox in medium or a similar volume of clear water as a control. Time-lapse photography then imaged the culture well. The camera was typically positioned above the sample to study how Volvox motions affected the transverse spread of the dye. Images were also taken from the side to study how the dye spread vertically.
Acknowledgements.
I am grateful to Richard McCourt of the Academy of Natural Sciences of Drexel University for introducing me to Volvox and for mentoring this project. Tristan Sharp, of the University of Pennsylvania, taught me about the LAMMPS molecular dynamics software. James Umen and Sa Geng of the Donald Danforth Plant Science Center sent me samples of Volvox carteri and their growth medium. I also thank all the participants of the 2017 Volvox conference, and especially Matthew Herron and Stephanie Hoehn, for insightful remarks. Presentations of this work at Volvox 2017 and the 2017 Annual Meeting of the Phycological Society of America were supported by Hoshaw Travel Award of the Phycological Society of America (PSA) and by the Donald Danforth Plant Science Center in St. Louis, MO.References
- Kirk (2005) D. L. Kirk, Volvox: a search for the molecular and genetic origins of multicellularity and cellular differentiation, Vol. 33 (Cambridge University Press, 2005).
- Hoops et al. (2006) H. J. Hoops, I. Nishii, and D. L. Kirk, in Cell-Cell Channels (Springer, 2006) pp. 65–84.
- Herron (2016) M. D. Herron, Molecular ecology 25, 1213 (2016).
- Matt and Umen (2016) G. Matt and J. Umen, Developmental biology 419, 99 (2016).
- Brumley et al. (2014) D. R. Brumley, K. Y. Wan, M. Polin, and R. E. Goldstein, Elife 3 (2014).
- Brumley et al. (2015) D. R. Brumley, M. Polin, T. J. Pedley, and R. E. Goldstein, Journal of the Royal Society Interface 12, 20141358 (2015).
- Camazine (2003) S. Camazine, Self-organization in biological systems (Princeton University Press, 2003).
- Drescher et al. (2009) K. Drescher, K. C. Leptos, I. Tuval, T. Ishikawa, T. J. Pedley, and R. E. Goldstein, Physical Review Letters 102, 168101 (2009).
- Petroff et al. (2015) A. P. Petroff, X.-L. Wu, and A. Libchaber, Physical review letters 114, 158102 (2015).
- Conway and Sloane (2013) J. H. Conway and N. J. A. Sloane, Sphere packings, lattices and groups, Vol. 290 (Springer Science & Business Media, 2013).
- Hales (2005) T. C. Hales, Annals of mathematics , 1065 (2005).
- Torquato and Stillinger (2010) S. Torquato and F. H. Stillinger, Reviews of modern physics 82, 2633 (2010).
- Clark and Evans (1954) P. J. Clark and F. C. Evans, Ecology 35, 445 (1954).
- Solari et al. (2008) C. A. Solari, R. E. Michod, and R. E. Goldstein, Journal of phycology 44, 1395 (2008).
- Bialek et al. (2012) W. Bialek, A. Cavagna, I. Giardina, T. Mora, E. Silvestri, M. Viale, and A. M. Walczak, Proceedings of the National Academy of Sciences 109, 4786 (2012).
- Stein (1973) J. R. Stein, Handbook of phycological methods: physiological and biochemical methods, Vol. 2 (Cambridge University Press, 1973).
- Jones (1924) J. E. Jones, in Proc. R. Soc. Lond. A, Vol. 106 (The Royal Society, 1924) pp. 463–477.