Infall and Outflow Motions towards a Sample of Massive Star Forming Regions from the RMS Survey
Abstract
We present the results of an outflow and infall survey towards a distance limited sample of 31 massive star forming regions drawn from the RMS survey. The presence of young, active outflows is identified from SiO (8-7) emission and the infall dynamics are explored using HCO+/H13CO+ (4-3) emission. We investigate if the infall and outflow parameters vary with source properties, exploring whether regions hosting potentially young active outflows show similarities or differences with regions harbouring more evolved, possibly momentum driven, “fossil” outflows. SiO emission is detected towards approximately 46% of the sources. When considering sources with and without an SiO detection (i.e. potentially active and fossil outflows respectively), only the 12CO outflow velocity shows a significant difference between samples, indicating SiO is more prevalent towards sources with higher outflow velocities. Furthermore, we find the SiO luminosity increases as a function of the Herschel 70 m to WISE 22m flux ratio, suggesting the production of SiO is prevalent in younger, more embedded regions. Similarly, we find tentative evidence that sources with an SiO detection have a smaller bolometric luminosity-to-mass ratio, indicating SiO (8-7) emission is associated with potentially younger regions. We do not find a prevalence towards sources displaying signatures of infall in our sample. However, the higher energy HCO+ transitions may not be the best suited tracer of infall at this spatial resolution in these regions.
keywords:
stars: formation – interstellar medium: jets and outflows – interstellar medium: molecules1 Introduction
Infall and outflow motions are an important part of the star-formation process. However, a comprehensive understanding of both processes, particularly towards massive star forming regions, is still lacking. This is due, in part, to the larger distances and typically more clustered and complex nature of such regions, making it difficult to disentangle the infall and outflow properties of individual objects in a given cluster.
Observationally, young stellar objects (YSOs) of all masses are known to drive bipolar molecular outflows and SiO emission has been effectively used to detect outflows driven by low (M2 M∗), intermediate (2 MM8 M∗) and high-mass (M8 M∗) stars (e.g., Gibb et al. 2004; Gibb et al. 2007; Duarte-Cabral et al. 2014; Klaassen et al. 2012; Cunningham et al. 2016). The passage of fast shocks are required to disrupt and release SiO from the solid grains into the gas phase (e.g., Gusdorf et al. 2008; Guillet et al. 2009; Schilke et al. 1997; Flower & Pineau des Forêts 2012). Thus, SiO emission, particularly the higher energy transitions, is likely to be an excellent tracer of an active outflow located close to the stellar driving source. Gibb et al. (2004) found SiO emission was preferentially detected towards Class 0 sources in their sample of low-mass stars. Furthermore, those sources with an SiO detection were associated with higher outflow velocities and higher densities, suggesting shock velocity and ambient density are likely to play an important role in the production of SiO in the early stages of low-mass star-formation. Bontemps et al. (1996) observed more powerful outflows to be associated with Class 0 sources in their sample of 45 embedded YSOs. Similarly, a decrease of the outflow force with source evolution was observed by Mottram et al. (2017) towards a sample of Class 0 and Class I sources. In the high-mass regime, Gibb et al. (2007) found SiO emission was preferentially detected towards sources with higher outflow velocities, but were unable to establish the evolutionary nature of individual sources. Further work by Klaassen et al. (2012) found an increase in the integrated intensity of the SiO emission with evolutionary stage, contrary to the observations in the low-mass regime, detecting both infall and outflow signatures towards ultra-compact HII (UCHII) regions. As CO is more readily excited in the ambient medium, it has been suggested (e.g., Klaassen et al. 2012; Bally et al. 1999) that emission from CO may potentially trace a remnant, momentum driven, outflow cavity that is no longer being actively driven by the central star. In comparison, SiO, which requires a fast shock and higher critical density to be excited, may be tracing an active outflow close to the central star. A major aim of this work is to explore systematic differences in the environment, age and evolutionary nature between massive star forming regions hosting outflows traced by both CO and SiO emission (i.e. potentially active outflows) compared with regions that have an outflow traced by CO and show no associated SiO emission (i.e. potentially momentum driven fossil outflows).
In addition, we purposely observed the dense-gas tracer HCO+ as a means of probing the infall dynamics in these regions. Infall is believed to form an important role in the high-mass star formation process. However, exactly how mass is accumulated on the clump/cloud scales and finally accreted onto the central cores in massive star forming regions is still unclear (e.g. see Motte et al. 2017 for a recent review). There are two dominant theoretical scenarios for the formation of massive stars; turbulent core accretion McKee & Tan (2003) and competitive accretion Bonnell et al. (2001). In the former, the infall dynamics would likely be localized on individual core/binary type scales, whereas in the latter the cloud and high mass prototstars form simultaneously (e.g. Tigé et al. 2017) and global collapse on clump/cloud scales is expected. In this formation scheme, the gas is likely to be channeled along converging flows onto central clouds that are undergoing global collapse on parsec scales. Several recent observations (e.g. Peretto et al. 2014; Williams et al. 2018) have observed velocity gradients along filamentary structures converging onto a central hub. In the observations presented here, we expect to probe signatures of global infall on scales of 1-2 pc, if present.
We present the results of an HCO+ , H13CO+ J=4-3, and SiO J=8-7 molecular line survey performed using the James Clerk Maxwell Telescope (JCMT) towards a sample of 33 high-mass star forming regions selected from the RMS MSX survey (Lumsden et al., 2013). In Section 2 we summarize the observations presented in this paper. The results are presented in Section 3, the discussion in Section 4 and the main conclusions of the work are outlined in Section 5.
2 Sample and observations
2.1 Sample selection
The sample includes 33 massive star forming regions, selected from a previous outflow survey by Maud et al. (2015b), where 27 of the sources observed have an outflow detection traced by 12CO (3-2). For completeness, we also include 6 regions that have no confirmed 12CO (3-2) outflow detection in Maud et al. (2015b), but have associated C18O (3-2) emission (see Maud et al. 2015a) and therefore retain a dense massive core. All sources are part of the RMS survey and were selected to probe both evolutionary nature and cover a range in luminosity. The sample includes; 20 YSOs, 11 compact HII and 2 HII/YSO RMS classified regions (Lumsden et al., 2013). Objects labeled as HII/YSO regions were found to display characteristics of both YSOs and compact HII regions (see Lumsden et al. 2013 for a full discussion of the classification of RMS sources). Furthermore, the source selection was chosen to be distance limited (4.5 kpc) to minimise distance-related bias. However, since the observations were undertaken, the distances of two sources, G020.7617 and G045.0711, have been corrected. The distance to G020.7617 has been updated to the far kinematic distance of 11.8kpc, and the distance to G045.0711 has been corrected to 7.750.4kpc (Wu et al. 2014, obtained from parallax and proper motion measurements). To keep the sample distance limited we omit these sources from the remaining analysis. Table 1 presents the source properties taken from the RMS survey. The sources are labelled by their Galactic name (Column 1), and properties such as the RMS survey classification (e.g., YSO and HII), source VLSR, distance and bolometric luminosity are given. Where possible the IRAS name and/or more commonly used name(s) for each source are provided.
| Source | RMS | RA | Dec | VLSR | Distance | Luminosity | IRAS/Common |
|---|---|---|---|---|---|---|---|
| Name | Classification | (J2000) | (J2000) | (km s-1) | (kpc) | (L⊙) | Name |
| CO outflow detectiona | |||||||
| G010.841102.5919 | YSO | 18:19:12.09 | - 20:47:30.9 | 12.3 | 1.9 | 2.4e+04 | 18162-2048 |
| G012.909000.2607 | YSO | 18:14:39.56 | - 17:52:02.3 | 36.7 | 2.4 | 3.2e+04 | 18117-1753/ W33A |
| G013.656200.5997 | YSO | 18:17:24.38 | - 17:22:14.8 | 47.4 | 4.1 | 1.4e+04 | 18144-1723 |
| G017.638000.1566 | YSO | 18:22:26.37 | - 13:30:12.0 | 22.1 | 2.2 | 1.0e+05 | 18196-1331 |
| G018.341201.7681 | YSO | 18:17:58.11 | - 12:07:24.8 | 33.1 | 2.8 | 2.2e+04 | 18151-1208 |
| G020.761700.0638 | HII/YSO | 18:29:12.36 | - 10:50:38.4 | 56.9 | 11.8b | 1.3/3.6e+04 | |
| G043.306100.2106c | HII | 19:11:16.97 | + 09:07:28.9 | 59.6 | 4.4 | 1.1e+04 | 19088+0902 |
| G045.071100.1325 | HII | 19:13:22.10 | + 10:50:53.4 | 59.2 | 7.8b | 6.2e+05 | 19110+1045 |
| G050.221300.6063 | YSO | 19:25:57.77 | + 15:02:59.6 | 40.6 | 3.3 | 1.3e+04 | 19236+1456 |
| G078.122403.6320 | YSO | 20:14:25.86 | + 41:13:36.3 | -3.9 | 1.4 | 4.0e+03 | 20126+4104 |
| G079.127202.2782 | YSO | 20:23:23.83 | + 41:17:39.3 | -2.0 | 1.4 | 1.6e+03 | 20216+4107 |
| G079.874901.1821 | HII | 20:30:27.45 | + 41:15:58.5 | -4.3 | 1.4 | 1.1e+03 | 202864105 |
| G081.713300.5589 | HII | 20:39:02.36 | + 42:21:58.7 | -3.8 | 1.4 | 1.9e+03 | |
| G081.722000.5699 | HII | 20:39:01.01 | + 42:22:50.2 | -4.7 | 1.4 | 1.2e+04 | DR21 OH |
| G081.752200.5906 | YSO | 20:39:01.98 | + 42:24:59.1 | -4.0 | 1.4 | 9.0e+03 | |
| G081.762400.5916 | YSO | 20:39:03.72 | + 42:25:29.6 | -4.4 | 1.4 | 2.6e+03 | |
| G081.865200.7800 | YSO | 20:38:35.36 | + 42:37:13.7 | 9.4 | 1.4 | 3.6e+03 | |
| G081.878900.7822 | HII | 20:38:37.71 | + 42:37:58.6 | 8.1 | 1.4 | 1.1e+04 | |
| G083.093603.2724 | HII | 20:31:35.44 | + 45:05:45.8 | -3.1 | 1.4 | 1.2e+04 | |
| G083.707103.2817 | YSO | 20:33:36.51 | + 45:35:44.0 | -3.6 | 1.4 | 3.9e+03 | |
| G083.796203.3058 | HII | 20:33:48.02 | + 45:40:54.5 | -4.3 | 1.4 | 4.8e+03 | |
| G103.874401.8558 | YSO | 22:15:09.08 | + 58:49:07.8 | -18.3 | 1.6 | 6.8e+03 | 22134+5834 |
| G109.871502.1156 | YSO | 22:56:17.98 | + 62:01:49.7 | -11.1 | 0.7 | 1.5e+04 | 22543+6145/Cep A |
| G192.600500.0479 | YSO | 06:12:54.01 | + 17:59:23.1 | 7.4 | 2.0 | 4.5e+04 | 06099+1800/ S255 IR |
| G194.934901.2224 | YSO | 06:13:16.14 | + 15:22:43.3 | 15.9 | 2.0 | 3.0e+03 | 06103+1523 |
| G203.316602.0564 | YSO | 06:41:10.15 | + 09:29:33.6 | 7.4 | 0.7 | 1.8e+03 | 06384+0932/NGC2264-C |
| G207.265401.8080 | HII/YSO | 06:34:37.74 | + 04:12:44.2 | 12.6 | 1.0 | 1.3/9.1e+03 | 06319+0415 |
| No CO outflow detectiona | |||||||
| G080.864500.4197 | HII | 20:36:52.16 | + 41:36:24.0 | -3.1 | 1.4 | 9.1e+03 | |
| G080.938300.1268 | HII | 20:39:25.91 | + 41:20:01.6 | -2.0 | 1.4 | 3.2e+04 | |
| G081.713100.5792 | YSO | 20:38:57.19 | + 42:22:40.9 | -3.6 | 1.4 | 4.9e+03 | |
| G196.454201.6777 | YSO | 06:14:37.06 | + 13:49:36.4 | 18.0 | 4.1b | 5.4e+04 | 06117+1350 |
| G217.377100.0828 | HII | 06:59:15.73 | - 03:59:37.1 | 25.1 | 1.3 | 8.0e+03 | 06567-0355 |
| G233.830600.1803 | YSO | 07:30:16.72 | - 18:35:49.1 | 44.6 | 3.3 | 1.3e+04 | 07280-1829 |
Notes
(a) The CO outflow sources have either a confirmed 12CO(3-2) outflow or in the case of two sources, G017.6380 and G083.7962, show evidence of an outflow, whereas the No CO outflow sources have no observed emission consistent with an outflow in Maud et al. (2015b).
(b) The distance to G020.7617 has been updated to the far distance since the observations were undertaken. A distance of 7.750.4 kpc to G045.0711 has recently been identified through measurements of parallax and proper motions by Wu et al. (2014). The distance to G196.4542 has been since updated to 4.05 kpc (Asaki et al., 2014). The corrected distances for these sources are used in the remainder of the analysis.
(c) G043.3061-00.2106 was observed as part of the 12CO outflow survey (Maud et al., 2015b). However, as G043.3061-00.2106 was not observed in the C18O core properties survey by Maud et al. (2015a), this source was subsequently excluded from the 12CO (3-2) outflow survey (Maud et al., 2015b). Inspection of the 12CO (3-2) data shows emission indicative of outflow motions, thus we include this source as a CO outflow candidate in this work.
2.2 JCMT observations
SiO J=8-7, H13CO+ J=4-3 and HCO+ J=4-3 were observed using the Heterodyne Array Receiver program (HARP) (Buckle et al., 2009) at the 15 m James Clerk Maxwell Telescope111The James Clerk Maxwell Telescope has historically been operated by the Joint Astronomy Centre on behalf of the Science and Technology Facilities Council of the United Kingdom, the National Research Council of Canada and the Netherlands Organisation for Scientific Research. (JCMT) as part of the projects M09AU18 (SiO J=8-7, and H13CO+ J=4-3) and M10AU04 (HCO+ J=4-3). Due to time limitations, only 25 sources were observed as part of project M10AU04 (HCO+ J=4-3). Project M09AU18 was observed between 12/04/2009 - 05/04/2010, and project M10AU04 between 16/04/2010 and 01/09/2010. The HARP array consists of 16 receiver elements but during both projects receiver H14 was not operational and is subsequently missing from the data. The observations were taken in position switched jiggle chop mode (Buckle et al., 2009), creating 2 arcminute by 2 arcminute maps. We observed each source for between 30-60 minutes, and the pointing was checked every hour on a known bright molecular source and is accurate to within 5. H13CO+ and SiO were observed simultaneously in the same frequency set-up, where the Auto-Correlation Spectral Imaging System (ACSIS) was configured with an operational bandwidth of 1000 MHz2048 channels, providing a velocity resolution of 0.42 . For HCO+ the bandwidth was set-up at 250 MHz4096 channels, providing a velocity resolution of 0.05 . At the observed frequency range of 345 GHz the JCMT has a beam size of 15. The average atmospheric opacity () obtained from the Caltech Submillimeter Observatory (CSO) during both sets of observations was 0.07.
The HARP/ACSIS data reduction was undertaken using the Starlink software packages SMURF, KAPPA, and GAIA (Jenness et al., 2015). The data were initially converted to spectral (RA-DEC-velocity) cubes using the SMURF command MAKECUBE. The data were gridded on to cubes with a pixel size of 7.5 by 7.5 using the function “SincSinc”, which is a weighting function using a sinc(sinc) kernel. The noisy channels at the edges of the band were removed, and a linear baseline was subtracted. The data were converted from the antenna temperature scale T (Kutner & Ulich, 1981) to main-beam brightness temperature Tmb using , where the main beam efficiency has a value of 0.61 (Buckle et al., 2009). To increase the signal to noise ratio of the SiO (8-7) line, we re-sampled the velocity resolution to 1.68 using the KAPPA command SQORST. The 1 rms Tmb(rms) per channel was determined from line free channels excluding any noisy pixels towards the edges of the map; the typical values are 0.08 K, 0.04 K, and 0.6 K for H13CO+ (0.42 ), SiO (1.68 ) and HCO+ (0.05 ), respectively. As mentioned in the previous section, the HCO+ observations were not completed towards all sources in this survey; sources that were not observed are noted in Table 2.
2.3 Archival data
To complement the JCMT HARP observations, we utilise archival far-infrared (IR) data. The far-IR 70m observations, performed with the ESA Herschel Space Observatory222Herschel is an ESA space observatory with science instruments provided by European-led Principal Investigator consortia and with important participation from NASA. (Pilbratt et al., 2010) using the PACS instrument (Poglitsch et al., 2010), were obtained from the Herschel archive in standard product generation form333http://www.cosmos.esa.int/web/herschel/science-archive. The majority of the data were taken from the HOBYS (Motte et al., 2010) or HiGal (Molinari et al., 2010) surveys. Only two regions, G018.3412 and G078.1224, were not observed as part of these two surveys, and were observed under the PIs; Krauss (observation ID:1342191813) and Cesaroni (observation ID:1342211514) respectively (see Table 2 for a summary of the sources covered).
3 Results
3.1 Determining the source extents and properties from the HCO+ and H13CO+ emission
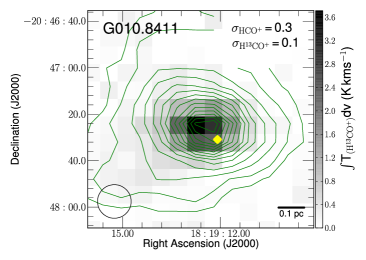
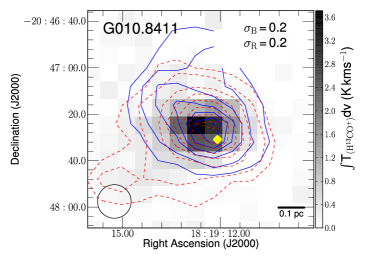
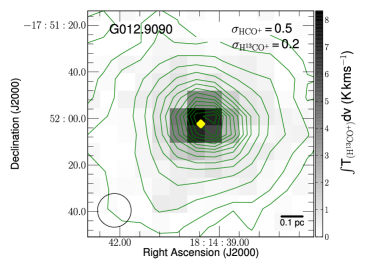
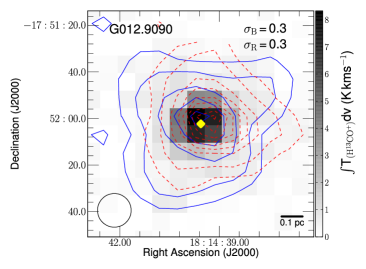
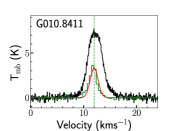
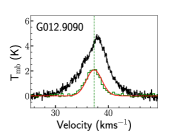
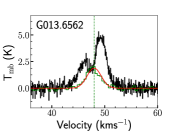
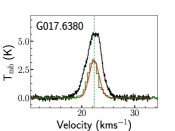
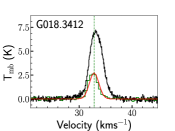
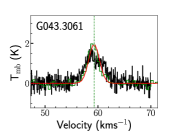
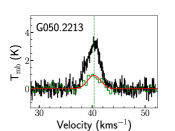
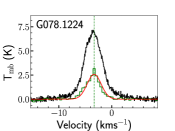
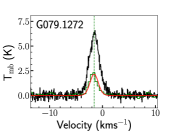
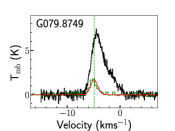
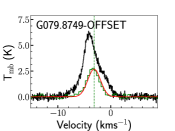
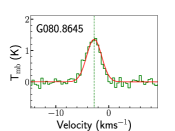
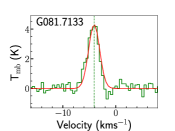
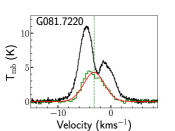
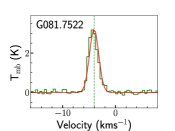
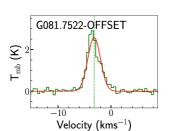
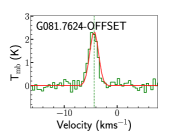
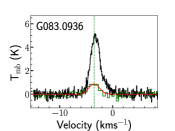
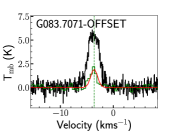
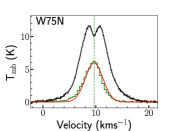
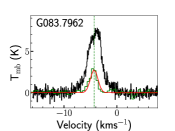
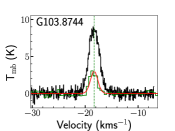
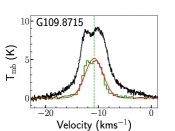
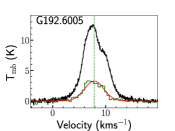
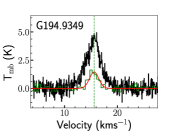
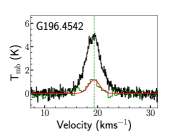
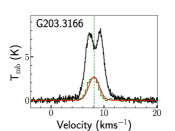
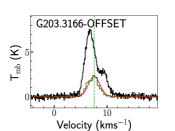
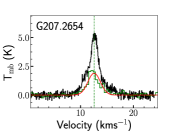
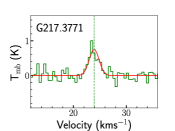
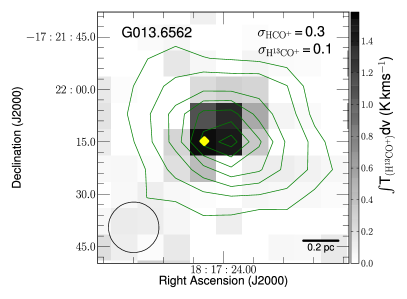
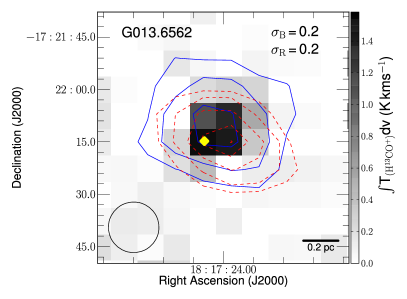
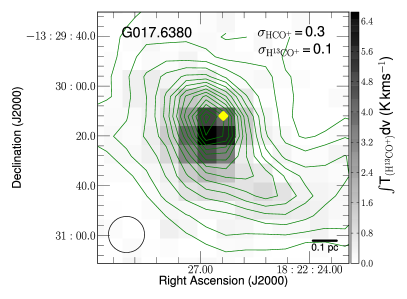
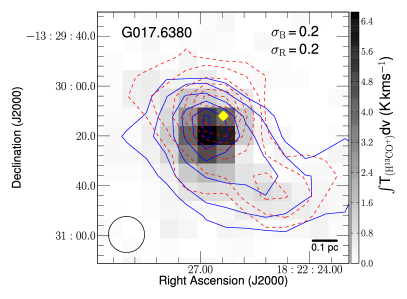
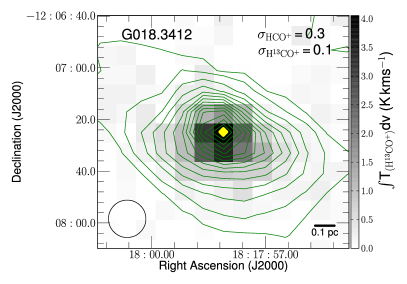
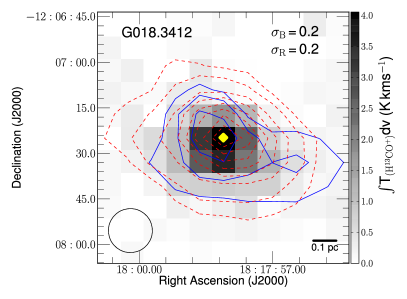
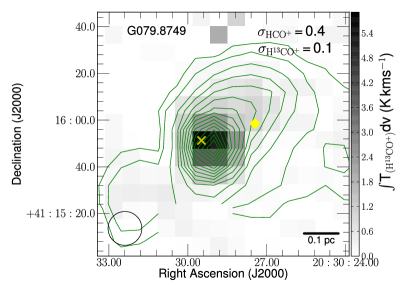
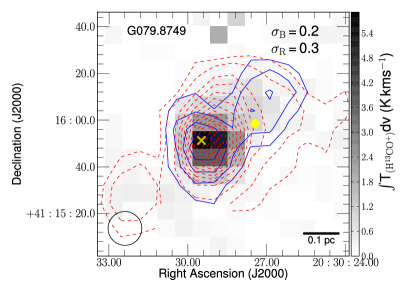
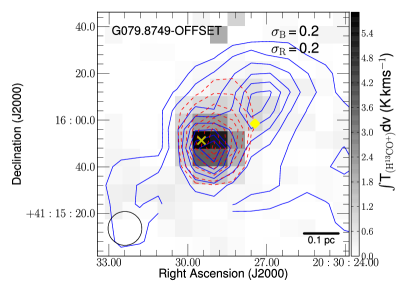
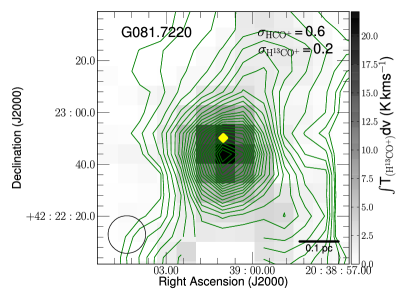
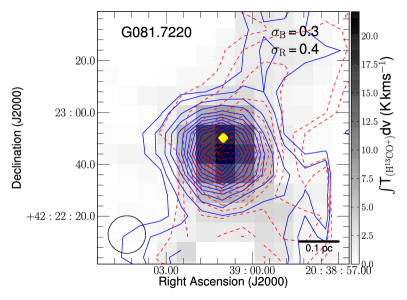
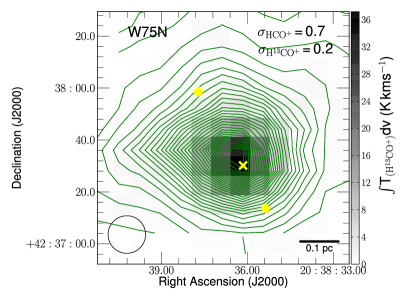
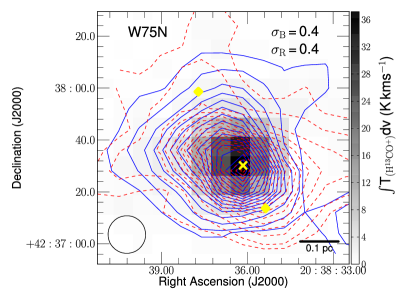
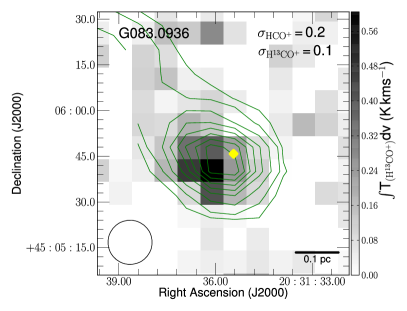
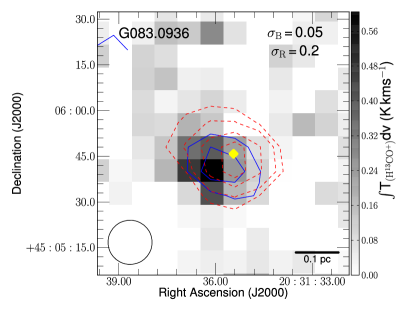
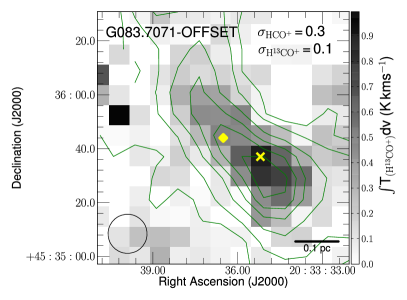
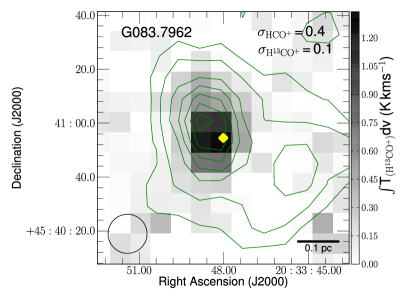
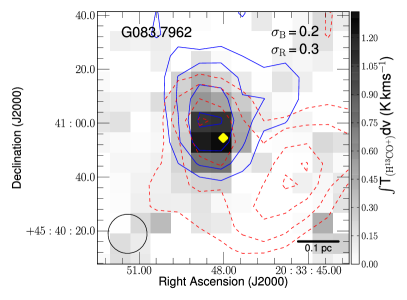
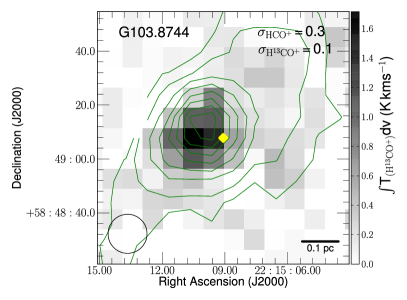
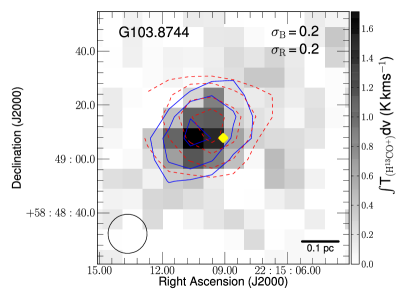
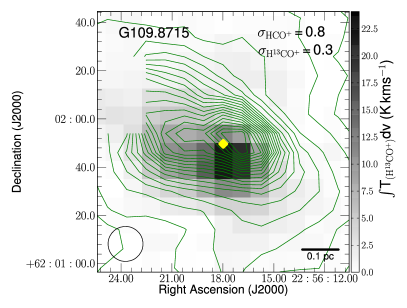
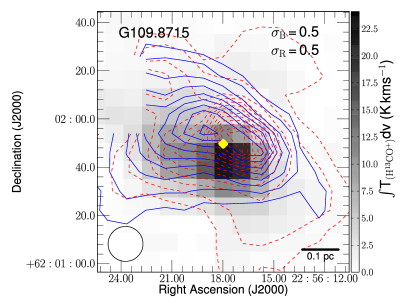
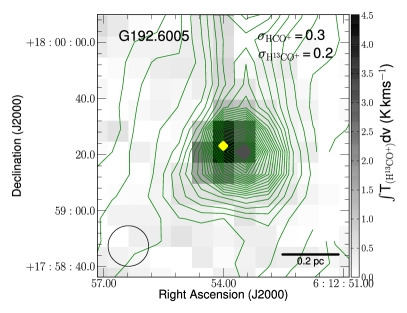
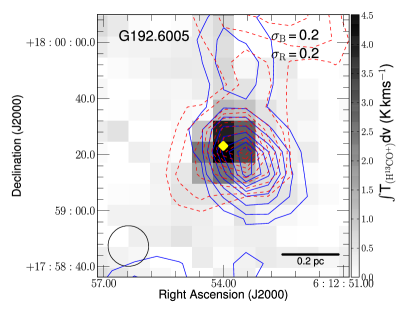
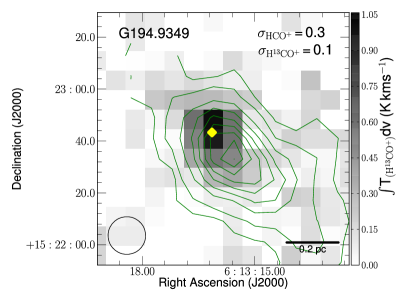
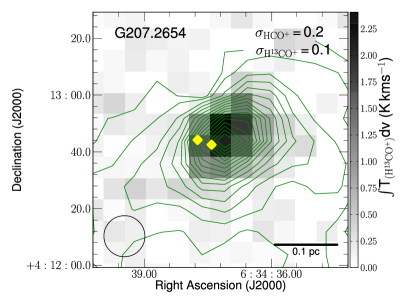
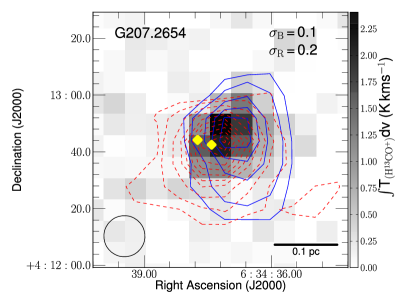
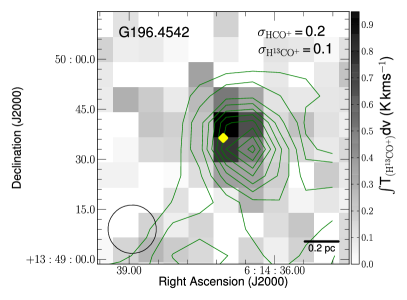
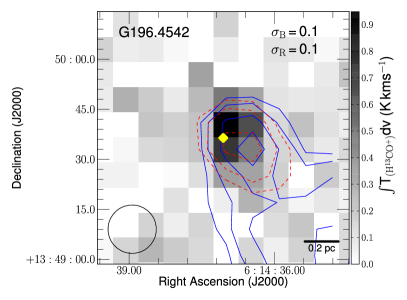
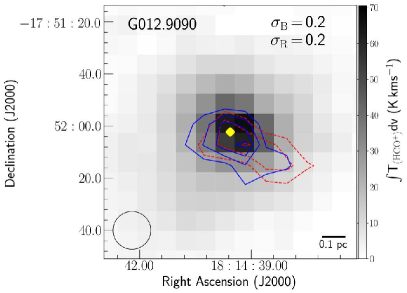
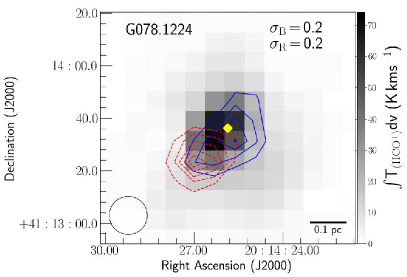
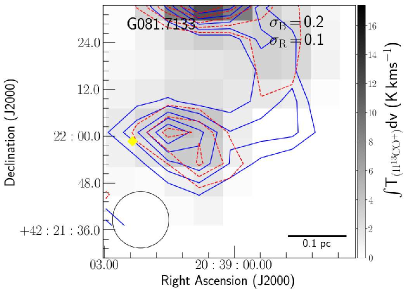
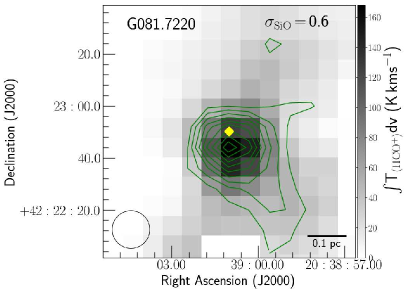
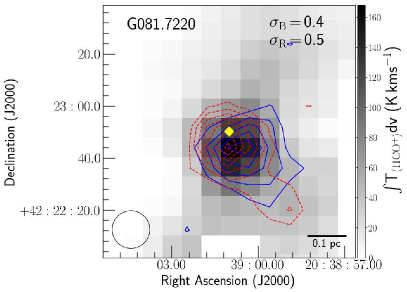
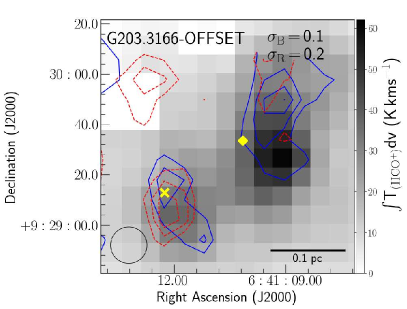
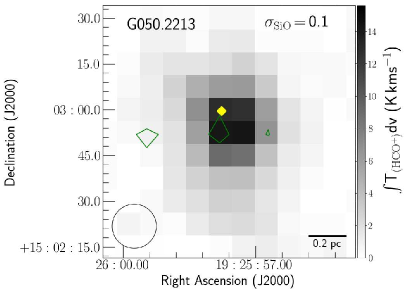
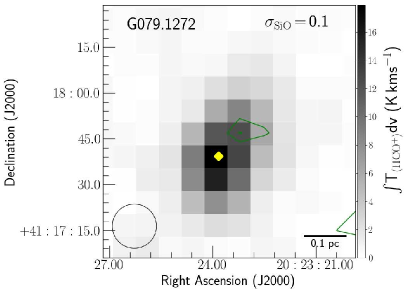
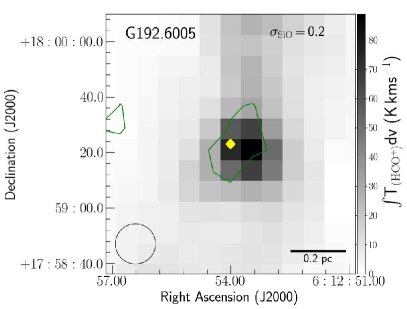
The extent of the H13CO+ emission is determined from dendrogram fits made to the H13CO+ zeroth order moment maps, using the python based dendrogram fitting application, astrodendro444This research made use of astrodendro, a Python package to compute dendrograms of Astronomical data (http://www.dendrograms.org/). An H13CO+ detection is assigned based on a 5 detection over a minimum of 4 contiguous pixels (approximately equivalent to the beam area of 4.45 pixels). The rms noise per pixel in the integrated intensity maps is obtained using , where Tmb(rms) is the rms noise level in K per channel, is the velocity resolution in (0.42 for H13CO+ ) and Nchan is the number of channels used to integrate the emission. The number of channels is determined from the minimum and maximum velocity in the H13CO+ cubes that contain emission above the 3 limit. A sample of the H13CO+ zeroth order moment maps with the HCO+ emission overlaid are shown in Figure 1 with the remainder provided in the online data. The HCO+ and H13CO+ spectra (shown in Figure 2) display the average emission per pixel extracted from the sum of all pixels within the H13CO+ dendrogram fitted mask. The Gaussian fits of the H13CO+ spectra, presented in Table 7 of the Appendix, are extracted from the the sum of the emission over the region.
We detect H13CO+ emission towards 28 of the 31 distance limited RMS sources observed. For the three undetected sources (G233.8306, G081.7131, and G083.9383) no H13CO+ emission is detected in a single pixel above the 3 limit. Towards several sources we find the peak of the H13CO+ emission is offset by more than the FWHM of the JCMT beam (14.5″) from the RMS position. Furthermore, towards two sources, G081.7522 and G203.3166, two H13CO+ features are identified in the dendrogram fit. One component is associated with the RMS source position and a second structure is located in an offset position (14.5″from the RMS position). We discuss the offset components in more detail below.
3.1.1 H13CO+ offset components
An offset component is identified if the centre of the pixel containing the peak of the H13CO+ integrated intensity emission is spatially offset by more than a beam FWHM (14.5″) from the RMS source position (see Figure B1 in the online data for the HCO+ and H13CO+ zeroth order moment maps towards the offset sources) . In total six H13CO+ offset components are identified:
-
1.
Towards G079.8749, only one H13CO+ component is identified and is offset from the RMS source position by 24″, located at R.A. (J2000) 20h30m29.5s, Dec. (J2000) 41∘1551.4. However, there is a clear enhancement in the H13CO+ emission towards the RMS source position in agreement with previous ammonia VLA observations (Lu et al., 2014). We therefore split the H13CO+ emission into two separate components, a smaller one associated with the RMS source position, and a second larger component located in the offset position now labelled G079.8749-OFFSET.
-
2.
Towards G081.7522, two H13CO+ components are identified; one feature coincident with the RMS source position and a second offset by 30″ to the south of the RMS position located at R.A. (J2000) 20h39m00.3s, Dec. (J2000) 42∘2436.4. We label the second offset component G081.7522-OFFSET. This source, located in the northern part of the DR 21 filament, was identified as a mm-continuum source (N43) by Motte et al. (2007) and does not have an outflow association in either SiO (2-1) (Motte et al., 2007) or CO (2-1) Schneider et al. (2010).
-
3.
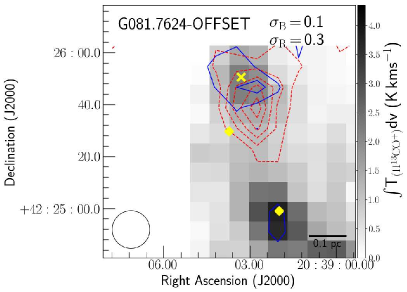
Towards G081.7624, only one H13CO+ component is present, located 22″ to the north of the RMS source position at R.A. (J2000) 20h39m03.3s, Dec. (J2000) 42∘2550.6, and is now labelled G081.7624-OFFSET. This component also resides in the northern part of the DR 21 filament and was identified as a mm-continuum source (N53) by Motte et al. (2007). This H13CO+ feature has associated SiO (2-1) emission (Motte et al., 2007) and a CO (2-1) outflow (Schneider et al., 2010). Furthermore, the 12CO (3-2) emission in Maud et al. (2015b) is also coincident with the offset component and we associate the outflow properties to G081.7624-OFFSET in this work.
-
4.
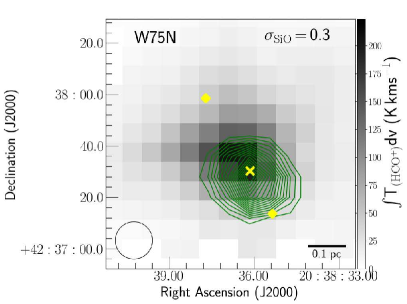
For G081.8789 and G081.8652, which were observed in the same JCMT map, the dendrogram fit reveals only one H13CO+ feature, located between the two RMS positions, 40″ from G081.8789, and 20″ from G081.8652 at R.A. (J2000) 20h38m36.3s, Dec. (J2000) 42∘3730.3. While H13CO+ emission extends over both sources, there appears to be no obvious enhancement towards either RMS source, this is consistent with the C18O emission in this region (Maud et al., 2015a). The peak of the H13CO+ emission is coincident with W75N, which hosts multiple mm continuum peaks and outflow emission (e.g., Minh et al. 2010). Furthermore, the 12CO (3-2) emission in Maud et al. (2015b) is also coincident with W75N and we associate the outflow properties to W75N in this work. Given the source confusion in this field, W75N was not listed as an MSX point source. We label this H13CO+ component as W75N but class it as an offset source for the remainder of the analysis as it does not coincide with a listed RMS point source position.
-
5.
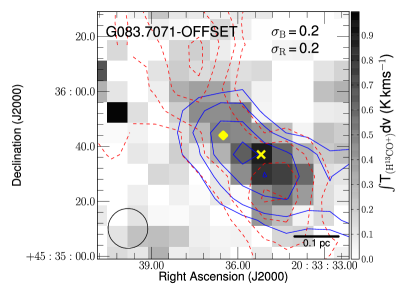
Towards G083.7071, only one H13CO+ component is identified, offset from the RMS position by 16″. The peak of the H13CO+ emission is located at R.A. (J2000) 20h33m35.2s, Dec. (J2000) 45∘3536.5. This component is not coincident with any previously known source and is labelled G083.7071-OFFSET.
-
6.
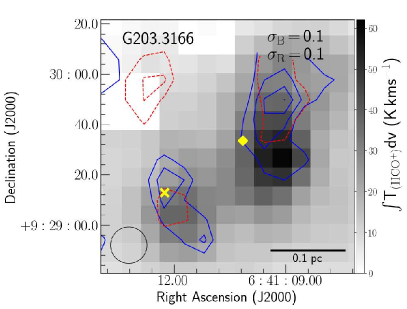
Towards G203.3166, two H13CO+ components are identified in the dendrogram fit; the first feature is coincident with the RMS source position and the second component is offset by 37″ to the south east of the RMS position. The offset component, labeled G203.3166-OFFSET, is located at R.A. (J2000) 06h41m12.1s, Dec. (J2000) 09∘2911.3, and is coincident with the position of C-MM3 (see Cunningham et al. 2016 and references therein).
3.1.2 HCO+ column density estimates
We estimate the HCO+ column density, assuming that the H13CO+ emission is optically thin, following,
| (1) |
where is either the average of the H13CO+ integrated intensity (where the emission is the average over all pixels in the dendrogram fit) or the peak H13CO+ integrated intensity extracted at the peak of the H13CO+ emission, and N is then the average or peak column density. Q(Tex) is the partition function, and is well approximated by Q(Tex)(kTex)/(hB) for linear rotators, where B is the rotational constant and Tex is the excitation temperature. Aul is the Einstein A coefficient in s-1, gu is the degeneracy of the upper energy state and Eu is the energy of the upper state. We assume a value of 44 K for the excitation temperature as used by Klaassen & Wilson (2007). Furthermore, towards a similar sample of RMS selected young massive star forming regions (Cunningham, 2015) an average rotational temperature of 44 K was derived from the CH3CN (J5-4) ladder. The HCO+ column densities are estimated assuming an abundance ratio between H13CO+ and HCO+ to be 65 (Rygl et al., 2013) and are given in Table 3. In addition, we also provide mass estimates for individual sources in Table 3. The masses are taken from Maud et al. (2015a), derived using the 850m SCUBA fluxes. For sources not listed in Maud et al. (2015a), we follow the same procedure and extract the 850m fluxes from Di Francesco et al. (2008) checking that the SCUBA positions are coincident with the position of the offset emission. The mass estimates are used in Sections 4.2, 4.3, and 4.3.1 for comparison with the SiO luminosities, and are used in the bolometric-luminosity-to-mass ratio in Figure 4.
| Source | RMS | SiO | H13CO+ | HCO+ | Line Asymmetrya | Herschel | |
|---|---|---|---|---|---|---|---|
| Name | Type | (8-7) | (4-3) | (4-3) | Average | Peak | 70m flux |
| CO outflow detection | |||||||
| G010.8411 | YSO | N | Y | Y | N | N | – |
| G012.9090 | YSO | Y | Y | Y | N | N | Y |
| G013.6562 | YSO | Y | Y | Y | R | N | Y |
| G017.6380 | YSO | N | Y | Y | N | B | Y |
| G018.3412 | YSO | Y | Y | Y | N | N | Y |
| G043.3061 | HII | Y | Y | Y | B | R | Y |
| G050.2213 | YSO | Y | Y | Y | N | N | Y |
| G078.1224 | YSO | Y | Y | Y | N | N | Y |
| G079.1272 | YSO | Y | Y | Y | N | N | Y |
| G079.8749 | HII | N | Y | Y | R | R | Y |
| G079.8749-OFFSET | – | N | Y | Y | N | B | Y |
| G081.7133 | HII | Y | Y | – | – | – | Y |
| G081.7220 | HII | Y | Y | Y | B | B | Y |
| G081.7522 | YSO | Y | Y | – | – | – | Y |
| G081.7522-OFFSET | – | N | Y | – | – | – | Y |
| G081.7624 | YSO | N | N | – | – | – | Y |
| G081.7624-OFFSET | – | Y | Y | – | – | – | Y |
| G081.8652b | YSO | N | N | Y | – | – | Nc |
| W75Nb | – | Y | Y | Y | R | N | Y |
| G081.8789b | HII | N | N | Y | – | – | Nc |
| G083.0936 | HII | N | Y | Y | N | N | – |
| G083.7071 | YSO | N | N | Y | N | N | – |
| G083.7071-OFFSET | – | N | Y | Y | N | B | – |
| G083.7962 | HII | N | Y | Y | R | N | – |
| G103.8744 | YSO | N | Y | Y | N | B | Y |
| G109.8715 | YSO | Y | Y | Y | N | B | Y |
| G192.6005 | YSO | Y | Y | Y | N | N | Y |
| G194.9349 | YSO | N | Y | Y | N | N | Y |
| G203.3166 | YSO | Y | Y | Y | R | R | Y |
| G203.3166-OFFSET | – | Y | Y | Y | B | N | Y |
| G207.2654 | HII/YSO | Y | Y | Y | N | N | Y |
| No CO outflow detection | |||||||
| G080.8645 | HII | N | Y | – | – | – | Y |
| G080.9383 | HII | N | N | – | – | – | Y |
| G081.7131 | YSO | N | N | – | – | – | Y |
| G196.4542 | YSO | N | Y | Y | N | N | – |
| G217.3771 | HII | N | Y | – | – | – | Y |
| G233.8306 | YSO | N | N | – | – | – | Y |
Notes
() The line asymmetry is given for both the average and peak emission, and is denoted by a B for a blue asymmetry where V 0.25, R for red asymmetry where V 0.25, and N for no asymmetry.
() These sources are all spatially located within 1 arcminute. The H13CO+ emission peaks between the two RMS sources, 40″ from G081.8789, and 20″ from G081.8652. While H13CO+ emission does extend over the whole region, there appears to be no obvious extension or enhancement towards either RMS source, therefore the H13CO+ component is associated with the offset position, W75N, and G081.8789 and G081.8652 are classed as non-detections and their HCO+ properties are not estimated.
() Herschel 70m emission extends over both sources, however the dendrogram fit cannot separate the emission from the dominant 70m component in the field which is associated with the offset position, W75N.
3.2 Detecting active outflow signatures with SiO
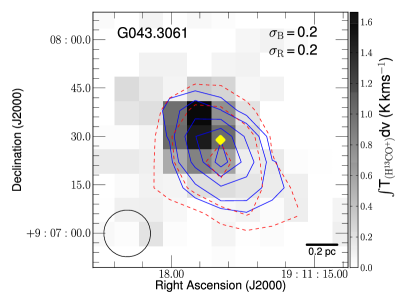
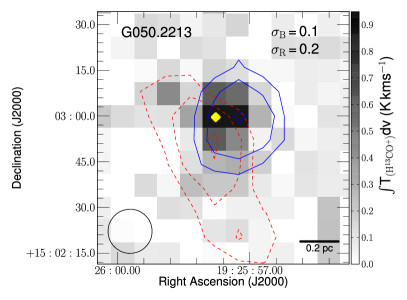
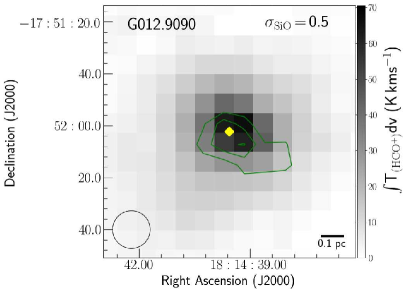
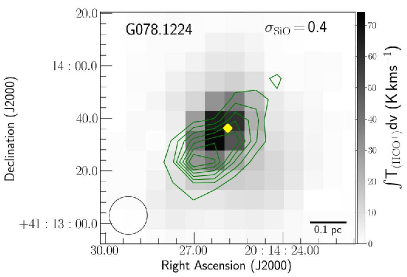
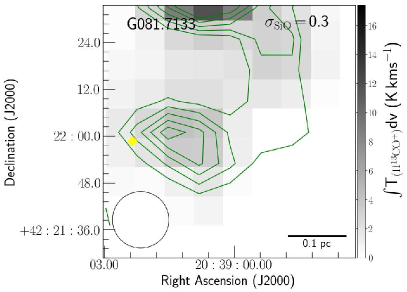
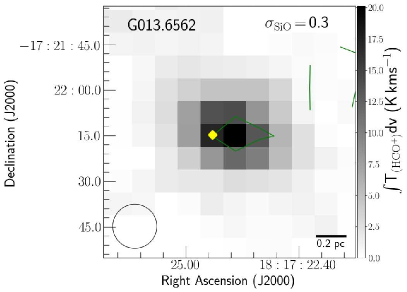
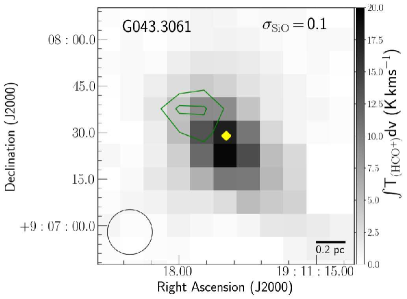
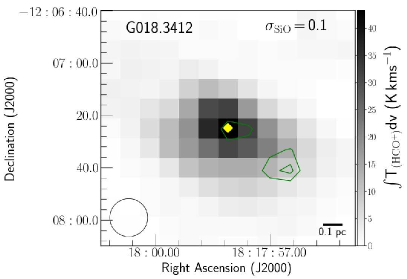
A source is determined to have an SiO detection if a minimum 3 detection is obtained in at least one pixel in the SiO integrated intensity maps. The integrated SiO intensity is extracted from the zeroth order moment maps, where the velocity range is determined using either the velocity of the upper and lower channels above 3 in the SiO channel maps (where possible) or from the 12CO linewidths taken from Maud et al. (2015b). Furthermore, only pixels situated within the respective H13CO+ integrated intensity mask are considered (this was done to eliminate the possibility of a spurious detection that may appear towards the edge of the maps being identified as a detection). The SiO luminosity (in units of K kpc2) is calculated from L Tmb(SiO)dv4d2, where T(SiO)dv is the SiO integrated intensity extracted from the sum of the pixels in the zeroth order moment maps (see Table 3 for individual source values and Figure B2 of the online data for individual SiO integrated intensity maps), and d is the distance to the respective source. For sources without an SiO detection, we estimate the 3 upper limits using the rms in a single pixel. For the 6 sources without a CO outflow detection a velocity interval of 26 (the average 12CO linewidth of the SiO non-detections) is used to estimate the upper limit of the SiO luminosity.
SiO J 8-7 is detected towards 14 (45%) of the 31 RMS sources observed (excluding both sources, G045.0711 and G020.7617, that fall outside of the distance limits), see Table 2 for a list of detections towards individual sources. We do not detect SiO emission towards the 6 sources without a confirmed CO outflow in Maud et al. (2015b). We detect SiO emission towards 3 of the 6 defined OFFSET sources, G203.3166-OFFSET, G081.7624-OFFSET and W75N. Therefore, we detect SiO emission, including the offset sources, towards 17(46%) of the distance limited sample (see Table 4).
For completeness, we also provide an estimate of the average SiO column density (NSiO) and average abundance (XSiO) in Table 3. We calculate the SiO column density using Equation 1 substituting the values for SiO (8-7). For the SiO abundance, we derive the N column density using the 12CO (3-2) column densities given in Maud et al. (2015b), averaged over the blue- and red-shifted outflow lobes. The CO (3-2) column densities were used because the SiO emission is likely to be produced as a result of shocks in the jet/outflow and is not expected to be associated with the compact continuum emission tracing the core. However, in doing this we also assume that SiO arises from the same component in the outflow as the CO emission, which may not be the case.
| Source | Peak N | Average N | Average NSiO | Average XSiO | Mass | |
| Name | (cm-2) | (cm-2) | (cm-2) | (M⊙) | (K km s-1) | |
| (1013) | (1013) | (1012) | (10-9) | |||
| SiO Detection | ||||||
| G012.9090 | 24.28.6 | 5.42.4 | 3.40.7 | 1.10.2 | 1167 | 25.4 |
| G013.6562 | 5.10.7 | 4.50.4 | 2.00.4 | 0.50.2 | 1385 | 5.2 |
| G018.3412 | 12.10.7 | 4.30.3 | 1.60.4 | 1.10.2 | 224 | 1.0 |
| G043.3061 | 4.81.3 | 3.50.4 | 0.80.2 | – | 595 | 3.2 |
| G050.2213 | 2.70.9 | 2.10.5 | 2.00.4 | 2.50.7 | 397 | 1.2 |
| G078.1224 | 17.60.8 | 6.10.3 | 4.30.7 | 6.71.1 | 90 | 53.1 |
| G079.1272 | 4.10.7 | 3.00.4 | 1.80.2 | 5.41.1 | 24 | 2.1 |
| G081.7133 | 11.51.3 | 8.00.8 | 3.40.7 | 1.80.2 | 367 | 35.0 |
| G081.7220 | 69.92.0 | 15.20.5 | 10.01.3 | 18.02.9 | 312 | 132.0 |
| G081.7522 | 10.70.8 | 4.90.3 | 2.00.7 | 1.10.2 | 272 | 1.2 |
| G081.7624-OFFSET | 6.120.9 | 3.40.5 | 4.00.7 | 3.60.7 | 201 | 44.6 |
| W75N | 102.11.5 | 17.50.3 | 6.70.2 | 2.50.2 | 647 | 98.3 |
| G109.8715 | 62.31.4 | 15.40.4 | 6.50.9 | 1.80.2 | 112 | 85.8 |
| G192.6005 | 14.71.0 | 10.50.6 | 2.50.7 | 3.40.9 | 130 | 17.2 |
| G203.3166 | 11.40.8 | 4.70.2 | 1.80.5 | 19.84.3 | 61 | 19.6 |
| G203.3166-OFFSET | 8.90.6 | 4.30.2 | 2.20.4 | – | 33 | 11.8 |
| G207.2654 | 7.11.5 | 4.00.5 | 2.20.7 | 5.61.4 | 172 | 4.4 |
| SiO Non-detection | ||||||
| G010.8411 | 12.21.5 | 4.30.4 | 1.3 | – | 139 | 0.9 |
| G017.6380 | 19.10.7 | 5.40.2 | 1.3 | – | 374 | 0.8 |
| G079.8749 | 2.70.7 | 2.00.4 | 1.1 | – | – | 0.7 |
| G079.8749-OFFSET | 16.11.3 | 5.70.3 | 1.1 | – | – | 0.7 |
| G081.7522-OFFSET | 10.81.0 | 5.40.3 | 1.3 | – | – | 0.9 |
| G083.0936 | 2.41.3 | 1.60.6 | 0.9 | – | – | 0.5 |
| G083.7071-OFFSET | 2.50.9 | 2.20.6 | 1.3 | – | – | 0.8 |
| G083.7962 | 3.50.9 | 3.50.6 | 1.3 | – | – | 0.9 |
| G103.8744 | 4.51.1 | 3.70.8 | 1.6 | – | 91 | 1.0 |
| G194.9349 | 3.10.9 | 2.30.6 | 1.3 | – | – | 0.9 |
| No SiO or CO Outflow Detected | ||||||
| G080.8645 | 6.30.7 | 3.40.3 | 1.3 | – | 137 | 0.8 |
| G196.4542 | 3.50.9 | 2.10.5 | 1.6 | – | 167 | 1.0 |
| G217.3771 | 1.80.9 | 1.20.4 | 1.3 | – | – | 0.8 |
| Source | Total | SiO | Total | Blue Asymmetrica | |
|---|---|---|---|---|---|
| Type | 3 | HCO+ | Profile | ||
| Observed | Ave | Peak | |||
| YSO | 20 | 10 | 16 | 0 | 3 |
| HII | 10 | 3 | 6 | 2 | 1 |
| HII/YSO | 1 | 1 | 1 | 0 | 0 |
| OFFSET | 6 | 3 | 4 | 1 | 2 |
| Total (%) | 37 | 17(46%) | 27(73%) | 3(12%) | 6(24%) |
Notes
() The asymmetry is derived for 25 sources using the H13CO+ and HCO+ emission extracted from both the average (Ave) and peak (Peak) spectra. Where the average spectra are taken from the emission averaged over all pixels taken from the dendrogram fits and the peak spectra are taken from the pixel at the peak of the H13CO+ emission.
3.3 Infall signatures determined from the HCO+ and H13CO+ emission
Both HCO+ (4-3) and H13CO+ (4-3) are dense-gas tracers (n8106cm-3) and, as such, their emission can be used to probe the dynamics of the dense-gas, such as infall or expansion. Infall is typically interpreted if a blue asymmetry, either from a double-peaked line profile with a brighter blue peak or a single-peak profile, is observed in the optically thick HCO+ transition, and is offset from the optically thin isotopologue, H13CO+, which shows only a single peaked component at rest velocity (e.g. Myers et al. 1996). A single-peak in the optically thin H13CO+ (4-3) line allows us to distinguish between self absorption and multiple line of sight components in the optically thick HCO+ profile. The predominance of either a blue or red asymmetry is quantified by the skewness parameter (Mardones et al., 1997) which is estimated from,
| (2) |
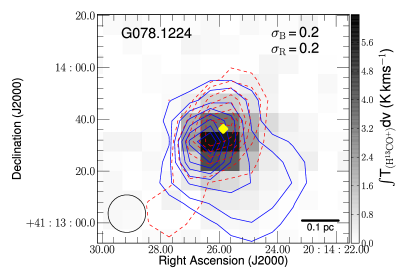
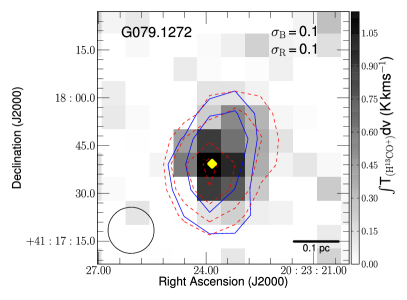
where Vthick and Vthin are the LSR velocities at line peak for the optically thick HCO+ (4-3) and optically thin H13CO+ (4-3) transitions, respectively. The velocity difference is then normalized by the FWHM of the optically thin H13CO+ line ( Vthin). The H13CO+ FWHM and VLSR are taken from the Gaussian fits presented in Table 7 of the Appendix and Vthick is taken from the position of the brightest emission peak in the HCO+ spectrum. To explore the presence of global infall in these regions, the spectra shown in Figure 2 are extracted from the average of the emission over all pixels within the dendrogram-fitted masks. The result is then the dimensionless skewness parameter V. A significant blue or red excess is defined as V 0.25 or V 0.25, respectively (Mardones et al., 1997). Of the sources where it was possible to determine the asymmetries, 3 objects show a blue excess indicative of infall and 5 show a red excess (expansion) and 17 show no red or blue excess. All 3 sources with a blue excess have a corresponding SiO detection and 3 of the 5 sources with a red excess have an SiO detection (see Table 2 for individual sources). The number of sources with an infall detection is consistent with the number of sources without an infall detection given the Poisson errors of 31.7 and 52.25 respectively. However, as the emission is extracted from the full source extent and likely encompasses multiple protostars, this may add noise and mask the signs of global infall. Therefore, we also assess the asymmetry considering the spectra from the H13CO+ peak position, finding a total of 6 sources (see Table 2) with a blue asymmetry and 3 with a red asymmetry. Only a single source G081.7220 displays a blue asymmetry in both the averaged and peak spectra. Furthermore, the Poisson errors are again consistent for sources displaying a blue and red asymmetry of 62.5 and 31.7, respectively. This suggests that the majority of sources in our sample show no preference for global infall motions. However, an important consideration is the sensitivity for infall asymmetry to line optical depth, excitation temperature, and density. Smith et al. (2013) find an increase in the blue asymmetry of the optically thick line with decreasing beam size, suggesting that matching the beam size with the energy of line transition will increase the detection of infall signatures. Furthermore, as noted we are likely sensitive to multiple sources within the JCMT beam which can add noise to the observations. Future higher spatial resolution observations, resolving individual protostars, will be able to directly test this. It should also be noted that HCO+ is a known tracer of outflow emission in massive star forming regions (e.g. Walker-Smith et al. 2014), and several of the regions display broad line wings in the HCO+ spectra which can be clearly seen in Figure 2 (e.g. G109.8715). In addition, several sources show an offset between the red- and blue-shifted HCO+ emission in Figure B1 of the online data (e.g. G050.2213, G192.6005, and G207.2654), again suggesting that the HCO+ emission is influenced by the outflow in several regions. Furthermore, sources that display no asymmetric line profile in the HCO+ spectra, taken over the whole source extent, but show a blue asymmetric profile in the spectra taken from the peak, tend to show multiple components in the red- and blue-shifted HCO+ emission maps (e.g. G017.6562 and G083.7071-OFFSET). This may add to the lack of consistency between the presence of asymmetry in the peak and average spectral line profiles.
3.4 Far-IR associations
We obtain 70m Herschel PACS fluxes for 25 of the 31 RMS sources with available data in the archive. The 70m flux was extracted using dendrogram fits, again using the python package astrodendro. The minimum number of contiguous pixels was set to the beam area of the Herschel map and the minimum detection was set to 5. The rms noise for each source was determined from an aperture local to that source and not from the entire map, therefore larger regions with higher levels of emission may have higher noise estimates. We assign Herschel 70m emission to an H13CO+ component if the peak of the 70m emission is within 14.5″ of the peak of the H13CO+ component (see Table 2 for the association of a 70m component with a respective H13CO+ component). Of the 25 RMS sources with available Herschel 70m data, 23 have an associated Herschel peak. Only G081.8652, and G081.8789 do not have an associated 70m component. However, as with the H13CO+ emission towards these sources, 70m emission extends over both RMS source positions but there is no obvious enhancement towards either RMS source and the peak of the 70m emission coincides with the offset H13CO+ component, W75N. All of the OFFSET sources have an associated 70m component within 14.5″ of the identified H13CO+ peak555It should be noted that for G203.3166-OFFSET when observed at higher spatial resolution (e.g. Cunningham et al. 2016) the 70m emission is not directly associated with the offset position C-MM3. The sum of the 70m flux, within the dendrogram mask, is converted to a luminosity through L70μm = 4d2. F70μm, using a 25m bandwidth for the Herschel 70m PACS filter.
| Source properties | SiO-detecteda | No SiO Detecteda | No SiO or CO Detecteda | KS-testb | |||||||
|---|---|---|---|---|---|---|---|---|---|---|---|
| Mean | Median | Mean | Median | Mean | Median | No SiO | No SiO | ||||
| or CO | |||||||||||
| Distance (kpc) | 1.91.1 | 1.4 | 1.60.3 | 1.4 | 2.11.1 | 1.4 | 0.45 | 0.63 | |||
| L∗ (L⊙ 103) | 1312 | 11 | 1527 | 5 | 2018 | 11 | 0.52 | 0.51 | |||
| H13CO+ FWHMc (km s-1) | 2.90.8 | 2.7 | 2.00.5 | 1.9 | 2.70.5 | 2.5 | 0.05 | 0.11 | |||
| C18O FWHM (km s-1) | 2.90.7 | 2.6 | 2.60.7 | 2.7 | – | – | 0.48 | – | |||
| L70μm( L⊙ 102) | 2730 | 18 | 1734 | 2 | 1815 | 10 | 0.21 | 0.33 | |||
| Mass (M⊙) | 364378 | 224 | 201124 | 139 | 10764 | 137 | 0.91 | 0.18 | |||
| Average N( cm-2 1013) | 6.94.7 | 4.7 | 3.61.5 | 3.6 | 2.30.9 | 2.1 | 0.29 | 0.06 | |||
| Peak N( cm-2 1013) | 22.127.4 | 11.4 | 7.76.0 | 4.2 | 3.91.9 | 3.5 | 0.12 | 0.04 | |||
| 12CO linewidth (km s-1) | 4819 | 56 | 266 | 25 | – | – | 0.009 | – | |||
Notes
() The mean is given with standard deviation. For the No SiO Detected sample the mean and median values are estimated considering sources without an SiO-detection that have a CO outflow detection. For the No SiO or CO Detected column the mean and median values are estimated considering only those sources with no SiO and no CO outflow.
. () The results of the KS test for the No SiO column is considering sources with and without and SiO detection that have a CO outflow detection. The No SiO or CO is considering all sources without an SiO detection, including those sources with no CO outflow in Maud et al. (2015b).
() The H13CO+ FWHM presented here is extracted from the dendrogram fits to the full source extent.
4 Discussion
4.1 Comparison of SiO-detected and non-detected source properties
SiO emission is detected towards approximately 46% of the sources. Table 5 presents the average, median, and standard deviation of the source properties (e.g., bolometric luminosity, distance, and HCO+ column density) for the SiO-detected and non-detected samples. For completeness we also include sources without an SiO or a CO outflow detection. We perform Kolmogorov-Smirnoff (KS) tests to determine if the source properties of the SiO-detected and non-detected sources are drawn from the same underlying distribution. The returned p-value from the KS test gives the confidence level at which the null hypothesis (i.e. that the two samples originate from the same underlying distribution) can be rejected. A value of 0.01 is associated with a high confidence that the two populations originate from different underlying distributions. We find no difference in the distance to sources with or without an SiO detection. The median distance is 1.4 kpc for both samples. If the emission traced by SiO is considerably smaller than the beam, suggesting a very young outflow, then beam dilution may be responsible for the remainder of the SiO non-detections. However, this would need to be tested with higher angular resolution observations. We note that several of the SiO non-detections have the weakest H13CO+ emission in the sample, but there is no obvious difference in the masses or bolometric luminosities between populations. Therefore, the lack of an SiO detection towards these sources should not be due to sensitivity limitations in the sample.
We find no significant differences between the source properties of the SiO-detected and SiO non-detected populations (see Table 5 for a list of all returned p-values). If we compare the outflow properties taken from Maud et al. (2015b), such as the outflow velocity, momentum, force, mass and energy, we find only the CO outflow velocity has a p-value 0.01 between the SiO-detected and SiO non-detected sample. Furthermore, only sources with an SiO detection have a 12CO (3-2) total linewidth 35 , suggesting SiO emission is a more efficient tracer of high-velocity outflows. This is consistent with the CO outflow velocity ranges observed by Gibb et al. (2007) towards a sample of young massive stars, where sources with detected SiO (5-4) have associated outflows with a total maximum CO velocity of 36 . This suggests that the detection of the higher J transitions of SiO is an indication of the presence of a high-velocity outflow and is consistent with the expected shock velocities (25 ) required to disrupt dust grains (e.g. Schilke et al. 1997). For the remaining CO outflow properties we find no difference between the SiO-detected and non-detected samples. However, we find the total outflow-mass between the two populations has a p-value0.9999, thus the outflow-masses estimated from the CO emission are drawn from the same distribution.
4.2 SiO luminosity as a function of source properties
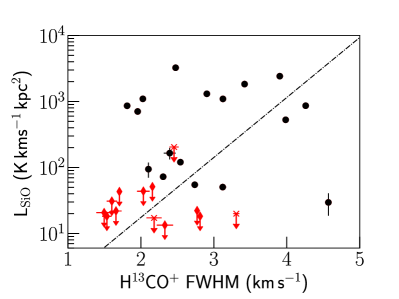
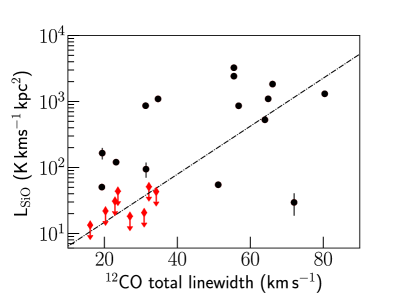
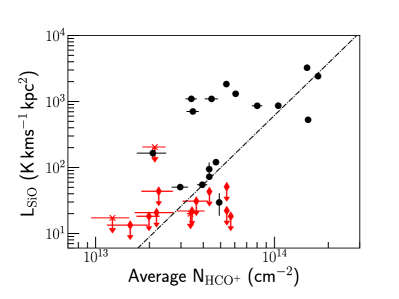
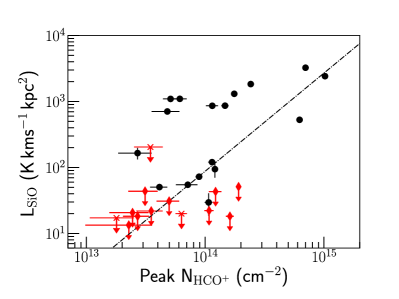
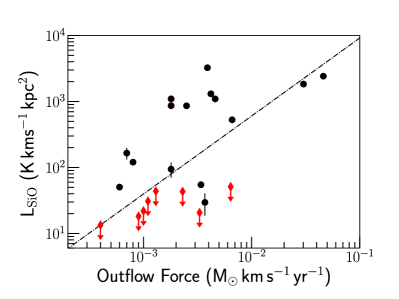
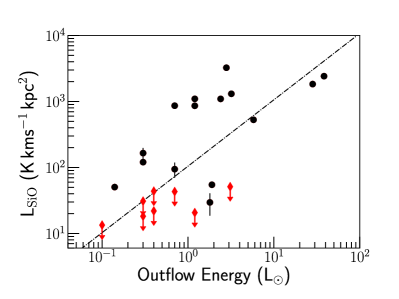
We perform Spearman rank correlations along with linear regression fits to the estimated source properties as a function of the SiO luminosity with the outcomes presented in Table 6. We assume that a correlation is significant, given the small sample sizes, if a P-value of 0.01 is found and a correlation coefficient (R) of 0.53 is obtained. The H13CO+ FWHM, HCO+ column density (both the peak and average), 12CO (3-2) total linewidth or outflow velocity, outflow force and energy are all found to correlate with the SiO luminosity and are presented in Figure 3. We find no correlation between the bolometric luminosity, source mass, outflow-mass, or momentum with the SiO luminosity.
The correlation of the SiO luminosity with the H13CO+ FWHM was also observed by Klaassen et al. (2012) in their sample of high mass star forming regions. Furthermore, for both the SiO-detected and non-detected sources, the H13CO+ FWHM is greater than would be estimated considering only the linewidth-size relation (Larson, 1981), and may then be a measure of the turbulence in these regions. This would suggest an increase in turbulence with increasing SiO luminosity, which may be a product of the shocks associated with the production of SiO. However, no correlation is observed between the C18O FWHM from Maud et al. (2015a) and the SiO luminosity. Towards several sources (e.g. G050.2213, G192.6005, and G207.2654) the HCO+ red- and blue-shifted emission (see Figure B1 in the online data) appears to be offset, indicating the HCO+ emission is tracing the outflows in these sources. Thus, it may also be the case that the H13CO+ emission is sensitive to the outflows in these regions. A correlation is observed between the SiO luminosity and the HCO+ column density, which suggests a preference for increased SiO emission towards sources with higher densities, as seen in the low mass regime (Gibb et al., 2004). Furthermore, we find the SiO luminosity is correlated with the CO outflow velocity, again showing the association of SiO emission with high velocity outflows as seen in previous works (e.g. Gibb et al. 2007).
| Correlation with LSiO | N | P-value | R | Linear fit | |
|---|---|---|---|---|---|
| L∗ (L⊙) | 32 | 0.509 | – | – | |
| H13CO+ FWHM (km s-1) | 30 | 0.003 | 0.66 | Log10(LSiO) = (0.910.18)H13CO+ FWHM 0.58 | |
| C18O FWHM (km s-1) | 23 | 0.121 | – | – | |
| L70μm (L⊙) | 29 | 0.049 | – | – | |
| Mass (M⊙) | 23 | 0.033 | – | – | |
| N Peak (cm-2) | 30 | 0.003 | 0.59 | Log10(LSiO) (1.490.38)Log10(N) 18.89 | |
| N Average (cm-2) | 30 | 0.003 | 0.64 | Log10(LSiO) (2.630.62)Log10(N) 34.05 | |
| 12CO linewidth(km s-1) | 23 | 0.004 | 0.62 | Log10(LSiO) (0.040.01)12CO linewidth + 0.44 | |
| Mtotal (M⊙) | 23 | 0.54 | – | – | |
| Ptotal(M⊙km s-1) | 23 | 0.08 | – | – | |
| Etotal (ergs) | 23 | 0.02 | – | – | |
| (M⊙yr-1) | 23 | 0.11 | – | – | |
| (M⊙kms-1yr-1) | 23 | 0.01 | 0.60 | Log10(LSiO) (1.180.32)Log10() + 5.14 | |
| (L⊙) | 23 | 0.004 | 0.67 | Log10(LSiO) (1.000.25)Log10() + 2.02 |
4.3 SiO luminosity with source evolution
SiO emission was predominantly detected towards Class 0 sources in the low-mass regime (Gibb et al., 2004) suggesting a preference for SiO emission towards younger, denser sources with faster outflows. However, in the high-mass regime the evolutionary sequence and outflow properties are less constrained, and previous works have found the observed SiO luminosity and integrated intensity to both increase and decrease as a function of evolution (e.g. Klaassen et al. 2012; Sánchez-Monge et al. 2013; Leurini et al. 2014). In this work we aim to establish if an evolutionary trend, as seen in the low-mass regime, does transfer to the high-mass regime. With this in mind, we purposely selected a sample of massive star forming regions from the RMS survey with a range of luminosity and evolutionary stage (categorised into two evolutionary stages in the RMS survey; massive YSOs (MYSOs) and compact HII regions, see Lumsden et al. 2013). A KS test shows no significant difference in the SiO luminosity between the MYSOs and HII regions. Moreover, the SiO luminosities of the OFFSET and HII/YSO sources also show no obvious differences compared with the MYSO sample.
4.3.1 Evolutionary indicators
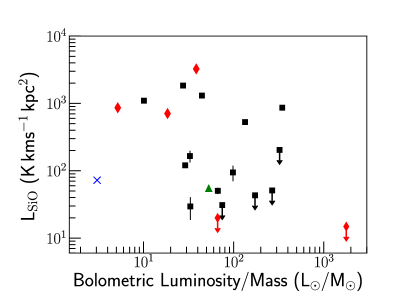
We adopt the approach used by Sánchez-Monge et al. (2013) and López-Sepulcre et al. (2011) and compare the bolometric luminosity-to-mass ratio (Lbol/M⊙), suggested as an indicator of the age of a given source, to the SiO luminosity in Figure 4. Molinari et al. (2008) showed that as a source evolves the luminosity is expected to increase more rapidly than the core envelope mass, which is expected to decrease only slightly due to mass loss from winds and jets. An increase in the bolometric luminosity-to-mass ratio would potentially indicate a more advanced evolutionary stage. We find that all of the SiO non-detected sources have higher (50 L⊙/M⊙) bolometric-to-luminosity ratios. The result of the KS test returns a p-value of 0.009 between the SiO-detected and SiO non-detected samples, suggesting they are drawn from different populations. However, it should be noted that the sample size for the non-detected sources is low and includes 3 of those sources without either an SiO detection or an associated CO outflow. As with the bolometric luminosity, we find no difference between the RMS classifications. This was previously observed by both Urquhart et al. (2014) and Maud et al. (2015a), where no indistinguishable differences in the bolometric luminosity-to-mass ratios between the MYSOs and compact HII regions from the RMS survey were found. This suggests that these sources are either likely to be at a similar evolutionary stage or it may be the case that the luminosity for this IR-bright stage has stopped rapidly increasing and the bolometric luminosity-to-mass ratio may not be sensitive enough to distinguish the evolutionary stages in this sample. For the offset source G203.3166-OFFSET or CMM-3666The bolometric luminosity for this source is taken from Cunningham et al. (2016) and the mass is taken from the SCUBA mass estimated here. this source shows the smallest bolometric luminosity-to-mass ratio in the sample, in agreement with it being a young protostar (e.g. Cunningham et al. 2016; Watanabe et al. 2015).
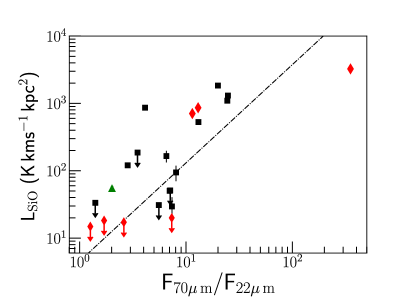
In addition, we use the ratio of mid- to far-IR colours as a potential indication of age in these sources. In Figure 5 we plot the ratio of the 70m flux estimated from the Herschel data with the 22m WISE flux (F70/F22)777The WISE flux is extracted directly from the RMS survey database, for one source, G012.9090, which does not have a WISE flux, the MSX 21m flux is used.. As a source evolves and the emission moves to shorter wavelengths, we would expect the F70/F22 colour ratio to decrease. A Spearman rank correlation test gives a correlation coefficient of 0.76 and probability of a false correlation given by 0.001 between the SiO luminosity and the F70/F22 colour ratio. Thus, the SiO luminosity is stronger in the redder, potentially younger, more embedded sources. This may indicate that the colour ratio is more sensitive to evolution in these sources. However, a KS test between the SiO-detected and SiO non-detected sources only gives a p-value of 0.06 and is therefore not significant between the populations, which may again be a result of these sources being at a similar evolutionary stage. Csengeri et al. 2016 noted that the bolometric luminosity-to-mass ratio can be dominated by the most massive IR-bright source in the region, the F70/F22 colour ratio is also likely to suffer from this. Furthermore, as suggested by Maud et al. (2015b) there is evidence that several of these regions are likely to host multiple outflows at this spatial resolution (e.g. G081.7220/DR21 OH; Girart et al. 2013, CMM-3 in NGC2264-C; Watanabe et al. 2017). Additionally, we are assuming that the SiO emission is associated with the IR-bright RMS source in all regions, which was not the case towards G203.3166/NGC2264-C (Cunningham et al., 2016). This is likely to add scatter to the statistics.
5 Conclusions
We present the results of a JCMT SiO (8-7), H13CO+ and HCO+ (4-3) survey towards a distance limited sample of 31 massive star-forming regions drawn from the RMS survey. The presence of a young, active outflow is associated with the detection of SiO (8-7) emission and we use previous 12CO (3-2) data (Maud et al., 2015b) to determine outflow properties and identify potential fossil outflows. We explore the presence of possible global infall from the HCO+ and H13CO+ (4-3) emission. Our results are summarized below.
-
1.
We detect SiO (8-7) emission towards 46% of the sources, where the lack of an SiO detection does not appear to be due to sensitivity limitations or distance to the sources. We find only the CO outflow velocity shows a significant difference between SiO-detected (i.e. a potentially active outflow) and SiO non-detected (i.e. a potentially fossil remnant driven outflow) sources. Thus, the detection of SiO is an indication of the presence of a high velocity, likely active outflow and is consistent with the expected shock velocities required to disrupt dust grains. In addition, correlations between the SiO luminosity and the H13CO+ FWHM, HCO+ column density, 12CO (3-2) total outflow velocity, outflow force and energy are found. Thus, the production and strength of the SiO emission is increased towards potentially more turbulent regions with increased column densities. Similarly, regions with faster and more powerful outflows are more likely to produce stronger SiO emission, as observed in the low mass regime. However, it is possible the H13CO+ is also tracing the outflow emission in these sources.
-
2.
We find tentative evidence from the bolometric-luminosity-to-mass ratio and F70/F22 colour ratios that sources with an SiO detection are associated with potentially younger, more embedded regions. However, if multiple outflows are present or the SiO emission is not associated with the RMS source this would likely add scatter to the statistics. Higher resolution observations are required to fully explore this.
-
3.
We do not find a significant number of blue asymmetric profiles, indicative of global infall, towards these sources. However, HCO+ (4-3) may not be best suited tracer, at this spatial resolution, to detect global infall signatures in these sources. Higher spatial resolution observations, where infall motions onto individual protostars can be resolved, will be able to directly probe this.
Acknowledgments
We thank the referee for their useful comments which improved the clarity of this manuscript. NC thanks the Green Bank Observatory which is a facility of the National Science Foundation operated under cooperative agreement with Associated Universities, Inc. IM thanks Comunidad Autónoma de Madrid for funding his research through a ”Talento-CAM” fellowship (2016-T1/TIC-1890). This paper has made use of information from the RMS survey database at http://rms.leeds.ac.uk/cgi-bin/public/RMS_DATABASE.cgi which was constructed with support from the Science and Technology Facilities Council of the United Kingdom.
Supporting Information
Additional supporting information may be found in the online version of this article: Appendix B. HCO+, H13CO+ and SiO emission maps. Please note: Oxford University Press is not responsible for the content or functionality of any supporting materials supplied by the authors. Any queries (other than missing material) should be directed to the corresponding author for this article.
References
- Asaki et al. (2014) Asaki Y., Imai H., Sobolev A. M., Parfenov S. Y., 2014, ApJ, 787, 54
- Bally et al. (1999) Bally J., Reipurth B., Lada C. J., Billawala Y., 1999, AJ, 117, 410
- Bonnell et al. (2001) Bonnell I. A., Bate M. R., Clarke C. J., Pringle J. E., 2001, MNRAS, 323, 785
- Bontemps et al. (1996) Bontemps S., Andre P., Terebey S., Cabrit S., 1996, A&A, 311, 858
- Buckle et al. (2009) Buckle J. V., et al., 2009, MNRAS, 399, 1026
- Csengeri et al. (2016) Csengeri T., et al., 2016, A&A, 586, A149
- Cunningham (2015) Cunningham N., 2015, PhD thesis, University of Leeds
- Cunningham et al. (2016) Cunningham N., Lumsden S. L., Cyganowski C. J., Maud L. T., Purcell C., 2016, MNRAS, 458, 1742
- Di Francesco et al. (2008) Di Francesco J., Johnstone D., Kirk H., MacKenzie T., Ledwosinska E., 2008, ApJS, 175, 277
- Duarte-Cabral et al. (2014) Duarte-Cabral A., Bontemps S., Motte F., Gusdorf A., Csengeri T., Schneider N., Louvet F., 2014, A&A, 570, A1
- Feigelson & Nelson (1985) Feigelson E. D., Nelson P. I., 1985, ApJ, 293, 192
- Flower & Pineau des Forêts (2012) Flower D. R., Pineau des Forêts G., 2012, MNRAS, 421, 2786
- Gibb et al. (2004) Gibb A. G., Richer J. S., Chandler C. J., Davis C. J., 2004, ApJ, 603, 198
- Gibb et al. (2007) Gibb A., Davis C., Moore T., 2007, MNRAS, 382, 1213
- Girart et al. (2013) Girart J. M., Frau P., Zhang Q., Koch P. M., Qiu K., Tang Y.-W., Lai S.-P., Ho P. T. P., 2013, ApJ, 772, 69
- Guillet et al. (2009) Guillet V., Jones A. P., Pineau Des Forêts G., 2009, A&A, 497, 145
- Gusdorf et al. (2008) Gusdorf A., Cabrit S., Flower D. R., Pineau Des Forêts G., 2008, A&A, 482, 809
- Isobe et al. (1986) Isobe T., Feigelson E. D., Nelson P. I., 1986, ApJ, 306, 490
- Jenness et al. (2015) Jenness T., Currie M. J., Tilanus R. P. J., Cavanagh B., Berry D. S., Leech J., Rizzi L., 2015, MNRAS, 453, 73
- Klaassen & Wilson (2007) Klaassen P. D., Wilson C. D., 2007, ApJ, 663, 1092
- Klaassen et al. (2012) Klaassen P., Testi L., Beuther H., 2012, A&A, 538, A140
- Kutner & Ulich (1981) Kutner M. L., Ulich B. L., 1981, ApJ, 250, 341
- Larson (1981) Larson R. B., 1981, MNRAS, 194, 809
- Lavalley et al. (1992) Lavalley M., Isobe T., Feigelson E., 1992, in Worrall D. M., Biemesderfer C., Barnes J., eds, Astronomical Society of the Pacific Conference Series Vol. 25, Astronomical Data Analysis Software and Systems I. p. 245
- Leurini et al. (2014) Leurini S., Codella C., López-Sepulcre A., Gusdorf A., Csengeri T., Anderl S., 2014, A&A, 570, A49
- López-Sepulcre et al. (2011) López-Sepulcre A., et al., 2011, A&A, 526, L2
- Lu et al. (2014) Lu X., Zhang Q., Liu H. B., Wang J., Gu Q., 2014, ApJ, 790, 84
- Lumsden et al. (2013) Lumsden S. L., Hoare M. G., Urquhart J. S., Oudmaijer R. D., Davies B., Mottram J. C., Cooper H. D. B., Moore T. J. T., 2013, ApJS, 208, 11
- Mardones et al. (1997) Mardones D., Myers P. C., Tafalla M., Wilner D. J., Bachiller R., Garay G., 1997, ApJ, 489, 719
- Maud et al. (2015a) Maud L. T., Lumsden S. L., Moore T. J. T., Mottram J. C., Urquhart J. S., Cicchini A., 2015a, MNRAS, 452, 637
- Maud et al. (2015b) Maud L. T., Moore T. J. T., Lumsden S. L., Mottram J. C., Urquhart J. S., Hoare M. G., 2015b, MNRAS, 453, 645
- McKee & Tan (2003) McKee C., Tan J., 2003, ApJ, 585, 850
- Minh et al. (2010) Minh Y. C., Su Y.-N., Chen H.-R., Liu S.-Y., Yan C.-H., Kim S.-J., 2010, ApJ, 723, 1231
- Molinari et al. (2008) Molinari S., Pezzuto S., Cesaroni R., Brand J., Faustini F., Testi L., 2008, A&A, 481, 345
- Molinari et al. (2010) Molinari S., et al., 2010, A&A, 518, L100
- Motte et al. (2007) Motte F., Bontemps S., Schilke P., Schneider N., Menten K. M., Broguière D., 2007, A&A, 476, 1243
- Motte et al. (2010) Motte F., et al., 2010, A&A, 518, L77
- Motte et al. (2017) Motte F., Bontemps S., Louvet F., 2017, preprint, (arXiv:1706.00118)
- Mottram et al. (2017) Mottram J. C., et al., 2017, A&A, 600, A99
- Myers et al. (1996) Myers P. C., Mardones D., Tafalla M., Williams J. P., Wilner D. J., 1996, ApJ, 465, L133
- Peretto et al. (2014) Peretto N., et al., 2014, A&A, 561, A83
- Pilbratt et al. (2010) Pilbratt G. L., et al., 2010, A&A, 518, L1
- Poglitsch et al. (2010) Poglitsch A., Waelkens C., Geis N., Feuchtgruber H., Vandenbussche B., Rodriguez L., Krause O., Renotte E., 2010, A&A, 518, L2
- Rygl et al. (2013) Rygl K. L. J., Wyrowski F., Schuller F., Menten K. M., 2013, A&A, 549, A5
- Sánchez-Monge et al. (2013) Sánchez-Monge Á., López-Sepulcre A., Cesaroni R., Walmsley C. M., Codella C., Beltrán M. T., Pestalozzi M., Molinari S., 2013, A&A, 557, A94
- Schilke et al. (1997) Schilke P., Walmsley C. M., Pineau des Forets G., Flower D. R., 1997, A&A, 321, 293
- Schneider et al. (2010) Schneider N., Csengeri T., Bontemps S., Motte F., Simon R., Hennebelle P., Federrath C., Klessen R., 2010, A&A, 520, A49
- Smith et al. (2013) Smith R. J., Shetty R., Beuther H., Klessen R. S., Bonnell I. A., 2013, ApJ, 771, 24
- Tigé et al. (2017) Tigé J., et al., 2017, A&A, 602, A77
- Urquhart et al. (2014) Urquhart J. S., et al., 2014, MNRAS, 443, 1555
- Walker-Smith et al. (2014) Walker-Smith S. L., Richer J. S., Buckle J. V., Hatchell J., Drabek-Maunder E., 2014, MNRAS, 440, 3568
- Watanabe et al. (2015) Watanabe Y., et al., 2015, ApJ, 809, 162
- Watanabe et al. (2017) Watanabe Y., Sakai N., López-Sepulcre A., Sakai T., Hirota T., Liu S.-Y., Su Y.-N., Yamamoto S., 2017, ApJ, 847, 108
- Williams et al. (2018) Williams G. M., Peretto N., Avison A., Duarte-Cabral A., Fuller G. A., 2018, preprint, (arXiv:1801.07253)
- Wu et al. (2014) Wu Y. W., et al., 2014, A&A, 566, A17
Appendix A H13CO+ Gaussian fits
Presented below are the resulting Gaussian fits to the H13CO+ spectra.
| Source | Type | No of pixels | summed Tmb | VLSR | V | summed Tmbdv |
|---|---|---|---|---|---|---|
| Name | (K) | (km s-1) | (km s-1) | (K km s-1) | ||
| CO Outflow | ||||||
| G010.8411-02.5919 | YSO | 17 | 14.380.76 | 11.980.04 | 1.710.10 | 26.122.11 |
| G012.9090-00.2607 | YSO | 38 | 19.940.58 | 37.320.05 | 3.420.11 | 72.653.21 |
| G013.6562-00.5997 | YSO | 4 | 1.900.12 | 48.000.10 | 3.130.23 | 6.320.62 |
| G017.6380+00.1566 | YSO | 33 | 27.570.77 | 22.330.03 | 2.160.07 | 63.382.71 |
| G018.3412+01.7681 | YSO | 21 | 14.370.56 | 32.840.04 | 2.100.10 | 32.191.91 |
| G043.3061-00.2106 | HII | 6 | 2.920.21 | 59.280.08 | 2.400.20 | 7.450.81 |
| G045.0711+00.1325 | HII | 13 | 6.970.14 | 59.100.06 | 6.200.15 | 45.981.43 |
| G050.2213-00.6063 | YSO | 4 | 0.960.15 | 40.360.23 | 2.900.54 | 2.970.72 |
| G078.1224+03.6320 | YSO | 22 | 14.260.46 | -3.320.05 | 3.120.12 | 47.392.35 |
| G079.1272+02.2782 | YSO | 5 | 2.740.26 | -1.580.09 | 1.810.20 | 5.280.77 |
| G079.8749+01.1821 | HII | 5 | 2.160.29 | -4.900.10 | 1.540.24 | 3.530.71 |
| G079.8749+01.1821-OFFSET | – | 19 | 12.840.49 | -3.140.05 | 2.810.12 | 38.442.25 |
| G081.7133+00.5589 | YSO | 8 | 8.630.53 | -4.090.08 | 2.470.18 | 22.762.14 |
| G081.7220+00.5699 | HII | 53 | 58.831.32 | -3.170.05 | 4.570.12 | 286.369.84 |
| G081.7522+00.5906 | YSO | 23 | 18.580.70 | -4.040.04 | 2.030.09 | 40.112.29 |
| G081.7522+00.5906-OFFSET | – | 20 | 13.020.51 | -3.190.05 | 2.770.12 | 38.432.28 |
| G081.7624+00.5916-OFFSET | YSO | 19 | 11.110.94 | -4.340.08 | 1.960.19 | 23.23.03 |
| G081.8652+00.7800 | YSO | – | – | – | – | – |
| W75N | – | 56 | 83.830.75 | 9.670.017 | 3.900.04 | 348.534.78 |
| G081.8789+00.7822 | HII | – | – | – | – | – |
| G083.0936+03.2724 | HII | 4 | 0.890.22 | -3.500.29 | 2.330.67 | 2.220.84 |
| G083.7071+03.2817 | YSO | – | – | – | – | – |
| G083.7071+03.2817-OFFSET | – | 4 | 1.950.35 | -3.620.13 | 1.500.31 | 3.110.85 |
| G083.7962+03.3058 | HII | 4 | 2.780.33 | -4.310.10 | 1.660.23 | 4.910.88 |
| G103.8744+01.8558 | YSO | 5 | 3.800.55 | -18.300.11 | 1.600.27 | 6.491.44 |
| G109.8715+02.1156 | YSO | 71 | 91.631.31 | -10.800.03 | 3.990.07 | 388.878.49 |
| G192.6005-00.0479 | YSO | 5 | 4.110.14 | 7.840.07 | 4.260.17 | 18.650.98 |
| G194.9349-01.2224 | YSO | 4 | 1.480.27 | 15.610.18 | 2.030.43 | 3.200.89 |
| G203.3166+02.0564 | YSO | 50 | 34.051.06 | 8.150.04 | 2.310.08 | 83.603.96 |
| G203.3166+02.0564-OFFSET | – | 28 | 15.870.56 | 7.550.04 | 2.540.10 | 42.962.32 |
| G207.2654-01.8080 | HII/YSO | 12 | 5.770.45 | 12.580.10 | 2.740.24 | 16.831.98 |
| No CO Outflow | ||||||
| G080.8645+00.4197 | HII | 11 | 3.760.22 | -2.750.095 | 3.310.22 | 13.261.17 |
| G080.9383-00.1268 | HII | – | – | – | – | – |
| G081.7131+00.5792 | YSO | – | – | – | – | – |
| G196.4542-01.6777 | YSO | 4 | 1.160.18 | 19.340.18 | 2.460.43 | 3.200.89 |
| G217.3771-00.0828 | HII | 4 | 0.760.17 | 23.930.25 | 2.180.58 | 1.760.62 |
| G233.8306-00.1803 | YSO | – | – | – | – | – |
Appendix B H13CO+, HCO+ and SiO zeroth order moment maps
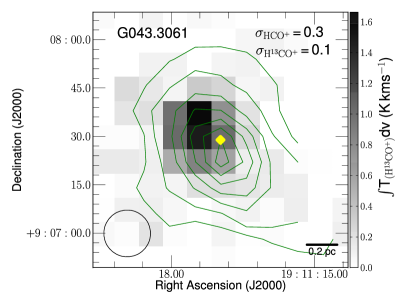
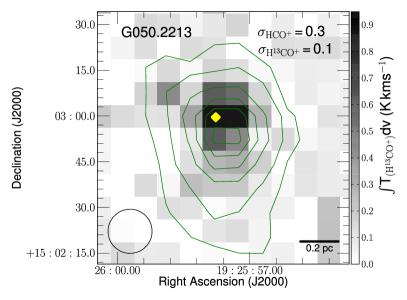
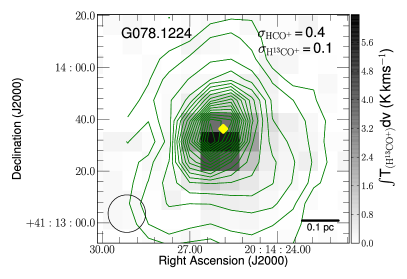
– The velocity ranges used to integrate the total emission are 55.7 – 62.7 for G043.3061, 38.1 – 43.3 for G050.2213, and -8.1 – 1.6 for G078.1224.
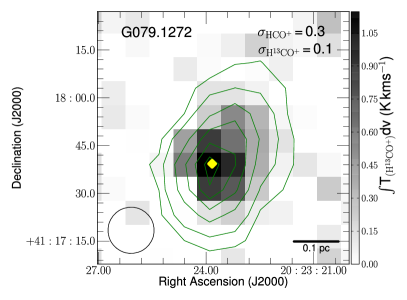

– The velocity ranges used to integrate the total emission are -3.3 – 0.9 for G079.1272, -7.7 – 0.9 for both G079.8749 and G079.8749-OFFSET.
– The velocity ranges used to integrate the total emission are -9.5 – 4.8 for G081.7220, 0.8 – 18.1 for W75N, and -5.1 – -0.1 for G083.0936.
– The velocity ranges used to integrate the total emission are -5.8 – -1.3 for G083.7071-OFFSET, -6.2 – -0.3 for G083.7962, and -20.2 – -16.3 for G103.8744.
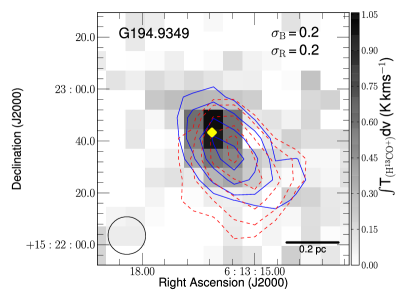
– The velocity ranges used to integrate the total emission are -19.1 – -1.1 for G109.8715, 2.8 – 12.7 for G192.6005, and 12.2 – 18.9 for G194.9349.
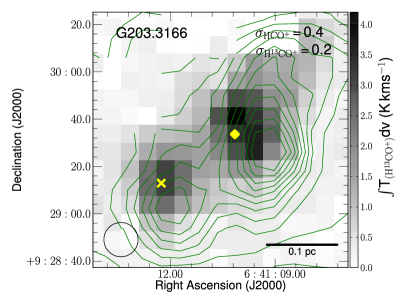
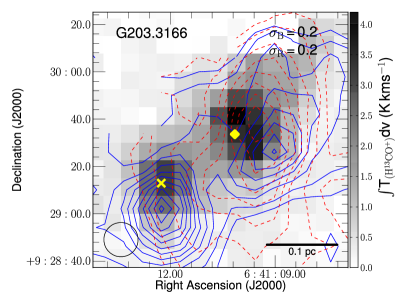
– The velocity ranges used to integrate the total emission are 4.2 – 12.6 for G203.3166, 9.2 – 17.7 for G207.2654, and 16.6 – 22.0 for G196.4542. We do not include a separate map for G203.3166-OFFSET as the emission ranges are similar.
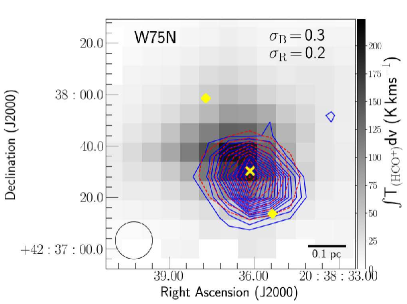
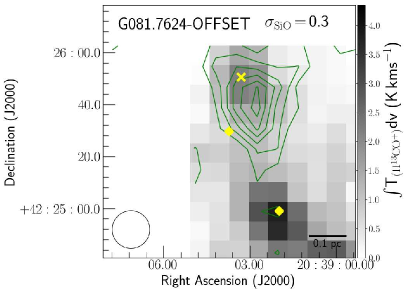
– The velocity ranges used for the total integrated SiO emission are -16.6 – 8.6 for G081.7220, -10 – 21.9 for W75N and -8.2 – 22.0 for G081.7624-OFFSET.
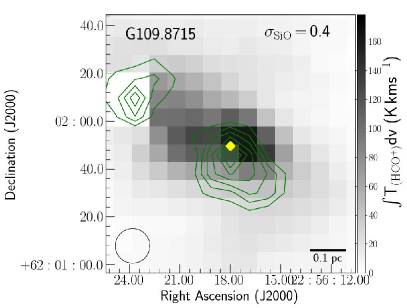
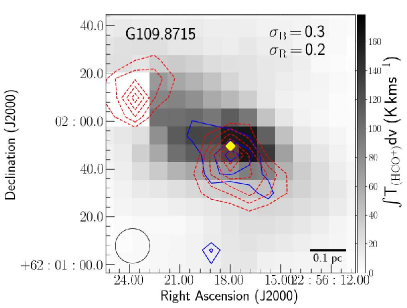
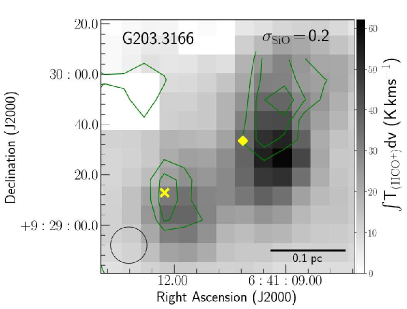
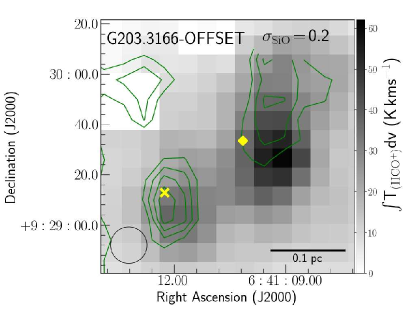
– The velocity ranges used for the total integrated SiO emission are -18.2 – 0.3 for G109.8715, 1.6 – 15.1 for G203.3166, and 3.3 – 25.6 for G203.3166-OFFSET.
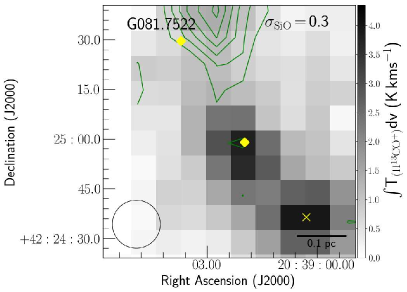
– The velocity ranges used to integrate the emission are 33.0 – 43.6 for G013.6562, 30.5 – 37.3 for G018.3412, 57.5 – 64.2 for G043.3061, 37.0 – 42.0 for G050.2213, -1.5 – 5.2 for G079.1272 and -8.2 – 5.2 for G081.7522. It should be noted that for G081.7522, the velocity range used is the same as for G081.7624-OFFSET as the SiO emission towards G081.7522 is weaker it is difficult to estimate the SiO velocity range for this source.
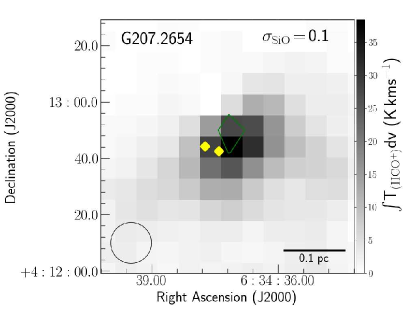
– The velocity ranges used to integrate the emission are 6.8 – 11.9 for G192.6005, and 11.8 – 15.2 for G207.2654.