11email: nmarkova@astro.bas.bg 22institutetext: LMU München, Universitäts-Sternwarte, Scheinerstrasse 1, D-81679 München, Germany
22email: uh101aw@usm.uni-muenchen.de 33institutetext: Argelander-Institut fr̈ Astronomie, Bonn University, Auf dem Hügel 71, 53121 Bonn, Germany
Spectroscopic and physical parameters of Galactic O-type stars
Abstract
Context. Massive stars play a key role in the evolution of the Universe.
Aims. Our goal is to compare observed and predicted properties of single Galactic O stars to identify and constrain uncertain physical parameters and processes in stellar evolution and atmosphere models.
Methods. We used a sample of 53 objects with spectral types from O3 to O9.7. For 30 of these, we determined the main photospheric and wind parameters, using optical spectroscopy and applying the FASTWIND code. For the remaining objects, literature data, obtained by means of the CMFGEN code, were used instead. The properties of our sample were compared to published predictions based on two grids of evolution models that include rotationally induced mixing.
Results. Within each luminosity class, we find a close correlation of N surface abundance and luminosity, and a stronger N enrichment in more massive and evolved O stars. Additionally, a correlation of the surface nitrogen and helium abundances is observed. The large number of nitrogen-enriched stars above 30 argues for rotationally induced mixing as the most likely explanation. However, none of the considered models can match the observed trends correctly, especially in the high mass regime.
Conclusions. We confirm mass discrepancy for objects in the low mass O-star regime. We conclude that the rotationally induced mixing of helium to the stellar surface is too strong in some of the models. We also suggest that present inadequacies of the models to represent the N enrichment in more massive stars with relatively slow rotation might be related to problematic efficiencies of rotational mixing. We are left with a picture in which invoking binarity and magnetic fields is required to achieve a more complete agreement of the observed surface properties of a population of massive main- sequence stars with corresponding evolutionary models.
Key Words.:
stars: massive – stars: early type – stars: fundamental parameters – stars: mass loss – stars: evolution1 Introduction
Over the past two decades, a growing body of theoretical and observational evidence has been assembled indicating that rotation is as important a factor for massive star evolution as mass loss. Consequently, several grids of evolutionary models for massive single stars, accounting for rotation in addition to mass loss, have been computed and made available to the international community (see e.g. Ekström et al. 2012, Brott et al. 2011 and Chieffi & Limongi 2013). While the models make detailed predictions of the surface properties of massive stars as a function of mass, initial chemical composition, and initial rotational rate, it is not in advance clear if and to what extent the physical processes included in the evolutionary calculations are comprehensive and adequately describe the real nature of the stars.
To address this important issue, several large surveys of massive OB stars in the Galaxy and the Magellanic Clouds (e.g. the MiMeS survey, (Wade et al. 2016); the VLT FLAMES survey of massive stars, (Evans et al. 2006); and the VLT FLAMES- Tarantula survey (Evans et al. 2011)) have been initiated with the primary goal to collect sufficiently accurate and complete datasets of physical parameters to be used for testing and verifying the assumptions made in the models. The outcome of these (but also other smaller) surveys gave rise to new challenging questions regarding various aspects of the physics included in the models, in particular mass loss, gravity darkening, critical velocities, instabilities, and rotational mixing (for a detailed review on this issue, see Maeder & Meynet (2015)).
Since mixing affects all of the outputs of the models, this issue has been most extensively debated. Observations have clearly revealed the existence of N-rich slow rotators and N-poor fast rotators (see e.g. Hunter et al. 2008, 2009; Morel et al. 2008; Rivero González et al. 2012a, b; Nieva & Przybilla 2014), which is a pattern that is not expected from the current evolutionary calculations for single stars. Nevertheless, theoreticians have argued that “since the N-enrichment resulting from internal mixing is a multivariate function of rotation, mass, age, binarity, metallicity, and magnetic fields” (Maeder et al. 2014), it is rather premature to question the concept of rotational mixing based on evidence accounting for the effect of rotation alone. Additionally, these theoreticians point out that an overall agreement between model predictions and observations can be achieved when all important parameters have been considered.
Another long-standing problem refers to the systematic overestimate of evolutionary masses compared to spectroscopically derived masses, known as the mass discrepancy (see Herrero et al. 1992). While continuous improvements in model atmospheres and model evolutionary calculations have reduced the size of the discrepancy (e.g. Repolust et al. 2004), however without eliminating it completely (Mokiem et al. 2007; Hohle et al. 2010; Markova & Puls 2015), there are studies which argue that, at least for O stars in the Milky Way (MW), the mass problem has been solved (e.g. Weidner & Vink 2010, Massey et al. 2013,).
The situation regarding the lack of consistency between observed and predicted properties of massive hot stars became even more complicated when Martins & Palacios (2014) and Keszthelyi et al. (2016) have demonstrated that as the evolutionary calculations rely on various prescriptions to describe the physical processes driving the evolution, and as these prescriptions vary from code to code, the outcome of a comparison between model predictions and observations can be significantly different when employing different model grids.
In this study we investigate the correspondence between evolutionary model predictions and observations for a sample of 53 O stars in the MW, trying to put constraints on various parameters or processes that might influence the outcome of the comparison. For 30 of these, own determinations of the photospheric and wind parameters were obtained using original spectral observations and applying the non-LTE line blanketed code FASTWIND (Sect. 3); for the rest, literature data have been used instead. The complete database is analysed in terms of important physical relations (Sect. 4) and confronted with model predictions from Ekström et al. (2012) and Brott et al. (2011) with particular emphasis on stellar mass, nitrogen enrichment and rotational rate (Sects. 5, 6, and 7, respectively). A general discussion of the main results is presented in Sect. 8 while Sect. 9 summarises the main conclusions.
2 Stellar sample and main observational properties
The original sample, underlying this study, is described and used in Markova et al. (2014) (from now on Paper II) except for Pup, which was discarded because of the low quality of the available spectrum. The sample comprises 30 O-type stars in the MW covering all luminosity classes (LC) and spectral types (ST) from O3 to O9.7. Twenty-three of these are members of cluster and associations and the rest are objects from the field. The spectroscopic observations were collected with the FEROS spectrograph (Kaufer et al. 1999) mounted on the ESO/MPG 2.2 m telescope at La Silla. Each spectrum covers a wavelength range from about 350 to about 920 nm and has a resolving power of =48 000.
| Object ID | ST | Membership | d | Sp. status | MV | |||
| (kpc) | (mag) | (mag) | (mag) | |||||
| HD 64568 | O3 V((f*))z | Pup OB1/NGC 2467 | 2.51 H78 | 3.10 | 9.40 | 0.074 | SB1? | 3.79 |
| HD 64568a | 5.52 KH00 | 3.10 | 5.50 | |||||
| HD 63005 | O6.5 IV((f)) | Pup OB1 | 2.51 H78 | 3.10 | 9.13 | -0.028 | S | 3.74 |
| HD 63005a | 5.69 KH00 | 3.10 | 5.45 | |||||
| HD 46223 | O4 V((f)) | Mon OB2/NGC 2244 | 1.51 H78 | 3.10 | 7.27 | 0.218 | S | 5.26 |
| HD 46202 | O9.2 V | Mon OB2/NGC 2244 | 1.51 H78 | 3.10 | 8.18 | 0.177 | S | 4.22 |
| HD 93843 | O5 III(fc) | Car OB1 | 2.6 H78 | 3.10 | 7.32 | -0.030 | SB1? | 5.63 |
| HD 93843a | 3.68 KS10 | 3.10 | 6.38 | |||||
| HD 91572 | O6.5 V((f))z | Car OB1 | 2.6 H78 | 3.10 | 8.22 | 0.036 | SB1 | 4.93 |
| HD 91572a | 2.77 KS10 | 3.10 | 5.06 | |||||
| HD 91824 | O7 V((f)z | Car OB1 | 2.6 H78 | 3.10 | 8.17 | -0.055 | SB1 | 4.93 |
| HD 91824a | 3.1 KS10 | 3.10 | 5.08 | |||||
| HD 94370 | O7(n)fp | Car OB1 G87 | 2.6 H78 | 3.10 | 7.94 | 0.077 | SB2? | 5.25 |
| HD 94370a | 2.6 KS10 | 3.10 | 5.25 | |||||
| HD 94370b | field, GOSV3 | 5.60 | ||||||
| HD 92504 | O8.5 V(n) | Car OB1: | 2.6 H78 | 3.10 | 8.42 | -0.053 | S | 4.45 |
| HD 94963 | O7 II(f) | Car OB2 G87 | 2.0 H78 | 3.10 | 7.16 | -0.087 | SB2? | 4.94 |
| HD 94963a | 2.6 KS10 | 3.10 | 5.53 | |||||
| HD 94963b | field, GOSV3 | 5.90 | ||||||
| HD 93204 | O5.5 V((fc)) | Tr 16 | 2.90 HSB12 | 4.40 HSB12 | 8.44 | 0.095 | S | 5.65 |
| HD 93204a | 3.50 P01 | 3.70 P01 | 5.78 | |||||
| CPD59 2600 | O6 V((f)) | Tr 16 | 2.90 HSB12 | 4.40 HSB12 | 8.83 | 0.210 | SB1 | 5.77 |
| CPD59 2600a | 2.20 P01 | 4.17 P01 | 5.05 | |||||
| CPD58 2620 | O7 Vz | Tr 14 | 2.90 HSB12 | 4.40 | 9.27 | 0.180 | S | 5.20 |
| CPD58 2620a | 2.20 P01 | 3.50 T03 | 4.16 | |||||
| HD 93222 | O7 V((f))z | Cr 228 | 2.60 F95 | 3.20 | 8.10 | 0.045 | S | 5.11 |
| CD47 4551 | O5 Ifc | Vela OB1: | 1.75 R00 | 3.70 R00 | 8.39 | 0.890 | WCB | 7.15 |
| HD 75211 | O8.5 II((f)) | Vela OB1 | 1.75 R00 | 3.70 R00 | 7.51 | 0.397 | SB1 | 6.12 |
| HD 76968 | O9.2 Ib | Vela OB1: R00 | 1.75 R00 | 3.70 R00 | 7.08 | 0.133 | SB1 | 5.66 |
| HD 76968a | field:, GOSV3 | 6.20 | ||||||
| CD 44 4865 | O9.7 III | Vela OB1 | 1.75 R00 | 3.70 R00 | 9.43 | 0.691 | S | 5.49 |
| HD 78344 | O9.7 Iab | Vela OB1: R00 | 1.75 R00 | 3.70 | 9.09 | 0.890 | S | 6.45 |
| HD 75222 | O9.7 Iab | Vela OB1 R00 | 1.75 R00 | 3.70 R00 | 7.42 | 0.380 | S | 6.23 |
| HD 75222a | field, GOSV3 | — | 6.50 | |||||
| HD 151804 | O8 Iaf | Sco OB1/NGC6231 | 1.91 H78 | 3.10 | 5.23 | 0.066 | WCB | 7.24 |
| HD 152249 | OC9 Iab | Sco OB1/NGC6231 | 1.91 H78 | 3.10 | 6.46 | 0.193 | S | 6.41 |
| HD 152003 | O9.7 Iab Nwk | Sco OB1/NGC6231 | 1.91 H78 | 3.10 | 7.03 | 0.374 | S | 6.40 |
| HD 169582 | O6 Iaf | field | S | 7.0 | ||||
| CD 43 4690 | O6.5 III | field | S | 5.6 | ||||
| HD 69464 | O7 Ib(f) | field | S | 6.3 | ||||
| HD 97848 | O8 V | field | S | 4.4 | ||||
| HD 302505 | O8.5 III | field | S | 5.6 | ||||
| HD 148546 | O9 Iab | field G87 | S | 6.5 | ||||
| HD 69106 | O9.7 IIn | field | S | 5.3 |
Notes: Spectral types are taken from Sota et al. (2014)) with complementary data from Markova et al. (2011) and Markova et al. (2014); and magnitudes are from the Galactic O-star Catalogue (Maíz-Apellániz et al. 2004)) with individual data from the Hipparchus Main Catalogue. Absolute magnitudes,MV , have been determined following the procedure outlined in Sect. 2.1. Boldface numbers in Column 9 are those used in the present study. S = single star; ? = suspected binarity; WCB = wind colliding binary. Reference. GOSV3 = Sota et al. (2008); H78 = Humphreys (1978); HSB12 = Hur et al. (2012); G87 = Gies (1987); KH00 = Kaltcheva & Hilditch (2000); KS10 = Kaltcheva & Scorcio (2010); P01 = Patriarchi et al. (2001); R00 = Reed (2000); T03 = Tapia et al. (2003).
The basic parameters of the sample are summarised in Table 1. We used the third version of the Galactic O-stars catalogue (GOSV3, Sota et al. 2008) as a primary source for cluster and association membership, but we consulted other sources (e.g. Humphreys 1978, Gies 1987, Reed 2000) as well. Since for four sample stars (HD 94370, HD 94963, HD 75222, and HD 76968) the memberships listed in GOSV3 and in earlier sources disagree, an additional entry (here but also in Table 2 and Table A1) is provided to account for both alternatives.
2.1 Absolute magnitudes, distances, and reddening
In order to compute stellar radii (required for masses, luminosities, and mass-loss rates), absolute magnitudes (MV ) are needed that still pose a problem for Galactic objects. For the members of clusters and associations, MV was computed using (i) photometry from the GOSV3 as a primary and the Hipparcos Main Catalogue (I/239) as a secondary source, (ii) mean intrinsic colours, , of (dwarfs and giants) and (supergiants) from Wegner (1994), and (iii) distances and reddening as described below.
In the absence of more accurate astrometric distances111At the time when this analysis was performed, GAIA measurements were still lacking while -based distances are considered as no longer reliable in the distance range considered here (e.g. de Zeeuw et al. 1999; Schröder et al. 2004)., photometric distances were consistently used in the present study. Particularly, for all but the members of Vela OB1 and the three young open clusters, Trumpler 14 (Tr 14), Trumpler 16 (Tr 16), and Cr 288, mean distance estimates from Humphreys (1978) combined with a standard value of total to selective extinction, =3.1, were initially considered to calculate MV . The obtained estimates turned out to agree well with the values expected from corresponding absolute magnitude calibrations (typically within 0.25 mag; see e.g. Walborn 1973 and Martins & Plez 2006), but few outliers with too low absolute values222In the following, we use absolute values of MV , such that larger numbers refer to a larger visual brightness. of MV did also appear: one in Car OB1 (HD 93843), another in Car OB2 (HD 94963), and two in Pup OB1 (HD 64568 and HD 63005). Since the reddening law in the direction towards these stellar aggregates is believed to be normal and a possible multiplicity cannot make a star appear underluminous compared to a single one of the same ST and LC, our results suggest that for these particular objects the adopted mean association distances might underestimate the actual distances. Luckily, for all but one (see below) of the considered stars located in the above clusters and associations, individual distance estimates are available in the literature (from Kaltcheva & Hilditch 2000 and Kaltcheva & Scorcio 2010). Since with these values the problem with the outliers could be successfully solved, while the outcome for the rest did not change significantly, these estimates have been consistently adopted for (almost) all stars that are members of Car OB1/OB2 and Pup OB1 (second entry in Table 1). We instead used the mean distance estimate, as provided by Humphreys (1978) for HD 92504 because of the lack of alternative data.
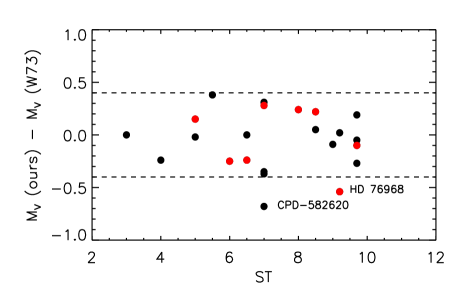
For Tr 14 and Tr 16, significantly different distance estimates (from about 2.0 to about 4.0 kpc) can be found in the literature, depending on the adopted reddening law, which is anomalous with 4–5 (see Smith & Brooks 2008 and references therein). To account for this problem, we proceeded twofold: first, for all stars which are members of these clusters, we adopted the same value of RV = 4.40.2 and = 2.90.3 kpc, as derived by Hur et al. (2012) using 141 early-type stars with high proper motion membership probability333These estimates are in reasonable agreement with similar results from Vazquez et al. 1996 and Tapia et al. 2003, but disagree with Carraro & Patat (2001) who derive = 3.480.33 and = 3.980.5 kpc for Tr 16, and = 4.160.21 and = 2.50.3 kpc for Tr 14. (first entry in Table 1). Second, we considered individual and estimates (from Patriarchi et al. 2001, second entry in Table 1) for each target. The former approach resulted in objects that are systematically brighter (by 0.25 to 0.47 mag) than expected from the callibrations by Walborn444We chose this calibration as a reference because unlike many others it separates between normal and bright giants as well as between supergiants of class Ia, Ib, and Iab., while the second approach did not lead to any systematic trend; we note that the SB1 system CPD59 2600 might be allowed to appear overluminous compared to a single star of the same ST, but the somewhat larger (absolute) MV for the other two targets is difficult to explain. Thus, we accepted the latter approach for our final solution for those stars that are members of Tr 14 and Tr 16. Indeed, the (absolute) MV derived for CPD58 2620 appears as too low now (see Fig. 1), but this might still be due to a very young nature, as suggested by its morphological OVz designation (Walborn 2009).
Regarding the young cluster Cr 228, all distance estimates, available in the literature, cluster around 2.6 kpc, and they were all derived assuming = 3.2 (see Feinstein 1995 and references therein). Thus, we used these values to calculate the MV for HD 93222.
Finally, for Vel OB1 we adopted = 1.75 kpc and = 3.7, as derived by Reed (2000) based on a variable extinction analysis of 70 stars. For all (save one) stars that are members of this association, the computed MV values agree well with the callibrations by Walborn (generally within 0.20 mag, see Fig.1). Regarding the outlier HD 76968, we suggest that its too low (absolute) MV might be explained as an indication that this star is an object from the field rather than a member of the Vel OB1 associations.
To get insight into the accuracy and reliability of our system of absolute magnitudes (boldfaced values in Column 9 of Table 1), we proceeded as follows:
1) For the cluster and association members, we compared our MV – determinations with those proposed by the calibrations from Walborn (1973) (upper panel of Fig. 1), and found that an agreement within 0.4 mag is obtained, except for the two outliers discussed above.
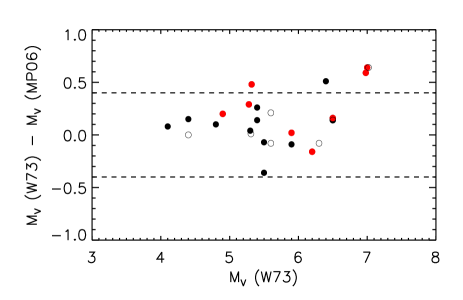
2) Since the use of different calibrations can lead to significantly different results (see e.g. Walborn et al. 2002, Martins et al. 2005a and references therein), we confronted the MV for the complete sample as resulting from the callibrations by Walborn to similar data inferred from the theoretical calibrations by Martins & Plez (2006). As demonstrated in the lower panel of Fig. 1, the two datasets agree within 0.4 mag and the agreement is even better for the field stars; we do not find clear evidence of a systematic trend.
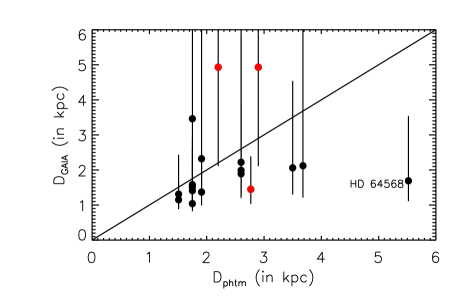
3) To account for first results from the GAIA mission (GAIA collaboration et al. 2016, Arenou et al. 2016), we compared photometric distances adopted in the present study with estimates calculated using GAIA parallaxes (Fig. 2). Given the (still) large error bars, which should become smaller within the next data releases, for all save two stars with measured parallaxes (17 in total), no clear evidence of a significant discrepancy is found, although a trend for the objects with 2pc to appear more distant than suggested by GAIA might be present. While this possibility needs to be confirmed by future analyses based on larger samples, we would like to point out that if the GAIA distance to HD 64568 were used to calculate MV , the resulting luminosity would be in stark conflict with the as derived by our model atmosphere analysis.
Taken together, we conclude that the accuracy of our system of MV for the cluster and association members is better than 0.4 mag and we do not find clear evidence of systematic uncertainties. Given corresponding results from the lower panel of Fig. 1, the same error has been consistently adopted for the field stars, whose MV were inferred from the Walborn calibrations (for the sake of consistency).
2.2 Binarity
As binarity can significantly influence the properties of massive stars (e.g. Langer 2012 and references therein), it is particularly important for studies like this to distinguish between single stars and members of close binary or multiple systems. While the objects in the sample have been initially selected as presumably single stars (see Paper I), a re-consideration of their status, using newest data from the Galactic O-star Spectroscopic Survey Catalogue (GOSSSC III/274, Sota et al. 2014), has revealed that five of these objects (HD 91572, HD 91824, HD 75211, HD 76968, and CPD59 2600) have meanwhile been recognised as SB1 systems, two (CD 47 4551 and HD 151804) are considered as SBs with colliding winds, and four are suspected to be either SB1 (HD 64568, HD 93843) or SB2 (HD 94963 and HD 94370). These results are taken into account in the following analysis.
3 Modelling
The model atmosphere analysis was performed by means of the latest version
(V10.1) of the code FASTWIND (see Puls et al. 2005 for the previous
versions and Rivero González et al. 2012a for the current one), following a
three-step procedure. First, we used model grids with solar background
abundances as derived by Asplund et al. (2005)555We are aware that
an improved solar composition has been published by Asplund et al. (2009),
but since the C, N, O, Ne, and Fe abundances derived in the two studies
agree within less than 0.05 dex, and since the main effects of different
solar composition on the opacities is expected to appear in the post
main-sequence evolution (Martins & Plez 2006), the outcome of our analysis is not
significantly influenced by the use of the older estimates. to roughly
constrain the parameters of the targets, namely effective temperature
( ), surface equatorial gravity ( ), helium, and nitrogen content (with
respect to particle number, = N(He)/N(H) and [N] = 12 + log N/H),
and wind-strength parameter = /( * )1.5 (see
Puls et al. 1996). The grids were calculated by Rivero González and
additionally extended towards cooler temperatures and lower surface
gravities by one of us (NM), such that they cover the complete parameter
space appropriate for O stars in the MW. Second, such estimates were
fine-tuned by calculating a grid of much higher resolution around the
initial constraints with tailored values of , , , [N], and
wind terminal velocity ( ) for each target, and different values of
the velocity field exponent . Third, for each target, we derived
the value of stellar radius ( ) and determined the final value of
mass-loss rate, .
The effective temperature was constrained from the helium and nitrogen
ionisation balance. For the cooler objects (ST later than O4), we
relied on the former using the latter as a consistency check; for the
hotter objects, we gave larger weight to the nitrogen balance as long as
a reasonable fit to the He lines could be maintained. The typical
uncertainty of our determinations (obtained from the best line fit,
estimated by eye) ranges from 1000 to 1500 K.
The surface gravity was obtained from the best fit to the wings of
Hγ and Hδ . The error on these estimates is 0.1 dex for
the objects with 120 km s-1 and 0.15 dex for those with
120 km s-1 . For CD47 4551 and HD 151804 only, we adopted
a somewhat larger uncertainty of 0.2 dex to account for the lower
quality fit to the P Cygni profiles of Hγ and Hδ .
The stellar radius was determined from the de-reddened absolute magnitudes
and the theoretical Eddington fluxes, following the procedure provided by
Kudritzki (1980). From and , the stellar luminosity was calculated.
The typical error, estimated following the philosophy outlined in
Markova et al. (2004) and Repolust et al. (2004), is 0.08 dex in
(corresponding to roughly 20% in ), and 0.17 dex in
at maximum. Since SBs did not show any peculiarity regarding
their MV (red data points in Fig. 1), the same errors were adopted
for these stars as well.
Wind terminal velocity. For approximately half of the sample, we used individual
estimates of as provided by Howarth et al. (1997) and Prinja et al. (1990); for
the other half, corresponding data from the calibrations by Kudritzki & Puls (2000)
were used instead (in Column 7 of Table 2, numbers flagged by asterisks).
For all targets, a typical uncertainty of 100 km s-1 was consistently
adopted.
Mass-loss rate and velocity field exponent . was constrained
from the best fit to Hα and He II 4686 as a primary, and N III 4634, 4640, 4642 and N IV 4058 emission lines (when present) as a secondary diagnostics666As
demonstrated by Rivero González et al.
(2011, 2012a), the N III and N IV emission lines can be used to
constrain the mass-loss rate, provided the nitrogen abundance is
derived independently from other lines..
For objects with strong winds, is determined from the best fit
to Hα in parallel to ; for those with weak winds (Hα in
absorption), =0.9 was initially adopted and (if necessary)
subsequently iterated along with to improve the fit to Hα . We
estimate an error of 0.1 in and of 0.13 dex (Hα in
emission) and less than 0.23 dex (Hα in absorption) in
.
Clumping. For all targets wind models were used to
constrain their wind properties. For a number of our objects, significantly
less He II 4686 absorption (i.e. more wind emission) than observed was
predicted from the best fit to Hα . At least for objects with 37,000 K, such discrepancy might be a direct indicator of a
structured wind (Kudritzki et al. 2006), and we flagged the corresponding entries
(Column 9, Table 2) with “a”. We note, however, that clumping
might be present in all objects, even if there is no direct evidence in
the optical spectra, and that all provided mass-loss rates might be upper
limits to be reduced by the square root of the unknown effective clumping
factor (presently estimated to lie in the range between 5 and 10; e.g.
Puls et al. 2008 and references therein).
Microturbulence. All models were calculated assuming a depth-
independent microturbulent velocity of 10 km s-1 for the atmosphere structure,
and of 15 (hotter) and 10 km s-1 (cooler objects) for the formal integral.
No attempts were made to improve the quality of fit varying this
parameter.
The helium abundance was determined by fine-tuning the fit to strategic
helium lines, namely He II at 4200, 4541, 6527, and 6683,
and He I at 4771, 4387, 4713, and 6678. The accuracy of
these estimates is 0.02, except for HD 151804 for which a somewhat
larger error of 0.05 was adopted owing to the lower quality of the fit.
The nitrogen abundance was constrained from the best fit to all
strategic N lines, giving larger weight to those that are not affected by
stellar winds, and are furthermore strong enough to allow reliable estimates
to be obtained
777The lines from the quarter system, N III
4510 -4514 - 4518; the N III triplet lines 4634 - 4640 - 4641,
and the N III transitions at 4003, 4195, and 4200; the latter
three are used in the final abundance analysis.
Although, for the majority of stars, an error of 0.1 dex in [N] was
estimated, a more conservative error of 0.2 dex is consistently adopted
to account for possible uncertainties caused by the fixed value of (see Rivero González et al. 2012a).
Projected rotational velocity and macroturbulence. The macroturbulent
velocity, , was determined by a direct comparison between observed and
synthetic profiles; the latter was broadened using a fixed value of , as derived in Paper II, and trial values of . We refrained from using
values as published in Paper II because these originate from the
analysis of only one metal line, while macroturbulence is known to vary from
one metal species to another.
Radial velocities ( ) were estimated from the measured positions of
helium and metal (when present) absorption lines in the spectrum.
| HD/CPD | MV | [ ,Vt] | [N] | ||||||||||
| (mag) | (kK) | (cgs) | ( ) | ( ) | (km/s) | (unclm) | (km/s) | (km/s) | ( ) | ||||
| HD 64568a | 5.50 | 48.01.5 | 4.000.10 | 11.5 | 5.80 | 3200∗ | 0.9 | -5.84 | [55,96] | 753 | 48.517.9 | 8.18 | 0.10 |
| HD 46223 | 5.26 | 43.51.5 | 3.950.10 | 10.9 | 5.58 | 2800 | 0.8 | -6.10 | [72,84] | 404 | 38.914.4 | 8.58 | 0.10 |
| HD 93204a | 5.78 | 40.51.0 | 3.910.10 | 14.4 | 5.70 | 2890 | 0.9 | -5.90 | [105,105] | 85 | 60.922.5 | 7.78 | 0.10 |
| CPD59 2600a | 5.05 | 40.01.0 | 4.010.10 | 10.4 | 5.40 | 3065 | 0.9 | -5.96 | [120,90] | 72 | 40.314.9 | 7.78 | 0.08 |
| HD 93843a | 6.38 | 39.01.5 | 3.660.10 | 19.7 | 5.91 | 2730 | 0.9 | -5.35 | [90,40] | 54 | 64.123.8 | 7.98 | 0.10 |
| HD 91572a | 5.06 | 38.51.0 | 3.900.10 | 10.6 | 5.35 | 2410 | 0.9 | -6.20 | [49,73] | 03 | 32.712.1 | 8.37 | 0.10 |
| HD 91824a | 5.08 | 39.01.0 | 3.900.10 | 10.6 | 5.37 | 2285 | 0.9 | -6.82 | [47,67] | 403 | 32.712.1 | 8.48 | 0.10 |
| HD 63005a | 5.45 | 38.51.0 | 3.750.10 | 12.9 | 5.52 | 2120 | 0.9 | -6.29 | [63,87] | 593 | 34.412.7 | 8.58 | 0.15 |
| CPD58 2620a | 4.16 | 38.51.0 | 3.950.10 | 7.0 | 4.99 | 2600. | 0.9 | -7.00 | [39,59] | 104 | 16.05.9 | 7.98 | 0.10 |
| HD 93222 | 5.11 | 38.01.0 | 3.900.10 | 11.0 | 5.36 | 2700 | 0.9 | -6.21 | [52,90] | 53 | 35.213.0 | 7.98 | 0.10 |
| CD47 4551 | 7.15 | 38.01.5 | 3.600.20 | 28.8 | 6.19 | 2100 | 0.9 | -4.95 | [50,110] | 122 | 120.944.9 | 8.08 | 0.12 |
| HD 94963a | 5.53 | 36.01.0 | 3.510.10 | 14.0 | 5.47 | 2300∗ | 1.0 | -5.82 | [82,82] | 63 | 23.18.6 | 8.38 | 0.10 |
| HD 94963b | 5.90 | 16.6 | 5.62 | -5.70 | 32.412.0 | ||||||||
| HD 94370a | 5.25 | 36.01.0 | 3.730.15 | 12.3 | 5.36 | 2600∗ | 0.9 | -5.80 | [185,84] | 02 | 29.911.1 | 7.78 | 0.10 |
| HD 94370b | 5.60 | 14.4 | 5.50 | -5.70 | 40.515.1 | ||||||||
| HD 92504 | 4.45 | 35.01.0 | 3.870.15 | 8.5 | 4.99 | 1900∗ | 0.9 | -7.13 | [155,82] | 202 | 19.77.3 | 7.78 | 0.10 |
| HD 75211 | 6.12 | 34.01.0 | 3.520.15 | 18.9 | 5.63 | 2100∗ | 0.9 | -6.14 | [145,58] | 203 | 43.316.1 | 8.58 | 0.13 |
| HD 46202 | 4.22 | 34.01.0 | 4.000.10 | 7.9 | 4.88 | 1200 | 0.8 | -7.19 | [15,34] | 353 | 22.88.4 | 7.88 | 0.10 |
| HD 152249 | 6.41 | 31.51.0 | 3.210.10 | 20.9 | 5.59 | 2010 | 1.0 | -5.56a | [65,93] | 54 | 25.79.5 | 7.88 | 0.10 |
| HD 151804 | 7.24 | 30.02.0 | 3.110.20 | 36.5 | 5.99 | 1445 | 1.6 | -4.75a | [67,75] | 203 | 62.123.9 | 8.98 | 0.30 |
| CD44 4865 | 5.49 | 30.01.0 | 3.460.10 | 15.3 | 5.26 | 1600∗ | 0.9 | -6.37 | [60.79] | 464 | 24.49.0 | 7.98 | 0.10 |
| HD 152003 | 6.40 | 30.51.0 | 3.160.10 | 24.1 | 5.66 | 1300 | 1.3 | -5.42a | [77,80] | 83 | 30.711.4 | 7.78 | 0.10 |
| HD 75222 | 6.23 | 30.01.0 | 3.160.10 | 22.1 | 5.56 | 1840 | 1.0 | -5.53a | [67,80] | 582 | 25.79.5 | 8.38 | 0.10 |
| HD 75222a | 6.50 | 25.0 | 5.67 | -5.44 | 32.812.2 | ||||||||
| HD 78344 | 6.45 | 30.01.0 | 3.160.10 | 25.2 | 5.60 | 1700∗ | 1.15 | -5.30a | [64,64] | 51 | 33.312.3 | 8.58 | 0.20 |
| HD 169582 | 7.00 | 37.01.0 | 3.500.10 | 27.2 | 6.10 | 2100 | 0.9 | -5.19 | [73,105] | 52 | 86.132.1 | 8.98 | 0.20 |
| CD 43 4690 | 5.60 | 37.01.0 | 3.610.10 | 14.1 | 5.53 | 2600∗ | 0.9 | -5.91 | [93,90] | 304 | 29.510.9 | 8.38 | 0.10 |
| HD 97848 | 4.40 | 36.51.0 | 3.900.10 | 8.2 | 5.03 | 2400∗ | 0.9 | -6.72 | [42,74] | 52 | 19.67.2 | 8.38 | 0.10 |
| HD 69464 | 6.30 | 36.01.0 | 3.510.10 | 20.0 | 5.78 | 2300 | 0.9 | -5.55 | [83,92] | 487 | 46.917.3 | 8.28 | 0.10 |
| HD 302505 | 5.60 | 34.01.0 | 3.600.10 | 14.9 | 5.43 | 2300∗ | 0.9 | -6.26 | [43,65] | 14 | 32.412.0 | 8.18 | 0.10 |
| HD 148546 | 6.50 | 31.01.0 | 3.220.10 | 24.4 | 5.70 | 1780 | 0.9 | -5.25a | [100,95] | 453 | 35.713.2 | 8.98 | 0.20 |
| HD 76968a | 6.20 | 31.01.0 | 3.250.10 | 21.3 | 5.58 | 1815 | 1.0 | -5.61a | [55,62] | 254 | 29.811.0 | 8.18 | 0.10 |
| HD 69106 | 5.30 | 30.01.0 | 3.550.15 | 14.2 | 5.09 | 1340 | 0.9 | -6.85 | [310,105] | 203 | 21.88.1 | 8.00 | 0.10 |
Notes: ”*” marks adopted from the calibrations by Kudritzki & Puls (2000); ”a” indicates a HeII 4686 mass-loss rate inconsistent with the wind emission implied by Hα , directly pointing to the presence of wind inhomogeneities (see text).
For the majority of stars, the spectral line shifts agree within the accuracy of individual estimates ( 5 km s-1 ), allowing a mean value of to be obtained and used as an input parameter for the fitting procedure. To our knowledge, for four of the targets our estimates are first and thus unique (boldfaced numbers in Column 11 of Table 2). For all but two stars a good correspondence (within 10 km s-1 ) between our determinations and those provided in the GCMRV (General Catalogue of Mean Radial velocities (III/213), Barbier-Brossat and Figon 2000) is established. Both of the only two outliers, HD 91 824 and HD 69 106, are known variables.
The main physical parameters, derived as described above, and their corresponding errors, are listed in Table 2.
4 Results of the model atmosphere analysis
4.1 General comments
As our sample is relatively large and to avoid lengthy discussions, we mostly refrain from describing the objects one by one and focus on specific peculiarities and problems.
-
i)
For the two hottest stars in the sample, HD 64568 and HD 46223, we were not able to obtain good quality fits to N V 4604, 4620 in parallel to the rest of lines in the spectrum: these lines appear stronger than predicted by the models and shifted to the red (by about 20 km s-1 ), compared to the measured mean radial velocity. Since similar results have been reported by Bouret et al. (2012) using the CMFGEN code, the problem should not be related to a specific issue within the FASTWIND modelling but most likely indicates a more general problem (see also Rivero González et al. 2012b). Consequently, a larger error of 1.5 kK in was adopted for these stars.
-
ii)
At 36 kK, the models predict more N III 4634-42 absorption (or less emission) than actually observed. Since in the presence of an accelerating velocity field and under Galactic conditions, the key process, determining the N III triplet emission, is the overpopulation of the upper level due to the coupled N III and O III resonance lines (Rivero-González et al. 2011), and since in the current version of FASTWIND this coupling is not accounted for, this shortcoming might explain our failure to reproduce the N III 4634-42 lines strength correctly.
-
iii)
For between 39 kK and 44 kK, N IV 4058 is predicted to appear in emission or neutral whereas observed in absorption. Since lower values of are precluded by the observed strength of Hα , and given similar results from Rivero González et al. (2012a), we suggest the issue might either imply a certain problem in the FASTWIND modelling regarding this particular transition or might indicate that clumping may play an important role.
-
iv)
In many cases, the needed to fit N lines is lower than the value required by the rest of lines in the spectrum. This might imply a depth dependent macroturbulence.
-
v)
For a number of stars, He II 4686 is either broader compared to the rest of the spectral lines (HD 91572 and HD 91824 ) or displays more wind emission in the blue part of the profile than predicted by the best fit to Hα (HD 46202, HD 93843, HD 94963, HD 75211, HD 69464, and HD 94370). Since all but two of these objects have been recognised or suspected as SB1/SB2 systems, binarity seems to be the most likely cause to explain these results.
In addition to these more general problems, there are also other problems that only refer to individual stars. These are summarised and discussed in the following.
| Object | ST | MV | [N] | Ref. | ||||||
|---|---|---|---|---|---|---|---|---|---|---|
| (mag) | (kK) | (cgs) | ( ) | ( ) | ||||||
| HD 46223 | O4 V((f)) | 5.260.4 | 43.51.5 | 3.950.1 | 0.100.02 | 8.580.2 | 5.580.17 | 10.92.0 | 38.914.4 | This work |
| 5.22 | 43.01.0 | 4.00.1 | 0.10 | 8.85 | 5.60 | —- | 48.319.3 | M12/M15 | ||
| HD 46202 | O9.2 V | 4.220.4 | 34.01.0 | 4.00.1 | 0.100.02 | 7.880.2 | 4.880.17 | 7.94.5 | 22.88.4 | This work |
| 4.19 | 33.51.0 | 4.10.1 | 0.10 | 8.00 | 4.850.12 | —- | 29.012.4 | M12/M15 | ||
| HD 93204 | O5.5 V((fc)) | 5.780.4 | 40.51.0 | 3.90.1 | 0.100.02 | 7.780.2 | 5.700.17 | 14.42.6 | 60.922.5 | This work |
| —– | 40.02.0 | 4.00.1 | 0.10 | —- | 5.51 | 11.9 | 52 | M05 | ||
| HD 94963 | O7 II(f) | 5.53 | 36.01.0 | 3.510.10 | 0.10 | 8.380.2 | 5.470.17 | 14.0 | 23.1/32.4 | This study |
| —– | 35.02.0 | 3.510.2 | 0.10 | 8.67 | —– | —– | —– | M17 | ||
| HD 151804 | O8 Iaf | 7.240.4 | 30.02.0 | 3.10.2 | 0.300.05 | 8.980.25 | 5.990.17 | 36.57.5 | 62.123.9 | This work |
| —– | 30.01.0 | 3.00.15 | — | —- | 5.68a | —– | —– | M15 | ||
| —– | 29.00.5 | 3.0 | 0.290.01 | —- | 5.90 | 35.4 | —– | CE09 | ||
| HD 152249 | OC9Iab | 6.410.4 | 31.51.0 | 3.210.1 | 0.100.02 | 7.880.2 | 5.590.17 | 20.94.3 | 25.79.5 | This work |
| —– | 31.01.0 | 3.250.15 | —- | 8.11 | 5.61a | —– | —– | M15 |
CPD 59 2600:
The only peculiarity revealed throughout our
analysis is that =0.08 is needed to reproduce the strategic He lines. As
this star is a SB1 system (Sota et al. 2014), one might argue that due to dilution
of the global spectrum by the secondary, the He lines might appear weaker than
normal (see e.g. Sabín-Sanjulián et al. 2014). Within this hypothesis, however, the
N lines should also appear weaker than expected for a single star of the same
ST and LC, a possibility that was not confirmed by our analysis that indicates
a nitrogen content equal to the baseline solar abundance for this star (see
Table 2). Unless the dilution effects (reduced strength of N lines) have
been, by chance, completely compensated by enriched N content due to binary evolution,
our results would imply that CPD59 2600 might be a helium-deficient star.
We note that another presumably helium deficient O star (HD 15570) has been
recently observed and analysed by Bouret et al. (2012).
CD 43 4690: Our analysis revealed that the He I lines are significantly
broader and indicate a by 2̃5 km s-1 larger than observed for the rest of
absorption lines in the optical spectrum. Both of these results might be easily
accounted for assuming that CD 43 4690 might be a SB.
HD 94370: This star has been classified as O6.5 III (Walborn 1973), O7.5 III(f)
(Mathys 1988), 7.5 IInn (Paper II), and O7(n)fp (Sota et al. 2014). While = 36 kK,
as derived by us, agrees well with the value expected for a single giant of
O7 subtype, = 3.73 dex is more appropriate for a subgiant rather than a giant
(see Fig 4). Additionally, Hα displays an emission component that is
not consistent with the strength of the absorption trough, and He II 4686 also appears
peculiar (see item v) above). All this supports a binary nature of HD 94370, as
suggested by Sota et al. (2014) based on measurements.
HD 169582: A FASTWIND model with = 37 kK, = 3.5, = 0.2, and
[N] = 8.98 provides acceptable fits to all strategic lines, except for the N V doublet,
which appears too strong in absorption. Additionally, the position of various absorption
lines are not consistent: some of these indicate = 10 km s-1 , others indicate of about zero or even 9 km s-1 . These results strongly suggest that HD 169582 might
be a SB, but no evidence for the presence of a companion has been reported so far in
the literature.
CP47 4551 and HD 151804: Despite our efforts we were able to obtain a good
fit quality to all strategic lines with one set of parameters for either of these
stars. Given that both stars are likely SBs with colliding winds (see e.g. Sota et al. 2014
and references therein) and that the former also possesses a magnetic field
(Hubrig et al. 2011), this result is easy to understand. Consequently, larger error bars
on the derived parameters were adopted for these stars, to account for their specific
nature.
From what has been outlined, it should be clear that the model atmosphere analysis of
the sample did not pose serious problems. The noted difficulties refer either to (a)
specific line transition(s) in a specific temperature regime, or invoke particular
objects, generally SB1/SB2. In all these cases, the impact on the derived parameters
can be easily accounted for in the error bars or even neglected.
4.2 Comparison to previous results
In this subsection we compare results from the quantitative analysis performed in this work with similar results obtained by other investigators for individual stars in common (Sect. 4.2.1) and for other Galactic O stars with similar but not identical properties (Sects. 4.2.2, 4.2.3, and 4.2.4). In the latter case, the comparison is indirect through several functional relationships, and involves additional, (presumably) single objects analysed in terms of main photospheric and wind parameters, (e.g. , , , , , , He and N content, and accounting for macroturbulence) using methodologies similar to ours. Since all these data were derived by means of the code CMFGEN (Hillier & Miller 1998) in combination with UV and optical spectroscopy, these data should be (to a large extent) internally consistent.
4.2.1 Comparison of individual objects
Table 3 lists fundamental stellar and wind parameters derived in the present and previous studies for five stars in common. Obviously, almost perfect agreement between our determinations and those from the cited works is established.
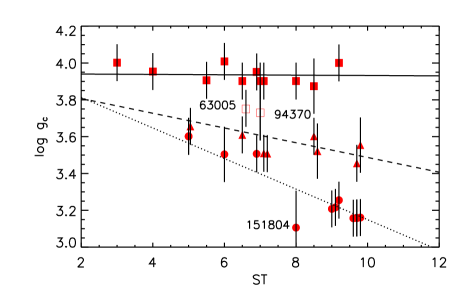

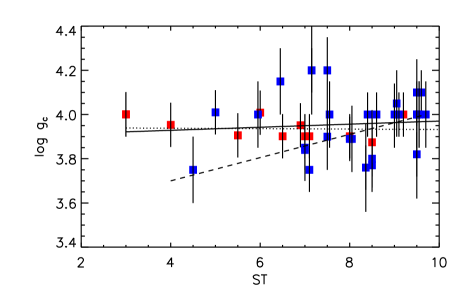
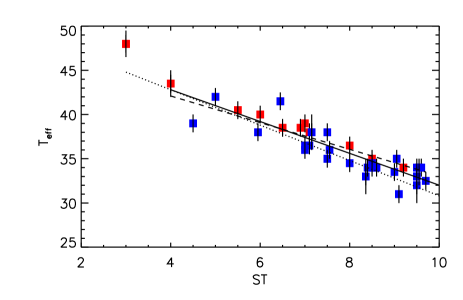
4.2.2 Temperature and gravity scales
Fig. 3 shows the and distributions of the stars listed in Table 2 as a function of ST. The calibrations from Martins et al. (2005a), based on quantitative spectroscopy of O stars in the MW, are overplotted. From the upper panel, one can see that within each of the three luminosity subgroups, the agreement between our determinations and the values proposed by the calibrations is reasonably good (within the error bars), and there are only three real outliers: HD 63005, which is actually not a dwarf but a subgiant; HD 151804, which is likely a SB2 with a very strong wind (the strongest one in the sample); and HD 94370, which is listed in the GOSV3 catalogue without any luminosity class designation, but according to earlier sources has been classified as an LC III/IV object (Walborn 1973; Mathys 1988).
From the lower panel of Fig. 3, on the other hand, we find that our values for the giants and supergiants are consistent with the values proposed by the corresponding calibrations, and that HD 151804 is the only real outlier (see above), whereas a small offset towards higher temperatures may be present for the sample dwarfs of intermediate and late ST.
While our finding about systematically higher for O7–O9.7 dwarfs is consistent with similar findings from Simón-Díaz et al (2014), we have not been able to confirm the trend of decreasing towards earlier subtypes, as demonstrated by their Fig. 1. Since our dwarf subsample is relatively small, and in particular smaller than that studied by these authors (11 against 33 in the latter case), we complemented our subsample with and estimates for 27 (presumably single) O-type dwarfs analysed by Martins et al. (2012a, b), Martins et al. (2015a,b), and Marcolino et al. (2009) to improve the statistics. We note that we did not employ any data from Repolust et al. (2004) and Martins et al. (2005b), since these were used by Martins et al. (2005a) to construct our comparison calibrations.
The distribution of the extended dwarf sample in the ST– and the ST– planes is illustrated in Fig. 4. Despite the sizable scatter at a given ST, the displayed data confirm our findings from Fig. 3. Firstly, surface equatorial gravities for Galactic O-type dwarfs appear to be generally consistent with the callibration by Martins without any systematic trend. Secondly, current effective temperatures for O7– O9.7 dwarfs may be higher than those proposed by the calibration by about 1 to 2 kK. To get additional insight into the former result, we investigated the – log distribution of the O-type dwarfs studied by Martins et al. (2015b) (see their Fig. 3), and found that also these data do not provide any clear evidence for a systematically lower towards hotter . Consequently, we suggest that misclassification and/or underestimated values might both contribute to explain why the pattern obtained by Simón-Díaz et al (2014) is so different from that revealed by the data shown in the upper panel of Fig. 4.
Another point is that Massey et al. (2013) warned about a specific discordance between FASTWIND and CMFGEN determinations, finding that the former are systematically lower than the latter by about 0.12 dex. While this finding is not confirmed by our analysis (see upper panel of Fig. 4), a theoretical explanation in terms of differences in the quasi-hydrostatic treatment in various model atmosphere codes has been recently proposed by Sander et al. (2015).
Finally, Rivero González et al. (2012b) and Sabín-Sanjulián et al. (2014) recently reported about a possible non-uniform ST– relation for LMC O-type dwarfs and found that the slope is steeper for the hotter (ST¡O4) than for the cooler stars (ST¿O4). Since the temperature derived for our only dwarf of O3 subtype is significantly higher than proposed by the linear fit to the rest of the extended dwarf sample, this result might imply that a similar non-uniform ST– relation could also apply for O-dwarfs in the MW.
4.2.3 Mass loss and wind clumping
Fig. 5 shows the mass-loss rate, as derived in the present study employing unclumped wind models, as a function of . Similar data are overplotted in blue for 23 O-type stars obtained by means of the CMFGEN code using Hα (Martins et al, 2012a,b; 2015a) or UV resonance + Hα lines (Bouret et al. 2012) as wind diagnostics888For the CMFGEN targets with clumped winds, the corresponding unclumped were calculated using the maximum clumping factor in the outer wind, as derived in the corresponding studies.. From these data it is evident that for all but the outliers marked with their IDs (see below), the spectroscopically derived (unclumped) mass-loss rate increases with increasing luminosity, where the FASTWIND and the CMFGEN targets participate in a similar way. While this trend is qualitatively consistent with theoretical expectations, a comparison to the predictions by Vink et al. (2000) – computed using the best-fit parameters derived for each target (own and adopted) – reveals a serve discordance (by up to a factor of 3) for all but two of the more luminous supergiants, and a reasonable agreement (within the error bars) for the rest of the sample stars. Closer inspection furthermore shows that all supergiants with (unclumped) significantly larger than the predictions by Vink display evidence of structured winds, in terms of the aforementioned discordance of HeII 4686 and Hα (FASTWIND targets, flagged in Column 9 of Table 2 with “a”), or in terms of direct fitting of UV and optical spectral lines with clumped wind models (CMFGEN targets).
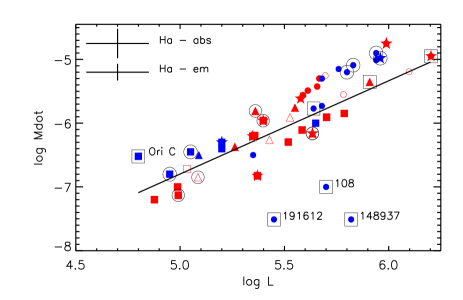
This situation closely resembles the results presented by Repolust et al. (2004). Already then, it was argued that the discrepancy should be due to the neglect of clumping in the mass-loss diagnostics, and in this situation this also seems to be the most likely explanation. Discrepancies in by a factor of three correspond to clumping-factors of the order of ten, which is a typical number derived from various clumping diagnostics (as summarised e.g. by Puls et al. 2008, Puls et al. 2015 and Martínez-Núnez et al. 2017). Whether there is an additional discrepancy between our data and the simulations by Vink et al. cannot be decided though, since this would require a detailed, multiwavelength mass-loss analysis accounting for micro- and macro-clumping.
Overall, however, we note that most objects follow the predicted trend, and there are only few real outliers, denoted by their ID in Fig. 5. All of these outliers are slowly rotating magnetic stars, which among other peculiarities have demonstrated rotationally modulated stellar and wind properties (Martins et al. 2012a). As even weak magnetic fields have the potential to channel the wind material towards the magnetic equator (ud-Doula & Owocki 2002), the hypothesis of an oblique magnetic rotator has been suggested as a possible explanation for their peculiar behaviour. For HD 191612 this possibility was confirmed by 2D (Sundqvist et al. 2012)) and 3D (Nazé et al. 2016) magneto-hydrodynamical simulations within the so-called dynamical magnetosphere model. A similar explanation may also apply to Ori C and HD 148937, as suggested by Sundqvist et al. (2012). Since the density structure of such a dynamical magnetosphere is very different from a spherically symmetric wind, realistic mass-loss determinations have to account for corresponding models and a multi-D radiative transfer in both the optical and UV. Studies accounting for these requirements are in progress, and we will have to check how the mass-loss rates discussed here translate to the actual quantities.
Conversely, given the results shown in Fig. 5, one might speculate that the spectra analysed by Martins et al. (2012a) were taken when the wind-confined disc-like structure was viewed either face-on (i.e. maximum wind emission – Ori C) or edge-on (minimum wind emission – HD 108, HD 148937 and HD 191612). At least for HD 108 and HD 191612 this turned out to be the case (see Martins et al. 2012a.)
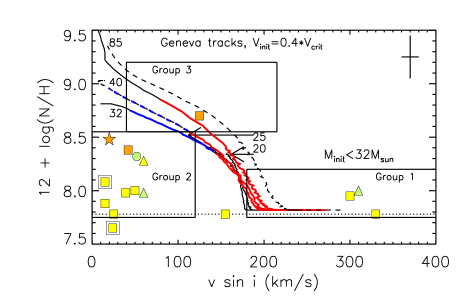
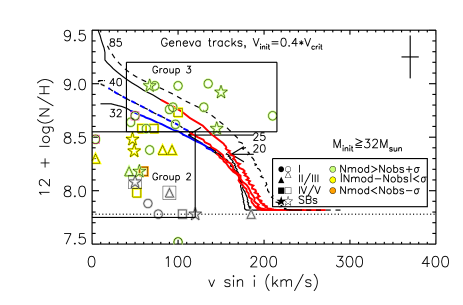
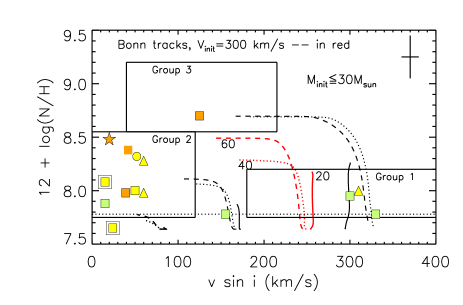
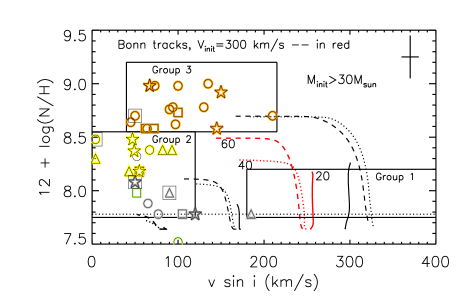
4.2.4 Nitrogen abundances
Fig. 6 shows the run of N abundance for the sample stars (own and adopted) as a function of . Despite the sizable scatter at a given , a well-defined trend of more enrichment in more luminous (and thus more massive) stars can be observed within each of the three LC subgroups. This finding is qualitatively consistent with evolutionary calculations for a coeval stellar population, which predict that because of rotational mixing and mass loss, more massive stars should be more chemically enriched than their less massive counterparts.
On the other hand, given that fast rotators and SBs do not demonstrate any specific pattern, one might argue that this contrasts with theoretical expectations about the role of rotation and binarity regarding the surface chemical enrichment of massive stars. Such interpretation, however, would be rather premature, since other physical agents different from stellar mass, binarity, and rotation — such as age or binarity history (see e.g. Maeder et al. 2009, de Mink et al. 2009) — can also contribute.
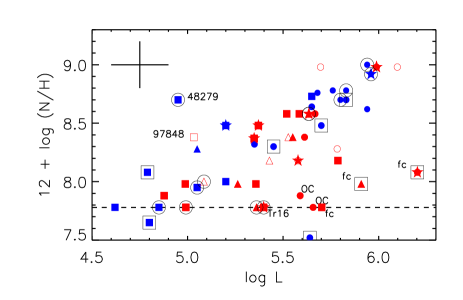
Apart from the stars determining the main trends in Fig. 6, there are also those which deviate by more than 1. In the dwarf subsample (objects denoted by squares), the most outstanding outliers are HD 97848 and HD 48279, which show extreme N enrichment, and CPD59 2600 ( =5.40 dex, SB1) and HD 93204 ( =5.71), which are basically unenriched. Several reasons may play a role in determining the N pattern of these objects. Particularly, for the field star HD 97848 an underestimated luminosity, due to uncertain distance, might be responsible or contribute to explain its relatively large N enrichment. For CPD59 2600 and HD 93204, the apparent youth of their host cluster Tr 16 might play a role; this possibility seems to be additionally supported by the subsolar He abundance derived for CPD59 2600 (see Sect.4.1). Regarding HD 48279, a former binarity with mass transfer and/or tidal interactions between the two components is a possibility (Martins et al. 2012b).
Concerning the most outstanding outliers among the more evolved
objects (giants and supergiants denoted by triangles and filled
dots, respectively), there are two important features to be noted.
First, these objects all indicate a N enrichment significantly
lower than that derived for other stars of the same LC and nearly
same and , and, second, all of these outliers have been
recognised as morphologically peculiar objects with very weak nitrogen
lines. These outliers are the following:
a) HD 152249 ( =5.59) is a member of the OC category, defined
by C III 4650 absorption much stronger than that of N III 4634-40-42.
b) HD 152003 ( =5.66) and Ori A ( =5.64) are denoted
as Nwk objects, meaning its N lines are too weak.
c) HD 93843 and CD47 4551 ( =5.94/6.19) are Ofc stars
characterised by C III 4647-50-52 emission of similar strength as
that of N III 4634-40-42 (see Walborn et al. 2010).
d) HD 94370 is an Onfp star demonstrating a reverse P Cygni profile
in He II 4686 and a variable C III 4647-50-52 emission equal or larger
than the N III 4634-40-42 emission.
Interestingly, also the dwarf star HD 93204, for which a peculiarly
low N enrichment has been derived (see above), is a member of the
Ofc category. While the physical nature of the Ofc, OC, and
Onfp stars is still unclear (see e.g. Walborn et al., 2010b, 2011),
our results clearly indicate that they follow their own, specific
N enrichment pattern that runs in parallel to the main trend, but
at significantly lower values. Since three of the six more massive
and evolved outliers are found to possess weak magnetic fields (see
Hubrig et al. 2011 and Meynet et al. 2011), one might speculate whether
this specific property is responsible for or, at least contributes
to, their peculiarly low N abundance.
From the results outlined in this section, it should have become clear that the physical relations determined from the FASTWIND targets are fully consistent with those displayed by the CMFGEN targets. Thus far, it seems justified that we complement our original sample of 30 O stars in the MW with 23 such stars selected from the studies by Martins et al. (2012a, b), Martins et al. (2015a), and Bouret et al. (2012), to improve the statistics and completeness of the database. Accordingly, the total number of stars underlying the following analysis rises to 53 and comprises 20 supergiants, 8 normal/bright giants, 22 dwarfs, and 3 objects without LC designation. We did not incorporate all external dwarfs as used in Sect. 4.2.2 because some of these objects have not been analysed in terms of wind properties (Martins et al. 2015b) or chemical enrichment, in particularly N abundances (Marcolino et al. 2009).
5 Evolutionary masses
5.1 Potential uncertainties
Evolutionary masses ( ) can be estimated by comparing the
derived location of a given star in the Hertzsprung-Russell
diagram (classical or spectroscopic, see below), or the Kiel
diagram999Like the spectroscopic HRD, this diagram depends
only on the distance-independent quantities and .
(KD), with evolutionary tracks calculated from a set of
pre-selected values of initial masses ( ) and initial rotation
velocities ( ). The accuracy of these estimates depends
(i) on the uncertainties in , , and derived
from quantitative spectroscopy, (ii) on the interpolation
procedure between different tracks, and (iii) on the tracks
themselves (see e.g. Martins & Palacios 2014).
Observational uncertainties. For Galactic objects, the
main source of errors on are uncertain distances. While
for most sample stars that are members of cluster and associations,
the adopted photometric distances agree well (within the error
bars) with the estimates inferred from current GAIA parallaxes,
for some of them a tendency to appear more distant than determined
from the GAIA measurements seems to emerge (see Fig. 2).
To put additional constraints on this issue, we proceed twofold.
Firstly, we distinguish clearly between obtained for cluster and
association members and for the field stars with filled and open
symbols, respectively. Second, in parallel to the classical Hertzsprung
Russell Diagram (HRD), we also consider the so-called spectroscopic
HRD (sHRD), which does not require knowledge of stellar distances
(see Paper II and Langer & Kudritzki 2014).

Another source of observational uncertainties refers to various
physical assumptions and approximations as implemented in model
atmosphere calculations (see e.g. Sect. 4.2.2). By using
CMFGEN and FASTWIND data in parallel, we hope to reveal and constrain
such effects (if present).
Differences caused by input physics in evolutionary calculations.
To address this issue, two sets of widely used evolutionary tracks for
solar metallicity have been considered: one from Ekström et al. (2012) and
the other from Brott et al. (2011). (We refer to these as the current
Geneva and Bonn tracks/models, respectively). Since the former were computed
for = 0.4 (corresponding to velocities from 270 to 370 km s-1 for the mass range between 14 and 85 ), while the latter cover a wide
range between zero to 600 km s-1 , we employed (when not stated otherwise)
the Bonn tracks with 300 km s-1 in the present analysis for
the sake of consistency.
Uncertainties caused by the approach used to interpolate between
the available tracks. To determine the evolutionary masses of the
sample stars (own and adopted), we used a self-developed IDL-routine
that interpolates between available tracks and isochrones in the
corresponding diagram. For the Bonn tracks with 300 km s-1 ,
the reliability of our estimates was checked by comparing to similar data
derived by means of the BONNSAI tool (Schneider et al. 2014)101010The
BONNSAI masses were inferred using , , , and as
observables, and adopting a Salpeter (1955) initial mass function, a
Gaussian distribution of with =300 km s-1 and =0.1
km s-1 (to be as close as possible to the grid considered by us), a random
orientation of rotational axes, and a flat age distribution as independent
priors.. Since the two datasets are found to agree within 3 to 4 ,
which is generally lower than the typical error of our determinations
accumulated from uncertainties in the observationally derived and
, we conclude that the contribution of our IDL routine to the total
error budget is rather low, and can be neglected therefore.
5.2 Evolutionary masses from classical and spectroscopic HR diagrams
Since initial mass, , fixes the track to which empirical stellar properties have to be compared and because of the predicted dependence of these properties on stellar mass, it is especially important to know to which degree the choice of a particular model grid and diagram might influence the outcome of a comparison between model predictions and observations. In this and the next sections, we elaborate on this issue in more detail.
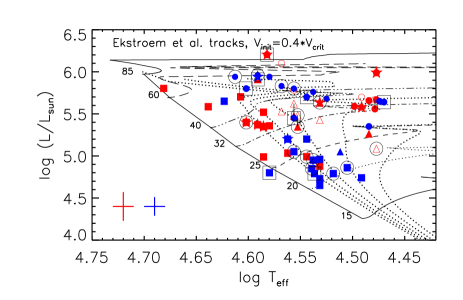
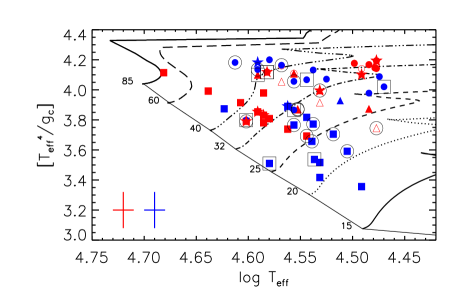
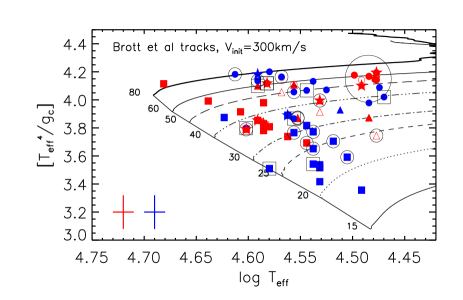
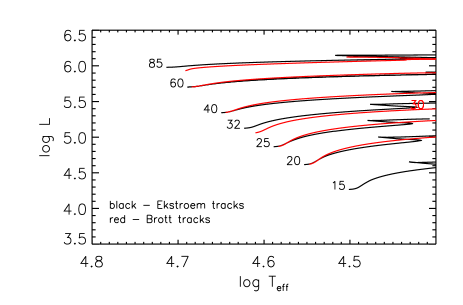
Fig. 7 display the classical and spectroscopic HR diagrams for the sample built using the current Geneva and Bonn tracks with rotation. From these plots, one can see that the sample covers an area between 4.46 and 4.69 dex in log , and between 4.6 and 6.2 dex in with a deficit of very luminous stars with hottest and coolest temperatures. The corresponding limits in units of are 3.35 and 4.2 dex, corresponding roughly to an electron scattering Eddington factor () of 0.1 and 0.4, respectively. Additionally, we also see that the sample comprises very young objects, located on (and even before) the zero age main sequense (ZAMS), as well as more evolved ones of 5 Myr age. While the majority of stars are in the main-sequence (MS) phase, there are also others that appear either as core hydrogen burning objects close to the end on the MS (in the Bonn grids) or as post-MS objects (in the current Geneva grids). This result reflects differences in the position of the terminal age MS between the selected grids (for more information, see Castro et al. 2014). Another interesting feature to note is that according to the Geneva isochrones, our sample dwarfs appear systematically younger (by 1 Myr) than proposed by the Bonn isochrons.
We derived two mass estimates, (HRD) and (sHRD), for each target (own or adopted) based on the diagrams shown in Fig. 7 and applying our interpolation routine. The typical uncertainties on these estimates, determined by inserting the limits of , , and , ranges from 13 to 25% for the low and the high mass end, respectively. For the FASTWIND targets, the obtained masses are listed in Table A.1, together with their corresponding error. Regarding these data, three important features are noteworthy. First, as a consequence of their loci at the limits of the area covered by the tracks, for several stars it was not possible to derive error bars. A maximum error of 25% was consistently adopted for these objects (numbers denoted in italics). Second, for the two most luminous stars in the sample (HD 169582 and CD47 4551), which are located above the 80 Bonn track, the derived (HRD) are upper limits. Third, within each of the two grids, the mass estimates derived for the stars with two luminosity solutions (HD 94963, HD 94370, and HD 75222) are practically identical (within the error). Thus, a mean instead of two individual estimates for (HRD) is considered to simplify the following analyses.
Careful inspection of Fig. 7 reveals that within a given model grid, the distribution of the stars in the HRD and the sHRD is not identical; some data points are moving upwards or downwards compared to the rest of sample. There are two most notable examples. First, the more massive supergiants from the CMFGEN subsample, which on the classical HRD are distributed between the 40 and the 60 Geneva tracks, while on the corresponding sHRD they appear as objects with between 32 and 40 . Second, the group of the coolest supergiants from the FASTWIND and the CMFGEN subsamples (highlighted by a large circle in Figs. 7 to 14), which in comparison to the Bonn tracks appear more massive on the sHRD than on the HRD by about 10 (and more) solar masses. These results imply that, apart from the used model grid, stellar masses might also depend on the kind of diagram used.
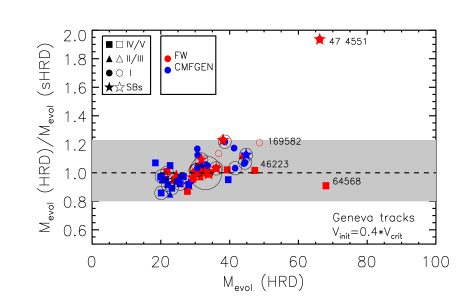
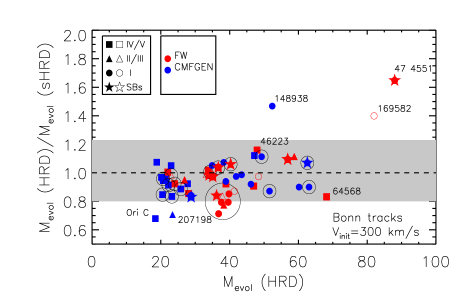
To get insight into this important issue, we investigated the ratio of (HRD) to (sHRD) for the sample stars, using each of the two model grids. From the upper panel of Fig. 8, one can see that in spite of the generally good agreement between the two mass estimates inferred from the current Geneva tracks with =0.4 (within uncertainty at the individual (HRD)/ (sHRD) ratio), a systematic component is present. Over the mass range probed by the sample, the mass ratio increases gradually from values lower than unity (for (HRD)30 ) via such around unity (30 (HRD)35 ) to values higher than unity (for (HRD)35 ), where in the latter case only the giants and supergiants seem to be involved.
Analogous results, based on the Bonn tracks with 300 km s-1 , indicate good agreement without any systematic trend for the majority of stars with (HRD)35 and a disagreement for those with (HRD)30 and the aforementioned group of the coolest supergiants from the FASTWIND and CMFGEN subsamples (data points enclosed by a large circle); in the latter two cases the objects tend to appear less massive in the HRD compared to the sHRD typically by about 10% and 20%, respectively. Regarding the most outstanding outliers indicated by their ID in Fig 8, some of these are from the CMFGEN sample (the magnetic star Ori C, HD 207198, and HD 148937); others are from the FASTWIND sample (HD 169582 and CD47 4551).
Since systematic, distance-, and temperature-dependent errors in our results for appear unlikely (see Sect. 6.2), an evolution different from that of normal single stars and/or inadequate physical ingredients implemented in evolutionary model calculations appear to be the only alternatives to explain the above results.
In a recent study, Langer & Kudritzki (2014) pointed out that close binary evolution or homogeneous evolution caused by rapid rotation can make an object appear overluminous in the sHRD compared to the HRD. Close inspection of the data shown in Fig. 8 accounting for the and the spectroscopic status of the objects however indicates that none of the fast rotators or the stars recognised or suspected to be SB systems show (sHRD) significantly larger than (HRD). This result suggests that close binary or homogeneous evolution are not likely to play a decisive role in determining the discordance between (HRD) and (sHRD) for any target in the sample. On the other hand, it may well be that the peculiarly high (HRD) compared to (sHRD) (i.e. the reverse situation) derived for CD474551 and HD 148937 might be due to present or former binarity, respectively (see Appendix B).
Overall, the main implication of the above results is that the employment of any of the two considered grids to study the properties of our sample might lead to inconsistent (even discrepant) results, depending on the used diagram, i.e. classical versus spectroscopic HRD (or the KD). This result is consistent with similar findings from Sabín-Sanjulián et al. (2017) who report about ”a non-negligible number” of O stars in the LMC that appear more massive (by more than 20%) in the KD compared to the classical HRD.
5.3 Evolutionary masses inferred from Geneva and Bonn tracks in parallel
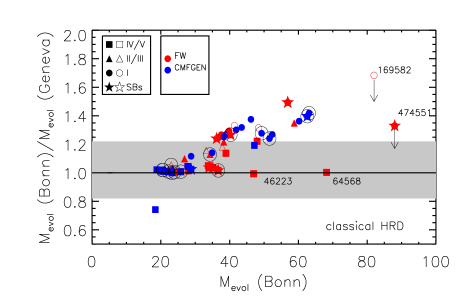
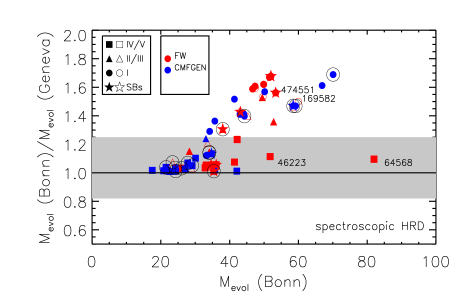
Recently, Martins et al. (2015a) noted that owing to differences in luminosity of the 40 Geneva and Bonn tracks, the corresponding mass estimates might differ by up to 25% beyond the MS. A direct comparison between evolutionary masses derived for the sample stars using the same type of HR diagram but different model grids, however, reveals that similar and even larger differences can appear during the MS phase as well. Particularly, our results (see Fig. 9) indicate that for masses above 30 , the use of the current Geneva tracks with =0.4 results in stellar masses that are systematically lower than those inferred from the Bonn tracks for 300 km s-1 . The discrepancy is more pronounced towards higher masses and later evolutionary stages (dwarfs are practically unaffected), and is also stronger for (sHRD) compared to (HRD): for the highest mass probed by the sample (excluding the objects denoted by their ID), the deviation reaches about 50% and 70% for the HRD and sHRD, respectively.
Several physical ingredients and processes may contribute to explain the discrepant evolutionary masses given by the two model grids. (For a detailed comparison between the input physics and its implementation in the Ekström et al. and the Brott et al. model grids, see the work by Martins & Palacios 2014.)
5.3.1 Rotation.
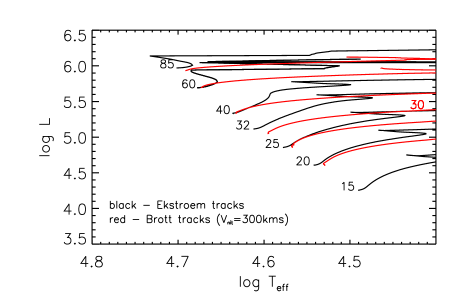
Some insight into the results outlined above can be obtained by comparing the rotating and the non-rotating Geneva and Bonn tracks within the classical HRD, as shown in Fig. 10. From these data, one can see that while the non-rotating tracks from the two grids are practically indistinguishable, large discrepancies appear when the rotating tracks are considered. The differences in are small (smaller than 0.1 dex) for 30 , and large for beyond this value, where soon after the ZAMS the Geneva tracks appear systematically more luminous than the Bonn tracks. The disagreement increases towards higher masses and cooler temperatures, reaching 0.25 dex for = 60 . Since for a given star, the use of more luminous tracks would result in a lower current mass estimate than proposed by the less luminous tracks, and since the luminosity pattern demonstrated by the rotating Geneva and Bonn sequences is qualitatively consistent with the picture shown in the upper panel of Fig 9, we conclude that rotation plays a decisive role in inducing the discordant masses given by the two model grids.
Because the current Geneva and the Bonn models for 300 km s-1 rotate at similar velocities on the ZAMS (see Sect. 5.1) for the same , differences in the implementation of rotation and related issues seem to be most likely responsible for the established mass disagreement.
One such difference refers to the treatment of the effect of mean molecular weight barriers: in the Bonn models, these have been fully taken into account, whereas in the Geneva models horizontal turbulence is thought to limit their effects. A direct consequence of these alternative approaches is that at the same and almost same , the former models show very little mixing of helium into the radiative envelope during the MS phase, whereas substantial mixing of helium occurs in the latter, especially in the high mass regime. Since luminosity strongly increases with the average mean molecular weight, ,111111An analytic expression of the form LM (where and are positive exponents, decreasing with stellar mass) was found to apply for massive stars in the MS phase by Kippenhahn & Weigert (1990). (i.e. with increasing average helium mass fraction) as a consequence of the mass-luminosity relation, this can explain why the Geneva models appear more luminous in the high mass regime; thus leading to significantly lower current masses.
A further difference refers to the internal angular momentum transport. The Bonn models treat the angular momentum transport as for a diffusive process, and they also account for internal magnetic fields, which is an approach that is more efficient than purely hydrodynamic transport mechanisms. The Geneva models, on the other hand, include angular momentum advection from the meridional circulations, which may transport angular momentum from the envelope inwards. Direct consequences of this implementation are that angular velocity differences are small in the Bonn models and larger in the Geneva models, and that soon after the ZAMS the former rotate faster (at the surface) than the latter (see Sect. 6.2.3). Since faster rotation is associated with more luminous tracks, one might expect that such differences in the internal angular momentum transport might contribute to the detected mass discordance as well.
While such expectation is legitimate, our results suggest that the process is most likely dominated by the different treatment of the barrier, rather than by differences in the treatment of the internal angular momentum transport.
5.3.2 Mass loss.
In recent studies, Markova & Puls (2015) and Keszthelyi et al. (2016) have pointed out that the mass-loss rates resulting from the current Geneva models with =0.4 and the Bonn models with 300 km s-1 can differ significantly, although both grids use the same mass-loss prescriptions from Vink et al. (2000). Within our work, we found that for from 25 to 60 and soon after the ZAMS, the rotating Geneva models experience a mass-loss rate by about 0.01 to 0.5 dex larger than displayed by the Bonn models at the same and . Such higher mass loss (because of higher in the rotating Geneva models, see above) is the main (or one of the major) contributors to the mass discordance between the two grids compared here. Since mass-loss effects accumulate with time and are larger for more massive stars, the mass discordance should be largest for evolved massive objects, which is nicely confirmed in Fig. 9.
Mass loss also depends on metallicity (Vink et al. 2001), and it might be speculated that the Geneva models (with a metal mass fraction, = 0.014) lose more mass than the Bonn models ( = 0.0088). This, however, is not true, since mass loss in the latter models has been calibrated to the (solar) iron abundance (see also Keszthelyi et al. 2016).
5.3.3 Convection, semi-convection, and overshooting.
Generally, the extension of the convective regions can be determined using either the Schwarzschild (Geneva models) or Ledoux (Bonn models) criterion for convection. The major consequence of these two approaches is that in the former case a more extended convective region would be obtained, and the different region is semi-convective in the latter case121212Semi-convection occurs when the Schwarzschild criterion for convection is fulfilled but the Ledoux criterion not..
The convective core can be additionally enlarged using the so-called convective . While Ekström et al. applied an overshoot parameter of 0.1 based on the observed width of the MS in their low mass models ( between 1.35 and 9 ), Brott et al. used a significantly larger overshoot parameter of 0.3. This overshoot parameter was calibrated to adjust the evolution of in their 16 model to reproduce the sudden drop in at =3.2 observed for massive stars in the LMC. Since larger overshooting (Bonn grids) should translate into a bigger star and thus lower gravity and higher luminosity (for the same , , and ), this might also lead to a mass discordance between the estimates derived from the two model grids. While the non-rotating Bonn sequences indeed appear slightly overluminous compared to the current Geneva sequences for the same (see Fig. 10), the differences are small and, in particular smaller (by about a factor of 5 to 6) than the typical uncertainty on the derived , and thus insignificant within the context of evolutionary mass determinations. Based on a set of models computed by means of the MESA code, Martins & Palacios (2014) came to a similar conclusion.
Summarising, we conclude that while there are other reasons that may contribute, such as the specific treatment of convection, semi-convection, and overshooting, the problem with the discordant masses inferred from the rotating Geneva and the Bonn tracks with 300 km s-1 is most likely dominated by differences in the treatment of the mean molecular weight barriers; this results in models of substantially different luminosities and mass-loss rates.
6 Spectroscopic versus evolutionary masses – Mass discrepancy
6.1 General comments
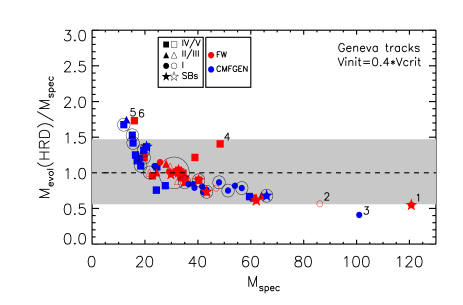
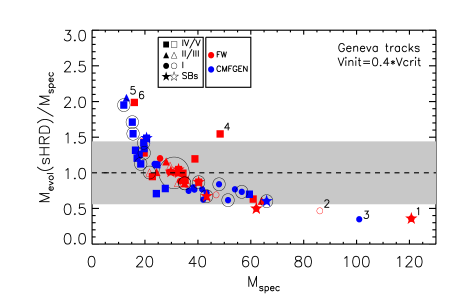
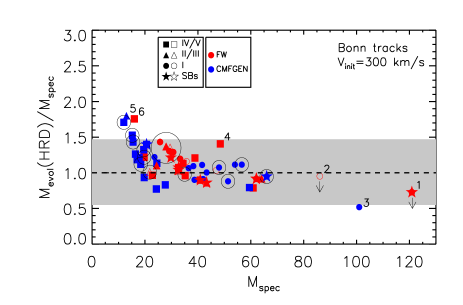
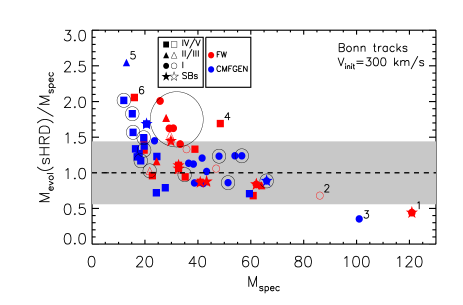
Fig. 11 shows the ratio between the evolutionary ( (HRD) and (sHRD)) and the spectroscopic ( ) masses for the sample stars, where the former are inferred from the current Geneva and Bonn tracks with rotation. For the CMFGEN targets, was adopted from the corresponding studies; for the FASTWIND targets, was derived using corresponding data for and as listed in Table 2131313For the normal and slow rotators ( 110 km s-1 , see Paper II), the centrifugal correction is small, i.e. smaller than 0.01 dex; for the fast rotators, this correction can be significant, reaching values of up to 0.15 dex.. The relative error on our estimates, accumulated by uncertainties in and , is 37% at maximum141414We note that this error does not account for systematic uncertainties in the derived and -values, which may appear as a consequence of specific methods and approximations used in the alternative atmosphere codes..
Several important features become apparent from this figure:
-
i)
Despite the generally good agreement between and (within the 1 error bars), suggestive evidence for the presence of a mass discrepancy is found, in terms of systematic trends and individual targets whose mass ratio deviates from unity by about 1 and more (objects marked with their IDs).
-
ii)
The discrepancy depends on the model grid used and is mass dependent. For the Geneva tracks, a trend towards a positive ( ), negative ( ), and neutral ( ) mass discordance is observed for 25 , 35 , and between these two mass regimes, respectively. For the Bonn tracks, a neutral mass discordance is present for 35 , whereas a trend towards a positive mass discordance emerges for smaller than 35 .
-
iii)
Within a given model grid, the mass discordance is qualitatively similar but stronger for the sHRD compared to the HRD.
-
iv)
Fast rotators ( 110 km s-1 ) and SBs do not demonstrate any peculiarity but appear to follow the trends determined by the rest of the sample stars.
-
v)
The FASTWIND and the CMFGEN targets behave similarly. This result suggests that differences in derived by means of the two codes (if present) are not likely to play a decisive role in determining the agreement between and .
Additional insight into the properties of the established mass discordance can be obtained if one considers the HR diagram (the classical and the spectroscopic one), and the (HRD)/ ratio as a function of for the sample stars accounting for the results outlined in item ii) above (as in Figs. 12, 13, and 14). In practice, to construct these figures we divided the stars into several bins, depending on their specific mass discordence and used different colours to represent these stars: green for the stars showing a trend towards a positive mass discordance ( ¡25 and ¡35 for the Geneva and Bonn tracks, respectively), purple for those demonstrating a trend towards a negative mass discordance ( 35 for the Geneva tracks and ¿80 for the Bonn tracks), and magenta for the objects indicating / around unity without any systematic trend ( 25 ¡ ¡ 35 for the Geneva tracks and ¿35 for the Bonn tracks except for the three most massive targets.)
From these data we find that in comparison to the Geneva models with =0.4 , all but one (outlier No.4) of our stars with 5.65 and 40 appear over massive by 20% to 50% and by 20% to 70% if the HRD or sHRD were used to derive their . For the objects with 5.3 and 32 , on the other hand, a mass discordance with smaller than by about 20% and 29% for the HRD and the sHRD, respectively, is observed. Concerning the stars in the intermediate mass and luminosity regime, they all demonstrate spectroscopic masses that are consistent with the evolutionary masses within less than 20% independent of the used diagram.
Analogous findings for the Bonn grid with of 300km s-1 indicate by typically 24% (for the HRD) and 40% (for the sHRD) for the objects in the low mass and luminosity regime ( 5.3 and 30 ), and for the rest of stars in the sample, except for the cooler stars with 40 (data points enclosed by a large circle). These tend to appear under massive, by about 30% and 65% (for the HRD and the sHRD, respectively) compared to the models.
6.2 Possible origin
Discrepant evolutionary and spectroscopic masses can be interpreted in terms of large uncertainties in observed stellar properties, particularly stellar luminosity and surface equatorial gravity, or in terms of inadequate physical ingredients implemented or adopted in evolutionary calculations.
Regarding the objects whose mass ratio deviates most from unity (indicated by numbers from 1 to 6 in Figs. 11 to 14), independent of the model grid used, we suggest that large uncertainties in the observational parameters rather than inadequate model predictions might be responsible for their peculiarity (see Appendix A.2.).
6.2.1 Stellar luminosity
While systematic, distance- and temperature-dependent errors in our results for appear unlikely151515These data originate from two different model atmosphere codes that use different assumptions and approximations, and different methods and approaches to determine surface luminosities. there are, at least, three lines of reasoning which suggest that the established mass problem (in this but also in Sects. 5.2) should not be related to large errors in caused by uncertain distances and/or reddening. Indeed, if errors in were responsible for the mass discordance, then 1) field stars should behave differently from members of cluster and associations; 2) the discrepancy should be qualitatively different if (sHRD) instead of (HRD) were considered161616 (sHRD) is almost independent of , while (HRD) is directly related to it., and 3) the adopted distance should systematically and significantly deviate from the values inferred from the GAIA parallaxes, that is at least for the stars that are members of clusters and associations. Since none of these items are confirmed by our results, it seems rather unlikely that such errors could lead to the mass patterns visible in Figs. 8 and 11, although large uncertainties in for individual objects cannot be excluded, of course.

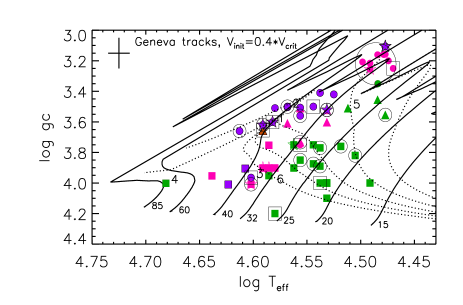

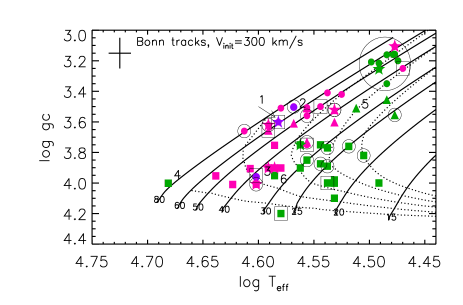
6.2.2 Surface gravities
In Fig. 12, the classical HRD and the KD of the sample is plotted against the current Geneva tracks with rotation and the Bonn tracks for 300 km s-1 . To guide the eye and facilitate the comparison, different colours have been used to denote the objects that experience different kinds of a mass discordence (see Sect. 6.1).
In an observational context, the data shown on the right reveal that sample dwarfs and subgiants (squares) with ranging from 4.1 to 3.75 dex are clearly separated from the normal giants and supergiants (circles), and only one object indicates =4.2 dex. For (KD) between 20 and 40 , this range is independent on stellar mass; for (KD)40 , no constraint can be provided because of the limited number of very massive stars close to the ZAMS. Analogous findings for normal and bright giants indicate a lower limit of 3.4 dex for 20 (KD)25 , and of 3.6 dex for 30 (KD)40 . For the supergiants, the corresponding values range from 3.6 for the highest masses probed, to 3.2 for the most evolved objects with masses of 32 (Geneva tracks) and 40 (Bonn tracks). These findings are quantitatively consistent with similar results from previous studies (e.g. Martins et al. 2005a, Martins & Plez 2006, and Martins et al. 2015b), and thus also confirm the reliability of our determinations for the FASTWIND targets.
Accounting for the loci of the targets in the classical HRD, there appears to be a rough correspondence between observed and predicted values for the objects in the low mass and luminosity regime (data points in green): on both diagrams, these targets are generally located between the 20 and 32 Geneva tracks and between the 20 and 30 Bonn tracks. Closer inspection of the data however revealed that in the KD many of these targets tend to appear more massive and more evolved, and thus with lower than expected for the measured (HRD) by about 0.05 to 0.15 … 0.20 dex.
Regarding the objects in the high mass and luminosity regime, and in comparison to the Geneva tracks, some of these (magenta data points) show consistent values, while others (purple data points) disagree, indicating gravities by about 0.2 dex larger than predicted. Compared to the Bonn tracks, however, we find a good correspondence for the majority of stars in this mass regime (magenta data points) except for the objects enclosed by a large circle, which display values lower than predicted for their (HRD) by about 0.10 to 0.15 dex, and the three mass outliers CPD47 4551 (No. 1), HD 169582 (No. 2), and HD 148937 (No.3), which appear less massive in the KD compared to the HRD (data points in purple).
One way to interpret the disagreement between observed and predicted in the low mass regime is to assume that the former might have been systematically underestimated by the model atmosphere analysis. Since the FASTWIND and CMFGEN targets are equally involved, our results would then imply that owing to some common deficiency both codes should provide gravities lower than the real gravities. A potential candidate to play this role is microturbulence.
Although the origin of microturbulence is still debated for massive stars (wind velocity fields: Kudritzki 1992; subsurface convection zones: Cantiello et al. 2009, Grassitelli et al. 2015a, 2015b; combination of pulsations: Townsend et al. 2007; or the consequence of a still rather simplified treatment of the complex stellar physics involved in model atmosphere calculations), and this parameter is not a fiction but a real physical quantity, it should result in a turbulence pressure term in the hydrodynamic and quasi-hydrostatic description leading to increased surface gravities in spectroscopic analyses. Since neither CMFGEN nor FASTWIND accounts for this possibility, the equatorial surface gravities derived by means of these codes, at least at actual analyses, might be somewhat underestimated 171717For a star with =40 kK, a microturbulence of 15 to 20 km s-1 would increase the value of by 0.1 to 0.15 dex if accounted for as a pressure term, which would be roughly enough to reconcile model predictions and observations even in the more prominent cases..
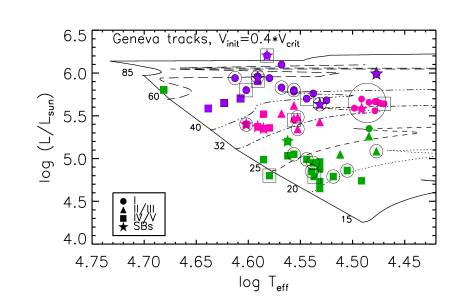
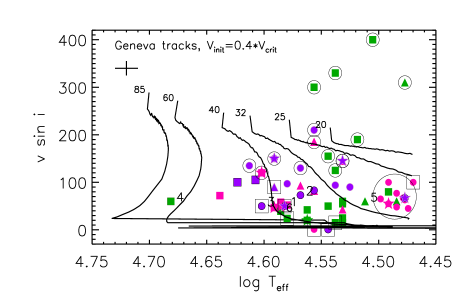
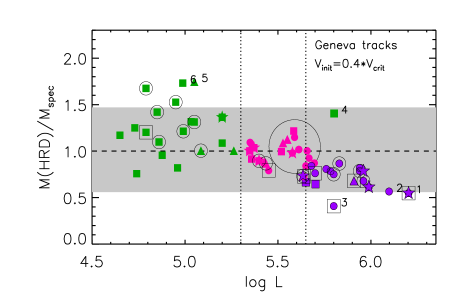
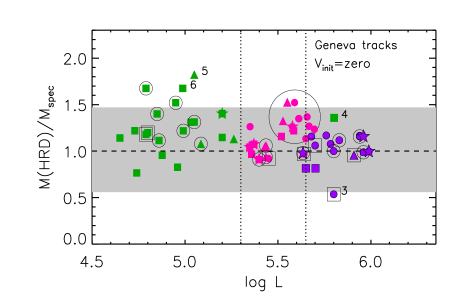
There might be, at least, one potential problem with this hypothesis. If underestimated surface gravities caused by the neglect of microturbulent pressure in stellar atmosphere codes were responsible for the problem in the low mass regime, similar, and even larger discrepancies should be present in the high mass regime where a stronger influence of is expected (see e.g. Cantiello et al. 2009, Massey et al. 2013, Markova et al. 2014, and references therein). Such a discrepancy, however has not been revealed by our analysis.
A possible way to overcome this difficulty is to assume that in the high mass regime ( 40 ), the effect of neglected microturbulent pressure on might have been hidden by some other process(es), which also contribute(s), but in the opposite direction. Since in this mass regime, the evolution of surface gravity is governed by rotation and mass loss, our results would then imply that the effects of faster rotation and eventually higher should either compensate (for the Bonn tracks) or overcompensate (for the Geneva tracks) the effects of neglected microturbulent pressure. This would then lead to the present situation, where for the Bonn tracks (model) (obs), while for the Geneva tracks (model) (obs).
6.2.3 Inadequate rotational rate
Recently, Martins & Palacios (2014) have warned that the current Geneva models should be used with a good recognition that they are relevant for fast rotating objects only. With this caveat in mind, in the upper panels of Fig. 13 we plotted the distribution of the sample in the classical HRD and the – diagram using the same symbols and colours as in Fig. 12. The current Geneva predictions for =0.4 are overplotted.
From the upper right panel one can see that our sample consists of stars with ranging from close to zero up to 400 km s-1 . About 68% of these stars have 100 km s-1 : 23% rotate at between 100 km s-1 to 200 km s-1 and the rest are fast rotators with 200 km s-1 . Analogous results for 116 O stars in the MW studied by Simón-Díaz & Herrero (2014) indicate that 63%, 15%, and 22% of the total sample are distributed in the same velocity bins as considered for our sample181818We compare to Simón-Díaz & Herrero (2014) because, similar to us, these authors consider macroturbulent broadening in addition to the rotational broadening while studies, such as Penny (1996), Penny et al. (2004), and Wolff et al. (2006) do not account for the effects of macroturbulence.. From this comparison it follows that our sample may lack objects with very fast rotation but appears to be representative for O-type stars with lower than 200 km s-1 .
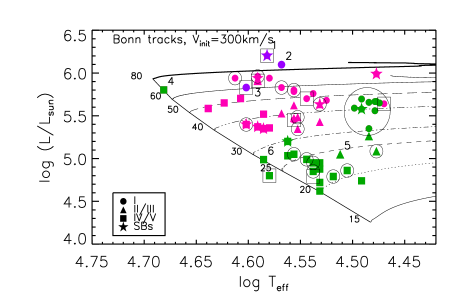
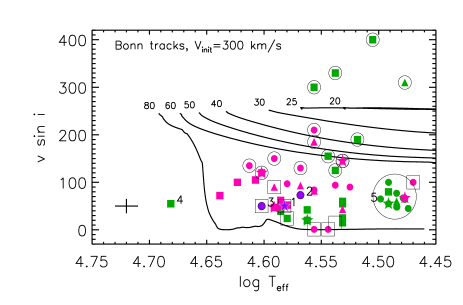
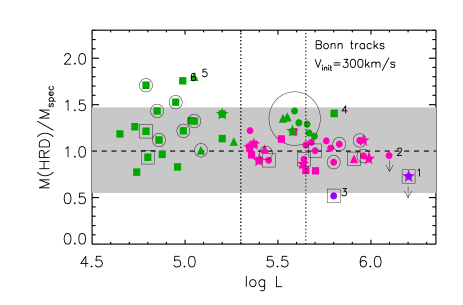
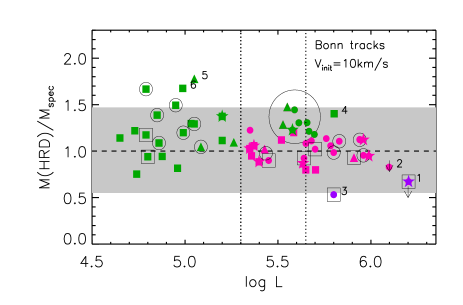
By confronting the Geneva predictions with our observational data, and accounting for the loci of each target in the classical HRD, we find that the objects that tend to indicate (HRD) (data points in purple) appear to rotate faster, whereas those with (HRD) (data points in green) slower than expected for their (HRD). The exception to this is the fast rotators, which deviate showing either consistent (3 out of 7) or significantly larger than the corresponding model values. Interestingly, as well for the objects with consistent and (HRD) (data points in magenta), the rotational rate is not well reproduced by the models: dwarfs and giants indicate lower than the model values, whereas the supergiants (data points enclosed in the large circle) rotate faster then expected for their (HRD).
Further considerations exploiting the (HRD)/ ratio for the sample stars, calculated using the rotating and the non-rotating Geneva tracks (lower panels of Fig. 13), indicate that for the objects experiencing a negative mass discrepancy (data points in purple), the problem appears as a consequence of stellar rotation and/or related processes as implemented in the Geneva models; for those demonstrating a trend towards a positive mass discordance (data points in green), no significant changes in the mass pattern occur due to the limited effects of rotation and negligible mass loss in this regime (see Fig. 8 in Maeder & Meynet 2000). We note however that in the later case the mass discordance appears to be somewhat stronger for the non-rotating compared to the rotating tracks: 23% versus 20% for the HRD and 39% versus 29% for the sHRD.
Concerning the stars whose evolutionary mass is consistent with the spectroscopic one (data points in magenta), for the dwarfs and giants the mass pattern does not seem to depend on ; for the supergiants (data points enclosed by a large circle), an increase in from zero to 0.4 turns out to be enough to bring their (HRD) in perfect agreement with .
We now turn to the Bonn models with 300 km s-1 . From the upper panels of Fig 14, it is evident that these models rotate generally faster than the sample stars, independent of the kind of mass discordance they indicate; this is the case with the exception of the four fastest rotators whose velocities are underestimated, and the three targets with of about 200 km s-1 whose rotational speeds are well reproduced by the models. From the lower panels, on the other hand, we find that – over the whole luminosity range covered by the sample – the mass pattern does not (or hardly) change when non-rotating instead of rotating tracks were used to determine . Particularly, for the objects in the low mass and luminosity regime (data points in green), the mass discordance amounts to 24% (HRD) and 40% (sHRD) for the rotating versus 22 (HRD) and 38& (sHRD) for the non-rotating Bonn models. In contrast to the Geneva tracks, also the high luminosity regime remains rather unaffected from the inclusion of rotation (at least with respect to stellar parameters), which results from the consideration of the barrier that almost prohibits the mixing of helium into the radiative zone (see Sect. 5.3). Consequently, luminosities (and thus stellar masses) become (almost) independent on unless extreme rotation rates are considered (Brott et al. 2011).
Summarising, we conclude that initial rotation that is too fast may contribute only for the more massive and evolved objects (data points in magenta) to explain the mass discrepancy established when comparing to the current Geneva models for =0.4 191919To recapitulate, this is an indirect effect, since in these models fast rotation leads, via mixing and an increased mean molecular weight in the radiative zone, to higher luminosities and larger mass loss, which finally results in masses significantly lower than those derived from spectroscopic analyses.. Regarding the mass problem observed for the less massive stars independent of the used grid (data points in green), our analysis shows that underestimated from spectroscopic analyses may contribute, but a detailed quantitative consideration (accounting for all important parameters involved) is required to understand this issue completely.
Finally in this section, we point out that while both model sets are generally inappropriate to represent the rotational properties of our sample, the Bonn models rotate generally faster than the Geneva models (for the same and ). While differences in might be an issue, especially in the low mass regime, differences in the mass-loss rate and the treatment of angular momentum transport (see Sect. 5.3) are the main agents dominating the process. Indeed, while the Bonn models account for the extremely efficient angular momentum transport by internal magnetic fields (caused by a Spruit-Tayler dynamo, see Brott et al. 2011 and references therein), resulting in a quasi solid-body rotation, the Geneva models include angular momentum advection from the meridional circulations, which may transport angular momentum from the envelope inwards. As a consequence, the Bonn models rotate (at the surface) faster than the Geneva models, where the effect increases towards higher initial masses owing to the lower mass-loss rates present in the Bonn models (see Sect. 5.3), as already pointed out by Meynet & Maeder (2005) and illustrated in Figs. 12 and 13 of Keszthelyi et al. (2016).
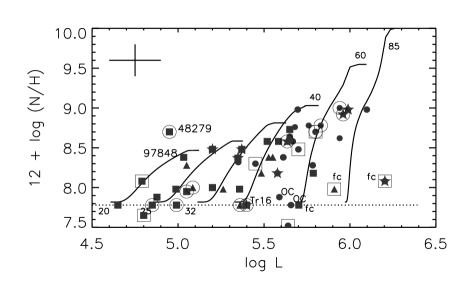
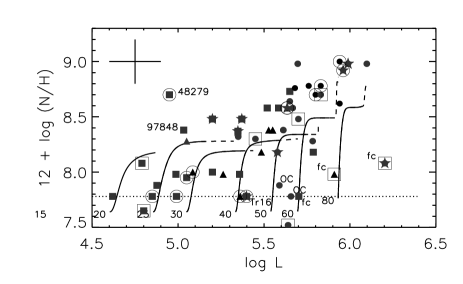
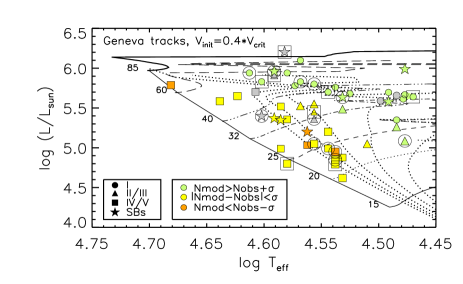
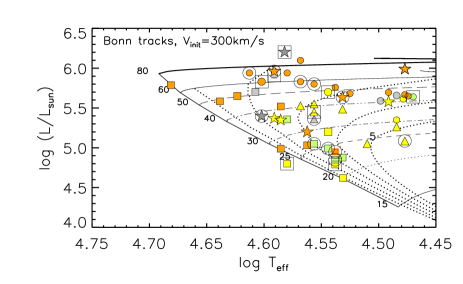
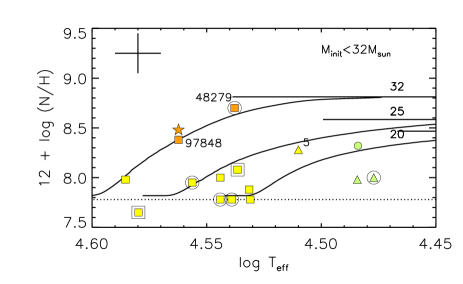
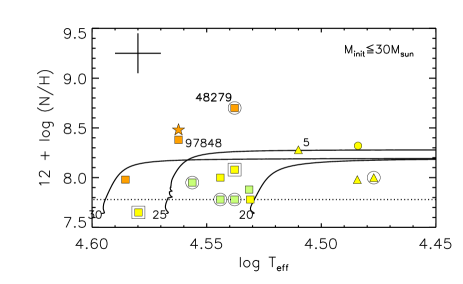
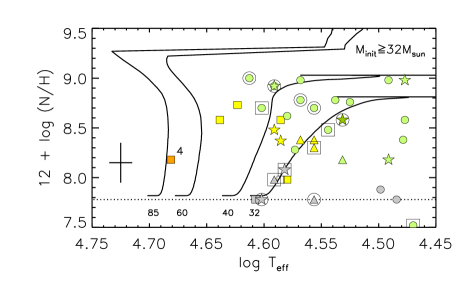
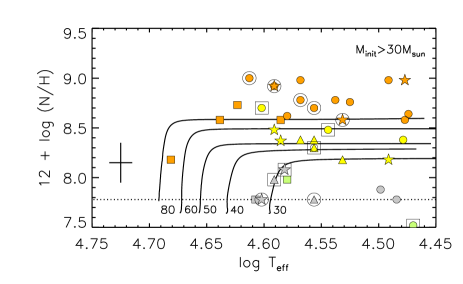
7 Chemical surface enrichment and rotational mixing
7.1 Nitrogen enrichment
For hot massive stars, the surface chemical enrichment is a multivariate function of stellar parameters (Maeder et al. 2009). Therefore, in order to constrain various effects on the derived N abundances, in Fig. 15 we show the classical HRD in parallel to the [N]– and the [N]–log diagrams for the sample stars built using the current Geneva tracks with =0.4 (left) and the Bonn tracks with =300km s-1 (right). To guide the eye and facilitate the comparison, different colours have been employed to denote those stars whose positions on the –[N] diagram are either consistently (within 1) reproduced by the tracks as selected from their position on the classical HRD (yellow) or fail to be reproduced (light green and orange).
From the upper left panel of Fig. 15, it appears that the Geneva models tend to reproduce the N abundances of the sample dwarfs generally well while overpredicting those of the giants and supergiants. Further considerations employing the classical HRD in parallel to the [N]–log diagram confirm these trends, which indicate that the bulk of our dwarfs with 32 (in the left panel of the third row, yellow squares) are located between the 20 and 25 model tracks; this is consistent with their position in the classical HRD. Analogous findings apply to all but one of the more massive dwarfs with (HRD)32 (yellow squares in the lower left panel), which on both diagrams are distributed between the 32 and the 50 Geneva tracks. There are only four sample dwarfs (data points in orange) that stand apart, displaying a nitrogen enrichment larger than predicted for their (HRD) and by about 0.4 dex: HD 48279, which might be a former binary (Martins et al. 2012b); HD 97848, which is a field star with a potentially underestimated luminosity (and hence (HRD)); the SB1 system HD 46573; and the mass outlier No. 4 (HD 64568), whose might have been somewhat overestimated (see Appendix B).
Similar considerations for the sample supergiants indicate that for those with 32 , the observed N enrichment is lower then predicted by the models by about 0.3 to 0.4 dex (in the lower left panel of Fig. 15, light green circles). In the classical HRD these objects are distributed between the 32 and the 85 tracks, whereas in the [N]– diagram these objects are generally located between the 20 and the 50 tracks, and the morphologically peculiar stars with very weak N lines (Ofc, OC, and Onfp objects, data points in grey) are the exception. The same behaviour is found for the less massive supergiant HD 209975 (light green circle in the left panel of the third row), whose N enrichment is overpredicted by about 1 and more. On the classical HRD this star appears either as a 30 MS or as a 25 post-MS object, while its N enrichment is well fitted by the 20 track.
For the sample giants and bright giants, our analysis indicates good agreement (within 1) for the objects with an intermediate mass (yellow triangles in the lower left panel). On both diagrams these stars are consistently distributed between the 32 and 40 Geneva tracks and a severe discrepancy for those with 32 . Specifically, for the two coolest giants (HD 69106 and CD-44 4865) present in the low mass regime (light green triangles in the left panel of the third row of Fig. 15), the observed N content is lower by about 0.4 dex than expected for stars of the same and (HRD) of about 22…25 . Concerning the bright giant HD 207198 (mass outlier No. 5, see Appendix B), whose enrichment appears to be consistent with that predicted by the models, if its luminosity has been indeed underestimated (by about 0.4 dex, as suggested in Appendix B), this giant would also indicate a discrepant N enrichment (by about 0.5 dex). In the classical HRD, it would appear as a 32 object, while its nitrogen content is well reproduced by the 25 Geneva track.
We now turn to the Bonn models for 300 km s-1 . From the upper right panel of Fig. 15, we find that for 30 , these models tend to underpredict the N enrichment for the sample stars (objects of OC, fc and nfp categories apart, see Sect. 4.2.4). Exploiting the classical HRD in parallel to the [N]– diagram, we also find that while all stars with (HRD)40 (save the outliers with peculiarly lower N abundances denoted in grey) are more enriched than predicted by the models (by about 0.4 dex and more), a good correspondence between model predictions and observations (generally within 1) is present for those with (HRD) between 30 and 40 (in the lower right panel, data points in orange and yellow, respectively).
Similar considerations for the objects in the low mass regime ( 30 , right panel of the third row in Fig. 15) show that the Bonn models can reproduce the N abundance for the sample giants and supergiants reasonably well (within 1; data points in yellow) but are not able to reproduce that for many of the sample dwarfs. On the HRD and the [N]–log diagram, all (but three) of the dwarfs are consistently located between the 20 and 30 tracks, yet the N enrichment for half of these (denoted by light green squares) is lower (by about 1 to ) than expected for the corresponding (HRD). Interestingly, for the bright giant HD 207198 (mass outlier No.5, see above), the empirical [N] is also consistent with that predicted by the models for the corresponding (HRD).
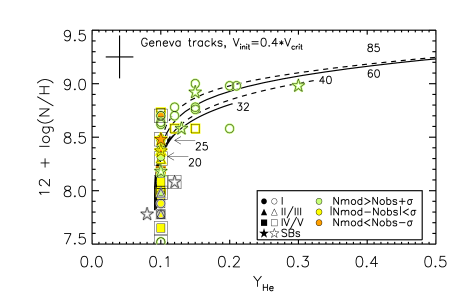
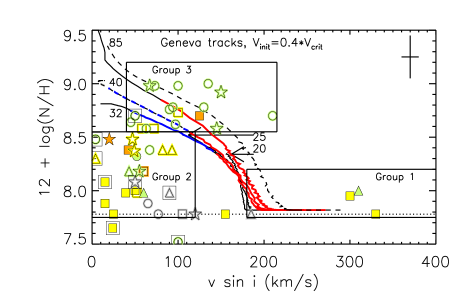
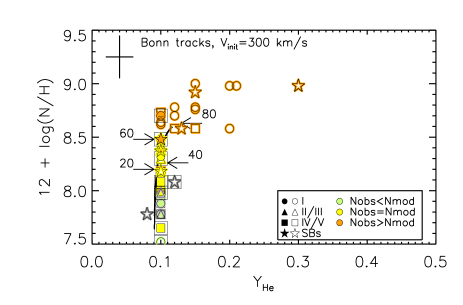
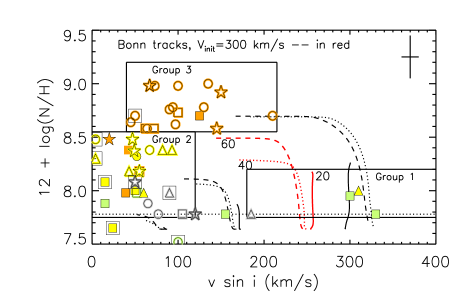
Regarding the less massive dwarfs that appear more enriched than predicted by the Bonn models (in the right panel of the third row, data points in orange), three of these, HD 48279, HD 97848, and SB1 HD 46573, were already discussed as objects with peculiarly high enrichment in comparison to the Geneva tracks (see above); the fourth, CPD-58 2620, is a mass outlier (No.6) whose luminosity and gravity might be subject to large uncertainties (see Appendix A).
In conclusion, while our analysis reveals a clear trend of stronger N enrichment in more massive and evolved objects, the current Geneva models with =0.4 appear to reproduce well the enrichment of the sample dwarfs and the less evolved giants, while overpredicting that for the more evolved giants and the supergiants. The Bonn models with 300 km s-1 , however seem appropriate to study the enrichment for the giants and supergiants with (HRD)40 , but tend to overpredict the enrichment for the less massive dwarfs and underpredict that for the stars with (HRD)40 .
7.2 Correlation between nitrogen and helium enrichments
On the left of Fig. 16, the N enrichment is shown as a function of He enrichment for the sample stars. For the objects with [N]8.5 dex, no significant He enrichment can be seen; for those with [N]8.5 dex, a clear correlation is observed. While these findings are qualitatively consistent with theoretical predictions (from Ekström et al. 2012 and from Brott et al. 2011), a closer inspection of the data reveals that for the low mass stars (filled symbols; (HRD) 32 and 30 for the Geneva and Bonn models, respectively) with [N]8.5 dex the agreement between the observed and predicted N – He enrichment relation is not only qualitative, but also quantitative; for the high mass stars (open symbols; (HRD)32 (Geneva tracks) and 30 (Bonn tracks)), a discrepancy emerges in which the objects appear less evolved, and thus less He enriched, compared to the corresponding Geneva models, or more He enriched compared to Bonn models (aside from OC, fc and nfp category objects; data points in grey). Indeed, while many of our more massive targets are significantly He and N enriched, the Bonn models for 60 only produce stars with a baseline He abundance, whereas the Geneva models become significantly He enriched starting from =32 on. As the amount of helium mixed into the stellar surface is a direct consequence of the treatment of the mean molecular weight barriers (see Sect. 5.3), these results might imply that both model grids may not adequately account for this physical ingredient.
7.3 Rotational mixing
The right part of Fig. 16 shows the –[N] diagram for the sample stars. In observational context, these data indicate that for the objects in the low mass regime (data points denoted by filled symbols; (HRD)32 (Geneva tracks) and 30 (Bonn tracks)), no clear trend of [N] with can be seen. For those objects in the high mass regime (open symbols), except for the magnetic stars and the data points in grey, a weak trend towards more enrichment for larger equatorial rotational rate seems to emerge. We note that this trend would lose significance, however, if the five fastest rotators in this mass subgroup were discarded. Additionally, we also see that at same/similar , the more massive dwarfs are more N-rich than the less massive dwarfs, and less enriched than the supergiants in the same mass regime. These results confirm the idea that rotational mixing is more efficient at higher masses and later evolutionary phases (Maeder & Meynet 2000).
Interestingly, the SBs and magnetic stars do not seem to depart from the main trends, although for the latter a clear tendency – independent of mass and LC – to rotate slowly while being relatively unenriched can be observed.
Another point to be noted here is the clear deficit of more massive N-rich objects with very fast rotation ( 250 km s-1 ). This feature however is most likely a result of observational selection, as pointed out in Sect. 6.2.3.
In comparison to the model predictions, the data shown in the right of Fig. 16 reveal that while both the current Geneva models with =0.4 and the Bonn models with 300 km s-1 can produce fast rotators that are basically unenriched, neither of these models can account for (within the corresponding uncertainties) the projected rotational rates of our less massive, rapid rotators with 300 km s-1 , as shown in the upper right panels of Figs. 13 and 14. (See also Fig. C 1, where the corresponding vsini–[N] diagram is shown in two portions for each model grid: one for the low and another for the high mass regime.) Neither do these models predict the existence of stars with normal and slow rotation ( 120 km s-1 ) that are not or moderately nitrogen enriched ([N] below roughly 8.5 dex). From now on we refer to these two groups of stars as Group 1 and Group 2, respectively.
Regarding the more massive, N-rich objects with normal and rapid rotation (Group 3), it is evident that the Bonn grids with 300 km/s are generally incapable of representing the position of these targets, producing only very fast rotating O stars that are not or weakly chemically enriched ([N]8.5 dex). For the Geneva grids, we find that while the models cover the range of observed and [N] for the Group 3 stars, all dwarfs rotate at lower velocity, yet indicating an enrichment consistent with that expected for their and (HRD). Regarding the supergiants (also including the three SBs), all of these appear less enriched but with faster rotation than predicted by the models: in our diagram, these stars populate the area covered by the red and blue parts of those tracks where the dwarfs and giants should reside.
Overall, the main implication of the above results is similar to that already formulated in Sect. 6.2.3, namely that additional models, particularly with lower , might be needed to solve the N– problem established when comparing to the current predictions. Regarding the Bonn grids, such a test is already possible, and we performed this via the BONNSAI tool 202020The BONNSAI analysis was performed using , , , [N], and as observables, and a Salpeter initial mass function and a uniform initial rotational velocity distribution in the range from zero to 600 km s-1 as independent priors.. The obtained results show that for each of the Group 1 and half of the Group 2 objects (about 40% of the total sample) an acceptable or at least compromise solution for all important parameters ( , , , [N], and ) can be obtained when is allowed to be lower or higher than 300 km s-1 . For the rest of stars in Group 2 and those in Group 3 however, such solutions cannot be reached unless the majority (about 2/3) of their members were fast rotators seen pole-on212121 Warning: Since our definition of Groups 2 and 3 within the –[N] diagram is different from that used by Hunter et al. (2008), any comparison between results derived in these two studies should be considered with caution.. Since the latter possibility seems rather unlikely, given the large number of stars involved, and excluding the seven known binaries, we conclude that the N pattern of about 50% of the single stars in the sample cannot be explained in the current framework of rotational mixing, as implemented in the Bonn grids for solar metallicity.
Finally in this section, we point out that mostly as a consequence of the smaller initial carbon and oxygen mass fractions in the Bonn models ( and , respectively) compared to those in the Geneva models ( and ), CNO equilibium leads to a smaller nitrogen abundance in the Bonn models (12+log(N/H)) than in the Geneva models (12+log(N/H)) assuming no hydrogen depletion. This should be taken into account when both model results are compared in Figs. 15 and 16.
8 Comparison to other studies
One of the main outcomes of our analysis is that the results of the comparison between model predictions and observations depend crucially on the specific choice of the model grid and the kind of diagram used. With this in mind, and given that the model predictions for B supergiants are strongly influenced by the behaviour of at the bistability jump—an issue that may be problematic for current model evolutionary calculations (e.g. Keszthelyi et al. (2016))—we limit our discussion, when comparing with other studies, to those that either employ the Ekström et al. or Brott et al. grids (or both), and are furthermore focussed on O stars.
8.1 Mass discrepancy
Based on the analysis of detached eclipsing binaries in the LMC and the MW, Massey et al. (2012); Morrell et al. (2014), and Kourniotis et al. (2015) have concluded that in comparison to the Geneva models with =0.4 all involved stars, which are late O-type dwarfs and thus fall into the less luminosity regime as defined by us, appear undermassive by typically 11% to 20%.
Regarding the Bonn grids, evidence of a positive mass discrepancy (by up to 20% on average) have been reported by Mahy et al (2015) and by Ramírez-Agudelo et al. (2017) for samples of O stars in the MW and the LMC, respectively, with (HRD)30 . In contrast, from the analysis of a large sample of O dwarfs in the LMC, Sabín-Sanjulián et al. (2017) have concluded that there is no compelling evidence of a systematic mass discrepancy. Taken at face values however the data illustrated in their Fig. 14 indicate a mass discordance by up to 58% for masses below 20 .
The results outlined above are in good qualitative, and in most of the cases quantitative, agreement with similar findings from the present work. Our results indicate that in comparison to the Geneva models with =0.4 and the Bonn models with =300 km s-1 , our stars with (HRD lower than 32 (Geneva) and 30 (Bonn)) appear undermassive by average values of 20% and 24%, respectively.
Regarding the trend towards a negative mass discordance established for our sample stars with (HRD)35 in comparison to the Geneva grids with =0.4 , these results are so far first and thus unique.
Possible interpretation
Since the studies referred to above have been performed applying either the FASTWIND or CMFGEN code, it does not seem likely that he mass problem established in the low mass O star regime might be explained by potential shortcomings in the FASTWIND modelling, as suggested by Massey et al. (2013).
Rotation of the considered models that is too fast or too slow cannot be responsible either because, firstly, evidence of a mass discordance has been obtained using the BONNSAI tool and accounting for the distribution of the corresponding targets (Ramírez-Agudelo et al. (2017) and Sabín-Sanjulián et al. (2017), see above) and, secondly, at least for our sample, lowering the value of down to zero does not significantly affect the outcome of the mass discrepancy analysis (see lower panels of Figs. 13 and 14).
Underestimated derived from the FASTWIND and CMFGEN analyses, owing to the neglect of turbulent pressure term in hydrodynamic and quasi-hydrostatic equations, might help to cure the problem, but this possibility has to be carefully investigated in the future accounting for all important parameters involved (see Sect. 6.2.2).
On the other hand, to explain the discordant masses derived for their targets in comparison to the Geneva models with =0.4, Massey et al. (2012) have suggested that either larger than 0.4* or a convective overshoot parameter larger than 0.1 might be needed to reconcile observed and predicted luminosities. While both hypotheses by Massey et al. are legitimate, our analysis indicates that the former hypothesis is not applicable to our less massive dwarfs, which generally rotate more slowly than predicted by the models; the latter hypotheses might be applicable, although an even larger overshoot parameter (larger than 0.3, as adopted in the Bonn models) would to be required.
Interestingly, an overshoot parameter larger than 0.3 in the Bonn models for 15 was suggested by Castro et al. (2014) investigating the sHRD for about 600 massive stars in the MW, and by McEvoy et al. (2015), based on the model atmosphere analysis of a sample of single and binary late-O stars and B Sgs in the LMC. These findings are somewhat different from similar results from Martins & Palacios (2014) who argued that an overshoot parameter between 0.1 and 0.2 in models with between 250 and 300 km s-1 is needed to reproduce the sHRD for hot massive stars with solar metallicity.
With the above outline in mind, we conclude that although the reason(s) for the mass discordance observed in the low mass O star regime ( 30 ) is not presently clear, there is compelling evidence that stellar masses derived for objects in this regime (from stellar luminosity or surface equatorial gravity) are larger than the spectroscopic masses by typically 20 to 25% for the HRD and 30 to 40% for the sHRD. This finding does not seem to depend on metallicity (solar or half solar) and is also independent of the model grids used: the current Geneva and the Bonn grids both lead to qualitatively similar results.
Concerning the negative mass discordance established for our more massive stars ( (HRD)35 ) in comparison to the Geneva grids with =0.4 , from our analysis it appears that better agreement between model predictions and observations might be obtained using models with lower than 0.4 (see Sects. 6 and 7). But an alternative explanation in terms of problematic efficiency of rotational mixing also seems possible (see Sect. 8.2.2).
8.2 Chemical surface enrichment and rotational mixing
Studies of chemical surface abundances (apart from H and He) in O stars compared with evolutionary model predictions including rotation have so far been performed by Bouret et al. (2013) in the SMC, by Rivero González et al. (2012a, b), and Grin et al. (2016) in the LMC, and by Bouret et al. (2012), Martins et al. (2012a, 2012b, 2015b, 2015c, 2016 and 2017), Mahy et al (2015), and Cazorla et al (2017) in the MW. Because Bouret et al. (2013) used model grids from Meynet & Maeder (2003), while many of the targets analysed by Bouret et al. (2012) and Martins et al. (2012a, 2012b) are part of our sample, in the following we constrain our discussion and comparison to the works by Martins et al. (2015b, 2015c, 2016 and 2017), Mahy et al (2015) Rivero González et al. (2012a), and Grin et al. (2016).
8.2.1 Chemical enrichment as a function of stellar mass and evolutionary stage
Our analysis confirms previous findings from Martins et al. (2015b) and Mahy et al (2015) that within each of the subgroups of LC I, LC II/III, and LC IV/V objects, more massive targets show, on average, a higher degree of N enrichment than the less massive targets (Sect. 4.2.4 and Fig. 6), and that at the same/similar and , more evolved objects appear to be stronger mixed than the less evolved objects (Sect. 7.1 and Fig. 16). These findings are qualitatively consistent with the idea that rotational mixing is more efficient at higher masses (for a population of stars of similar age) and later evolutionary stages.
Regarding the correspondence between predicted and observed N enrichment as a function of , we found that for (HRD) 40 the current Geneva models with =0.4 do a better job than the Bonn models with 300 km s-1 for the objects relatively close to the ZAMS (dwarfs and less evolved giants), and vice versa for the more evolved giants and supergiants. For the objects in the more massive regime, both model grids appear to be equally inadequate, giving rise to significantly larger (Geneva models) or smaller (Bonn models ) enrichments than observed (Sect. 7.1 and Fig. 15).
For O-type dwarfs, our results are qualitatively consistent with similar findings from Martins et al. (2015b) for O-type giants and supergiants, however, they disagree. Particularly, Martins et al. claimed a good correspondence between the current Geneva predictions and the N/C ratio derived for about 80% of their targets, independent of LC, while reporting that Bonn predictions are either lower than (for the majority of the giants) or consistent with (for all supergiants and half of the dwarfs) those observed. As Martins et al. have considered the same models grids as we do in the present study, there are (at least) two possibly explanations that could contribute to these discordant findings:
-
1)
Since we used the classical HRD, whereas Martins et al. (2015b) made use of the KD, this might help to (partly) understand the inconsistent results (see Sect. 6.2.2). At least regarding the current Geneva tracks, this possibility can be easily confirmed if one considers the KD for the sample stars to fix the comparison tracks and then compares these to results from Martins et al. (2015b).
-
2)
Since N enrichment is predicted to depend on stellar mass and age and since Martins et al. (2015b) lacked giants and supergiants with (KD)32 (Geneva tracks) or 40 (Bonn tracks) (We found this by confronting the KDs shown in the right side of Fig. 12 and the left upper and lower panels of Fig. 7 of Martins et al.) this can explain why Martins et al. claimed a generally good correspondence for the majority of their stars independent of LC, while our results indicate problems in the corresponding mass and temperature regime.
Thus, it appears that the lack of consistency between our results and those reported by Martins et al. (2015b) can be, to a large extent, understood in terms of differences in the mass range probed by the two samples, as well as in terms of the different approaches used to fix of the track to which empirical stellar properties have to be compared (classical HRD versus KD).
8.2.2 Chemical enrichment and rotation
Ekström et al. (2012) grids.
From the analysis of 15 O7-O8 giants with between 50 and 300 km s-1 ,
Martins et al. (2017) have found that while the Geneva models for
25 40 and =0.4 can consistently
account for the , and log (N/C)-ratio of their targets,
these models are not able to correctly reproduced the rotational properties
of many of the targets (9 out of 15, i.e. 60%, as can be seen from
the left panel of their Fig. 7). There are objects that rotate significantly
higher or slower than expected for their observed N enrichment and as derived from the KD.
The results obtained by Martins et al. are in good qualitative agreement with similar findings from the present work which also indicate that for a large percentage of Galactic O stars, the [N]- pattern cannot be correctly reproduced by the current Geneva models with =0.4 .
Martins et al. (2017) have shown that the [N]– problem for their sample stars can be successfully solved using Ekström et al. models with higher and lower than 0.4 . Such a solution seems possible for many of our sample stars, especially those in Group 1 and Group 2 (see Sect. 7.3). But we point out that to get conclusive results, the [N]– problem should be considered in parallel with the mass discrepancy issue accounting for all masses appropriate for O stars, from 9 to about 80 .
With this in mind an althernative scenario in terms of problematic
efficiency of rational mixing seems also possible. Particularly, from a
simple quantitative considerations it follows that if the efficiency
of rotationally induced mixing was lower than that adopted in the Geneva
models, this would lead to less luminous tracks and lower mass-loss rates.
This, in turn, would result in a smaller reduction of current masses and
surface gravities and in faster rotation compared to the current predictions.
Also, the He and N enrichment of the models would decrease. The effect would
be weaker close to the ZAMS, increasing towards higher and later
evolutionary stages, i.e. just into the direction we need to reconcile model
predictions and observations, as illustrated in our Figs. 9,
10, and 11. Additionally, as surface gravities (compared to
stellar masses) are expected to be stronger affected by the process of mass
loss, (sHRD) would be lower than (HRD), thus explaining the results
shown in the upper panels of Fig. 6 and 9.
Brott et al (2011) grids.
Mahy et al (2015) and Cazorla et al (2017) have studied the [N]– diagram
for O stars in the MW in comparison to Bonn predictions. The rotational
properties of the corresponding samples are significantly different; the
former is dominated by objects with 200km s-1 while the latter is
focussed on the very fast rotators with between 200km s-1 and 400km s-1 .
Both studies, however come to similar conclusions: there are a large number
of objects whose [N]– properties cannot be accounted for by the
models and there are fast rotators with a lack of nitrogen enrichment (our
Group 1) and slow rotators that are highly N rich (our Group 3).
Based on their own and N abundance determinations for a sample of 25 OB stars in the LMC, Rivero González et al. (2012a) have found that about two-thirds of their O-type targets are N-rich slow rotators whose properties cannot be reproduced by models from Brott et al. Analysing a sample 67 O-type giants and supergiants, Grin et al. (2016) have come to similar conclusions. For at least 30-40 percent of their targets, the observed [N]– pattern cannot be understood in the current framework of rotational mixing, as implemented in the Bonn grids for LMC metallicity.
The results derived in the present study are consistent with those outlined above, indicating that – when all important parameters are accounted for – the Bonn models seem inappropriate to represent the N enrichment in parallel with for a large percentage of the sample (about 50 %, mainly objects from Group 3; see Sect. 7.3), unless the majority were fast rotators seen pole-on. Because of the large number of objects involved, this possibility does not seem likely.
To explain the presence of N-rich, slowly and moderately rotating O
stars (Group 3 in our case) in comparison to the Bonn grids,
Grin et al. (2016) have considered
four scenarios: a rotational mixing efficiency that is larger
than presently implemented, strong stellar winds leading to
envelope stripping, an evolution in binary systems, and the
presence of magnetic fields.
Inadequate efficiency of rotational mixing
There are at least three observational findings that suggest that the
efficiency of rotational mixing as implemented in
the Bonn models might be lower than required by the majority of our more massive
targets: i) the [N]– problem cannot be solved by varying ,
unless the majority of the N-rich objects were seen (almost) pole-on
(Sect. 7.3); ii) the observed correlation between N enrichment
and is steeper than proposed by the models for various (right panel of Fig. 16), and iii) for 40 and
300 km s-1 , the models at the end of the O-star phase are
significantly less mixed than derived from observations (lower right panel
of Fig. 15).
Mass loss and envelope stripping
Severe mass loss can reveal the deeper layers of a massive star, which are
more enriched by nuclear-processed material than the outer layers, thereby
leading to more chemical surface enrichment compared to a star of similar
and , but with a weaker wind. Investigating the run of N
enrichment as a function of (unclumped) mass-loss rate, we found that only
for the most luminous supergiants with strongest winds ( 5.8 and
log [ /yr]-5.4) envelope stripping might be an issue (leaving
CD47 4551 apart, see Sect. 4.2.4). For hot massive stars in the
LMC, Bestenlehner et al. (2014) derived a luminosity threshold of 6.1.
Binary evolution
We have seven binaries in our sample. Our analysis indicates that, regarding
their main properties, these do not significantly depart from single stars
with similar characteristics, no matter which of the two grids were considered.
Similar results have been reported by Mahy et al (2015) in comparison to the
Bonn grid. However, the identified binaries are likely pre-interaction, whereas
a significant number of binary interaction products may appear as single
stars in our sample (de Mink et al. 2014). The latter may show a significant nitrogen
and helium enrichment and overluminosity (Langer 2012) which is not accounted
for by single star evolutionary models. Therefore, an underprediction of the surface
enrichment compared to the observed stars, as found for the Brott et al.
models in Sect. 7, does not necessary imply a problem in the single star
models.
Effects of magnetic fields
The presence of relatively slowly rotating, N-enriched objects might be
explained in terms of magnetically augmented mixing in initially faster
rotators that have been spun down by angular momentum losses through a
magnetically confined stellar wind (see e.g. ud-Doula et al. 2009; Meynet et al. 2011).
But this cannot be an effective channel because of the low number of O stars
with relatively strong magnetic fields (Wade et al. 2016, Castro et al. 2015
and references therein). Even more, after analysing O stars observed within
the context of the MiMeS project, Martins et al. (2015b) failed to relate N
enrichment with magnetic fields. Our analysis confirms these findings.
8.2.3 Morphologically peculiar stars with very weak N lines.
Martins et al. (2016) have recently investigated the properties of four Galactic supergiants classified as OC stars, and found that, while their and are fully consistent with morphologically normal O supergiants, they show little, if any, nitrogen enrichment, and carbon surface abundances consistent with the initial composition.
Results from the present study confirm the conclusion by Martins et. al. about the OC star HD 152249, and furthermore indicate that a similar pattern is present for the more luminous O-type giants and supergiants from our sample, classified as Ofc, Onfp, and Nwk objects. Since some of these are confirmed or suspected binaries, one might argue that our results might be biased by the presence of a companion. Such a possibility, however, seems unlikely because the evolution in a binary system is not expected to lead to lower N enrichment unless the two components have experienced a tidal interaction (de Mink et al. 2013). Thus we conclude that while it is not presently clear whether the OC, Ofc, Onfp, and Nwk stars might form a specific class of objects, results derived in the present study and in Martins et al. (2016) clearly indicate that the chemical surface enrichment observed in these objects cannot be accounted for in the context of rotational mixing in single massive stars unless they all possess strong magnetic fields (see Meynet et al. 2011).
9 Summary
We have analysed the main properties of 53 Galactic O stars, including seven binaries and seven objects with detected surface magnetic fields. For 30 of these stars, our own determinations of the main physical parameters were derived, using the FASTWIND code; for the remaining stars, literature data, obtained by means of the CMFGEN code, were used. The observed properties of the sample were compared to evolutionary model predictions for single massive stars of solar metallicity from Ekström et al. (2012) and Brott et al. (2011).
The main outcome of our analysis can be summarised as follows.
– Spectroscopic masses in the low mass O star regime ( (HRD)30..32 )
tend to be smaller than the evolutionary masses (typically by 20 to 25% for
the case of the HRD and 30% to 40% for the sHRD), no matter if the Bonn models
with 300 km s-1 or the current Geneva models with =0.4 are
used as a reference. While some weaknesses in the treatment of turbulent pressure
in the model atmosphere codes might contribute, the problem cannot be fully
understood in terms of problematic parameters derived from observations. Inadequate
model values of do not seem to be responsible either.
– Within each of the two considered grids, inconsistent evolutionary masses
are derived when using either the stellar luminosity and from the surface equatorial
gravity (Sect. 5.2 and Fig. 8). The differences are generally
small, that is smaller than 20%, but due to their systematic character should
be considered as important. This finding warns about potential, non-negligible
differences between results derived using different diagrams.
– Evolutionary masses given by Geneva tracks with =0.4 are generally
lower than those inferred from the Bonn tracks for 300 km s-1 ,
that is by up to 50% for the HRD and up to 70% for the sHRD. The discordance
strengthens towards larger masses and later evolutionary stages, leaving O dwarfs
almost unaffected. While other reasons may contribute, differences in the
rotational mixing of helium that result in models with substantially different
luminosities and mass-loss rates, appear to be the main reason for this inconsistency (Sect. 5.3).
– We confirm previous findings from Martins et al. (2012b) and Mahy et al (2015) about
a clear trend of stronger N enrichment in more massive and evolved O stars
(Sect. 4.2.4). This finding is qualitatively consistent with the predictions
of rotational mixing in single star evolutionary models. In fact, for 5.3,
the vast majority of our sample stars are nitrogen enriched, which is difficult
to understand in any other way.
– O stars with peculiarly weak N lines, classified as Ofc, OC, or Onfp stars,
show their own N enrichment trend with luminosity, which runs in parallel to
the main trend, but at significantly lower N abundances. On the other hand,
spectroscopic binaries and objects with magnetic fields do not depart (in this
respect) from the rest of the sample stars.
– The empirical N and He surface abundances of our more massive stars are
fairly well correlated. Also here, spectroscopic binaries and objects with
magnetic fields do not depart. However, none of the considered model grids
can match the observed trend correctly, producing either more (the Geneva
grids) or less (the Bonn grids) He enriched objects for a given N abundance
and . In line with the mismatch in the evolutionary masses as stated
above, this result may imply that the mixing of helium in the Geneva models
is too strong, while it might be too weak in the Bonn models.
– If different were considered, the current Geneva models appear
well suited to study the properties of O stars with (HRD)40 .
These models, however, seem generally incapable of representing the properties
of more massive and luminous objects with (HRD)40 . These models
underpredict stellar masses, surface equatorial gravities, and projected equatorial
rotational rates and overpredict surface N enrichment. While that is
too high or too low can be an issue, our results imply that the efficiency of
rotational mixing implemented in the current geneva models for the corresponding
mass regime might be problematic.
– The Bonn model grids can reasonably well reproduce the main parameters
(e.g. , , and ) of O stars in the mass range from 15 to about
80 . However, there is a large percentage of objects (about 50% of our
sample stars) whose [N]– pattern cannot be understood with the current
efficiency of rotational mixing in these models, provided the inclination of
rotational axes is randomly orientated. A problematic transport of angular
momentum as adopted in these models might contribute as well.
Finally, we end this study with two important remarks. First, the main lesson we learned from our investigation is that to obtain conclusive results about the ability of present day evolutionary models to correctly reproduce the physics of (single) massive O stars, one needs to use parameters derived from observations as constraints for the models in parallel. Second, the large percentage of nitrogen enriched massive O stars supports the idea that trace elements such as nitrogen can be effectively mixed throughout the star by rotationally induced turbulence. The fraction of helium enriched massive O stars is smaller, such that we cannot exclude the suggestion that a binary history is responsible for the helium enrichment in these stars. The investigation of a larger sample of stars and a comparison to detailed grids of massive binary evolution models is desirable in order to further constrain the key uncertainties in the theory of massive star evolution.
Acknowledgements.
We thanks the referee for her/his valuable comments and suggestions. NM acknowledges financial support from the Bulgarian NSF (grant numbers DN08/1/13.12.2016 and DN 18/13/12.12.2017 ), and the hospitality of the Argelander-Institut für Astronomie at the Bonn University.This work has made use of data from the European Space Agency (ESA) mission Gaia (http://www.cosmos.esa.int/gaia), processed by the Gaia Data Processing and Analysis Consortium (DPAC, http://www.cosmos.esa.int/web/gaia/dpac/consortium). Funding for the DPAC has been provided by national institutions, in particular the institutions participating in the Gaia Multilateral Agreement.
References
- Arenou et al. (2016) Arenou, F., Luri, X., Babusiaux, C., et al. (2016) Gaia Data Release 1: Catalogue data validation: procedures, statistics and conclusions. A&A special Gaia volume.
- Asplund et al. (2005) Asplund, M., Grevesse, N., & Sauval, A. J. 2005, in Cosmic Abundances as Records of Stellar Evolution and Nucleosynthesis, ed. T. G. Barnes III, & F. N. Bash, ASP Conf. Ser., 336, 25
- Asplund et al. (2009) Asplund, M., Grevesse, N., Sauval, A.J. & Scott, P. 2009, ARA&A, 47, 481
- Barbier-Brossat and Figon (2000) Barbier-Brossat, M. & Figon, P. 2000, A&AS, 142, 217
- Bestenlehner et al. (2014) Bestenlehner, J.M., Gräfener, G, Vink, J.S., et al. 2014, A&A, 570, 38
- Bouret et al. (2012) Bouret, J.-C., Hillier, D. J., Lanz, T., & Fullerton, A. W. 2012, A&A, 544, A67
- Bouret et al. (2013) Bouret, J.-C., Lanz, T., Martins, F., et al. 2013, A&A, 555, A1
- Brott et al. (2011) Brott, I., de Mink, S. E., Cantiello, M., et al. 2011, A&A, 530, 115
- Cantiello et al. (2009) Cantiello, M., Langer, N., Brott, I., et al. 2009, A&A, 499, 279
- Carraro & Patat (2001) Carraro, G. & Patat, F. 2001, A&A, 379, 136
- Castro et al. (2014) Castro, N., Fossati, L., Langer, N., et al. 2014, A&A, 570, 13
- Castro et al. (2015) Castro, N., Fossati, L., Hubrig, S., et al. 2015, A&A, 581, A81
- Cazorla et al (2017) Cazorla, C., Nazé, Y., Morel, Th. et al. 2017, A&A, 604, 123
- Chieffi & Limongi (2013) Chieffi, A. & Limongi, M. 2013, ApJ, 764, 21
- Crowther & Evans (2009) Crowther, P. & Evans, C. 2009, A&A, 503, 85
- de Mink et al. (2009) de Mink, S. E., Cantiello, M., Langer, N., et al. 2009, A&A, 497, 243
- de Mink et al. (2013) de Mink, S., Langer, N., Izzard, R. G., et al. 2013, ApJ 764, 166
- de Mink et al. (2014) de Mink, S., Sana, H., Langer, N. Izzard, R. G. et al 2014, ApJ 782, 7
- Ekström et al. (2012) Ekström, S., Georgy, C., Eggenberger, P., et al. 2012, A&A, 537, 146
- Evans et al. (2006) Evans, C. J., Lennon, D. J., Smartt, S. J., & Trundle, C. 2006, A&A, 456, 623
- Evans et al. (2011) Evans, C. J., Taylor, W. D., Henault-Brunet, V., et al. 2011, A&A, 530, A108
- GAIA collaboration et al. (2016) Gaia Collaboration, Brown, A., Vallenari, A., Prusti, T. et al. (2016) Gaia Data Release 1: Summary of the astrometric, photometric, and survey properties. A&A special Gaia volume.
- Gies (1987) Gies, D. 1987, ApJSS, 64, 545
- Glebbeek et al. (2013) Glebbeek, E., Gaburov, E., Portegies Zwart, S., et al. 2013, MNRAS, 434, 349
- Grassitelli et al. (2015a) Grassitelli, T., Fossati, L., Simón-Diáz, S., et al. 2015a, ApJ, 808, 31
- Grevesse et al. (1996) Grevesse, N., Noels, A., & Sauval, A. J. 1996, in Astronomical Society of the Pacific Conference Series, held in: Astrophysics Conference in College Park; Maryland; 9-11 October 1995; San Francisco., Vol. 99, Proceedings of the sixth annual October Astrophysics Conference, ed.: by S.S. Holt and G. Sonneborn, 117
- Grin et al. (2016) Grin, N., Ramírez-Agudelo, O.H., de Koter, A., et al. 2016, A&A, 600, 82
- Herrero et al. (1992) Herrero, A., Kudritzki, R.-P., Vilchez, J. M., et al. 1992, A&A, 261, 209
- Hillier & Miller (1998) Hillier, D.J. & Miller, D.L. 1998, ApJ, 496, 407
- Hohle et al. (2010) Hohle, M. M., Neuhäuser, R., & Schutz, B. F. 2010, Astronomische Nachrichten 331, 349
- Howarth et al. (1997) Howarth, I.D., Siebert, K.W., Hussain, G.A.J., et al. 1997, MNRAS, 284, 265
- Hubrig et al. (2011) Hubrig, S., Schöller, M., Kharchenko, N.V., et al. 2011, A&A, 258, 151
- Humphreys (1978) Humphreys, R. 1978, ApJS, 38, 309
- Hunter et al. (2008) Hunter, I., Brott, I., Lennon, D., et al. 2008, ApJ, 676, L29
- Hunter et al. (2009) Hunter, I., Brott, I., Langer, N., et al. 2009, A&A, 496, 841
- Hur et al. (2012) Hur, H., Sung, H. & Bessell, M. 2012, AJ, 143, 41
- Feinstein (1995) Feinstein, A. 1995, RMxAC, 2, 57
- Kaltcheva & Hilditch (2000) Kaltcheva, N. T. & Hilditch, R. W. 2000, MNRAS, 312, 753
- Kaltcheva & Scorcio (2010) Kaltcheva, N. T. & Scorcio, M. 2010, A&A, 514, 59
- Kaufer et al. (1999) Kaufer, A., Stahl, O., Tubbesing, S., et al. 1999, The Messenger 95, 8.
- Keszthelyi et al. (2016) Keszthelyi, Z., Puls, J. & Wade, Gr. 2017, A&A, 598, 4
- Kippenhahn & Weigert (1990) Kippenhahn, R. and Weigert, A. 1990. Stellar Structure and Evolution Berlin: Springer
- Kourniotis et al. (2015) Kourniotis, M., Bonanos, A. Z., Williams, S. J., et al. 2015, A&A, 582, 42
- Kudritzki (1980) Kudritzki, R.-P. 1980, A&A, 85, 174
- Kudritzki (1992) Kudritzki, R.-P. 1992, A&A, 266, 395
- Kudritzki & Puls (2000) Kudritzki, R.-P. & Puls, J. 2000, ARA&A, 38, 613
- Kudritzki et al. (2006) Kudritzki, R.-P., Urbaneja, M. & Puls, J. 2006, IAU 234
- Langer (2012) Langer, N. 2012, ARAA, 50, 107
- Langer & Kudritzki (2014) Langer, N. & Kudritzki, R. P. 2014, A&A, 564, A52
- Leitherer & Chavarria (1987) Leitherer, C. & Chavarria-K., C. 1987, A&A, 175, 208
- Maeder & Meynet (2000) Maeder, G. % Meynet, G. 2000, A&A, 361, 159
- Maeder & Meynet (2015) Maeder, A. & Meynet, G. 2015 Proceedings IAU Symposium No. 307, 9 (eds. G. Meynet, C. Georgy, J.H. Groh & Ph. Stee)
- Maeder et al. (2009) Maeder, A., Meynet, G., Ekström, S., & Georgy, C. 2009, Commun. Asteroseismol., 158, 72
- Maeder et al. (2014) Maeder, A., Przybilla, N., Nieva, M.F., et al. 2014, A&A, 565, 39
- Mahy et al (2015) Mahy, L., Rauw, G., De Becker, M. et al. 2015, A&A, 577, 23
- Maíz-Apellániz et al. (2004) Maíz-Apellániz, J., Walborn, N. R., Galué, H. Á., Wei, L. H., 2004, ApJS, 151, 103
- Marcolino et al. (2009) Marcolino, W., Bouret, J-C, Martins, F., et al. 2009, A&A, 498, 837
- Markova & Puls (2015) Markova, N. & Puls, J. 2015, IAUS 307, 117
- Markova et al. (2004) Markova, N., Puls, J., Repolust, T., et al. 2004, A&A, 413, 693
- Markova et al. (2011) Markova, N. , Puls, J. , Scuderi, S., et al. 2011, A&A, 530, 11 (Paper I)
- Markova et al. (2014) Markova, N., Puls, J., Simon-Diáz, S., et al. 2014, A&A, 562, 37 (Paper II)
- Martínez-Núnez et al. (2017) Martínez-Núnez, S, Kretschmar, P., Bozzo, E., et al. 2017, SSRv, 13
- Martins (2015) Martins, F. 2015, ASSL, 412, 9
- Martins & Plez (2006) Martins, F. & Plez, B. 2006, A&A, 457, 657
- Martins & Palacios (2014) Martins, F. & Palacios, A. 2014, A&A, 560, 16
- Martins et al. (2005a) Martins, F., Schaerer, D. & Hillier, D.J. 2005, A&A, 436, 1049
- Martins et al. (2005b) Martins, F., Schaerer, D. & Hillier, D.J., et al. 2005, A&A, 441, 735
- Martins et al. (2012a) Martins, M., Escolano, C., Wade, G. A., et al. 2012a, A&A, 538, 29
- Martins et al. (2012b) Martins, M., Mahy, L., Hillier, D. J., & Rauw, G. 2012b, A&A, 538, 39
- Martins et al. (2015a) Martins, F., Marcolino, W., Hillier, D.J., et al. 2015a, A&A, 574, 142
- Martins et al. (2015b) Martins, F., Hervé, A., Bouret, J.-C., et al. 2015b, A&A, 575, A34
- Martins et al. (2015c) Martins, F., Simón-Díaz, S., Palacios, A., et al. 2015c, A&A, 578, 109
- Martins et al. (2016) Martins, F., Foschino, S., Bouret, J.-C., et al. 2016, A&A, 588, 64
- Martins et al. (2017) Martins, F., Simón-Díaz, S., Barbá, R.H., et al. 2017, A&A 599, 30
- Massey et al. (2012) Massey, P., Morrell, N., Neugent, K. F., et al. 2012, ApJ, 748, 96
- Massey et al. (2013) Massey, P., Neugent, K. F., Hillier, D. J., & Puls, J. 2013, ApJ, 768, 6
- Mathys (1988) Mathys, G. 1988, A&AS, 76, 427
- McEvoy et al. (2015) McEvoy, C. M., Dufton, P.L., Evans, C., et al. 2015, A&A, 575, 70
- Meynet & Maeder (2003) Meynet, G. & Maeder, A. 2003, A&A, 404, 975
- Meynet & Maeder (2005) Meynet, G. & Maeder, A. 2005, A&A, 440, 1041
- Meynet et al. (2011) Meynet, G., Eggenberger, P. and Maeder, A. 2011, A&A, 525, L11
- Mokiem et al. (2007) Mokiem, M. R., de Koter, A., Evans, C. J., et al. 2007, A&A, 465, 1003
- Morel et al. (2008) Morel, T.,Hubrig, S. & Briquet, M. 2008, A&A, 481, 453
- Morrell et al. (2014) Morrell, N., Massey, P., Neugent, K., et al. 2014, ApJ, 789, 139
- Nazé et al. (2010) Nazé, Y., Ud-Doula, A., Spano, M., et al. 2010, A&A, 520, 59
- Nazé et al. (2016) Nazé, Y., ud Doula, A. & Zhekov, S. 2016, ApJ, 831, 138
- Nieva & Przybilla (2014) Nieva, M.-F. & Przybilla, N. 2014, A&A, 566, 7
- Patriarchi et al. (2001) Patriarchi, P., Morbidelli, L., Perinotto, M., et al. 2001, A&A, 372,644
- Penny (1996) Penny, L. R. 1996, ApJ, 463, 737
- Penny et al. (2004) Penny, L. R., Spraguel, A.J., Seago, G & Gies, D.R. 2004, ApJ, 463, 737
- Prinja et al. (1990) Prinja, R.K., Barlow, M.J. & Howarth, I.D. 1990, ApJ, 361, 607
- Puls et al. (1996) Puls, J., Kudritzki, R.P., Herrero, A., et al. 1996, A&A, 305, 171
- Puls et al. (2005) Puls, J., Urbaneja, M.A., Venero, R., et al. 2005, A&A, 435, 669
- Puls et al. (2006) Puls, J., Markova, N., Scuderi, S., et al. 2006, A&A, 454, 625
- Puls et al. (2008) Puls, J., Vink, J. & Najarro, F. 2008, A&ARv 16, 209
- Puls et al. (2015) Puls, J., Sundqvist, J. O. & Markova, N. 2015, IAUS 307,25
- Ramírez-Agudelo et al. (2013) Ramírez-Agudelo, O. H., Simón-Díaz, S., Sana, H., et al. 2013, A&A, 560, 29
- Ramírez-Agudelo et al. (2017) Ramírez-Agudelo, O. H., Sana, H., de Koter, A., et al. 2017, A&A, 600, 81
- Reed (2000) Reed, B.C. 2000, AJ, 119, 1855
- Repolust et al. (2004) Repolust, T., Puls, J. & Herrero, A. 2004, A&A, 415, 349
- Rivero-González et al. (2011) Rivero González, J. G., Puls, J. & Najarro, F. 2011, A&A, 536, 58
- Rivero González et al. (2012a) Rivero González, J.G., Puls, J., Najarro, J.F. & Brott, I. 2012a, A&A, 537, 79
- Rivero González et al. (2012b) Rivero González, J. G., Puls, J., Massey, P. and Najarro, F., 2012b, A&A, 543, 95
- Sabín-Sanjulián et al. (2014) Sabín-Sanjulián, C., Simón-Díaz, S., Herrero, A., et al. 2014, A&A, 564, 39
- Sabín-Sanjulián et al. (2017) Sabín-Sanjulián, C., Simón-Díaz, S., Herrero, A., et al. 2017, A&A, 601, 79
- Salpeter (1955) Salpeter, E.E. 1955, ApJ, 121, 161
- Sana et al. (2014) Sana, H., Le Bouquin, J.-B., Lacour, S., et al. 2014, ApJS, 2015, 15
- Sander et al. (2015) Sander, A., Shenar, T., Hainich, R., et al. 2015, A&A, 577, 13
- Schneider et al. (2014) Schneider, F., Langer, N., de Koter, A., et al. 2014, A&A, 570, A66
- Schröder et al. (2004) Schröder, S.E., Kaper, L., Lamers, H.J.G.L.M., et al. 2004, A&A, 428, 149
- Simón-Díaz & Herrero (2014) Simón-Díaz, S. & Herrero, A. 2014, A&A, 562, 135
- Simón-Díaz et al (2014) Simón-Díaz, S., Herrero, A., Sabín-Sanjulián, C., et al. 2014, A&A, 570, 6
- Smith & Brooks (2008) Smith, N., Brooks, K. 2008, Handbook of Star Forming Regions, Volume II: The Southern Sky ASP Monograph Publications, Vol. 5. Edited by Bo Reipurth, p.138
- Sota et al. (2008) Sota, A., Maíz-Apellániz, J., Walborn, N & Shida, R. 2008, RevMexAA, 33, 56
- Sota et al. (2014) Sota, A., Maíz-Apellániz, J., Morrell, N.I., et al. 2014, ApJS, 211, 10
- Sundqvist et al. (2012) Sundqvist, J. O., ud-Doula, A., Owocki, S.P., et al. 2012, MNRAS, 423,21
- Tapia et al. (2003) Tapia, R., Roth, M., Vazquez, R., et al. 2003, MNRAS, 339, 44
- Townsend et al. (2007) Townsend, R., Owocki, S.P. % Ud-Doula, A. 2007, MNRAS, 382, 139
- Vazquez et al. (1996) Vazquez, R. A., Baume, G., Feinstein, A. & Prado, P. 1996, RMxAC, 4, 131
- Vink et al. (2000) Vink, J. S., de Koter, A., & Lamers, H. J. G. L. M. 2000, A&A, 362, 295
- Vink et al. (2001) Vink, J.-S., de Koter, A. & Lamers, N. 2001, A&A, 369, 574
- ud-Doula & Owocki (2002) ud-Doula, A., & Owocki, S. P. 2002, ApJ, 576, 413
- ud-Doula et al. (2009) ud-Doula, A., Owocki, S. P., & Townsend, R. H. D., 2009, MNRAS, 392, 1022
- Wade et al. (2016) Wade, G. A., Neiner, C., Alecian, E., et al. 2016, MNRAS, 456, 2
- Walborn (1973) Walborn, N. R. 1973, AJ, 78, 1067
- Walborn (2009) Walborn, N. R. 2009, in Massive stars: from Pop III and GRBs to the Milky Way, eds. M. Livio, & E. Villaver, STScI Symp. Ser., 20, 167
- Walborn et al. (2002) Walborn, N., Howarth, I., Lennon, D., et al. 2002, AJ, 123, 2754
- Walborn et al. (2010) Walborn, N. R., Sota, A., Maíz-Apellániz, J., et al. 2010, ApJ, 711, L143
- Wegner (1994) Wegner, W. 1994, MNRAS, 270, 229
- Weidner & Vink (2010) Weidner, C. & Vink, J. S. 2010, A&A, 524, A98
- Wolff et al. (2006) Wolff, S. C., Strom, S. E., Drot, D., et al. 2006, AJ, 132, 749
- von Zeipel (1924) von Zeipel H. 1924, MNRAS, 84, 665
- de Zeeuw et al. (1999) de Zeeuw, P.T., Hoogerwerf, R., de Bruijne, J.H.J., et al. 1999, AJ, 117, 354
Appendix A Stellar masses
Table A.1. provides estimates of current masses, derived for the stars listed in Table 1, applying the classical and spectroscopic HR diagrams built using the Bonn tracks with 300 km s-1 and the current Geneva tracks with rotation.
| Object | ST | Bonn tracks | Geneve tracks | Notes | ||
| M1 | M2 | M1 | M2 | |||
| HD 64568a | O3 V | 68.2 | 82 | 68.0 | 74.8 | |
| HD 46223 | O4 V | 47.0 | 51.8 | 47.3 | 46.5 | |
| HD 93843a | O5 III | 58.8 | 52.8 | 43.6 | 38.9 | SB1? |
| CD 47 4551 | O5 If | 88 (ul) | 53.4 | 66.2 | 34.2 | SB2 |
| HD 93204a | O5.5 V | 48.0 | 41.4 | 39.3 | 38.5 | |
| CPD59 2600a | O6 V | 36.7 | 35.4 | 36.1 | 35.0 | SB1 |
| HD 91572a | O6.5 V | 34.0 | 34.6 | 32.8 | 32.8 | SB1 |
| HD 63005a | O6.5 IV | 38.9 | 42.2 | 34.2 | 34.2 | |
| HD 91824a | O7 V | 35.1 | 36.1 | 33.9 | 34.2 | SB1 |
| CPD58 2620a | O7 V | 28.1 | 32.9 | 27.7 | 31.8 | |
| HD 93222 | O7 V | 33.8 | 33.2 | 32.2 | 31.5 | |
| HD 94963a | O7 II | 35.5 | 49.4 | 30.8 | 32.4 | SB2? |
| HD 94963b | 41.0 | 49.5 | 32.2 | 32.4 | ||
| HD 94370a | O7 | 32.4 | 33.9 | 29.9 | 29.8 | SB2? |
| HD 94370b | 36.2 | 34.1 | 31.0 | 29.9 | ||
| HD 151804 | O8 Iaf | 56.9 | 52.0 | 38.1 | 31.0 | SB2 |
| HD 92504 | O8.5 V | 24.0 | 26.0 | 23.9 | 25.2 | |
| HD 75211 | O8.5 II | 37.3 | 38.0 | 31.8 | 29.1 | SB1 |
| HD 152249 | OC9 Iab | 36.8 | 51.5 | 29.5 | 30.9 | |
| HD 46202 | O9.2 V | 22.0 | 21.9 | 21.8 | 21.6 | |
| CD 44 4865 | O9.7 III | 26.9 | 28.3 | 24.5 | 24.6 | |
| HD 152003 | O9.7 Iab | 39.6 | 49.9 | 30.8 | 30.8 | |
| HD 75222 | O9.7 Iab | 35.4 | 47.4 | 28.6 | 29.5 | SB? |
| HD 75222a | 39.8 | 47.4 | 30.8 | 29.5 | ||
| HD 78344 | O9.7 Iab | 39.8 | 46.7 | 30.8 | 29.4 | |
| HD 169582 | O6 Iaf | 82 (ul) | 58.6 | 48.7 | 40.2 | |
| CD 43 4690 | O6.5 III | 39.9 | 45.3 | 32.1 | 32.4 | |
| HD 97848 | O8 V | 26.5 | 28.9 | 25.8 | 28.0 | |
| HD 69464 | O7 Ib | 48.4 | 49.7 | 36.8 | 32.4 | |
| HD 302505 | O8.5 III | 33.2 | 33.6 | 28.7 | 27.8 | |
| HD 148546 | O9 Iab | 41.4 | 47.5 | 31.1 | 29.8 | |
| HD 76968a | O9.2 Ib | 36.2 | 43.1 | 29.2 | 30.2 | SB1 |
| HD 69106 | O9.7 II | 22.0 | 22.4 | 21.8 | 21.8 | |
Appendix B Individual stars with highly discrepant spectroscopic and evolutionary masses
CP47 4551 (No. 1). In Sect. 4.1 we noted that this star is a SB2, most likely with a colliding wind, and that it also possesses a magnetic field. Given these features, its appearance as a mass outlier is easy to understand.
HD 169582 (No. 2) is an object from the field, and a suspected SB (see Sect. 4.1). Hence, an underestimated luminosity caused by unknown distance and/or an overestimated gravity due to the presence of a companion might both contribute to explain the discordance between its and . For the Geneva tracks, the discrepancy is obviously stronger, but this is to be expected given the comments provided in Sect. 5.3.
HD 148937 (No. 3) is a magnetic star that rotates relatively fast for its luminosity class and the Of?p category it belongs to (Nazé et al. 2010). Additionally, this star exhibits a massive, nitrogen-rich circumstellar nebula, with an expansion age of only 3000 yr (Leitherer & Chavarria 1987), and its (about 100 , see Martins et al. 2012a) appears as too large. To explain these peculiar features, Langer (2012) suggested that HD 148937 might be the product of a very recent stellar merger. Thus, a former binarity could be responsible for this star to appear as a mass outlier in Figs. 8 and 11. In this case then, its overluminosity on the HRD compared to the sHRD might be explained as a consequence of energy released inside the star during the merger event, implying that the star is not yet in its thermal equilibrium state (Glebbeek et al. 2013).
HD 64568 (No. 4). The and values derived by us are consistent with those proposed in the calibrations by Martins et. al. for an early O3 dwarf, whereas its and are significantly higher and smaller, respectively. This could lead to the assumption that an overestimated might be responsible for HD 64568 to display . While such possibility cannot be excluded (see Sect. 4), we note that the location of HD 64568 exactly on the ZAMS (see Fig. 6) is fully consistent with a very young age, as suggested by its morphological Vz designation.
HD 207198 (No. 5) has been analysed in terms of fundamental stellar and wind properties by Repolust et al. (2004) and by Martins (2015). While the derived and agree perfectly, the –estimates are significantly different: 5.05 dex in Martins et al. (which has been used here) and 5.47 dex in Repolust et al. Thus, large uncertainties in this parameter might be resposible for this star to appear as mass outlier in Figs. 8 and 11.
CPD -58 2620 (No. 6). As a member of the Tr 14 cluster , which is known for its anomalous reddening law (see Sect. 2.1), this star might suffer from a highly uncertain luminosity. This possibility might be supported by GAIA measurements, which indicate a distance that is by about a factor of four larger than the photometric distance adopted here. Further considerations, however, revealed that a luminosity larger than that derived and used by us would result in an even stronger mass discrepancy, whereas a lower luminosity would place the star to the left of the ZAMS. On the other hand, an underestimated surface gravity might help to solve the mass problem, which is a possibility that seems to be additionally supported by the fact that CPD -58 2620 appears overluminous in the sHRD, compared to the HRD, independent of the used model grid (see Fig. 8).
Appendix C Rotational mixing