On the calculation of potential of mean force between atomistic nanoparticles
Abstract
We study the potential of mean force (PMF) between atomistic silica and gold nanoparticles in the vacuum by using molecular dynamics simulations. Such an investigation is devised in order to fully characterize the effective interactions between atomistic nanoparticles, a crucial step to describe the PMF in high-density coarse-grained polymer nanocomposites. In our study, we first investigate the behavior of silica nanoparticles, considering cases corresponding to different particle sizes and assessing results against an analytic theory developed by Hamaker for a system of Lennard-Jones interacting particles [H. C. Hamaker, Physica A, 1937, 4, 1058]. Once validated the procedure, we calculate effective interactions between gold nanoparticles, which are considered both bare and coated with polyethylene chains, in order to investigate the effects of the grafting density on the PMF. Upon performing atomistic molecular dynamics simulations, it turns out that silica nanoparticles experience similar interactions regardless of the particle size, the most remarkable difference being a peak in the PMF due to surface interactions, clearly apparent for the larger size. As for bare gold nanoparticles, they are slightly interacting, the strength of the effective force increasing for the coated cases. The profile of the resulting PMF resembles a Lennard-Jones potentials for intermediate , becoming progressively more repulsive for high and low interparticle separations.
I Introduction
The potential of mean force (PMF) is one of the most topical issues when facing the problem of determining the stability of nanoparticle (NP) systems and nanocomposites Akcora et al. (2009); Kawada et al. (2017); Baran and Sokolowski (2017). The possibility to calculate the net interactions between a couple of nanoparticles, hence gaining knowledge on the overall behavior of the system, can open the way to systematic studies of macroscopic properties of potential tecnological interest. This is particularly true for polymer nanocomposites, where the addition of nanoparticles can sensibly improve their physico-chemical properties (see, e.g., Refs. Akcora et al. (2010); Han and Fina (2011); Kim et al. (2012)). For instance, it is now well established that a specific NP dispersion state in a polymer matrix is crucial to improve a given property of the system Borukhov and Leibler (2002); Kumar et al. (2013); the knowledge of such a dispersion state can be gained by means of the PMF between the NPs belonging to the composite. In this context it is worth noting that the study of interactions between nanoparticles dispersed in polymer matrices or in solvents is currently object of rather extensive studies, by means of experimental Chevigny et al. (2011); You et al. (2017), theoretical Martin et al. (2013); Ganesan and Jayaraman (2014) and simulations Meng et al. (2012); Karatrantos et al. (2017) approaches.
As far as theoretical approaches are concerned, they are generally based on the Polymer Reference Interaction Site Model (PRISM) theory developed by Curro and Schweizer in the late ’80s Schweizer and Curro (1987); Curro and Schweizer (1987). This theory has generally provided good results when facing the study of PMF, obaining a good agreement with experimental data (see, e.g. Refs. Hooper et al. (2004); Jayaraman and Schweizer (2009) and Allegra et al. (2008); Ganesan and Jayaraman (2014) for two detailed reviews); however, according to this theory, only generic models can be investigated and the chemical details characterizing a given compound is lost. In order to fully recover its chemical structure, computer-simulations based calculations are needed. Many efforts have been dedicated to shed light on the complex properties of polymers-nanoparticles interface, going from atomistic to mesoscale representations (see, for instance, Refs. Karatrantos et al. (2016); Kumar et al. (2017) for two recent reviews). To quote some examples, previous numerical studies have highlighted the effects of the NP curvature on the behavior of PMF Cerdà et al. (2003), the role played by attractive dispersions interactions between polymer and nanoparticles Smith et al. (2003); Marla and Meredith (2006) and the importance of the ratio between coated and free polymer chain lengths Smith and Bedrov (2009) and of the NP radius Lo Verso et al. (2011).
  
|
In all the above mentioned studies, nanoparticles have been generally represented by means of simple coarse grained models, like bead-spring or pearl-necklace representations; this is an unavoidable choice when tackling the issue of investigating nanoparticles dispersed in polymer matrices. In fact, under such conditions, an atomistic representation should require the calculation of pairwise interactions over hundreds of thousands of atoms for long times, making the calculation practically unaffordable. More details on the chemical structure of the coarse-grained models can be gained by adopting a mean field representation of the non-bonded interactions, hence giving rise to an hybrid particle-field approach Milano and Kawakatsu (2009, 2010). However, the atomistic details of the interactions equally need to be addressed in order to provide the overall behavior of the potential of mean force.
In this work we plan to address this point by calculating the PMF between couples of silica and gold nanoparticles by using atomistic models. In particular, we focus on the nature and a suitable procedure to obtain realistic NP-NP interaction potentials. Our investigation is focused on the effects due to the silica particle size and to the presence (or absence) of polyethylene (PE) chains coated onto the surface of gold nanoparticles. Such models have been chosen in order to consider systems with an increasing degree of complexity, from bare nanoparticles to coated systems with increasing grafting densities. In order to make the calculation affordable, and aiming to clarify the microscopic details of NP-NP interactions, we simulate our systems in the vacuum, i.e. without any surrounding polymer matrix or solvent. The present work is framed in the broader perspective of obtaining atomistic potentials that will be used in subsequent studies concerning high-density coarse-grained polymer nanocomposites. For such an aim, we perform molecular dynamics simulations in the canonical ensemble (NVT) by means of the GROMACS package Hess et al. (2008). As stated in Ref. Meng et al. (2012), when compared to other techniques frequently adopted for calculating the PMF, like the umbrella sampling, this approach shows some advantages: in fact, even if the results obtained by implementing the two techniques are basically the same, NVT simulations allow to gain information also on the net forces experienced by the nanoparticles, and to discriminate between their different contributions. For the case of silica nanoparticles we also compare simulation results with theoretical predictions based on the Hamaker theory Hamaker (1937), specifically developed to deal with spherical systems comprised by several Lennard-Jones interacting particles. Such a comparison is not performed for the gold NPs, due to the presence of coating chains and the non-spherical shape of the particles. In addition, in order to gain further insigth into the local structure of coated PE chains, gyration radii and end-to-end distances have been also computed.
The paper is organized as follow: in the next Section we provide details on models, theory and simulation approaches. In Section III we present and discuss the obtained results, finally drawing the conclusions in the last Section.
II Models and methods
II.1 Silica and gold NPs
| NP | Diameter | Coated | ||||||||
|---|---|---|---|---|---|---|---|---|---|---|
| Silica | 2.5 | No | 1401 | - | - | - | ||||
| Silica | 4.0 | No | 3189 | - | - | - | ||||
| Gold | 1.6 | No | 79 | - | - | - | ||||
| Gold | 1.6 | Yes | 801 | 2.36 | 19 | 38 | ||||
| Gold | 1.6 | Yes | 1143 | 3.48 | 28 | 38 | ||||
| Gold | 1.6 | Yes | 1523 | 4.72 | 38 | 38 |
| Atom | (nm) | (kJ mol | (e) | |||
|---|---|---|---|---|---|---|
| Silica NP | ||||||
| Si | 0.392000 | 2.510400 | 1.020 | |||
| O | 0.315400 | 0.636840 | -0.510 | |||
| H | 0.235200 | 0.092000 | 0.255 | |||
| Gold NP | ||||||
| Au | 0.293373 | 0.163176 | 0.000 | |||
| S | 0.355000 | 1.066000 | -0.180 | |||
| C | 0.350000 | 0.276000 | -0.120 | |||
| H | 0.250000 | 0.138000 | 0.060 |
A representative picture of the nanoparticle models investigated in this work is given in Fig. 1: as visible, different colors label different atom types. As anticipated in the Introduction, we first investigate the behavior of the PMF between a couple of bare spherical silica nanoparticles (Fig. 1, left panel) with diameters of 2.5 and 4 nm; the model for these NPs has been developed by the Müeller-Plathe group and employed for studying the interface between silica nanoparticles and polymer matrices Ndoro et al. (2011); Eslami et al. (2013). Then, we study the behavior of gold NPs (middle panel of Fig. 1): for such an aim we adopt a model already investigated in Refs. Rai et al. (2004); Milano et al. (2011), constituted by a core made of 79 Au atoms organized in a cuboctahedral geometry with a Au-Au bond length of 0.292 nm. Finally, gold NPs are considered coated with a variable number of PE chains, each one containing 38 monomers (right panel of Fig. 1) and connected to the inner part of the NP through one sulfur atom. Following the prescription of Ref. Rai et al. (2004), sulfur atoms are covalently bonded to a gold atom by using a harmonic potential with an Au-S bond length of 0.24 nm (see Tab 3): this method of attachment restricts the position of the S atom to a position directly above the Au atom to which it is attached. Further details on the model parameters can be found in Refs. Rai et al. (2004); Milano et al. (2011).
| Bond | (nm) | kr(kJ mol-1 nm | ||
|---|---|---|---|---|
| Silica NP | ||||
| Si-O | 0.1630 | |||
| O-H | 0.0950 | |||
| Gold NP | ||||
| Au-Au | 0.2920 | 400000 | ||
| Au-S | 0.2400 | 400000 | ||
| C-S | 0.1810 | 400000 | ||
| C-H | 0.1090 | 400000 | ||
| C-C | 0.1552 | 265265 |
The complete collection of the investigated systems is reported in Tab. 1, where is the total number of atoms, the grafting density, the number of coated chains and the number of monomers belonging to a single chain. Tables 2-5 provide a summary of the potential energy parameters. In particular in Tab. 2 we report all the non-bonded interactions, i.e. the interactions between atom pairs whose distance is not fixed by the connectivity. In this Table we have defined:
| (1) |
| (2) |
| (3) |
The first contribution is the standard Lennard-Jones potential, determined by the interaction energy and the close-contact distance . is the Coulombic interaction between two atoms with charges and , being the vacuum permittivity. The third contribution takes into account the effect of a reaction field Tironi et al. (1995) with a dielectric constant and, after the cutoff length , is modeled by using the Kirkwood approximation Kirkwood (1935). In Tab 3 we define the bond stretching potential , dependent on the elastic constant of the material and on the elongation respect to the equilibrium position . Analogous expressions hold for the bond angle potential reported in Tab 4, where and are the angular counterparts of and and is a constant still dependent on the material properties. Finally, parameters of the dihedral angle potentials for the polyethylene chains are reported in Tab 5, and being the analogous of and for dihedral angles, an other material-dependent constant and being the multiplicity of .
| Bond angle | (degrees) | kθ(kJ mol-1 rad | ||
|---|---|---|---|---|
| Silica NP | ||||
| O-Si-O | 109.47 | 469.716 | ||
| Si-O-Si | 144.00 | 209.598 | ||
| Si-O-H | 119.52 | 228.836 | ||
| Gold NP | ||||
| H-C-H | 107.8 | 276.144 | ||
| H-C-C | 110.7 | 292.88 | ||
| C-C-C | 112.7 | 527.184 | ||
| C-C-S | 108.6 | 418.4 | ||
| S-C-H | 113.4 | 292.88 |
| Bond angle | (degrees) | kϕ(kJ mol-1 rad | ||
|---|---|---|---|---|
| Polyethylene | ||||
| H-C-C-C | 60 | 5.86 | ||
| C-C-C-C | 60 | 5.86 | ||
| C-C-C-S | 60 | 5.86 |
II.2 Simulation details
| NP | Diameter | Coated | ||||||||
|---|---|---|---|---|---|---|---|---|---|---|
| Silica | 2.5 | No | - | 2.5 | 8.5 | 31 | ||||
| Silica | 4.0 | No | - | 4.0 | 10 | 36 | ||||
| Gold | 1.6 | No | - | 1.6 | 5.6 | 21 | ||||
| Gold | 1.6 | Yes | 2.36 | 1.6 | 6.6 | 26 | ||||
| Gold | 1.6 | Yes | 3.48 | 1.6 | 7.6 | 31 | ||||
| Gold | 1.6 | Yes | 4.72 | 1.6 | 7.6 | 31 |
In the present work all simulations have been performed by using GROMACS 4.6.3. Hess et al. (2008), employing a cubic simulation box of side nm with periodic boundary conditions. In the case of silica NPs, a time step of 1 fs has been used for all simulations. For the nonbonded interactions, a cutoff of 1.0 nm has been used, while the coulomb long-range electrostatic interactions have been treated by means of a generalized reaction field Tironi et al. (1995) with a dielectric constant and a cutoff of 1.0 nm. For gold NPs we have analogously proceeded, the only differences being the values of cutoff for nonbonded and electrostatic interactions, both fixed to 1.35 nm. Simulation parameters have been fixed by following a similar procedure described in Ref. De Nicola et al. (2017). In all systems the temperature has been kept constant at by using a Berendsen thermostat Berendsen et al. (1984) with a time coupling ps. We have verified that results do not change if the Nose-Hoover thermostat is used after the equilibration in place of the Berendsen one. The temperature has been chosen high enough to allow for a proper relaxation of the considered systems and for the subsequent PMF calculations. The specific value of 590 has been fixed in order to simulate silica nanoparticles in conditions similar to those reported in previous numerical investigations of the same NPs Ndoro et al. (2011); Eslami et al. (2013). With the aim to investigate, for the sake of clarity, silica and gold nanoparticles at the same temperature, we have set for studying gold NPs also. In order to calculate the PMF between the above said nanoparticles, we have preliminarly built a collection of independent initial configurations with particles placed at progressively increasing mutual distances. In the case of gold coated NPs, we have first prepared configurations with the higher grafting density considered in this work (i.e. ) and taken from Ref. Milano et al. (2011): in such configurations, chains are stretched and uniformly distributed over the NP surface. Configurations with lower have been obtained by deleting some chains, in order to get a final equal to 50% () or to 75% () of the fully coated case. All initial systems have been built by using the Packmol program Martinez et al. (2009), which allows one to put the desired number of particles in a given position inside the simulation box avoiding overlaps. Then, we have computed the forces experienced by the nanoparticles, whose centers of mass are kept fixed, finally evaluating the PMF by integrating the obtained forces:
| (4) |
where is the PMF, is the force and and are the maxim and minimum distances between the NPs, respectively. In all simulations corresponds to the NP diameter (see Tab. 1), while indicates a NP-NP distance where the potential can be confidently assumed equal to zero; distances are sampled with a step of 0.2 nm. Values of and , along with the number of points simulated in a single run, are collectively reported in Tab. 6. After a minimization procedure of 15 ps, equilibration runs of 20 ns have been preliminarly produced, then averaging the forces over the next 10 ns. The convergence has been ensured by verifying that the average values of the forces do not change anymore up to the first significant figure. Standard deviations have been calculated in the production run according to the formula:
| (5) |
where and are respectively the instantaneous and the average value of the force experienced by the NPs and is the number of simulation time steps. An analogous procedure has been implemented in order to calculate standard deviations for gyration radii and end-to-end distances. In what follows, if not explicitly reported in the figures, error bars corresponding to standard deviations are smaller than symbol sizes of the corresponding curves.
II.3 Hamaker theory
It is known that for molecules containing a large number of atoms experiencing pair interactions, the evaluation of the overall potential has an high computational cost, since it amounts to calculate a double summation over all the interaction sites. For a couple of NPs, such a summation is written as Everaers and Ejtehadi (2003):
| (6) |
where is the pairwise potential. For particles with simple geometrical shapes and number density of interaction sites, this relation can be generalized to a continuum approximation as:
| (7) |
where is the volume of the NP. For two spheres of radius , volume , placed at a distance and containing particles interacting via a Lennard-Jones potential, eq. 7 can be solved by the Hamaker theory Hamaker (1937). Within this approach, the attractive part of the interaction can be written as:
| (8) | |||||
where is the Hamaker constant and is takes the value , and being the Lennard-Jones parameters and being the density. The repulsive part of the interaction can be written as:
| (9) | |||||
By combining Eqs. 8-9 one can obtain the total interaction. Even if the Hamaker theory strictly holds for spherical particles interacting via a Lennard-Jones potential only, it can provide a useful benchmark against which simulation results can be assessed.
III Results and discussion
III.1 Silica nanoparticles
We first calculate forces and PMF between silica nanoparticles: the absence of coated chains and the contemporary presence of many atoms in a single spherical nanoparticle (see Tab. 1) make these NPs ideal candidates in order to make a comparison with the Hamaker theory. In order to perform the summation of the bead-bead interactions required by the theory, we have employed Lennard-Jones parameters for silicon and oxygen atoms taken from Tab. 2, then using the Lorentz-Berthelot mixing rules. Forces and PMF between a pair of silica nanoparticles with radius 2.5 nm are respectively reported in panels (a) and (b) of Fig. 2, along with the predictions due to the Hamaker theory. A pictorial view of two silica NPs whose mutual distance corresponds to the minimum of the PMF is reported in the snapshot of panel (a). We first note that the force is strongly negative for very short interparticle distances; then, the force shows a steep increase, first attaining positive values and then going to zero for interparticle distances of 1.5 nm. As for the PMF (panel b), we note that simulation results closely match the theoretical datum in providing a Lennard-Jones behavior: in particular the potential shows a well defined minimum of -500 kJ/mol observed for a NP surface-surface distance of 0.3 nm. The attractive well is followed by a quick rise, with the potential going to zero for interparticle separations of 3 nm. The theory slightly anticipates this trend, proving a steeper shape of the potential.


Such a scenario is not significantly changed upon increasing the size of silica nanoparticles: in Fig. 3 we report the same comparison with the NP diameter fixed to 4.0 nm. In a first instance, we note that the minimum deep is less enhanced than the previous case: such a result is apparently counterintuitive, since the increase of the particle size (and of the number of beads) is expected to promote the attraction. But in this case the increase of the particle volume is not fully compensated by the increase of the beads, this circumstance making the silica nanoparticles less dense than before. Therefore, each bead experiments a weaker interaction and the attractive well is less enhanced. In addition, it is worth noting that a repulsive contribution to the total interaction comes from the coulombic potential: due to the presence of hydrogen atoms on the most external shells, two NPs coming in close contact experience a significant electrostatic repulsion. This effect is partially offset by the hydrogen bonds between oxygen and hydrogen atoms belonging to different NPs. However, for interparticle distances higher than 0.3 nm (see Ref. De Nicola et al. (2015)), the hydrogen bond can not take place, this giving rise to the shoulder observed in the PMF. These effects are not observed for smaller silica NPs, since they are given by surface interactions and therefore are unfavoured if the number of atoms lying on the particles surface decreases. By comparing simulation data with the Hamaker theory, we observe that also in this case all essential features of the theoretical predictions (and, in particular, the depth and the position of the attractive well) are nicely catched by simulated PMF, except for the presence of the above said repulsive shoulder. Such an agreement constitutes a further validation of the numerical procedure implemented for calculating the PMF; at the same time, this finding is also indicative of a good trasferibility of the theory, since the latter appears to accurately work regardless of the specific value of the NP size.
III.2 Gold nanoparticles
Once assessed simulation results for silica NPs against Hamaker predictions, we now investigate the behavior of PMF between gold nanoparticles. In this case the comparison with the theory can not be performed due to both the non-spherical shape of the NPs and the presence of coated chains. We first report the behaviors of force and PMF for a pair of bare gold NPs in panels (a) and (b) of Fig. 4, along with a pictorial view of the two NPs. The force appears quite noisy and lies in the range [-10 kJ/mol nm; +20 kJ/mol nm]; hence, it appears that the NPs are rather low interacting, as can be expected given the low number of atoms constituting a single nanoparticle. Moreover, since a large part of such atoms lie on the surface of the NP rather than in the core, the surface effects play a significant role, causing the irregular behavior of the resulting force. By looking at the potential of mean force (panel b) we note that is shows a smoother trend and that it is repulsive in all the interparticle distance range, even if two very shallow minima are observed for NP surfaces placed at 0.53 and 1.90 nm. The overall behavior of the PMF is rather flat, this confirming that the net interaction between the two NPs is low. Hence, in comparison with silica NPs, the emerging picture is quite different, since the strong attraction previously observed for low interparticle distances has now disappeared.


Upon coating the gold nanoparticles with PE chains the behavior of the PMF is expected to be modified, as a consequence of the interactions between chains. In Fig. 5 we report force (panel a) and PMF (panel b) between a pair of gold NPs coated with 19 PE chains, corresponding to a grafting density of : in comparison with the bare case, the force shows now a more regular and smooth behavior, the main feature being the quick fall towards negative values in the range of short interparticle distances. The potential of mean force exhibits a minimum placed at a distance of 0.4 nm and, interestingly, is still negative even if the two nanoparticles surfaces are in close contact. This is likely due to the possibility for the chains to interpenetrate, since the relatively low number (19) of chains coated on a particle leaves enough available space for the chains belonging to the other particle. Such an effect is strongly dependent on the number of chains, i.e. on the grafting density and also on the distance between the nanoparticles. A proper combination of these two parameters gives rise to the minimum observed in the PMF.
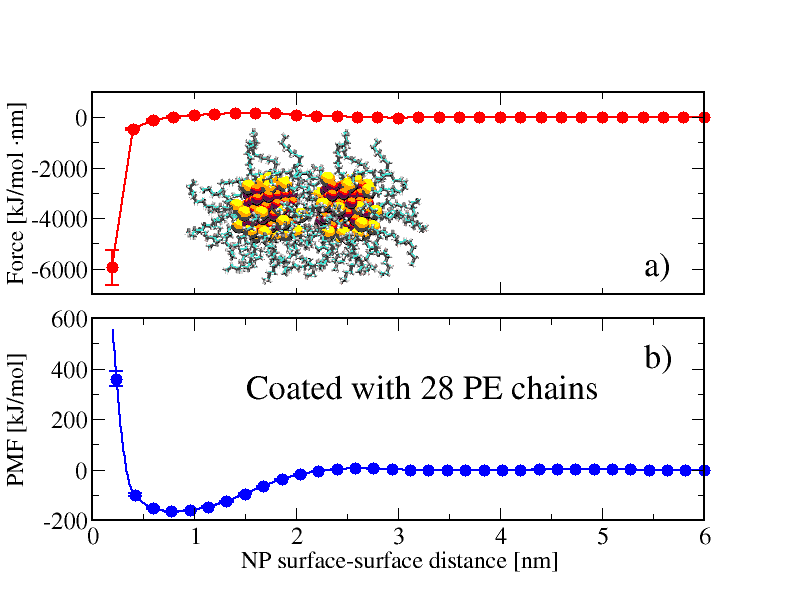
Results for gold nanoparticles coated with 28 PE chains, corresponding to a grafting density of 3.48, are reported in Fig. 6. The force (panel a) is now strongly negative for close-contact configurations, then showing a small and broad shoulder before getting the asymptotic value for interparticle separations of 2 nm. As a consequence, the PMF (panel b) is now significantly repulsive for close-contact configurations and shows a well-defined attractive part with a minimum for interparticle distances of 0.8 nm. The overall behavior of the PMF could resemble to a Lennard-Jones potential, but in the present case the attractive well is quite broad, extending for 1 nm. The emerging picture suggests that with the increase of the grafting density there is also an increase of the repulsion for very short ranges: this is due to the higher number of chains that can not overlap, hence giving rise to repulsive contributions. When the two gold nanoparticles are sligthly more distant, chains have enough space to interpenetrate, thus generating an attractive interaction. Since there is a rather wide range of distances where this interpenetration is possible, the minimum in the PMF appears broad and well-defined.

The case corresponding to the higher grafting density investigated in the present study () is reported in Fig. 7. A comparison with the previous case shows that the force (panel a) is now remarkably more negative for very low interparticle separations; on the other hand, the force attains its asymptotic value for surface distances of nm, as observed for . Overall, the behavior of the force is similar to that previously observed, but for the strength of the force when the two NPs come in close contact. As a consequence, the PMF (panel b) is now much repulsive for low interparticle separations and shows a minimum of -200 kJ/mol placed at a distance of 1.2 nm. Upon comparing this behavior with the cases of lower grafting densities, we note that the close-contact value of the PMF remarkably increases with ; the position of the minimum is also affected by the grafting density, going from 0.4 nm for till to 1.2 nm for . The depth of the minimum is indeed unchanged when going from to . All these features can be explained in terms of chain interpenetration: upon increasing , chains belonging to different NPs are progressively repelled from each other, this giving rise to the increasing repulsion observed in the PMF; on the other hand, there is a preferred NP-NP distance where the chains can be more easily arranged, hence giving rise to a minimum in the PMF, whose position is in turn dependent on .
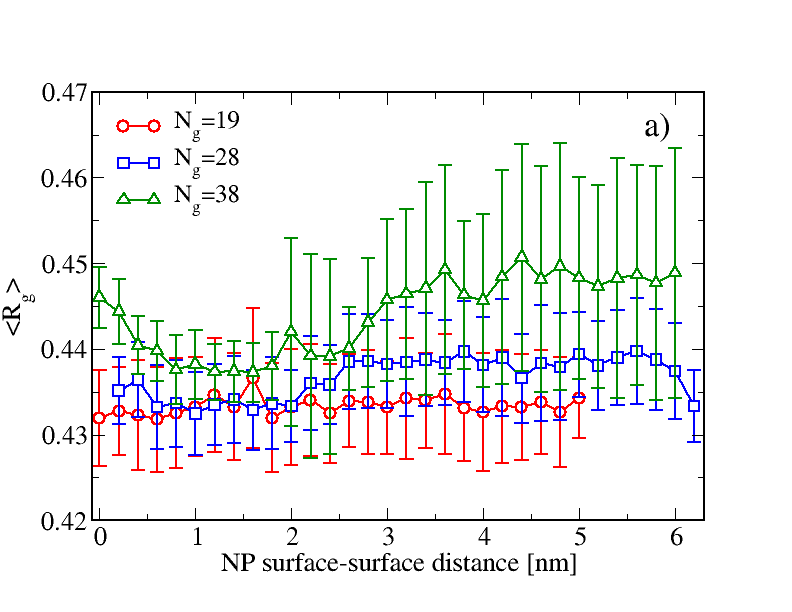
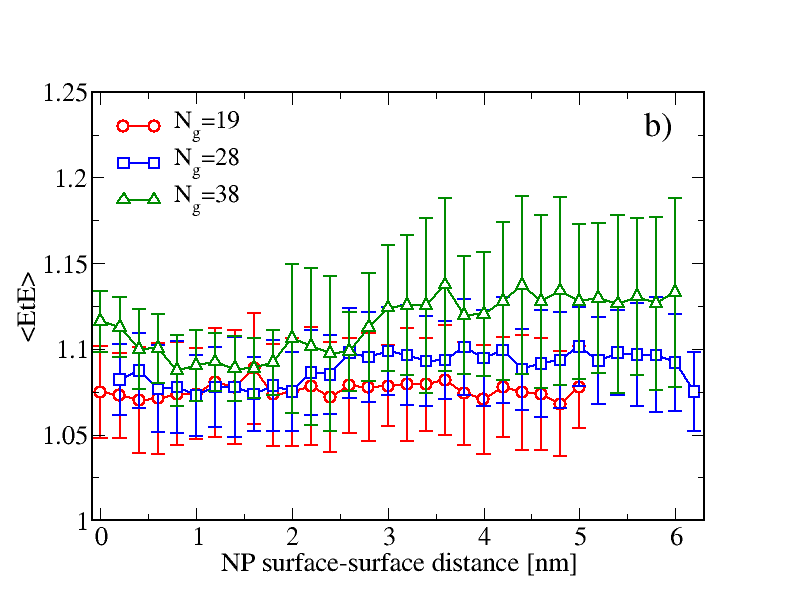
More insight into the extension of PE chains and their dependence on the grafting density can be gained by investigating their local structure. In Fig. 8 we report the average gyration radius (panel a) and the average end-to-end distance (panel b) for all the investigated values of . As a first instance, we note that both and shows a clear dependence on : as visible, upon increasing the number of coating chains, values of and increase in turn, this being particularly apparent for . This finding is a clear indication that for high (and hence for high grafting densities) the chains are more stretched, since the available space is reduced and they are forced to assume elongated configurations. On the other hand, and shows also a slight dependence on the interparticle separation, even if such a dependence is less enhanced than that on : in fact, for and, in particular, for , we note the presence of a shift for a NP-NP distance of nm. In correspondence of this distance, both and jump to higher values, thus signalling a point where the coated chains belonging to a NP stop to be compressed by the chains belonging to the other NP, hence returning to their unperturbed size. By comparing this behavior with the PMF reported in Fig. 6 and Fig. 7, one can note that the shift appears for the same interparticle separation where the PMF vanishes, in agreement with the recovering of the unperturbed state of the chains.
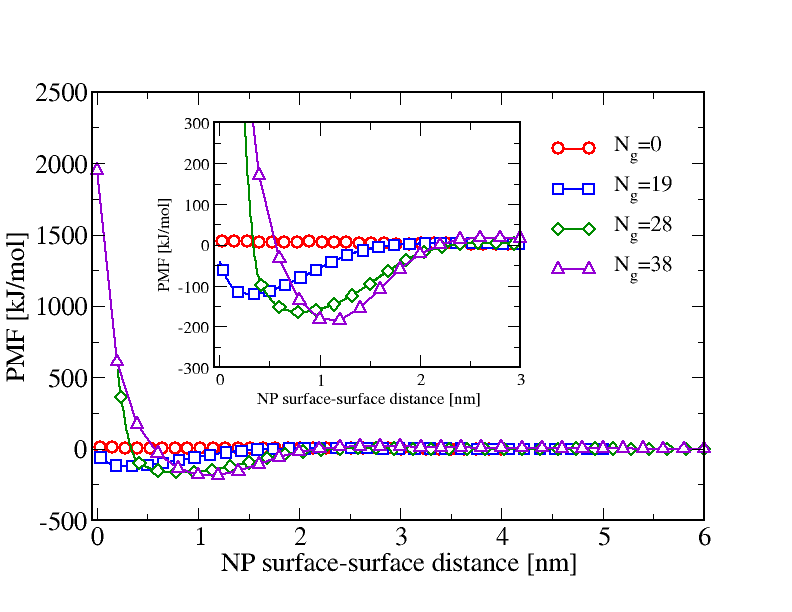
A summarizing comparison between all the PMF calculated for gold NPs is given in Fig. 9: in particular, the increase of the repulsion strength for low interparticle distance is clearly visible. In the inset, the region around PMF minima is magnified: here, the progressive shift of the minimum towards higher values of the interparticle separation is enhanced, in agreement with the increase of and previously discussed.
IV Conclusions
In the present work we have investigated the behavior of the potential of mean force (PMF) between atomistic silica or gold nanoparticles (NPs). By performing GROMACS molecular simulations in the canonical ensemble, we have calculated the net forces between a pair of such particles, hence obtaining the PMF through an integration over their mutual distances. In the case of silica nanoparticles, the effects due to the particle size have been taken into account upon calculating the PMF for particles of 2.5 and 4 nm of diameter. No significant discrepancies between the two cases have been observed, the only remarkable difference being the appearance of a peak in the PMF between the two larger particles. Such an effect is likely due to surface interactions given by the formation and breaking of hydrogen bonds. In addition, we have performed a comparison between simulation data and an analytical theory due to Hamaker and obtained by employing the Lennard-Jones parameters of oxygen and silicon atoms. As a result, a good agreement between theory and simulations has been found, this suggesting that for bare spherical particles made by a large number of atoms the overall behavior of the PMF can be well approximated by means of a combination of site-site Lennard-Jones potentials. We have then investigated the behavior of PMF between gold nanoparticles, which have been considered in a first instance bare and then coated with an increasing number of polyethilene chains; in such a way it is possible to detect the effect of the grafting density on the PMF. We have found that bare gold NPs experience little interactions and surface effects are dominant; upon coating the particles with polyethilene chains, the profile of the PMF is deeply modified, with the appearance of a short-range attraction characterized by a large attractive well. Overall, the resulting PMF appears quite similar to a Lennard-Jones potential, but for the attractive well that appears broader, extending for distances of 1 nm. An high repulsive interaction is detected for low interparticle distances and high grafting densities.
The present work can be considered a preliminary and necessary study suited to fully characterize effective interactions in high-density coarse-grained polymer nanocomposites, where the knowledge of atomistic potentials constitute a crucial issue that need to be properly taken into account. Such studies will constitute the main target of a forthcoming investigation.
V Acknowledgements
The computing resources and the related technical support used for this work have been provided by CRESCO/ENEAGRID High Performance Computing infrastructure and its staff Ponti et al. (2014). CRESCO/ENEAGRID High Performance Computing infrastructure is funded by ENEA, the Italian National Agency for New Technologies, Energy and Sustainable Economic Development and by Italian and European research programmes, see http://www.cresco.enea.it/english for information. G. Munaò and G. Milano acknowledge financial support from the project PRIN-MIUR 2015-2016.
VI Author contribution statement
Giuseppe Milano suggested the research topic and coordinated the preparation of the manuscript. Gianmarco Munaò wrote the paper and performed numerical simulations along with Andrea Correa. Gianmarco Munaò and Antonio Pizzirusso performed the structural analysis. All authors contributed to the critical reading of the manuscript.
References
- Akcora et al. (2009) P. Akcora, H. Liu, S. K. Kumar, J. Moll, Y. Li, B. C. Benicewicz, L. S. Schadler, D. Acechin, A. Z. Panagiotopoulos, V. Pyramitsyn, V. Ganesan, J. Ilavsky, P. Thiyagarajan, R. H. Colby and J. F. Douglas, Nat. Mater., 2009, 8, 354.
- Kawada et al. (2017) S. Kawada, K. Fujimoto, N. Yoshii and S. Okazaki, J. Chem. Phys., 2017, 147, 084903.
- Baran and Sokolowski (2017) L. Baran and S. Sokolowski, J. Chem. Phys., 2017, 147, 044903.
- Akcora et al. (2010) P. Akcora, S. K. Kumar, J. Moll, S. Lewis, L. S. Schadler, Y. Li, B. C. Benicewicz, A. Sandy, S. Narayanan, J. Ilavsky, P. Thiyagarajan, R. H. Colby and J. F. Douglas, Macromolecules, 2010, 43, 1003.
- Han and Fina (2011) Z. Han and A. Fina, Prog. Polym. Sci., 2011, 36, 914.
- Kim et al. (2012) J. Kim, H. Yang and P. F. Green, Langmuir, 2012, 28, 9735.
- Borukhov and Leibler (2002) I. Borukhov and L. Leibler, Macromolecules, 2002, 35, 5171.
- Kumar et al. (2013) S. K. Kumar, N. Jouault, B. Benicewicz and T. Neely, Macromolecules, 2013, 46, 3199.
- Chevigny et al. (2011) C. Chevigny, F. Dalmas, E. Di Cola, D. Gigmes, D. Bertin, F. Boue and J. Jestin, Macromolecules, 2011, 44, 122.
- You et al. (2017) W. You, W. Yu and C. Zhou, Soft Matter, 2017, 13, 4088.
- Martin et al. (2013) T. B. Martin, P. M. Dodd and A. Jayaraman, Phys. Rev. Lett., 2013, 110, 018301.
- Ganesan and Jayaraman (2014) V. Ganesan and A. Jayaraman, Soft Matter, 2014, 10, 13.
- Meng et al. (2012) D. Meng, S. K. Kumar, J. M. D. Lane and G. S. Grest, Soft Matter, 2012, 8, 5002.
- Karatrantos et al. (2017) A. Karatrantos, R. J. Composto, K. I. Winey and N. Clarke, J. Chem. Phys., 2017, 146, 203331.
- Schweizer and Curro (1987) K. S. Schweizer and J. G. Curro, Phys. Rev. Lett., 1987, 58, 246.
- Curro and Schweizer (1987) J. G. Curro and K. S. Schweizer, Macromolecules, 1987, 20, 1928.
- Hooper et al. (2004) J. B. Hooper, K. S. Schweizer, T. G. Desai, R. Koshy and P. Keblinski, J. Chem. Phys., 2004, 121, 6986.
- Jayaraman and Schweizer (2009) A. Jayaraman and K. S. Schweizer, Macromolecules, 2009, 42, 8423.
- Allegra et al. (2008) G. Allegra, G. Raos and M. Vacatello, Prog. Polym. Sci., 2008, 33, 683.
- Ganesan and Jayaraman (2014) V. Ganesan and A. Jayaraman, Soft Matter, 2014, 10, 13.
- Karatrantos et al. (2016) A. Karatrantos, N. Clarke and M. Kröger, Polymer Reviews, 2016, 56, 385.
- Kumar et al. (2017) S. K. Kumar, V. Ganesan and R. A. Riggleman, J. Chem. Phys., 2017, 147, 020901.
- Cerdà et al. (2003) J. J. Cerdà, T. Sintes and R. Toral, Macromolecules, 2003, 36, 1407.
- Smith et al. (2003) J. S. Smith, D. Bedrov and G. D. Smith, Compos. Sci. Technol., 2003, 63, 1599.
- Marla and Meredith (2006) K. T. Marla and J. C. Meredith, J. Chem. Theory Comput., 2006, 2, 1624.
- Smith and Bedrov (2009) G. D. Smith and D. Bedrov, Langmuir, 2009, 25, 11239.
- Lo Verso et al. (2011) F. Lo Verso, L. Yelash, S. A. Egorov and K. Binder, J. Chem. Phys., 2011, 135, 214902.
- Milano and Kawakatsu (2009) G. Milano and T. Kawakatsu, J. Chem. Phys., 2009, 130, 214106.
- Milano and Kawakatsu (2010) G. Milano and T. Kawakatsu, J. Chem. Phys., 2010, 133, 214102.
- Hess et al. (2008) B. Hess, C. Kutzner, D. Van del Spoel and E. Lindahl, J. Chem. Theor. Comput., 2008, 4, 435.
- Hamaker (1937) H. C. Hamaker, Physica, 1937, 4, 1058.
- Ndoro et al. (2011) T. V. M. Ndoro, E. Voyiatzis, A. Ghanbari, D. N. Theodorou, M. C. Böhm and F. Müller-Plathe, Macromolecules, 2011, 44, 2316.
- Eslami et al. (2013) H. Eslami, M. Rahimi and F. Müller-Plathe, Macromolecules, 2013, 46, 8680.
- Rai et al. (2004) B. Rai, P. Sathish, C. P. Malhotra, Pradip and K. G. Ayappa, Langmuir, 2004, 20, 3138.
- Milano et al. (2011) G. Milano, G. Santangelo, F. Ragone, L. Cavallo and A. Di Matteo, J. Phys. Chem. C, 2011, 115, 15154.
- Tironi et al. (1995) I. G. Tironi, R. Sperb, P. E. Smith and W. F. van Gunsteren, J. Chem. Phys., 1995, 102, 5451.
- Kirkwood (1935) J. G. Kirkwood, J. Chem. Phys., 1935, 3, 300.
- De Nicola et al. (2017) A. De Nicola, A. Correa, G. Milano, P. La Manna, P. Musto, G. Mensitieri and G. Scherillo, J. Phys. Chem. B, 2017, 121, 3162.
- Berendsen et al. (1984) H. J. C. Berendsen, J. P. M. Postma, W. F. V. Gunsteren, A. Di Nola and J. R. Haak, J. Chem. Phys., 1984, 81, 3684.
- Martinez et al. (2009) L. Martinez, R. Andrade, E. G. Birgin and J. M. Martinez, J. Comput. Chem., 2009, 30, 2157.
- Everaers and Ejtehadi (2003) R. Everaers and M. R. Ejtehadi, Phys. Rev. E, 2003, 67, 041710.
- De Nicola et al. (2015) A. De Nicola, R. Avolio, F. Della Monica, G. Gentile, M. Cocca, C. Capacchione, M. E. Errico and G. Milano, RSC Advances, 2015, 5, 71336.
- Ponti et al. (2014) G. Ponti et al., Proceedings of the 2014 International Conference on High Performance Computing and Simulation, 2014, 6903807, 1030.