Obscured Star Formation in the Host Galaxies of Superluminous Supernovae
Abstract
We present the results of 3 GHz radio continuum observations of the 8 host galaxies of super-luminous supernovae (SLSNe) at by using the Karl G. Jansky Very Large Array. Four host galaxies are detected significantly, and two of them are found to have high star-formation rates (SFRs 20 yr-1) derived from radio emission, making them the most intensely star-forming host galaxies among SLSN host galaxies. We compare radio SFRs and optical SFRs, and find that three host galaxies have an excess in radio SFRs by a factor of 2, suggesting the existence of dust-obscured star formation, which cannot be traced by optical studies. Two of the three host galaxies, which are located in the galaxy main sequence based on optical SFRs, are found to be above the main sequence based on their radio SFRs. This suggests a higher fraction of starburst galaxies in SLSN hosts than estimated in previous studies. We calculate extinction from the ratio between radio SFRs and dust-uncorrected optical SFRs and find that the hosts are on the trend of increasing extinction with metallicity, which is consistent with the relation in local star-forming galaxies. We also place a constraint on a pulsar-driven SN model, which predicts quasi-steady synchrotron radio emission.
Subject headings:
supernovae: general — galaxies: star formation — radio continuum: galaxies1. Introduction
Superluminous supernovae (SLSNe) are extremely luminous explosions with peak absolute magnitudes of mag, which are 10–100 times brighter than ordinary Type Ia and core-collapse SNe (Gal-Yam, 2012, for a review). They are detected at high redshifts (; Cooke et al., 2012), and therefore can be powerful indicators of environments in the distant universe. SLSNe are classified into two main subclasses depending on the presence of hydrogen signatures in the observed spectra: hydrogen-poor Type I (SLSN-I) and hydrogen-rich Type II (SLSN-II) (Type I-R is hydrogen-poor events whose light curves are consistent with radioactive decay; Gal-Yam, 2012). The physical nature of the progenitor of SLSNe is still a matter of debate, especially for SLSNe-I. SLSNe-II are likely to be explained by a shock between the SN ejecta and surrounding dense hydrogen-rich circumstellar medium (e.g., Woosley et al., 2007; Moriya et al., 2013). On the other hand, several progenitor and explosion models have been proposed for SLSNe-I such as pair-instability SN (e.g., Gal-Yam et al., 2009), SN which produces a large amount of 56Ni (e.g., Moriya et al., 2010), spin-down of a newborn strongly magnetic neutron star (magnetar; e.g., Kasen & Bildsten, 2010; Woosley, 2010), fallback accretion onto a compact remnant (Dexter & Kasen, 2013), and interaction with dense circumstellar medium (e.g., Chevalier & Irwin, 2011; Sorokina et al., 2016).
In order to constrain the progenitor models, it is essential to understand the properties of their host galaxies. Previous studies have shown that SLSN-I hosts are typically dwarf galaxies with low-luminosity, low stellar mass, low star-formation rate (SFR), and high specific SFR (sSFR) compared to local star-forming galaxies and the hosts of core-collapse SNe, while SLSN-II hosts show a wider range than SLSN-I hosts (e.g., Lunnan et al., 2014; Leloudas et al., 2015; Angus et al., 2016; Perley et al., 2016). SLSN hosts have also been compared to those of long-duration gamma-ray bursts (LGRBs), which are thought to be originated from the explosion of massive stars (e.g. Hjorth et al., 2003; Stanek et al., 2003). While Lunnan et al. (2014) and Japelj et al. (2016) suggest that SLSNe-I and LGRB hosts are similar in terms of SFR, stellar mass, and sSFR, Leloudas et al. (2015) and Angus et al. (2016) argue that SLSNe-I hosts have lower stellar mass and SFR.
To understand the environment forming SLSN progenitors, the accurate estimate of star-forming activity is essential. An important factor to be considered is the effect of obscuration by dust. The observations of SLSN hosts have been made exclusively in the optical/near-infrared (NIR) wavelengths, which are subject to dust extinction in contrast to longer wavelengths, and it is possible that we are missing dust-obscured star formation in SLSN hosts. In this respect radio observations are important to probe dust-obscured star formation. Recently, Schulze et al. (2018) searched radio emission for a sample of SLSN hosts from the survey data of Faint Images of the Radio Sky at Twenty-Centimeters (FIRST; Becker et al., 1995) with the Karl G. Jansky Very Large Array (VLA), the NRAO VLA Sky Survey (NVSS; Condon et al., 1998), and the Sydney University Molonglo Sky Survey (SUMSS; Bock et al., 1999). No host is detected in the surveys down to the rms levels of 0.15, 0.45, and 1.3 mJy beam-1, respectively. They also conducted deeper VLA observations of three hosts of SLSNe at –0.3 (MLS121104, SN 2005ap, and SN 2008fz), and obtained upper limits with the rms noise level of 15, 25, and 15 Jy beam-1, respectively. The number of SLSN hosts with deep radio observations is still very limited, and it is essential to study a larger sample.
Radio observations are also useful to constrain progenitor models which predict quiescent radio emission from SLSN remnants on timescales of decades (Murase et al., 2016; Kashiyama & Murase, 2017; Metzger et al., 2017). Based on the pulsar-driven SN model of Murase et al. (2016), Omand et al. (2018) predict quasi-state synchrotron radio emission peaking at years after the SN explosion with the expected radio emission of 5–10 Jy at 1 GHz for some of the known brightest SLSNe-I, which can dominate radio emission from the hosts and is tested with current radio telescopes.
In this paper, we present the results of 3-GHz radio continuum observations of 8 SLSN hosts by using the VLA. Section 2 describes target SLSN hosts, VLA observations, and data reduction. The results are shown in Section 3. In Section 4, we discuss obscured star formation in the hosts and constraint on progenitor models. Conclusions are presented in Section 5. Throughout the paper, we adopt cosmological parameters of km s-1 Mpc-1, , and based on the results of full-mission Planck observations (Planck Collaboration et al., 2016). SFRs and stellar masses are converted to a Chabrier (2003) IMF from a Salpeter (1955) IMF or a Kroupa (2001) IMF by multiplying a factor of 0.61 and 1.1, respectively (e.g., Madau & Dickinson, 2014).
| SLSN | Class | R.A.a | Decl.a | SFR(SED)b | SFR(H | |||
| (J2000) | (J2000) | ( yr-1) | ( yr-1) | () | ||||
| PTF 12dam | I-R | 0.107 | 14:24:46.20 | 46:13:48.3 | ||||
| SN 1999bd | II | 0.151 | 09:30:29.17 | 16:26:07.8 | ||||
| PTF 11rks | I | 0.192 | 01:39:45.53 | 29:55:27.4 | ||||
| PTF 10aagc | I | 0.206 | 09:39:56.92 | 21:43:17.1 | ||||
| SN 2010gx | I | 0.230 | 11:25:46.71 | 08:49:41.4 | ||||
| SN 2008am | II | 0.234 | 12:28:36.30 | 15:34:50.0 | ||||
| PTF 10qaf | II | 0.284 | 23:35:42.89 | 10:46:32.9 | ||||
| PTF 10uhf | I | 0.288 | 16:52:46.70 | 47:36:21.8 | ||||
| a SLSN position used as a phase center of the VLA observations. b Extinction-corrected SFR calculated from UV–optical–NIR SED fit. c Extinction-corrected SFR calculated from H flux. d Stellar mass calculated from UV–optical–NIR SED fit. e Metallicity based on the Pettini & Pagel (2004) O3N2 diagnostic. References for SFR, stellar mass, and metallicity are Perley et al. (2016) for PTF 12dam, PTF 11rks, PTF 10aagc, SN 2010gx, and PTF 10uhf, and Leloudas et al. (2015) for SN 1999bd, SN 2008am, and PTF 10qaf. | ||||||||
2. VLA Observations
2.1. Targets
We concentrate on SLSN hosts which have (i) an accurately determined redshift, and (ii) a measured optical SFR. Targets are selected from comprehensive studies of SLSN hosts in literature (Lunnan et al., 2014; Leloudas et al., 2015; Angus et al., 2016; Perley et al., 2016). From the sample of SLSN hosts, we selected the hosts with SFR 1 yr-1 (and also include the SN 2010gx host which is reported to have one of the highest SFR among the sample of Angus et al., 2016) and at sufficiently low redshifts () to ensure significant constraint on obscured star formation. In oder to avoid the contamination from AGN to radio emission, we exclude SLSN hosts which are known to have possible AGN features. We also confirmed that the targets are not listed in the X-ray source catalog of NASA’s High Energy Astrophysics Science Archive Research Center (HEASARC)111https://heasarc.gsfc.nasa.gov/docs/software.html. The properties of the targets are presented in Table 1.
While Perley et al. (2016) show that PTF 10qaf occurred in a companion galaxy (SFR yr-1) away from a nearby spiral galaxy at the same redshift, the galaxy pair is studied by Leloudas et al. (2015) as a single object with SFR yr-1. The VLA beamsize of our observations () does not resolve the galaxy pair and we treat them as a single system.
Some of the hosts have higher SFRs derived from SED fit than those derived from H flux, suggesting that the Balmer decrement underestimates the extinction compared to that estimated from the SED fit. Hereafter we use SFR(SED) of Perley et al. (2016) if available, otherwise we use SFR(H) of Leloudas et al. (2015) presented in Table 1. We note that the derivation methods of SFRs could have systematic uncertainties. The method of SED fit has systematic uncertainties due to assumptions such as extinction, star formation history, and initial mass function (Perley et al., 2013).
2.2. Observations and Data Reduction
The VLA S-band 3-GHz (13-cm) observations (Project ID: 17A-140) were performed on May 28 and 29, 2017 (5–8 years after the maximum date of the SLSNe) using 27 antennas in the C array configuration. The baseline length ranges from 44.8 m to 3.4 km. The WIDAR correlator was used with 8-bit samplers. We use two basebands with 1 GHz bandwidth centered at 2.5 GHz and 3.5 GHz, which provides a total bandwidth of 2 GHz. The field-of-view is (full width at half power). The positions of the SNe are used as phase centers. Bandpass and amplitude calibrations were done with 3C286 or 3C48, and phase calibrations were done with nearby quasars. The total observing time of each target is 1.5 hours.
The data were reduced with Common Astronomy Software Applications (CASA; McMullin et al., 2007) release 4.7.2.
About 10%–25% of the data were flagged by the pipeline processing.
The maps were produced with the task clean } down o
a threshold of twice the rms noise level measured in a source-free region in the dirty map
with the parameters ell } of 1 arsec,
ridder } of standard, {\verb specmode } of multi-frequency synthesis, and {\verb nterms } of 2.
The Bri
gs weighting with obust } 0.5 is adopted. Theesultant synthesized beamsize is – (Table 2). The absolute flux accuracy is estimated by comparing the measured flux density of the amplitude calibrators and the flux density scale of Perley & Butler (2017), and the difference is found to be 5%. The typical rms noise level of the maps is 4–7 Jy beam-1, which is estimated by fitting the pixel–flux histogram of the map with a Gaussian. The local rms noise levels around the hosts are estimated with the BANE program (Hancock et al., 2012), which performs clipping in the map and calculate the standard deviation on a sparse grid of pixels and then interpolate to make a noise image. The local rms noise levels are 5–13 Jy beam-1. The difference in the rms noise levels measured in the two ways is less than twice the rms value estimated by fitting the pixel–flux histogram, which can be explained by a map fluctuation. We adopt the local rms noise levels for deriving physical quantities of the hosts. When a source is spatially resolved by the synthesized beam, we measure an integrated flux density by using the
mft task, otherwise we adopt a peak intensity.


3. Results
We detected radio emission in four SLSN hosts (PTF 12dam, SN 1999bd, PTF 10qaf, PTF 10uhf) with a peak signal-to-noise ratio (S/N) above 5. The radio continuum images are shown in Figure 1. The hosts of PTF 10qaf and PTF 10uhf are spatially resolved with the synthesized beam, while the other hosts are only marginally resolved or not resolved.
Figure 2 shows the radio contours overlaid on the optical/NIR images for the radio-detected hosts. The radio emission in the hosts of SN 1999bd, PTF 10qaf, and PTF 10uhf is dominated by the galaxy center rather than the SN positions a few arcsec away from the center. The radio emission in the PTF 10uhf host is elongated toward the northwest of the galaxy. This can be caused by a faint companion galaxy northwest of the primary nucleus, where Perley et al. (2016) suggests a merger of a massive spiral galaxy with a less massive disk galaxy. While the peak radio position of the SN 1999bd host appears to be associated with a faint object south of the SN position, we use the whole radio emission for the flux density of the SN 1999bd host system by considering the spatial resolution of the radio observations.
The host of SN 2008am is only tentatively detected (S/N = 2.6) and the hosts of PTF 11rks, PTF 10aagc, and SN 2010gx are not detected. We derived 3 upper limits on SFRs for those hosts in the subsequent section.
The radio-detected hosts lie at the location of star-forming galaxies in the BPT diagram (Leloudas et al., 2015; Perley et al., 2016) and are not listed in the X-ray catalog, suggesting that the radio emission is primarily powered by star formation. Although there could be a Compton-thick AGN, it is difficult to further investigate it with existing data sets. In this paper we assume that the radio emission is dominated by star-forming activity. SFRs based on the radio emission are derived by using the equation of Murphy et al. (2011) for 1.4-GHz flux densities, which is used in previous studies of LGRB host galaxies (e.g., Perley & Perley, 2013; Perley et al., 2015; Greiner et al., 2016). Greiner et al. (2016) extrapolate flux densities from the rest-frame frequency to 1.4 GHz and provide the equation of radio-derived SFRs as
| (1) |
where is the observed flux density in , is the observing frequency in GHz, is the synchrotron spectral index, and is the luminosity distance in Gpc. The synchrotron spectral index is known to lie between around and (e.g., Gioia et al., 1982; Duric et al., 1988; Condon, 1992; Niklas et al., 1997; Tabatabaei et al., 2017), and we adopt following previous studies of LGRB hosts (Perley & Perley, 2013; Perley et al., 2015; Greiner et al., 2016). The derived SFRs and sSFRs are shown in Table 2. Note that SFRs would change by a factor of 1.4 and 0.7 if we assume of and , respectively. The hosts of PTF 10qaf and PTF 10uhf have high SFRs ( yr-1), making them the most intensely star-forming hosts among SLSN hosts.
4. Discussions
4.1. Obscured Star Formation
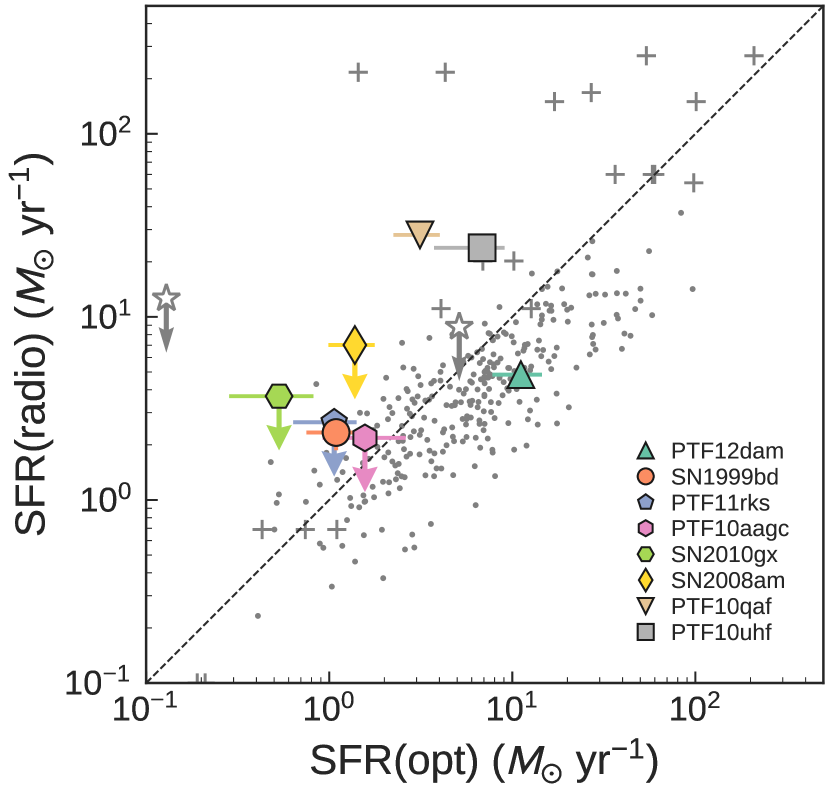
We compare the SFRs of the SLSN hosts derived from the radio observations and optical observations (corrected for extinction) in Figure 3. The hosts of SN 1999bd, PTF 10qaf, and PTF 10uhf have an excess of the radio-derived SFR over optically-derived SFR by a factor of 2–9, suggesting that there exists obscured star formation which cannot be traced by the previous optical/NIR studies. The hosts of PTF 10qaf and PTF 10uhf are likely to be interacting (Perley et al., 2016; Cikota et al., 2017), which could induce dusty star formation. The cause of the radio excess for the SN 1999bd host may also be due to an interaction, which appears in the optical image, or a contamination from a nearby source to the radio emission. Although the sample size is limited, we do not find differences in obscured star formation between the hosts of SLSN-I and SLSN-II. We also compare with the hosts of LGRBs with radio observations (Stanway et al., 2010, 2014, 2015; Hatsukade et al., 2012; Michałowski et al., 2012, 2015; Perley & Perley, 2013; Perley et al., 2015, 2017; Greiner et al., 2016). The majority of LGRB hosts are not detected in the radio (not plotted in Figure 3) and have less dust-obscured SFR (Greiner et al., 2016), although several LGRB hosts (out of about 60 hosts) have an excess of radio SFR. In order to study whether or not SLSN hosts with significant dust-obscured star formation are rare exceptions as in LGRB hosts, a larger sample is needed.
Assuming that the radio emission traces the total star-forming activity in the hosts, we calculate the extinction at H wavelength from the ratio between the radio SFRs and dust-uncorrected SFRs derived from H flux as
| (2) |
We plot the extinction as a function of metallicity in Figure 4, and find a trend of increasing extinction with increasing metallicity. Lower-metallicity galaxies are expected to have a smaller amount of dust, and the correlation has been reported for star-forming galaxies (e.g., Garn & Best, 2010), and in a recent study by Klein et al. (2017) based on radio continuum observations. While the tendency seen in the SLSN hosts are consistent with star-forming galaxies, the PTF 10qaf host has a higher extinction compared to the sample of Sloan Digital Sky Survey galaxies in Garn & Best (2010), suggesting that it has highly obscured star formation. This may be due to interaction suggested from optical observations (Perley et al., 2016).
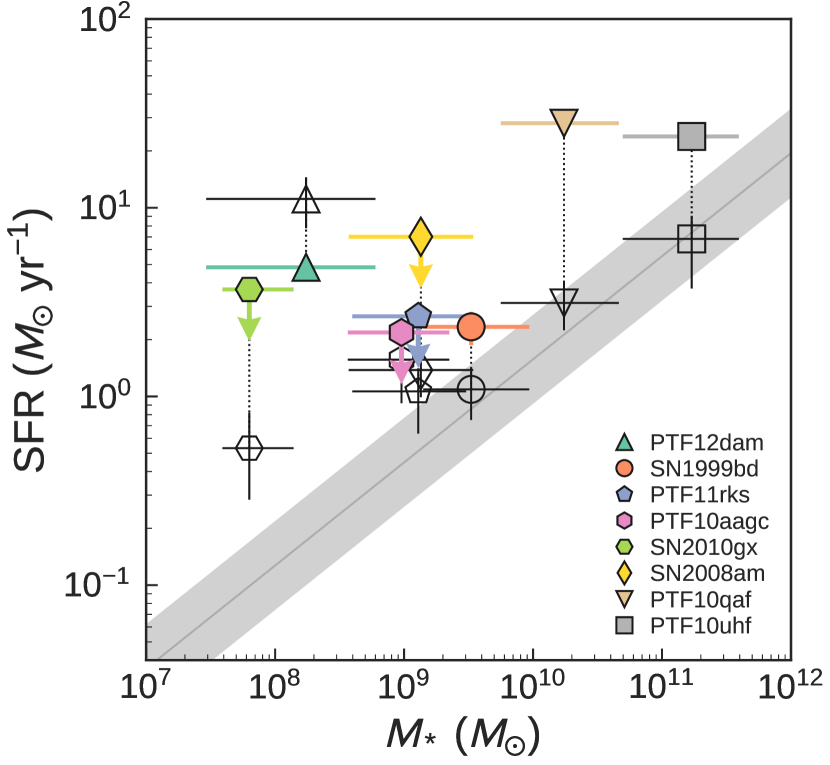
Figure 5 compares the stellar mass and SFRs for the SLSN hosts. It is known that star-forming galaxies follow a tight correlation between stellar mass and SFR, referred to as galaxy main sequence. Although the hosts of SN 1999bd, PTF 10qaf, and PTF 10uhf are located within the range of the main sequence based on the previous optical observations, the radio observations find that they are above the main sequence, suggesting that they have a starburst nature (e.g., Rodighiero et al., 2011; Elbaz et al., 2011). The hosts of PTF 12dam and PTF 10qaf have sSFR yr-1, which are higher among SLSN hosts (Leloudas et al., 2015; Perley et al., 2016) 222 Note that the effect of dust attenuation on stellar mass derived from SED fitting is in general small even for dusty galaxies (0.2 dex on average; Michałowski et al., 2014), and our result does not change significantly even if we adopt the attenuation estimated from the ratio between SFR(radio) and SFR(H). . Perley et al. (2016) found a higher fraction of starbursts in their SLSN host sample (3–6 SLSN-I hosts out of 18 and 0–2 SLSN II hosts out of 13) with sSFR yr-1 compared to a local comparison sample. Our finding of high sSFR hosts based on radio observations supports the higher starburst fraction in SLSN hosts.
| SLSN | Beamsize | Local RMS | S/Npeak | Flux Density | SFR(radio) | sSFRa | |
| (′′) | (Jy beam-1) | (Jy) | ( yr-1) | (yr-1) | (mag) | ||
| PTF 12dam | 5.1 | 27.7 | |||||
| SN 1999bd | 6.5 | 5.0 | |||||
| PTF 11rks | 7.3 | - | 22.0 | 2.7 | 2.4 | ||
| PTF 10aag | 5.2 | - | 15.6 | 2.2 | 2.0 | ||
| SN 2010gx | 6.9 | - | 20.7 | 3.7 | 2.8 | ||
| SN 2008am | 12.6 | - | 37.9 | 7.0 | 2.6 | ||
| PTF 10qaf | 8.3 | 8.5 | |||||
| PTF 10uhf | 5.6 | 10.5 | |||||
| Limits are 3. a Specific SFR based on SFR(radio). b Extinction at H wavelength derived from the ratio between SFR(radio) and SFR(H. | |||||||

4.2. Constraint on Pulsar-driven SLSN Model
Finally, we discuss the constraint on a theoretical model of SLSNe. Murase et al. (2016) show in their model that pulsar-driven SN remnants cause quasi-steady synchrotron radio emission associated with non-thermal electron-positron pairs in nascent pulsar wind nebulae (PWNe) on a timescale of decades, which may be bright enough to be detected with current radio telescopes. Based on the model of Murase et al. (2016) and Kashiyama & Murase (2017), Omand et al. (2018) fit the pulsar-driven SN model to the light curves of six known brightest SLSNe-I including one of our targets, SN 2010gx, and calculated radio emission with the obtained parameters of initial spin period, magnetic field strength, and ejecta mass. They calculated radio light curves at 1 GHz and 100 GHz in two cases: with maximum absorption and with no absorption processes in the PWN and SN ejecta. The radio emission can be absorbed in the PWN and the SN ejecta, but the system can be transparent at 10 years. The model shows that the radio emission increases with time, reaches its peak at 10–30 years after the explosion, and then decreases. The predicted radio emission of SN 2010gx for the case of no absorption processes is 60 Jy at 3 GHz at the time of our radio observations (seven years after the SN explosion) if we simply assume a synchrotron self-absorption spectral index of 2.5. This is higher than our 3 upper limit of 21 Jy, suggesting that the model with no absorption processes is inconsistent with our observations. For the case of maximum absorption, the predicted flux density is well below our detection limit and it is not possible to make a conclusion. Follow-up observations and long-term monitoring (10 years) are important to constrain the radio light curves and progenitor models with different parameters.
5. Conclusions
We performed VLA 3-GHz observations of the hosts galaxies of 8 SLSNe (), and detected four SLSN hosts (PTF 12dam, SN 1999bd, PTF 10qaf, PTF 10uhf). We derived SFRs from the radio emission, and found that the hosts of PTF 10qaf and PTF 10uhf have high SFRs ( yr-1), making them the most intensely star-forming galaxies among SLSN hosts. Comparison between radio SFRs and optical SFRs shows that the hosts of SN 1999bd, PTF 10qaf, and PTF 10uhf have an excess of radio SFRs over optical SFRs by a factor of 2, suggesting that obscured star formation exist in the hosts which cannot be traced by the previous optical studies. We found that they are above the galaxy main sequence, suggesting a starburst nature. This suggests a higher fraction of starburst galaxies in SLSN hosts than estimated in previous studies. We calculated the extinction at H wavelength from the ratio between radio SFRs and dust-uncorrected H SFRs. The SLSN hosts are on the trend of increasing extinction with metallicity, which is seen in local star-forming galaxies. The PTF 10qaf host has a higher extinction compared to the sample of star-forming galaxies, suggesting that it has highly obscured star formation. Because the sample in this study is still limited, it is important to increase the sample size covering a wider range of SFR and stellar mass in order to understand the general properties of SLSN hosts,
Our radio observations also place a constraint on a pulsar-driven SN model which predicts quasi-steady radio emission. We found that our radio 3 upper limit on the SN 2010gx host is inconsistent with the model of Omand et al. (2018) in the case of no absorption processes by assuming a synchrotron self-absorption spectral index of 2.5. Because the radio emission is predicted to reach its peak at around 10 years after the explosion, long-term follow-up observations are important to constrain the model with different parameters.
References
- Angus et al. (2016) Angus, C. R., Levan, A. J., Perley, D. A., et al. 2016, MNRAS, 458, 84
- Becker et al. (1995) Becker, R. H., White, R. L., & Helfand, D. J. 1995, ApJ, 450, 559
- Bock et al. (1999) Bock, D. C.-J., Large, M. I., & Sadler, E. M. 1999, AJ, 117, 1578
- Calzetti et al. (2000) Calzetti, D., Armus, L., Bohlin, R. C., et al. 2000, ApJ, 533, 682
- Chabrier (2003) Chabrier, G. 2003, PASP, 115, 763
- Chevalier & Irwin (2011) Chevalier, R. A., & Irwin, C. M. 2011, ApJ, 729, L6
- Cikota et al. (2017) Cikota, A., De Cia, A., Schulze, S., et al. 2017, MNRAS, 469, 4705
- Condon et al. (1998) Condon, J. J., Cotton, W. D., Greisen, E. W., et al. 1998, AJ, 115, 1693
- Condon (1992) Condon, J. J. 1992, ARA&A, 30, 575
- Cooke et al. (2012) Cooke, J., Sullivan, M., Gal-Yam, A., et al. 2012, Nature, 491, 228
- Dexter & Kasen (2013) Dexter, J., & Kasen, D. 2013, ApJ, 772, 30
- Duric et al. (1988) Duric, N., Bourneuf, E., & Gregory, P. C. 1988, AJ, 96, 81
- Elbaz et al. (2011) Elbaz, D., Dickinson, M., Hwang, H. S., et al. 2011, A&A, 533, A119
- Gal-Yam (2012) Gal-Yam, A. 2012, Science, 337, 927
- Gal-Yam et al. (2009) Gal-Yam, A., Mazzali, P., Ofek, E. O., et al. 2009, Nature, 462, 624
- Garn & Best (2010) Garn, T., & Best, P. N. 2010, MNRAS, 409, 421
- Gioia et al. (1982) Gioia, I. M., Gregorini, L., & Klein, U. 1982, A&A, 116, 164
- Greiner et al. (2016) Greiner, J., Michałowski, M. J., Klose, S., et al. 2016, A&A, 593, A17
- Hancock et al. (2012) Hancock, P. J., Murphy, T., Gaensler, B. M., Hopkins, A., & Curran, J. R. 2012, MNRAS, 422, 1812
- Hatsukade et al. (2012) Hatsukade, B., Hashimoto, T., Ohta, K., et al. 2012, ApJ, 748, 108
- Hjorth et al. (2003) Hjorth, J., et al. 2003, Nature, 423, 847
- Japelj et al. (2016) Japelj, J., Vergani, S. D., Salvaterra, R., Hunt, L. K., & Mannucci, F. 2016, A&A, 593, A115
- Kasen & Bildsten (2010) Kasen, D., & Bildsten, L. 2010, ApJ, 717, 245
- Kashiyama & Murase (2017) Kashiyama, K., & Murase, K. 2017, ApJ, 839, L3
- Kennicutt (1998) Kennicutt, R. C., Jr. 1998, ApJ, 498, 541
- Klein et al. (2017) Klein, U., Lisenfeld, U., & Verley, S. 2017, arXiv:1710.03149
- Kroupa (2001) Kroupa, P. 2001, MNRAS, 322, 231
- Leloudas et al. (2015) Leloudas, G., Schulze, S., Krühler, T., et al. 2015, MNRAS, 449, 917
- Lunnan et al. (2014) Lunnan, R., Chornock, R., Berger, E., et al. 2014, ApJ, 787, 138
- Madau & Dickinson (2014) Madau, P., & Dickinson, M. 2014, ARA&A, 52, 415
- McMullin et al. (2007) McMullin, J. P., Waters, B., Schiebel, D., Young, W., & Golap, K. 2007, Astronomical Data Analysis Software and Systems XVI, 376, 127
- Metzger et al. (2017) Metzger, B. D., Berger, E., & Margalit, B. 2017, ApJ, 841, 14
- Michałowski et al. (2014) Michałowski, M. J., Hayward, C. C., Dunlop, J. S., et al. 2014, A&A, 571, A75
- Michałowski et al. (2012) Michałowski, M. J., Kamble, A., Hjorth, J., et al. 2012, ApJ, 755, 85
- Michałowski et al. (2015) Michałowski, M. J., Gentile, G., Hjorth, J., et al. 2015, A&A, 582, A78
- Moriya et al. (2010) Moriya, T., Tominaga, N., Tanaka, M., Maeda, K., & Nomoto, K. 2010, ApJ, 717, L83
- Moriya et al. (2013) Moriya, T. J., Blinnikov, S. I., Tominaga, N., et al. 2013, MNRAS, 428, 1020
- Murase et al. (2016) Murase, K., Kashiyama, K., & Mészáros, P. 2016, MNRAS, 461, 1498
- Murphy et al. (2011) Murphy, E. J., Condon, J. J., Schinnerer, E., et al. 2011, ApJ, 737, 67
- Niklas et al. (1997) Niklas, S., Klein, U., & Wielebinski, R. 1997, A&A, 322, 19
- Omand et al. (2018) Omand, C. M. B., Kashiyama, K., & Murase, K. 2018, MNRAS, 474, 573
- Perley & Perley (2013) Perley, D. A., & Perley, R. A. 2013, ApJ, 778, 172
- Perley et al. (2013) Perley, D. A., Levan, A. J., Tanvir, N. R., et al. 2013, ApJ, 778, 128
- Perley et al. (2015) Perley, D. A., Perley, R. A., Hjorth, J., et al. 2015, ApJ, 801, 102
- Perley et al. (2016) Perley, D. A., Quimby, R. M., Yan, L., et al. 2016, ApJ, 830, 13
- Perley & Butler (2017) Perley, R. A., & Butler, B. J. 2017, ApJS, 230, 7
- Planck Collaboration et al. (2016) Planck Collaboration, Ade, P. A. R., Aghanim, N., et al. 2016, A&A, 594, A13
- Perley et al. (2017) Perley, D. A., Hjorth, J., Tanvir, N. R., & Perley, R. A. 2017, MNRAS, 465, 970
- Pettini & Pagel (2004) Pettini, M., & Pagel, B. E. J. 2004, MNRAS, 348, L59
- Rodighiero et al. (2011) Rodighiero, G., Daddi, E., Baronchelli, I., et al. 2011, ApJ, 739, L40
- Salpeter (1955) Salpeter, E. E. 1955, ApJ, 121, 161
- Schulze et al. (2018) Schulze, S., Krühler, T., Leloudas, G., et al. 2018, MNRAS, 473, 1258
- Smolčić et al. (2017a) Smolčić, V., Delvecchio, I., Zamorani, G., et al. 2017a, A&A, 602, A2
- Smolčić et al. (2017b) Smolčić, V., Novak, M., Bondi, M., et al. 2017b, A&A, 602, A1
- Sorokina et al. (2016) Sorokina, E., Blinnikov, S., Nomoto, K., Quimby, R., & Tolstov, A. 2016, ApJ, 829, 17
- Speagle et al. (2014) Speagle, J. S., Steinhardt, C. L., Capak, P. L., & Silverman, J. D. 2014, ApJS, 214, 15
- Stanek et al. (2003) Stanek, K. Z., et al. 2003, ApJ, 591, L17
- Stanway et al. (2010) Stanway, E. R., Davies, L. J. M., & Levan, A. J. 2010, MNRAS, 409, L74
- Stanway et al. (2014) Stanway, E. R., Levan, A. J., & Davies, L. J. M. 2014, MNRAS, 444, 2133
- Stanway et al. (2015) Stanway, E. R., Levan, A. J., Tanvir, N., et al. 2015, MNRAS, 446, 3911
- Tabatabaei et al. (2017) Tabatabaei, F. S., Schinnerer, E., Krause, M., et al. 2017, ApJ, 836, 185
- Woosley (2010) Woosley, S. E. 2010, ApJ, 719, L204
- Woosley et al. (2007) Woosley, S. E., Blinnikov, S., & Heger, A. 2007, Nature, 450, 390