Graphene mechanical pixels for Interferometric MOdulator Displays (GIMOD)
Abstract
Graphene, the carbon monolayer and 2D allotrope of graphite, has the potential to impact technology with a wide range of applications such as optical modulators for high-speed communications [1, 4, 2, 3]. In contrast to modulation devices that rely on plasmonic or electronic effects, MEMS-based modulators can have wider tuning ranges albeit at a lower operating frequency. These properties make electro-optic mechanical modulators ideal for reflective-type display technologies as has been demonstrated previously with SiN membranes in Interferometric MOdulator Displays (IMODs) [5]. Despite their low-power consumption and performance in bright environments, IMODs suffer from low frame rates and limited color gamut. Double-layer graphene (DLG) membranes grown by chemical vapor deposition (CVD) can also recreate the interference effect like in IMODs as proven with drumheads displaying Newton’s rings [6]. Here, we report on the electro-optical response of CVD DLG mechanical pixels by measuring the change in wavelength-dependent reflectance of a suspended graphene drumhead as a function of electrical gating. We use a spectrometer to measure the wavelength spectrum at different voltages, and find a good agreement with a model based on light interference. Moreover, to verify that gas compression effects do not play an important role, we use a stroboscopic illumination technique to study the electro-optic response of these graphene pixels at frequencies up to 400 Hz. Based on these findings, we demonstrate a continuous full-spectrum reflective-type pixel technology with a Graphene Interferometric MOdulator Display (GIMOD) prototype of 2500 pixels per inch (ppi) equivalent to more than 12K resolution.
Advanced Microelectronic Center Aachen (AMICA), AMO GmbH, Otto-Blumenthal-Str. 25, 52074 Aachen, Germany
Kavli Institute of Nanoscience, Delft University of Technology, Lorentzweg 1, 2628CJ, Delft, The Netherlands
Graphenea SA, 20018 Donostia-San Sebastián, Spain
∗Corresponding authors: cartamil@amo.de., Houri.Samer@lab.ntt.co.jp.
Keywords: CVD graphene, electro-optic modulators, MEMS, display, GIMOD
Circular cavities are etched through thermally-grown SiO2 layers (300 to 1180 nm in depth depending on the sample) on silicon substrates by means of reactive-ion etching. DLG layers, fabricated by stacking two CVD single-layer graphene (SLG) layers, are transferred onto the patterned substrate using a semi-dry transfer technique. This results in an optical cavity with a movable absorbing membrane made out of CVD DLG (Figure 1a), and a fixed mirror formed by the underlying silicon surface. The silicon substrate also plays the role of back electrode for electrostatic actuation. We use DLG membranes because of their higher yield [7] and their larger absorption in the visible spectrum than that of SLG.
The colorimetry setup used in this work consists of an optical microscope with Köhler illumination, a 20 apochromatic objective lens, and a halogen lamp as a multi-wavelength light source. Light reflected from the sample is split and guided both towards a calibrated consumer camera and a spectrometer. The spectrometer is configured to collect only the light from a circular area with the same size as the studied drums (see Methods and Supplementary Information Section 1). A series of color filters with wavelengths ranging from 450 nm to 650 nm (bandpass linewidth of 5-10 nm) are mounted on a motorized computer-controlled wheel, and placed in front of the camera imager as shown schematically in Figure 1b.
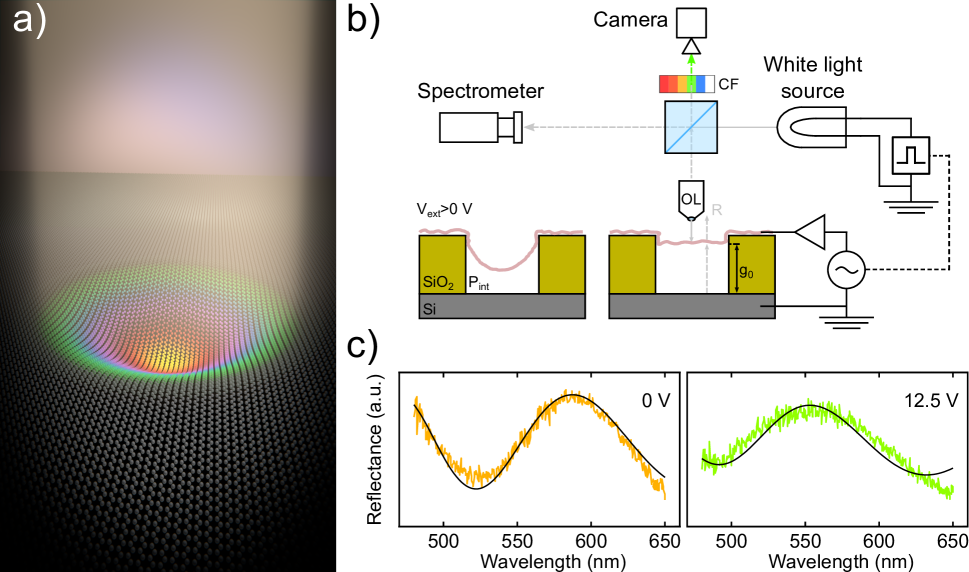
Electrostatic actuation of the graphene drums is achieved by using a computer controlled DC source connected to the suspended graphene electrode, while keeping the silicon substrate grounded. For these measurements a sample with 1180 nm oxide thickness was chosen. The capacitance of the graphene/SiO2/Si structure (area of 1 cm2) was measured to be 0.6 nF. Figure 1c shows the shift in the spectrum upon the application of a voltage. As the voltage is ramped up (see Methods), the overall color of the drumhead changes, going from orange ( nm) at 0 V to green ( nm at 12.5 V and nm at 20 V).
The spectral response of the graphene drums allows us to extract the deflection of the drum, which can be used to relate the electromechanical and optomechanical performance of the pixel. By applying a force equilibrium condition between the electrostatic force, the linear elastic force (stiffness ), the cubic elastic force (stiffness ) and the hydrostatic force due to the pressure of trapped gas inside the cavity, we develop a 1-degree-of-freedom graphene membrane electromechanical model where the bending rigidity is neglected (detailed mathematical derivations in Supplementary Information Sections 2-4). Then, we introduce the optical reflectance [8] by considering the suspended drum as an absorbing layer placed in front of the silicon back mirror while neglecting optical cavity effects. We average the reflectance over the entire drum to obtain the response as perceived by the spectrometer (Supplementary Information Section 5). This ”drum reflectance” can be expressed only in terms of the center deflection as
| (1) |
where is the wavelength, and are wavelength dependent constants, is a phase shift induced by the optical travel path and by the graphene, with being the normalized deflection at the center of the drum (i.e. ) and , the cavity depth. This model is applied to our devices and shown in Figure 1c (solid lines).
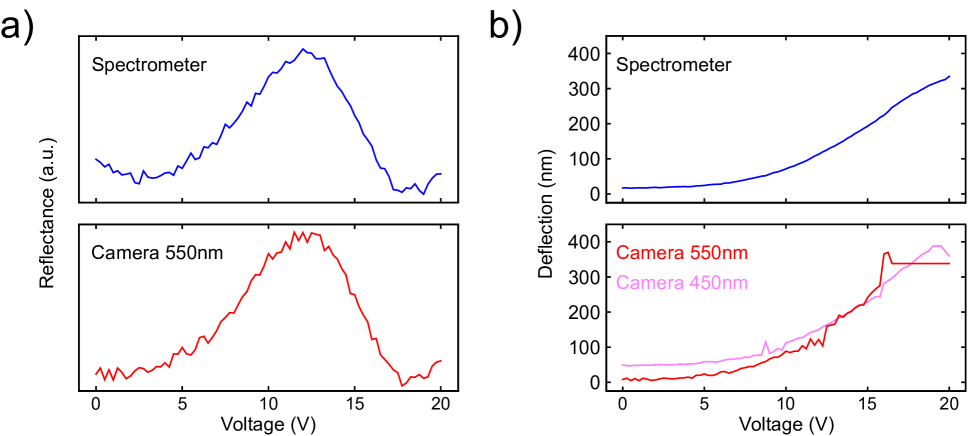
The electro-optic response of a suspended 20 m in diameter graphene drum, i.e. the drum averaged reflectance as a function of voltage, is shown in Figure 2a as obtained from the camera and spectrometer for the 550 nm wavelength. Using equation (1), we fit a value of deflection, and plot the deflection vs. voltage in Figure 2b. The deflection curves from both camera and spectrometer agree well, although the camera fit is done on collected data from a narrow wavelength band (corresponding to that of the filter) while the spectrometer fit is done on a 475-700 nm spectral band. It is worth noting that the fits are insensitive to small deflections and thus to low actuation voltages.
Given the gas impermeability of graphene [9], these drums should be hermetic, although they could permeate if few defects are present in the membrane [6]. In the previous measurement, a 30 s settling time was used to make sure that no gas permeation effects would interfere with the electro-optic response of the drum, but gas compression effects could alter the position of the membranes when actuating them at sufficiently higher frequencies. Therefore, we investigate the possibility of a squeeze-film like response by fast stroboscopic measurements that are enabled by substituting the halogen lamp with a white LED, which is powered by short duration pulses that are synchronized to a sinusoidal actuation voltage: V (see Methods). By sweeping the phase difference between the illuminating pulse and the actuation signal we are able to reconstruct the time-domain response of the structure. An example is shown in Figure 3a where we see two snapshots of a 15 m drumhead at opposing phases in the actuation cycle.
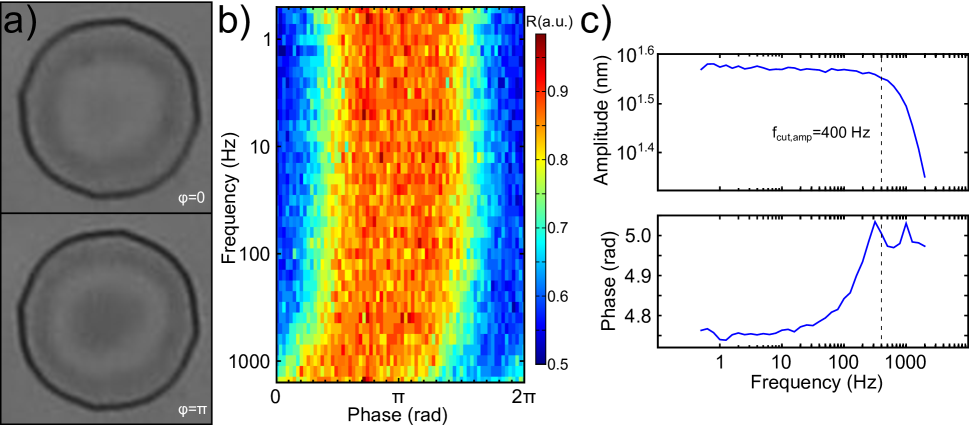
We stroboscopically measure 5 drumheads of 15 m in diameter with actuation frequencies ranging from 0.5 to 2000 Hz. The measured structures do not exhibit a first-order low-pass filter response indicative of squeeze-film effect for frequencies up to 400 Hz, beyond which the cut-off frequency of the capacitively loaded amplifier is reached. The frequency response of the drum’s center reflectance is shown in Figure 3b. The absence of a first-order response indicates that the permeation time constants are below or above the measurement range depending on the drumhead in question. A Bode plot of the displacement amplitude and phase are shown in Figure 3c, demonstrating no special feature until the amplifier cut-off around 400 Hz.
The large electro-optic modulation and absence of mechanical delays at frequencies up to 400 Hz make these devices interesting to enable display rates beyond the flicker fusion threshold that require color reproducibility in the millisecond range for applications such as virtual or augmented reality (VR/AR) [10]. Figure 4a shows the substrate of a 2500 ppi Graphene Interferometric MOdulator Display (GIMOD) prototype. The static image displaying the Graphene Flagship logo changes color upon the application of a sinusoidal signal (see Supplementary Video S10). All the mechanical pixels of 5 m in diameter are addressed at once with the silicon substrate acting as a back gate. The pixel aperture -active to total area ratio- is 50%, resulting in a reduction of contrast of about 1:2 due to the large separation between pixels (pixel pitch about double of the pixel size). The panels in the middle show a zoom-in of some pixels when they are actuated with 30 V (yellow state when OFF, top panel; blue state when ON, bottom panel).
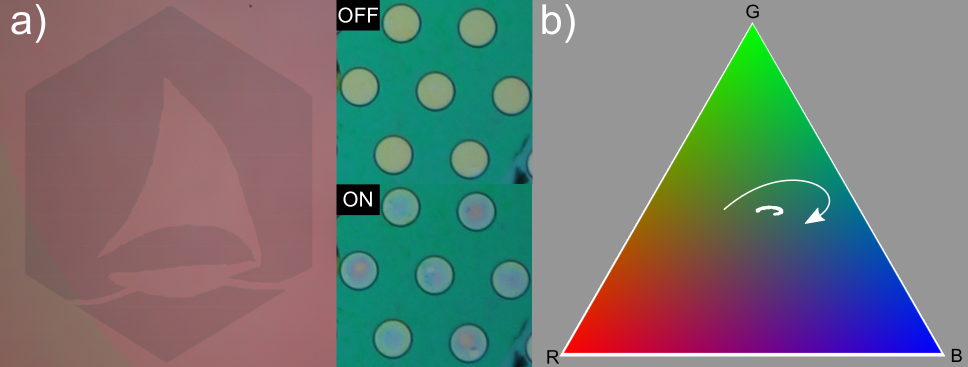
By analyzing the RGB channels of one of the pixels, we obtain its average color gamut and its evolution upon applied voltage. Figure 4b shows the pixel trajectory over a standard RGB (sRGB) color map based on CIE1931 colorimetry [11], demonstrating the electro-optical modulation from yellow to blue of these pixels.
While electrostatic transduction is used extensively as an actuation mechanism for MEMS/NEMS devices, including graphene nanoelectromechanical structures [12, 14, 13], in this work we investigate the far-from-resonance, quasi-static, large deformation regime of graphene membranes [15, 16]. For such a regime of operation the hydrostatic pressure component near the zero-deflection position () should not be neglected in hermetic cavities as it introduces a significant hydrostatic stiffness (Supplementary Information Section 4). Only if the membrane is not sufficiently hermetic can this effect be neglected. Moreover, large deflections –even in the case of impermeable membranes– cause the hydrostatic component to be overtaken by the nonlinear stiffness. However, it is possible to have structures with large diameters ( m) and shallow cavities ( nm) whereby for a hermetic cavity the hydrostatic stiffness remains dominant over the nonlinear one for all deflections. In such cases both hydrostatic stiffness and gas permeation time can interfere with the proper functioning of the device.
It is interesting to note that amongst the five 15 m in diameter membranes measured stroboscopically, one drum shows larger static and dynamic deflections compared to the others (Supplementary Information Section 6). Whether this is due to a lower mechanical stiffness caused by micro-tears, to a higher membrane permittivity, or to a combination of both (they are not mutually exclusive), remains a question for further investigation.
The measured DC voltage-dependent spectrum is qualitatively similar to simulation results obtained from equation (1) (Supplementary Information Section 5). As it can be also seen in Figure 2b, the membrane deflection and measured spectrum show little change for low voltages ( V). Since drums of 20 m in diameter are rarely hermetic, this effect is more likely explained by limitations of the technique itself rather than to hydrostatic stiffness. In particular, the assumption of a parabolic profile although accurate for large deflections, is not necessarily valid for small deformations due to wrinkles [19]. This is a necessary tradeoff in order to fit accurate deflection values for SLG/DLG due to the need to perform a drum average fit rather than a pixel-by-pixel fit as done for thicker membranes [20].
Furthermore, it is interesting to note that according to equation (1), the electro-optic response of a GIMOD pixel, when averaged over the drum area, is radius independent. Thus a change in the radius of the suspended drums does not result in any qualitative modification of the pixel behavior. In addition, the obtained RGB response of the pixels as shown in Figure 4, shows a limited path across the sRGB triangle. This is confirmed by simulations that predict a maximum change of 10% for each of the RGB channels for a DLG membrane and for an optimal gap for a GIMOD of 600 nm (Supplementary Information Section 7). For a richer colorimetric response, thicker membranes may be required. Ultimately graphene mechanical pixels need to be optimized taking into consideration the yield of the fabrication process, the actuation voltage, and the colorimetric response.
In summary, we report on CVD double-layer graphene electromechanical electro-optic modulators, the characterization of their spectral response, and their application as pixels in a Graphene Interferometric MOdulator Display (GIMOD). In addition to observing the electro-optical modulation, we develop an electrostatic-optical model to describe their behavior. We use the reflectance-voltage plots to fit a deflection-voltage response and conclude that the device is not significantly hermetic. We further explored the permeation time constants by stroboscopically measuring 5 devices without finding the onset of squeeze-film effect due to the gas trapped in the cavity in the frequency range of 0.5 to 400 Hz. The large color modulation and good frequency response of these graphene electro-optic modulators in ambient conditions enable the use of these mechanical devices as pixels with color reliability at high image refresh rates. This application is demonstrated with a prototype with 2500 ppi that would equate to a display with 12K+ resolution.
Besides possibly eliminating the motion sickness in VR/AR applications, the demonstrated reflective-type (e-paper) pixel technology would greatly reduce power consumption as it is an Interferometric MOdulator display (IMOD) technology. The use of graphene allows the large deformation of small membranes without mechanical failure or hysteresis allowing the fabrication of diffraction-limited devices for ultra-high resolution displays. Moreover, by using different voltages to actuate the pixels, each device is able to generate natural colors in the full-spectrum and in a continuous manner. This eliminates the need for RGB subpixels and reduces the addressing bandwidth to only one channel, which enables reduction of power consumption.
Methods
Colorimetry technique with optical spectrometer The deflection as a function of voltage are obtained with the colorimetry technique with an Olympus BX60 microscope as previously reported [6, 7]. Pictures are taken with a Canon EOS 600D and a 20 Olympus UMPlanFI objective lens (NA 0.46, LWD 3 mm). A TE-cooled linear CCD array spectrometer (B&W Tek Glacier X) is attached to the optical microscope in such a way it collects the light reflected from an area slightly larger than the selected drum (about 595 m2) (see Supplementary Information). Spectral traces of the entire drum are recorded with an integration time of 20 ms (no averaging). For the electrostatic pulling, we use a power supply (Rigol DP832) to ramp up the voltage from 0 to 20 V with steps of 0.25 V. The voltage is left constant for a period of 30 s after each step and before acquiring the data.
Stroboscopic technique The halogen lamp from the microscope is substituted by a white LED for stroboscopic illumination. A dual channel generator (Keysight Technologies 33512B Waveform Generator) controls the LED by outputting a narrow ( of the actuation period) 5 V pulse to the LED. At the same time this illumination pulse is phase-locked to an actuation sine wave that drives the graphene membrane electrostatically.
Data Availability
The authors declare that the data supporting the findings of this study are available within the paper and its supplementary information files.
The research leading to these results has received funding from the European Union’s Horizon 2020 research and innovation programme under grant agreement No 649953 (Graphene Flagship).
The authors declare that they have no competing financial interests.
Correspondence and requests for materials should be addressed to Santiago J. Cartamil-Bueno (email: cartamil@amo.de).
Supplementary information accompanies the manuscript on the Nature Nanotechnology website http://www.nature.com/naturenanotech
Devices were fabricated by S.J.C.-B. and D.D. Experiments were designed and performed by S.J.C.-B. and S.H. Materials were designed and synthesized by A.C. and A.Z. Data was analyzed by S.J.C.-B. and S.H., and all authors contributed to the discussion. S.J.C.-B. and S.H. wrote the manuscript, with contributions from all authors.
References
References
- [1] Bonaccorso, F., Sun, Z., Hasan, T. & Ferrari, A. Graphene photonics and optoelectronics. Nature Photonics 4, 611–622 (2010).
- [2] Yu, R., Pruneri, V. & García de Abajo, F.J. Resonant visible light modulation with graphene. ACS Photonics 2 (2015).
- [3] Sun, Z., Martinez, A. & Wang, F. Optical modulators with 2d layered materials. Nature Photonics 10, 227–238 (2016).
- [4] Ferrari, A. C. et al. Science and technology roadmap for graphene, related two-dimensional crystals, and hybrid systems. Nanoscale 7, 4598–4810 (2014).
- [5] Chan, E. K. et al. Continuous color reflective display fabricated in integrated mems-and-tft-on-glass process. Journal of Microelectromechanical Systems 26, 143–157 (2017).
- [6] Cartamil-Bueno, S. J. et al. Colorimetry Technique for Scalable Characterization of Suspended Graphene. Nano Letters 16, 6792–6796 (2016).
- [7] Cartamil-Bueno, S. J. et al. Very large scale characterization of graphene mechanical devices using a colorimetry technique. Nanoscale 9, 7559–7564 (2017).
- [8] Blake, P. & Hill, E. Making graphene visible. Applied Physics Letters 063124, 3 (2007).
- [9] Bunch, J. S. et al. Impermeable atomic membranes from graphene sheets. Nano Letters 8, 2458–2462 (2008).
- [10] Davis, J., Hsieh, Y.-H. & Lee, H.-C. Humans perceive flicker artifacts at 500 Hz. Scientific Reports 5 (2015).
- [11] Westland, S., Ripamonti, C. & Cheung, V. Computational colour science using MATLAB (John Wiley & Sons, 2012).
- [12] Bunch, J. S. et al. Electromechanical resonators from graphene sheets. Science 315, 490–493 (2007).
- [13] AbdelGhany, M. et al. Suspended graphene variable capacitor. 2D Materials 3, 041005 (2016).
- [14] Reserbat-Plantey, A., Marty, L., Arcizet, O., Bendiab, N. & Bouchiat, V. A local optical probe for measuring motion and stress in a nanoelectromechanical system. Nature Nanotechnology 7, 151–5 (2012).
- [15] Rokni, H. & Lu, W. Effect of graphene layers on static pull-in behavior of bilayer graphene/substrate electrostatic microactuators. Journal of Microelectromechanical Systems 22, 553–559 (2013).
- [16] AbdelGhany, M., Ledwosinska, E. & Szkopek, T. Theory of the suspended graphene varactor. Applied Physics Letters 101, 153102 (2012).
- [17] Boddeti, N. G. et al. Mechanics of Adhered, Pressurized Graphene Blisters. Journal of Applied Mechanics 80, 40909 (2013).
- [18] Li, Z. et al. Resonant frequency analysis on an electrostatically actuated microplate under uniform hydrostatic pressure. Journal of Physics D: Applied Physics 46, 195108 (2013).
- [19] Nicholl, R.J.T., Lavrik, N.V., Vlassiouk, I. Srijanto, B.R. & Bolotin, K. I. Hidden area and mechanical nonlinearities in freestanding graphene. Physical Review Letters 118 (2017).
- [20] Northeast, D.B., & Knobel, R.G. Fabrication and optical characterization of suspended 2D membranes for electromechanics. Preprint at https://arxiv.org/abs/1710.11320 (2017).