High Sensitivity RF Spectroscopy of a Strongly-Interacting Fermi Gas
Abstract
Rf spectroscopy is one of the most powerful probing techniques in the field of ultracold gases. We report on a novel rf spectroscopy scheme with which we can detect very weak signals of only a few atoms. Using this method, we extended the experimentally accessible photon-energies range by an order of magnitude compared to previous studies. We verify directly a universal property of fermions with short-range interactions which is a power-law scaling of the rf spectrum tail all the way up to the interaction scale. We also employ our technique to precisely measure the binding energy of Feshbach molecules in an extended range of magnetic fields. This data is used to extract a new calibration of the Feshbach resonance between the two lowest energy levels of 40K.
Degenerate Fermi gases have been used extensively in recent years to study complex many-body phenomena Bloch et al. (2008) such as high- superfluidity Gaebler et al. (2010); Feld et al. (2011), magnetic ordering Hart et al. (2015); Mazurenko et al. (2017) and many-body localization Schreiber et al. (2015). Their usefulness lies in their universality and controllability, namely the ability to characterize their state with a relatively small number of intensive macroscopic parameters that can be externally tuned Bloch et al. (2012). The prime example is the contact-like interactions between two fermions with opposite spins. Since the gas is dilute, the details of the inter-atomic interactions are usually not important and can be replaced by an effective contact pseudo-potential , where is the s-wave scattering length, is the atomic mass and is the reduced Planck’s constant Huang and Yang (1957). The scattering length can be modified close to a Fano-Feshbach resonance, which occurs when the energy of a molecular bound-state is brought close to that of the colliding atoms, usually by controlling an external magnetic field Chin et al. (2010).
The contact-like interactions give rise to several universal relations derived by S. Tan and others, all tied-up through the contact parameter, Tan (2008a); *Tan08a; *Tan08b; Braaten et al. (2008a, b); Zhang and Leggett (2009); Werner et al. (2009); Braaten (2012). Several of these relations were verified experimentally and the value of the contact was measured at different thermodynamic conditions Partridge et al. (2005); Stewart et al. (2010); Navon et al. (2010); Kuhnle et al. (2011); Sagi et al. (2012); Hoinka et al. (2013). This universal behavior is expected as long as the relevant scale is small compared to the interaction scale. For example, the spectral function has a characteristic back-bending at large energies and momenta which translates into power-law scaling of their respective distributions: for the momentum and for the energy Tan (2008a); Schneider and Randeria (2010); Braaten (2012). This scaling is expected to hold for and , where is the effective range of the potential Tan (2008a). The probability to find an atom decreases rapidly in the tail of these distributions. Therefore, the range in which the universal scaling has been experimentally tested to date is more than an order of magnitude shorter than the interaction scale. In this letter, we address the challenge of reaching the interaction scale by developing a new high-sensitivity rf spectroscopy technique. Applying it to a degenerate Fermi gas around a Feshbach resonance, we establish a universal power-law scaling of the rf lineshape over more than two decades in frequency, up to the interaction scale. We demonstrate the universality of the power-law exponent for data taken at different interaction strengths. Finally, we use the enhanced sensitivity of our technique to precisely measure the Feshbach molecule binding-energy up to relatively high energies and obtain a new calibration for the 40K2 Feshbach resonance position and width.
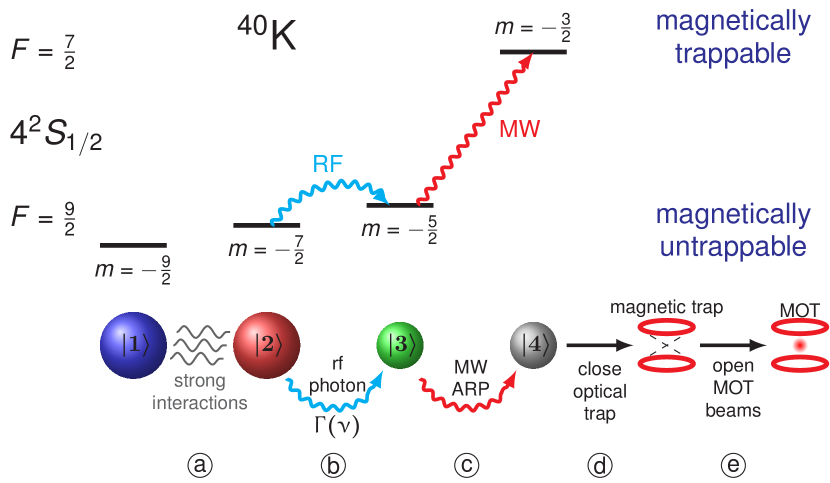
The new rf spectroscopy method is depicted in Fig. 1. We prepare a quantum degenerate gas of 40K atoms in a balanced mixture of the two lowest Zeeman sublevels, denoted by and , whose energy is split by a homogeneous magnetic field . Rf radiation at a frequency transfers a small fraction of the atoms at state to a third Zeeman sublevel , which is initially unoccupied. The number of atoms out-coupled by the rf pulse is recorded, and the result of this measurement is the rf transition rate . Many important observables can be extracted from , including pair size, superfluid gap, quasi-particle dispersion and single-particle spectral function, when the momentum distribution is resolved Chin et al. (2004); Schunck et al. (2008); Schirotzek et al. (2008, 2009); Stewart et al. (2008); Gaebler et al. (2010); Sagi et al. (2015). In standard rf spectroscopy, the number of the out-coupled atoms is measured by absorption imaging. Since the photon absorption cross-section is relatively small, detecting very weak signals in the rf lineshape tail is challenging. We overcame this difficulty by using fluorescence imaging instead. With fluorescence imaging, even a single atom can be reliably detected if held for a sufficient period of time, as was demonstrated with a magneto-optical trap (MOT) Hu and Kimble (1994). For rf spectroscopy, the main challenge is to capture in a MOT only the atoms out-coupled by the rf pulse, which may be a tiny fraction of the whole cloud.
Our approach relies on the difference in energy and magnetic dipole moments of the various energy levels. Specifically, all three states ,, and have negative magnetic dipole moments (“high-field-seekers”) and are therefore magnetically untrappable Wing (1984). After the rf pulse is applied, we use a narrow microwave (MW) sweep to selectively transfer only the population at state to a state in the other hyperfine manifold that has a positive magnetic dipole moment and is therefore magnetically trappable (“low-field-seeker”). We then turn on a quadrupole magnetic field which magnetically traps the atoms in state and expels all the rest. Finally, we turn on the MOT laser beams and record the MOT fluorescence signal with a sensitive CMOS camera.
The experiments are performed in a newly built apparatus that we now briefly describe. Our system is composed of three interconnected vacuum chambers. In the first chamber, a 2D MOT Dieckmann et al. (1998) generates a stream of cold atoms that fly through a narrow nozzle to the second chamber. There, the atoms are captured and cooled in a dark SPOT 3D MOT Ketterle et al. (1993) followed by a gray molasses cooling on the D1 line Salomon et al. (2014). The atoms are then optically pumped to a mixture of the Zeeman states, loaded into a QUIC magnetic trap Esslinger et al. (1998) and cooled by forced MW evaporation down to , where is the Fermi temperature. At this point the atoms are loaded into a far-off-resonance optical trap at a wavelength of Grimm et al. (2000), undergo a short stage of forced optical evaporation and moved to the third chamber by moving the trap position a distance of mm during second. After the transfer is complete, a second laser beam crossing the first beam at an angle of is turned on. We also apply rf radiation at MHz and adiabatically sweep the magnetic field in order to transfer the atoms to negative spin states which have a broad Feshbach resonance around G. The final stage of optical evaporation ends at a magnetic field of G. At this stage, there are around atoms per spin state at . The field is then ramped adiabatically to the final value and the system is left for ms to fully equilibrate. The trap oscillation frequencies in most of the experiments are Hz and Hz in the radial and axial directions, respectively. The average trap Fermi energy is kHz with .
We probe the system using a s-long square rf pulse with a spectral resolution of kHz. The rf power is chosen in the linear regime where it transfers less than of the atoms, and it is kept constant for all rf frequencies. Just before releasing the optical trap, we apply a ms pulse of MW radiation and sweep its frequency across kHz to induce adiabatic rapid passage (ARP) transfer to state . After the ARP, the optical trap is turned off abruptly and the quadrupole field is ramped on simultaneously, trapping the atoms at state . We then wait ms for atoms in all other states to completely leave the MOT capture domain and switch on the MOT beams. The photons scattered by the atoms in the MOT are collected for ms. Finally, we release the atoms from the MOT, wait for ms, and repeat the detection sequence to obtain the background signal, which we subtract.
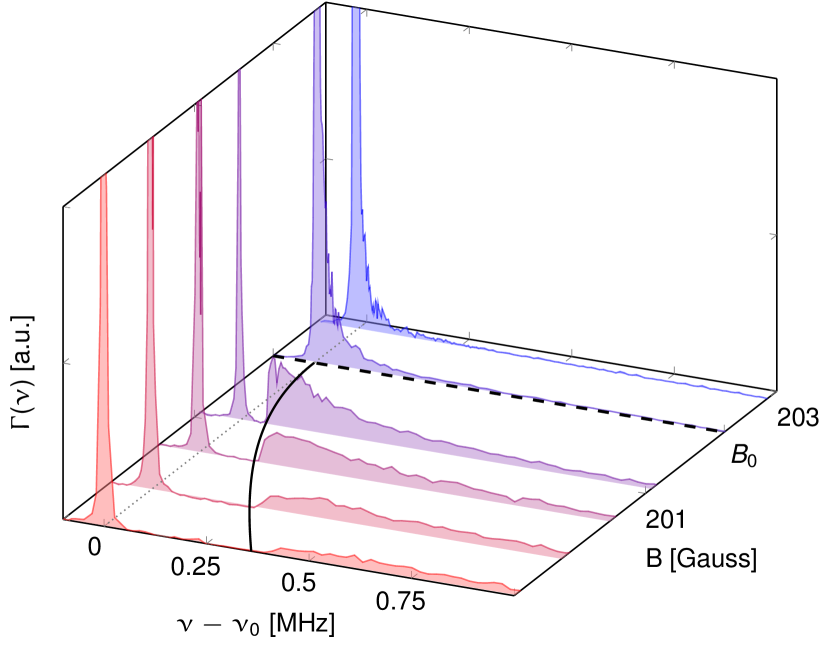
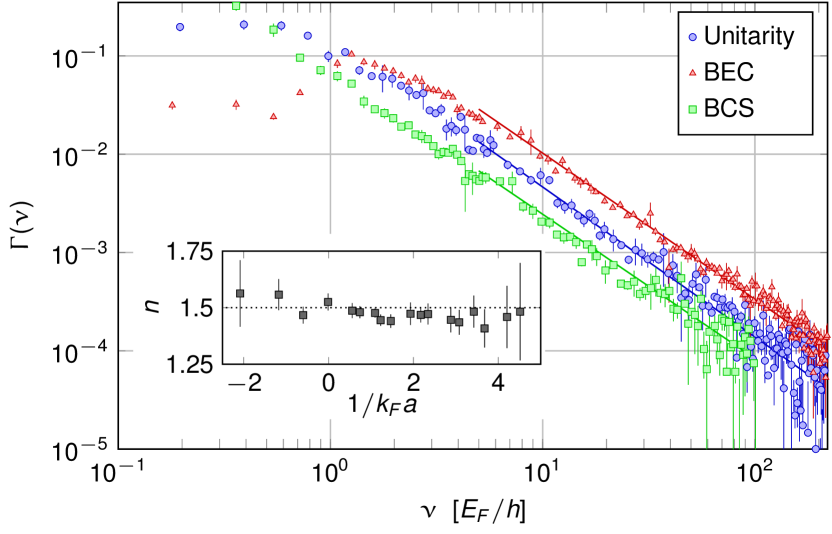
In Fig. 2 we plot rf spectra taken at different magnetic fields close to the Feshbach resonance. A tail at high frequencies is apparent and its weight increases as the field is decreased. For fields the spectrum separates into two distinct features: a narrow peak at zero frequency owing to free atoms and a broad spectrum with a sharp onset owing to bound Feshbach molecules. The rf lineshape is normalized by . For this choice of normalization and when the third spin state interacts only weakly with the two other states, as is the case with 40K, contact interactions in 3D give rise to a power-law scaling of at high frequencies Schneider and Randeria (2010); Braaten et al. (2010); Braaten (2012):
| (1) |
where is in units of and is in units of , where is the Fermi wave-vector and is the total number of atoms. The increase of the spectral weight in the tail as is reduced is expected since the contact increases monotonically Braaten (2012).
We first focus on the universal scaling of the rf lineshape. Previous studies at unitarity () with standard rf spectroscopy were restricted to due to signal to noise ratio Stewart et al. (2010); Sagi et al. (2012). On the other hand, it was found empirically that the scaling of Eq.(1) starts to show up only above Stewart et al. (2010). In this limited range , decreases by less than a factor of , hence only consistency with a power-law scaling could have been established Stewart et al. (2010); Sagi et al. (2012). Using our new detection scheme, we are able to extend this range by more than an order of magnitude, as can be seen in Fig. 3, where we plot on a logarithmic scale data taken at in the BCS-BEC crossover regime Zwerger (2012). One of the main results of this work is the observation of linear scaling of the rf spectrum over more than two decades up to , which establishes without any prior assumption that the rf lineshape tail indeed follows a power-law. Furthermore, we have taken rf spectra at many other interaction strengths and used a power-law function to fit the tail. The exponent extracted from these fits is plotted in the inset of Fig. 3. The results are consistent with a value predicted by Eq.(1) over the range of interactions we have tested. For 40K, the interaction energy scale, , is MHz or . Our data extends to this scale and confirms the universal scaling resulting from contact-like interactions in the vicinity of the Feshbach resonance.
Next, we study the Feshbach molecule spectra in Fig. 2 which exist for positive scattering length (). The binding energy of the Feshbach molecule is related to the scattering length through Gribakin and Flambaum (1993):
| (2) |
where is the finite range correction of the van der Waals potential . Near a Feshbach resonance the scattering length can be written as , where is the width of the resonance and is the background scattering length Chin et al. (2010). A precise measurement of is valuable in order to calibrate the molecular potentials and parameters of the Feshbach resonance Regal et al. (2003); Claussen et al. (2003); Gaebler (2010).
We extract the binding energy from the position of the sharp rise in the molecular spectra, which marks the molecule dissociation threshold. A general form of the transition lineshape of a weakly bound molecules is
| (3) |
where is the Heaviside step function, and in the two-body limit Chin and Julienne (2005); Schunck et al. (2008). Note that Eq.(3) has the correct high frequency limit given by Eq.(1). As can be seen in Fig. 2, the molecular signal decreases as the magnetic field is taken farther away from the resonance. In this limit, the contact scales as Braaten (2012) while the binding energy as . The maximum of the molecular lineshape in Eq.(3) scales as . Farther away from resonance falls off and consequently also the rf signal. Therefore, our sensitive rf spectroscopy technique is particularly well-suited to measure these weak and extended signals.
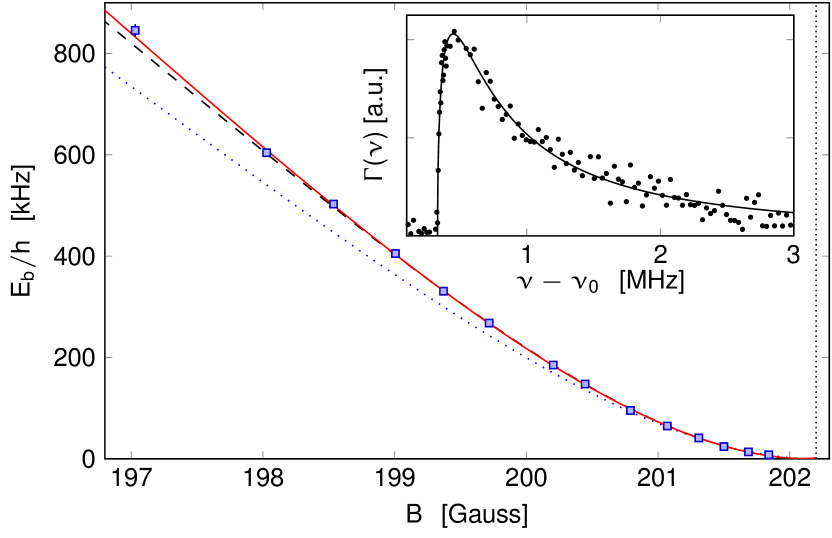
Typical experimental data together with a fit to Eq.(3) are shown in inset of Fig. 4. From these fits at different magnetic fields we determine with an average relative accuracy of at a confidence level. The results are shown in Fig. 4. For comparison, we also plot the formula of Eq.(2) with the most recent calibration of the Feshbach resonance parameters Gaebler et al. (2010); Gaebler (2010). It fits well the data near the resonance, but for magnetic fields larger than G a clear systematic deviation develops. A similar trend was also observed in Ref. Moritz et al. (2005). In order to extract a new calibration, we calculate the binding energy using a two coupled channels model Goral et al. (2004); Szymańska et al. (2005). This model depends on five parameters: and , which is the difference in the magnetic dipole moment of the open and closed channels. We have fixed the values of atomic units Derevianko et al. (1999), MHz/G Szymańska et al. (2005) and with being the Bohr radius Falke et al. (2008), which have been determined to a good accuracy, and used and as fitting parameters. This yields G, G. As can be seen in Fig. 4, with this calibration both the two channels model and Eq.(2) fit the data very well. Our new calibration shifts and slightly relative to their values in Ref. Gaebler et al. (2010); Gaebler (2010) and improves their accuracy by a factor of and , respectively.
In conclusion, we have presented a new sensitive detection scheme for rf spectroscopy which improves this already powerful technique. The new scheme allows detection of very weak signals of only several atoms. The new technique has been employed to confirm the universal behavior of a contact-like potential all the way to the microscopic interaction scale. In addition, the Feshbach molecule binding energy has been measured in an extended range of magnetic fields and used to extract a new calibration of the Feshbach resonance parameters and . We expect the new technique to be useful in many applications where the signal is inherently weak, e.g. when a precise determination of a minority species spectrum is of interest. In addition, it would be interesting to measure the universal scaling of the rf lineshape in lower dimensions. In particular, in 2D one expects a power-law with a different exponent of Langmack et al. (2012). Moreover, crossover from 2D scaling to 3D scaling is expected at an energy scale corresponding to , with being the oscillation frequency in the tight direction of the 2D trap.
We thank John Bohn for insightful comments. This research was supported by the Israel Science Foundation (ISF) grant No. 888418, and by the United States-Israel Binational Science Foundation (BSF), Jerusalem, Israel, grant No. 2014386.
C. S. and Y. F. contributed equally to this work.
References
- Bloch et al. (2008) I. Bloch, J. Dalibard, and W. Zwerger, Rev. Mod. Phys. 80, 885 (2008).
- Gaebler et al. (2010) J. P. Gaebler, J. T. Stewart, T. E. Drake, D. S. Jin, A. Perali, P. Pieri, and G. C. Strinati, Nat. Phys. 6, 569 (2010).
- Feld et al. (2011) M. Feld, B. Frohlich, E. Vogt, M. Koschorreck, and M. Kohl, Nature 480, 75 (2011).
- Hart et al. (2015) R. A. Hart, P. M. Duarte, T.-L. Yang, X. Liu, T. Paiva, E. Khatami, R. T. Scalettar, N. Trivedi, D. A. Huse, and R. G. Hulet, Nature 519, 211 EP (2015).
- Mazurenko et al. (2017) A. Mazurenko, C. S. Chiu, G. Ji, M. F. Parsons, M. Kanász-Nagy, R. Schmidt, F. Grusdt, E. Demler, D. Greif, and M. Greiner, Nature 545, 462 EP (2017).
- Schreiber et al. (2015) M. Schreiber, S. S. Hodgman, P. Bordia, H. P. Lüschen, M. H. Fischer, R. Vosk, E. Altman, U. Schneider, and I. Bloch, Science (2015), 10.1126/science.aaa7432.
- Bloch et al. (2012) I. Bloch, J. Dalibard, and S. Nascimbène, Nature Physics 8, 267 EP (2012).
- Huang and Yang (1957) K. Huang and C. N. Yang, Phys. Rev. 105, 767 (1957).
- Chin et al. (2010) C. Chin, R. Grimm, P. Julienne, and E. Tiesinga, Rev. Mod. Phys. 82, 1225 (2010).
- Tan (2008a) S. Tan, Ann. Phys. 323, 2971 (2008a).
- Tan (2008b) S. Tan, Ann. Phys. 323, 2987 (2008b).
- Tan (2008c) S. Tan, Ann. Phys. 323, 2952 (2008c).
- Braaten et al. (2008a) E. Braaten, D. Kang, and L. Platter, Phys. Rev. Lett. 100, 205301 (2008a).
- Braaten et al. (2008b) E. Braaten, D. Kang, and L. Platter, Phys. Rev. A 78, 053606 (2008b).
- Zhang and Leggett (2009) S. Zhang and A. J. Leggett, Phys. Rev. A 79, 023601 (2009).
- Werner et al. (2009) F. Werner, L. Tarruell, and Y. Castin, Eur. Phys. J. B 68, 401 (2009).
- Braaten (2012) E. Braaten, in The BCS-BEC Crossover and the Unitary Fermi Gas, Lecture Notes in Physics, Vol. 836, edited by W. Zwerger (Springer Berlin / Heidelberg, 2012) pp. 193–231.
- Partridge et al. (2005) G. B. Partridge, K. E. Strecker, R. I. Kamar, M. W. Jack, and R. G. Hulet, Phys. Rev. Lett. 95, 020404 (2005).
- Stewart et al. (2010) J. T. Stewart, J. P. Gaebler, T. E. Drake, and D. S. Jin, Phys. Rev. Lett. 104, 235301 (2010).
- Navon et al. (2010) N. Navon, S. Nascimbène, F. Chevy, and C. Salomon, Science 328, 729 (2010).
- Kuhnle et al. (2011) E. D. Kuhnle, S. Hoinka, P. Dyke, H. Hu, P. Hannaford, and C. J. Vale, Phys. Rev. Lett. 106, 170402 (2011).
- Sagi et al. (2012) Y. Sagi, T. E. Drake, R. Paudel, and D. S. Jin, Phys. Rev. Lett. 109, 220402 (2012).
- Hoinka et al. (2013) S. Hoinka, M. Lingham, K. Fenech, H. Hu, C. J. Vale, J. E. Drut, and S. Gandolfi, Physical Review Letters 110 (2013), 10.1103/physrevlett.110.055305.
- Schneider and Randeria (2010) W. Schneider and M. Randeria, Phys. Rev. A 81, 021601 (2010).
- Chin et al. (2004) C. Chin, M. Bartenstein, A. Altmeyer, S. Riedl, S. Jochim, J. H. Denschlag, and R. Grimm, Science 305, 1128 (2004).
- Schunck et al. (2008) C. H. Schunck, Y.-i. Shin, A. Schirotzek, and W. Ketterle, Nature 454, 739 EP (2008).
- Schirotzek et al. (2008) A. Schirotzek, Y.-i. Shin, C. H. Schunck, and W. Ketterle, Phys. Rev. Lett. 101, 140403 (2008).
- Schirotzek et al. (2009) A. Schirotzek, C.-H. Wu, A. Sommer, and M. W. Zwierlein, Phys. Rev. Lett. 102, 230402 (2009).
- Stewart et al. (2008) J. T. Stewart, J. P. Gaebler, and D. S. Jin, Nature 454, 744 (2008).
- Sagi et al. (2015) Y. Sagi, T. E. Drake, R. Paudel, R. Chapurin, and D. S. Jin, Phys. Rev. Lett. 114, 075301 (2015).
- Hu and Kimble (1994) Z. Hu and H. J. Kimble, Opt. Lett. 19, 1888 (1994).
- Wing (1984) W. H. Wing, Progress in Quantum Electronics 8, 181 (1984).
- Dieckmann et al. (1998) K. Dieckmann, R. Spreeuw, M. Weidemüller, and J. Walraven, Physical Review A 58, 3891 (1998).
- Ketterle et al. (1993) W. Ketterle, K. B. Davis, M. A. Joffe, A. Martin, and D. E. Pritchard, Physical review letters 70, 2253 (1993).
- Salomon et al. (2014) G. Salomon, L. Fouché, P. Wang, A. Aspect, P. Bouyer, and T. Bourdel, EPL (Europhysics Letters) 104, 63002 (2014).
- Esslinger et al. (1998) T. Esslinger, I. Bloch, and T. W. Hänsch, Physical Review A 58, R2664 (1998).
- Grimm et al. (2000) R. Grimm, M. Weidemüller, and Y. B. Ovchinnikov (Academic Press, 2000) pp. 95 – 170.
- Braaten et al. (2010) E. Braaten, D. Kang, and L. Platter, Phys. Rev. Lett. 104, 223004 (2010).
- Zwerger (2012) W. Zwerger, ed., The BCS-BEC Crossover and the Unitary Fermi Gas, Lecture Notes in Physics, Vol. XVI (Springer, 2012) p. 532.
- Gribakin and Flambaum (1993) G. F. Gribakin and V. V. Flambaum, Phys. Rev. A 48, 546 (1993).
- Regal et al. (2003) C. A. Regal, C. Ticknor, J. L. Bohn, and D. S. Jin, Nature 424, 47 EP (2003).
- Claussen et al. (2003) N. R. Claussen, S. J. J. M. F. Kokkelmans, S. T. Thompson, E. A. Donley, E. Hodby, and C. E. Wieman, Phys. Rev. A 67, 060701 (2003).
- Gaebler (2010) J. P. Gaebler, Photoemission Spectroscopy of a Strongly Interacting Fermi Gas, Ph.D. thesis, JILA, University of Colorado (2010).
- Chin and Julienne (2005) C. Chin and P. S. Julienne, Phys. Rev. A 71, 012713 (2005).
- Goral et al. (2004) K. Goral, T. Kohler, S. A. Gardiner, E. Tiesinga, and P. S. Julienne, Journal of Physics B: Atomic, Molecular and Optical Physics 37, 3457 (2004).
- Szymańska et al. (2005) M. H. Szymańska, K. Góral, T. Köhler, and K. Burnett, Phys. Rev. A 72, 013610 (2005).
- Falke et al. (2008) S. Falke, H. Knöckel, J. Friebe, M. Riedmann, E. Tiemann, and C. Lisdat, Phys. Rev. A 78, 012503 (2008).
- Derevianko et al. (1999) A. Derevianko, W. R. Johnson, M. S. Safronova, and J. F. Babb, Phys. Rev. Lett. 82, 3589 (1999).
- Moritz et al. (2005) H. Moritz, T. Stöferle, K. Günter, M. Köhl, and T. Esslinger, Phys. Rev. Lett. 94, 210401 (2005).
- Langmack et al. (2012) C. Langmack, M. Barth, W. Zwerger, and E. Braaten, Phys. Rev. Lett. 108, 060402 (2012).