Novel approach to Raman spectra of nanoparticles
Abstract
In crystalline nanoparticles the Raman peak is downshifted with respect to the bulk material and has asymmetric broadening. These effects are straightly related to the finite size of nanoparticles, giving the perspective to use the Raman spectroscopy as the size probe. By combining the dynamical matrix method (DMM) and the bond polarization model (BPM), we develop a new (DMM-BPM) approach to the description of Raman spectra for random arrays of nanoparticles. The numerical variant of this approach is suitable for the description of small particles, whereas its simplier to implement analytical version allows to obtain the Raman spectra of arbitrary sized particles. Focusing on nanodiamond powders, the DMM-BPM theory is shown to fit the most recent experimental data much better than the commonly used phonon confinement model (PCM), especially for small enough nanoparticles.
I Introduction
Crystalline nanoparticles, including semiconductor particles and nanodiamonds, are actively investigated nowadays for applications in novel materials mochalin2012properties , quantum computing veldhorst2014addressable ; Chen2017 , biology and medicinepark2009biodegradable ; kim2016ultrasmall . The outstanding progress in nanoparticle manufacturing techniques dictates the further efforts in characterization and standardization of their size, shape, phase composition, and surface morphology. For such purposes, the high resolution transmission electron microscopy, X-ray diffraction, dynamical light scattering, atomic force microscopy, and other methods are used.
Among others, significant role is played by the Raman spectroscopy. It is the unique long-wavelength (optical) nondestructive experimental probe that provides the tool to investigate the excitations (phonons, excitons wang2015double , magnons devereaux2007inelastic , etc.) on the scale of several interatomic distances. This allows to characterize the nanoparticle arrays based on the analysis of the positions of the Raman peaks and their (asymmetric) broadening.
According to the Heisenberg indeterminacy principle, the momentum conservation law in nanoparticles is violated due to localization of photon-phonon interaction within the volume of a particle. While in bulk crystals only the phonons with wavevector contribute to the Raman spectra (RS), in nanoparticles is quantized due to the size quantization effect. The minimal phonon wavevector is , with being the typical nanocrystallite size. This yields measurable Raman peak downshift, as compared to the bulk material.
The standard method of theoretical analysis of the crystalline nanoparticle RS yoshikawa1993raman ; yoshikawa1995raman ; osswald2009phonon ; gao2016size ; bahariqushchi2017correlation ; arora2007raman is the semiphenomenological phonon confinement model (PCM) introduced by Richter, Wang, and Ley richter1981one and further developed by Campbell and Fauchet campbell1986effects . This model is not free of disadvantages. First, PCM is based on the assumption of a smooth (Gaussian) decay of atomic vibration amplitudes from nanocrystallite center to its surface, which seems ill-founded. Indeed, this assumption brings to the theory the adjustable parameter of phonon amplitude at the particle boundary. In our opinion, it is an attempt to incorporate several physical phenomena (such as particle size, shape, disorder, etc.) using a single quantity. As a result, for the commonly used value of this parameter, 98% of vibration energy is unphysically restricted to 2% of nanocrystallite volume near its center zi1997comparison .
Second, within the PCM the RS of identical nanoparticles are broad and smooth. However, as it can be seen from ab initio calculations of nanodiamond RS (see Refs. zhang2005signature ; filik2006raman ; li2010convergence ) and experimental fullerene RSchase1992vibrational , the single nanocrystallite Raman fingerprint is actually very sparse. It has a comb-like shape with multiple narrow peaks. The approach developed below shows, that even for relatively large particles the spectrum is also sparse (see Fig. 5 in Sec. III).
Furthermore, PCM cannot explain the (slightly sloping) shoulder between 1100 and 1250 cm-1 in nanodiamond RS (see, e.g., Ref. osswald2009phonon ). To provide an agreement between experimental data and PCM calculations the suggestions of crystal defects and multiple phonon modes have been made, which incorporated even more adjustable parameters into the theory osswald2009phonon .
Finally, within the PCM, the vibration mode with bulk optical phonon frequency in the Brillouin zone center brings a non-zero contribution to the Raman spectra. Its contribution is suppressed only due to the low phonon density of states (DOS) in this region, such that lower frequencies (higher momenta) provide more significant contribution to the spectrum. However, the phonon frequency in nanoparticles cannot reach the value in principle, due to the size quantization effect.
There were several efforts to improve the PCM by modifying the phonon amplitude envelope in crystallites zi1997comparison ; faraci2006modified ; ke2011effect ; valentin2008study , which had only relative success. In Refs. osswald2009phonon ; korepanov2017quantum the authors accounted for the for phonon dispersion anisotropy in various directions in the Brilloiun zone.
Numerically, the RS of semiconductor and diamond nanoparticles have been modeled by means of the density functional theory (DFT). This approach allowed to calculate the spectra for up to 1000 atoms in a nanocrystallite zhang2005signature ; filik2006raman ; li2010convergence .
In the present paper, we develop a theory free of adjustable parameters except for the phonon line width. We used the material constants unambiguously defined from the microscopic model. The theory is based on the combined use of the dynamical matrix method (DMM) and the bond polarization modeljorioraman (BPM). It makes possible to describe the RS of nanoparticles with diamond-like lattice. Hereinafter, we shall refer to this theory as the DMM-BPM approach.
Our method keeps the principal advantage of the PCM intact: the nanoparticle is a zero-dimensional object with respect to the actual wave length of the excitation laser. It allows us to incorporate the bond polarization model in order to treat all the nanoparticle vibration modes.
The primary virtue of the dynamical matrix method is the possibility to study the particles consisting of several thousands of atoms (much larger than what DFT can treat) and to keep the microscopic nature of the description of atomic vibrations. Simultaneously, the classical BPM is famous for successful reproducing of experimental fullerene C60 snoke1993bond ; Guha1996empiricalBPM ; menendez2000vibrational and Sicheng2002calculations nanoparticle RS.
More specifically, we utilize the DMM in order to obtain particle vibration modes for nanocrystallites of various shapes and sizes. We derive the bond polarizations using the obtained eigenstates and the material constants known from microscopics. It allows to calculate the nanoparticle RS within the framework of the BPM scheme. Next, from the analysis of relations between the vibrational density of states of a nanoparticle and the calculated spectral intensities, we propose the simple quasicontinuum analytical formulation of the DMM-BPM approach applicable for particles of arbitrary size.
We undertake the thorough comparison of our approach (both analytical and numerical) with the commonly used PCM in order to interpret three detailed sets of experimental data related to nanodiamond RS. We find that our model fits the experiment much better than the PCM one. Note, that we concentrate on nanodiamonds; however, the theory can be easily extended to other crystalline materials.
The rest of the paper is organized as follows. In Sec. II, we formulate DMM and BPM in the form suitable for further applications. In order to verify these methods, we supplement our theoretical analysis by ab initio calculations within the DFT scheme. In Sec. III, we combine DMM and BPM into an integrated approach, capable to treat the nanoparticle RS. Furthermore, analyzing the relation between the eigenmodes of nanoparticle and the Raman peak intensity, we formulate the DMM-BPM theory via simple analytical equations. In Sec. IV, we present the comparative analysis of our approach and the PCM model, both applied to the available experimental data. In Sec. V, we discuss the advantages of the DMM-BPM and possible extensions of this work. Finally, we present our conclusions. Our paper is supplemented with two Appendixes which contain some details of DMM-BPM scheme.
II General theory
II.1 Dynamical matrix method and bond polarization model
The dynamical matrix method born1954dynamical ; maradudintheory allows to derive the normal modes and the eigenfrequencies of molecules and nanoparticles by solving eigenvalue problem
| (1) |
where is the -th atom displacement along direction, is the number of atoms in the nanoparticle, is the atomic mass and is the total energy of the particle as a function of atomic displacements.
We derive from the microscopic Keating model keating1966effect ; martin1970elastic ; kane1985phonon ; steiger2011enhanced . In this model, the parameter measures the bond rigidity with respect to stretching and the parameter measures the valence angle bending. Keating model yields the simple expression for the optical phonon frequency in the point:
| (2) |
Substituting Dyncm-2 and Dyncm-2 from the Table II of Ref. anastassakis1990piezo
we find cm-1. This value differs from the one cm-1 obtained from experimental datawarren1967lattice ; schwoerer1998phonon ; burkel2001determination ; kulda2002overbending and ab initio calculations monteverde2015under . In what follows we shall use the renormalized parameters and , where . We attribute the rescaling of phonon energies caused by to the regular overestimation of the elastic constants within the Keating model. This procedure provides the correct optical phonon frequency in the Brillouin zone center, keeping the ratio between stretching and bending elastic constants intact. Note that the formulation of DMM-BPM can be performed using any particular bulk crystal dispersion originating from a specific microscopic model.
To approximate the optical phonon dispersion in diamond we use the standard expression:
| (3) |
where the normalized corresponds to the boundary of the Brillouin zone for diamond-type lattice. Here and below, the quantities with tilde stand for phonon wave vectors normalized to unity; nm is the diamond lattice constant, and .
The Keating model and the employed force constants yield cm-1.The bulk diamond phonon dispersion calculated on the basis of Keating approach is closer to the one introduced by Ager ager1991spatially ( cm than to those presented by Yoshikawa yoshikawa1995raman ( cm-1) and by Chaigneau (chaigneau2012laser, ) ( cm-1).
The BPM itself and the constants required for deriving the polarization tensors are described in Ref. jorioraman (see section 11.5, Eq. (11.16) and Table 11.3) and in Refs. snoke1993bond ; Guha1996empiricalBPM ; menendez2000vibrational . These constants have been introduced for hydrocarbon single bond polarization in Ref. martin1984raman and have been adopted for carbon atomic clusters in Ref. Guha1996empiricalBPM . The main output of the BPM are the polarization tensors for -th mode. In the most general form, they can be expressed via the normal modes as follows:
| (4) |
where are the combinations of atomic radius vectors and material constants describing the bond polarizations. In Appendix A, we present the equations expressing the components of tensor via the microscopic parameters of the theory.
The quantity characterizes the intensity of photon scattering from the state with polarization to the state with polarization . In order to calculate the powder RS in the backscattering geometry, one should average the squared vector over the directions of . We denote the result of this procedure as . Then, the light intensity of the Raman spectrum can be described as a superposition of Lorentzians centered at corresponding eigenfrequencies with their weights proportional to ,
| (5) |
where is the Bose-Einstein occupation number for the mode with frequency . The additional parameter of the model is the linewidth , which is a combination of the spectrometer resolution and the intrinsic phonon damping. In the present paper, we shall treat as a free adjustable parameter. Its microscopic origin will be clarified in a separate publication OurPhononDamping .
The bond polarization model is closely related to the linear response theory applied previously for studying the RS of glassesmartin1981correlated and semiconductor nanostructures elliott1974theory ; wang1988theory ; alfaro2008theory . The dynamical matrix diagonalization, calculating RS and further analysis of DOS was performed in ”Mathematica” packageram2010 .
II.2 Ab-initio calculations
To verify the usage of dynamic matrix method and bond polarization model for the analysis of RS we perform ab-initio calculations for 0.75 nm, 0.86 nm, 1 nm, and 1.25 nm roughly spherical nanoparticles. The ”Gaussian” package gaussian was used for calculations with the semi-empirical method PM3stewart1989optimization with a standard base 3-21g. The scaling coefficient 0.925 obeys the 1333 cm-1 limit value for large particle size when making the approximation of the points obtained by DFT with eq. (3) and eq. (7). The free bonds of the surface atoms were terminated with heavy hydrogens, like in Ref.filik2006raman .
III Formulating the method
III.1 Basic properties of eigenvalues and eigenfunctions of dynamical matrices
In our numerics, we consider the nanocrystallites in the shape of a sphere, a cube and a truncated octahedron. Henceforth, we use the diameter of a spherical particle with the same number of atoms as in the nonspherical ones, as the measure of the effective size of the nonspherical particles. The sizes of particles vary from 0.75 nm to 4.5 nm. The latter corresponds to approx. 8500 atoms. The eigenvectors of dynamical matrices are normalized to unity and therefore vibration amplitudes are proportional to , similar to phonon normalization.
For all considered particle shapes and sizes, the structure of the solution of dynamical matrix eigenproblem is as follows. The first three eigenvalues are nearly degenerate and correspond to relative shears of sublattices in three spatial directions. The Raman scattering intensities calculated for these eigenfunctions have maximal magnitudes nearly equal to each other. Their sum is given by
| (6) |
Here, is the constant calculated within the BPM and corresponding to the set of elastic and polarization parameters we use. It is proportional to the volume of the nanoparticle. Frequencies and Raman intensities of the three highest modes do depend on the particle size, but are almost independent of its shape. On this level of accuracy, the highest eigenfrequency can be found analytically via the formula:
| (7) |
where is the characteristic scale of the momentum size quantization. It is worth mentioning that the main Raman peak is governed by .
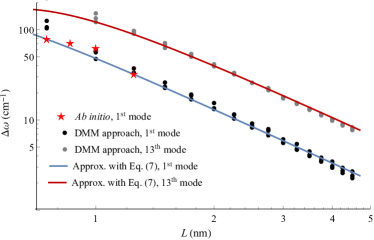
Fig. 1 shows the downshift of the highest mode frequency relative to the bulk diamond one as a function of particle size obtained numerically and its approximation given by Eq. (7). Remarkably, is almost independent of the shape of a particle. Therefore, the -dependence of in Eq. (7) allows a simple estimate for the typical nanodiamond size in the powder as a function of the Raman peak position. Moreover, Eqs. (3) and (7) permits us to derive simple formulas for RS (see Eqs.(11)-(14) below).
Similar downshift of the first mode frequency has been reported in Refs. cheng2002calculations ; valentin2008study for silicon nanoparticles and predicted by toy model in Ref. meilakhs2016new . The size effect for the nanoparticle breathing mode has been shown using DFT in Ref. filik2006raman .
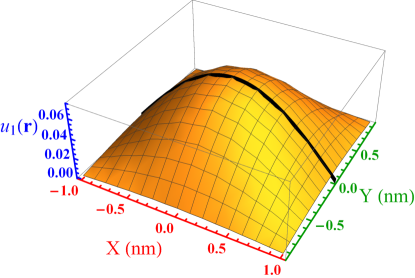
The origin of these large and almost identical contributions of the first three modes could be understood as follows. Numerically, the magnitudes of atomic displacements are maximal in the centers of the nanoparticles and drop to zero at their boundaries. Generally, they have the cosine-like shape, which is close to the lowest-in- solution of the continuous equation with Dirichlet boundary conditions . Envelopes
Numerical analysis (see also Appendix B) shows that the normal modes from the 4-th to the 12-th are Raman silent, and only the 13-th mode becomes Raman active again. Moreover, the 13-th mode can be treated as the beginning of a band of Raman active modes. This band consists of interleaving Raman active and Raman silent subbands, the subband width being of the order of 10 eigenvalues. The Raman scattering intensity of a single mode within the first subband is at least one order of magnitude weaker than that of the three highest modes. The eigenfrequency corresponding to the 13-th mode can be estimated as , where (cf. Fig. 1). Moreover, the modes starting from the 13-th are very dense. In the next subsection we shall demonstrate that they can be treated as a continuum.
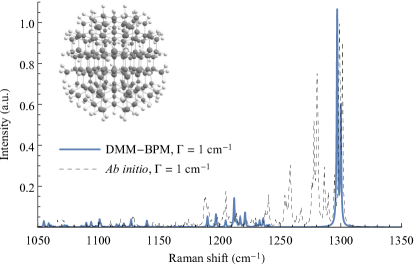
Fig. 2 shows the Raman spectra of a 1.25 nm spherical nanodiamond, obtained from Eq. (5) with cm-1. One can see that the results of DMM-BPM and ab initio models yield the close position of the main peak and similar comb-like structure of peaks in the region cm-1. We postpone the detailed analysis of the nanoparticle shape effect until a forthcoming publication KFG .
III.2 Analytical formulation of DMM-BPM
Numerically, the dynamical matrix diagonalization and the implementation of BPM become cumbersome for nanoparticles larger than 4 nm. In this subsection, we propose an approximate analytical scheme for calculating the RS of nanoparticles of arbitrary size based on the analysis of our numerical results. This analysis allows to derive the Raman spectra for larger particles, which cannot be treated within the exact DMM-BPM and/or ab initio methods.
First, let us approximate the optical phonon DOS as a function of particle size as follows:
| (8) |
where
| (9) |
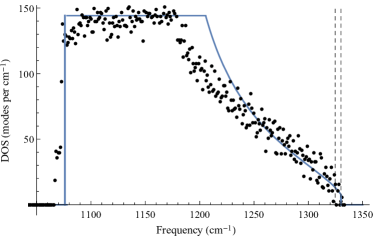
Here, the function is determined by the bulk DOS derived for the phonon dispersion given by Eq. (3). Since the cosine dispersion (3) fails near the Brillouin zone boundary , and there are several closely lying branches of acoustic and optical modes monteverde2015under in this region, we approximate our DOS in the vicinity of the zone boundary by a constant. Eqs.(8) and (9) fit well the numerical DOS for diamond nanoparticles (see Fig. 3), and roughly coincide with the bulk diamond one from Ref. pavone1993abinitio , resembling also the Si nanoparticle phonon DOS valentin2008study ; prokofiev2014phonon .
Dividing numerically the Raman spectrum of nanoparticle by the (numerical) phonon DOS, one can introduce the mean Raman scattering intensity for lower (quasicontinuum) modes :
| (10) |
The numerator of the above equation is the integral Raman intensity for the phonon modes with frequencies lying within the interval , and the denominator is the total number of such modes.
In spite of discontinuities in scattering intensities of the lower modes in the quasicontinuum and the existence of silent subbands, the energy dependence of the mean Raman scattering intensity can be approximated by a simple power law:
| (11) |
where . This quantity is not proportional to , which leads to the overall proportionality of the RS to the nanoparticle volume.
Using Eqs. (8) and (11), replacing the summation in Eq. (5) by the integration and writing separately the contribution from the three highest modes, we obtain
| (12) |
The first term in this equation related to the three highest modes is the dominating contribution to the Raman peak. It cannot be described within the continuum approach. Note also that the upper integration limit in the “continuum term” is . One can see that both terms (and therefore the entire spectrum ) are proportional to . Eq. (12) is close by its meaning to Eq. (13) from Ref. nemanich1981light and clarifies the physical meaning of the coupling constant there.
It is instructive to compare this analytical approach and the PCM. With a little loss of accuracy (namely, neglecting the contribution of phonons with frequencies below and omitting some fine structure of nanoparticle vibrations with frequencies close to ), one can rewrite Eq. (12) as a PCM-like integral:
| (13) |
with being the standard bulk diamond dispersion, and
| (14) |
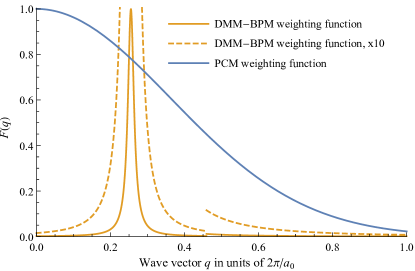
where is the averaged scattering intensity in the momentum domain, is the Heaviside function, and . The contribution from the highest modes (delta-function term) enters Eq. (14) separately from the phonon continuum (theta-function term). A comparative analysis of the kernel given by Eq. 14 and by PCM is presented in Fig. 4.
In our approach, the function plays the role of the averaged Raman scattering intensity for phonons with wave vector . On the contrary, in the PCM approach, this function is assumed to be the convolution of the phonon amplitude envelope Fourier image. Furthermore, in our theory the two-component function is significantly sharper than the Gaussian function used in the PCM, due to the assumption of hard boundaries of particles (see Fig. 4).
Formulas (11) and (12) constitute our main result in -representation, whereas formulas (13) and (14) are the same in -representation (PCM-like). They can be directly utilized for calculation of Raman spectra of arbitrary-sized nanodiamonds.
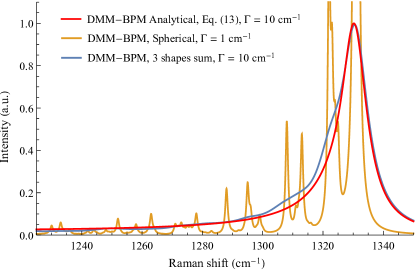
Fig. 5 shows the Raman spectra of a 4.5 nm spherical nanodiamond obtained with Eq. (5) and cm-1: the sum of three RS for 4.5 nm particles (sphere, cube, and truncated octahedron) with cm-1 and the spectrum obtained using Eq. (13) with cm-1. First, we see the pronounced comb-like structure of the spectrum for smallest even for substantially large 4.5 nm particles. Second, taking various nanoparticle shapes and introducing broader result in effective averaging of the above-mentioned spectrum. Third, we see that the analytical formula Eq. (13) reproduces very well the result of exact DMM-BPM. Therefore, Fig. 5 demonstrates that our analytical approach is very useful for the treatment of mixtures of differently shaped nanoparticles.
To conclude this subsection, we note that for nanoparticle powder with a broad size distribution one should derive the RS via summation over particle sizes:
| (15) |
IV Comparing with experiment
In order to verify our theory, let us consider recent scrupulous experimental measurements of nanodiamond RS accompanied by the analysis of particle size distributions stehlik2015size ; stehlik2016high ; shenderova2011nitrogen .
We calculate numerically the RS of nanoparticles within the framework of the exact DMM-BPM using the size distribution taken from Fig. 1(e) of Ref. stehlik2016high (red curve in our Fig. 6). This distribution contains particles from 0.6 nm to 3.1 nm with a maximum around 1.4 nm; for each particle size, we consider three geometric shapes (spheres, cubes and truncated octahedra). Further, in Fig. 6 we demonstrate the original experimental RS (black dots) from Ref. stehlik2016high with the peak position at 1324 cm-1 as well as the fit of these data that utilizes the PCM. The correctness of the PCM parameters used here is justified by the complete reproduction of the RS plots within the Yoshikawa (Fig. 8 of Ref. stehlik2015size , nm) and Ager (Fig. 2(a) of Ref. osswald2009phonon ) models, respectively.

From Fig. 6, we see a very good agreement between our calculations and the experimental data of Ref. stehlik2016high (except for the underestimation of the shoulder magnitude). The PCM spectra are drastically different from both ours and Ref.stehlik2016high results; they are unable to fit the experimental data for small nanoparticles. Furthermore, our peak position (1320 cm-1) is much closer to the experimental value (1324 cm-1) than that of the PCM (1260 - 1300 cm-1). According to Fig. 1, the peak downshift equal to 13 cm-1 corresponds to 2 nm nanoparticles, which matches the mean value of the size distribution. We use cm-1 for DMM-BPM and PCM with Ager dispersion, and cm-1 for PCM with Yoshikawa dispersion (see also Eq. (4) in Ref. osswald2009phonon ).
Next, in the experiment of Ref. stehlik2015size , the size distribution contains larger nanoparticles (up to 10 nm). Therefore, it is tempting to employ the analytical approach of our Eq. (13). It is depicted in Fig. 7 by the red curve. The MSY18-O1 sample Raman spectrum from Fig. 8 of Ref. stehlik2015size is plotted in Fig. 7 using black dots, together with PCM realization with Ager and Yoshikawa dispersions. The width cm -1 is taken for analytical DMM-BPM approach and PCM with Ager dispersion. For Yoshikawa dispersion, is taken as previously.
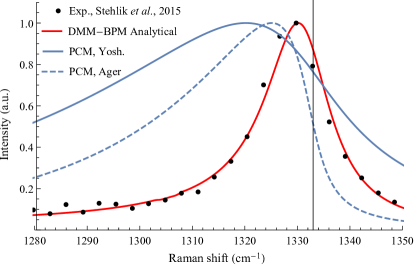
Fig. 7 demonstrates an excellent agreement between our theory in analytical form and the experiment. In particular, there are no problems with the shoulder description as it occurred for smaller particles. The PCM is working better than for smaller particles, but the quality of the fit is still far from being acceptable. Experimental peak position is 1329.6 cm-1, while the developed theory predicts 1330.3 cm-1.
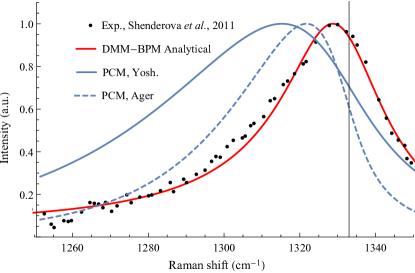
We arrive to similar conclusions analyzing the data of Ref. shenderova2011nitrogen . Again, DMM-BPM is applied on the analytical level of Eq. (13). We examine the experimental Raman spectrum of ND-TNT/RDXd sample. The authors of Ref. shenderova2011nitrogen point out that XRD gives 4 nm for mean nanoparticle size and HRTEM yields 3-6 nm for width of the distribution; however, the entire histogram is not presented. In order to mimic the data of Ref. shenderova2011nitrogen we artificially construct a normal distribution with FWHM = 1 nm centered at 4 nm. We choose cm-1 for analytical DMM-BPM approach and PCM with Ager dispersion. For PCM with Yoshikawa dispersion, is taken as previously.
The impressive success of DMM-BPM theory as compared to the PCM in fitting the experimental data of Ref. shenderova2011nitrogen is drawn in Fig. 8.
It worth mentioning, that the use of Ager phonon dispersion with lower coefficient leads to the Raman peak downshift approximately 1.5 times smaller with respect to Yoskikawa dispersion.
The analysis of this subsection clearly demonstrates the advantages of our theory in the interpretation of the experimental data, especially in the range of small nanoparticles, where the PCM evidently fails.
V Discussion and conclusion
V.1 Discussion
The developed exact DMM-BPM theory is based on a microscopic description of vibrational properties of the system and is free of nonphysical adjustable parameters. The fitting parameter , which we use in our calculations, has a clear physical meaning of a phonon linewidth. It needs further microscopic clarification OurPhononDamping .
The DMM-BPM provides the solid ground for a very simple analytical version. Moreover, the exact DMM-BPM is especially useful for the treatment of small nanoparticles, for which the PCM is not applicable and the only competitor of our method is the completely numerical ab-initio methods.
Furthermore, the developed analytical formulation of the DMM-BPM theory explains the shapes of nanodiamond RS and their key features from a new point of view. According to this view, the spectra are the superpositions of two contributions. The first contribution is due to the highest nanoparticle vibration eigenmodes, and the second one, stemming from a quasicontinuum, provides the structure of a shoulder of RS.
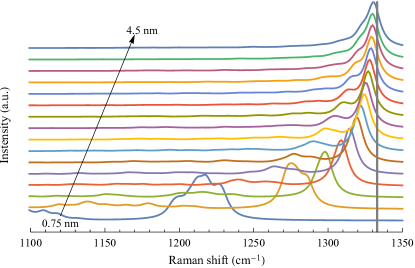
Due to its dispersion, the optical phonon with the maximal energy has a maximal wavelength, which is of the order of the nanoparticle size. This unambiguously connects the main peak position with the size of the particle, see Fig. 1. With decreasing the size, the phonon energy decreases and the main Raman peak becomes sharper and shifts down. This process is schematically depicted in Fig. 9.
Despite the fact that a single crystallite RS consists of multiple narrow peaks, averaging over particle shapes and sizes as well as taking into account the intrinsic phonon damping leads to smoothing of spectra for real powders, which can be seen from comparison of theoretical spectra and experimental data.
The DMM-BPM reproduces the experimental Raman spectra obtained recently with a very high accuracy. However, it requires the information about the size distribution function. On the contrary, the PCM is not able to reproduce these spectra (especially for small particles) and contains critical imperfections zi1997comparison . The developed model can be also formulated as an integral over the Brillouin zone, thus resembling the PCM with different in physical meaning and shape (non-Gaussian) and well-motivated weight function . It makes the application of our theory simple and straightforward. The DMM-BPM provides the Raman spectroscopy with a novel useful tool for nanoparticle size measurements along with DLS, XRD, HRTEM, SAXS, and AFM.
In Refs. (yoshikawa1995raman, ; aleksenskii1997diamond, ; osswald2009phonon, ; chaigneau2012laser, ) the experimental Raman spectra of nanodiamonds have been presented, providing the mean sizes of nanoparticles. However, the information about the size distribution function is not available. We believe that our theory should be successful in interpreting these experimental results (yoshikawa1995raman, ; aleksenskii1997diamond, ; osswald2009phonon, ; chaigneau2012laser, ), given that more detailed information will be at hands.
Meanwhile, there are some experiments that cannot be interpreted directly within the framework of the developed approach. For instance, Ref. yoshikawa1995raman reports a 10 cm-1 downshift for 4.3 nm nanodiamonds, measured by XRD, while our model yields a twice smaller value. This phenomenon can be attributed to the effect discussed in Ref. chaigneau2012laser , where the Raman peak downshift 3.5 cm-1 has been reported for nanodiamonds of 9 nm size measured by DLS. The authors of Ref. chaigneau2012laser argued from HRTEM data that these 9 nm particles are actually the aggregates of two or three primary units, giving 3-6 nm for their sizes. However, this speculation is out of scope of our study.
Finally, the distorted and partly amorphous diamond surface can contribute to the shoulder in RS between 1100 cm-1 to 1250 cm-1 ferrari2004raman ; korepanov2017carbon , because there are evidences of its changes upon nanoparticle oxidation stehlik2015size ; osswald2009phonon . The amorphous phase with an intermediate sp3-x hybridization on the nanodiamond surface can also contribute to the Raman signal as sp2 band at 1600 cm-1. Accounting for the nanoparticle surface reconstruction and amorphization is also beyond the scope of the present work.
V.2 Conclusion
We propose a novel theory of Raman scattering in crystalline nanoparticles, free of adjustable parameters and unphysical assumptions. This theory consists of two ingredients, namely the dynamical matrix method and the bond polarization model (DMM-BPM approach). The theory allows a simple analytical formulation for large enough ( nm in diameter) particles. We calculate the nanodiamond Raman spectra and find very good to excellent agreement between our theory and the available experimental data, especially in the range of parameters where the commonly used phonon confinement model (PCM) fails.
Acknowledgements.
The contribution to the study conducted by S.V.K. was funded by RFBR according to the research project 18-32-00069. We acknowledge the support of the project ”Quantum Fluids of Light” (ANR-16-CE30-0021). O.I.U. thanks for financial support the Skolkovo Foundation (grant agreement for Russian educational and scientific organisation no.7 dd. 19.12.2017) and Skolkovo Institute of Science and Technology (General agreement no. 3663-MRA dd. 25.12.2017). A.V.S. acknowledges the computational grant G60-8 from the Interdisciplinary Centre for Mathematical and Computational Modeling (ICM) in Warsaw. We are gratefully indebted to Guillaume Malpuech for fruitful discussions and attention to work.Appendix A Polarization tensor in BPM
Due to the main assumption of the empirical BPM, the nanoparticle electronic polarizability can be expressed as a sum of individual bond polarizabilities. Furthermore, the bond polarizability is assumed to be the function of bond length and does not depend on chemical environment. The explicit formula includes isotropic and anisotropic parts,
| (16) |
where and are the Cartesian coordinates, and are the polarizability parameters. The intensity of the first-order Raman scattering reads:
| (17) |
Here, and are the polarizations of incident and scattered light, respectively, is the Bose-Einstein occupation number for -th phonon mode with frequency . The tensor can be expressed via the electronic polarizability derivatives with respect to the real space atomic displacements as follows:
| (18) |
where enumerates all the atoms in a nanoparticle and is the eigenvector of the dynamical matrix eigenproblem (1). After some calculations, Eqs. (16) and (18) yield
| (19) | |||||
where denote the bonds of the -th atom, is the unit vector along the bond , and and are the radial derivatives of polarizability parameters.
Appendix B Active and silent modes
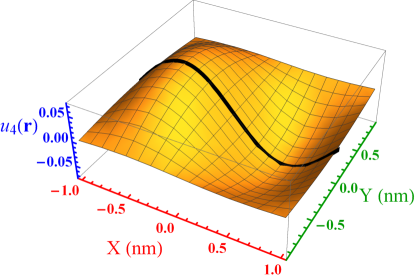
Within the BPM (See Appendix A) the polarizability tensor is the superposition of individual bond polarizabilities summed up over the nanoparticle volume. The latter ones are determined by the phonon wavefunctions. In Fig. 10 (upper panel), we plot the spatial structure of the 1st eigenmode of a 2.5 nm cubic nanoparticle as an example of a “Raman active” mode. It can be approximated by the envelope function , which is evidently positive, thus its integral over the nanoparticle volume yields a large positive contribution to the Raman intensity. On the other hand, the 4th eigenmode depicted in Fig. 10(b) is an example of a “Raman silent” mode, as it changes its sign across the crystal and has a node near the crystal center. With a good accuracy, it can be approximated by , so its spatial integral tends to zero. Similar analysis can be performed for any other mode. This justifies our segregation of phonon eigenmodes into Raman active and Raman silent parts.
References
- (1) V. N. Mochalin, O. Shenderova, D. Ho, and Y. Gogotsi, “The properties and applications of nanodiamonds,” Nature nanotechnology, vol. 7, no. 1, pp. 11–23, 2012.
- (2) M. Veldhorst, J. Hwang, C. Yang, A. Leenstra, B. de Ronde, J. Dehollain, J. Muhonen, F. Hudson, K. Itoh, A. Morello, et al., “An addressable quantum dot qubit with fault-tolerant control-fidelity,” Nature nanotechnology, vol. 9, no. 12, pp. 981–985, 2014.
- (3) Y.-C. Chen, P. S. Salter, S. Knauer, L. Weng, A. C. Frangeskou, C. J. Stephen, S. N. Ishmael, P. R. Dolan, S. Johnson, B. L. Green, G. W. Morley, M. E. Newton, J. G. Rarity, M. J. Booth, and J. M. Smith, “Laser writing of coherent colour centres in diamond,” Nat Photon, vol. 11, pp. 77–80, Feb 2017. Letter.
- (4) J.-H. Park, L. Gu, G. Von Maltzahn, E. Ruoslahti, S. N. Bhatia, and M. J. Sailor, “Biodegradable luminescent porous silicon nanoparticles for in vivo applications,” Nature materials, vol. 8, no. 4, p. 331, 2009.
- (5) S. E. Kim, L. Zhang, K. Ma, M. Riegman, F. Chen, I. Ingold, M. Conrad, M. Z. Turker, M. Gao, X. Jiang, et al., “Ultrasmall nanoparticles induce ferroptosis in nutrient-deprived cancer cells and suppress tumour growth,” Nature nanotechnology, vol. 11, no. 11, p. 977, 2016.
- (6) G. Wang, M. Glazov, C. Robert, T. Amand, X. Marie, and B. Urbaszek, “Double resonant raman scattering and valley coherence generation in monolayer wse 2,” Physical review letters, vol. 115, no. 11, p. 117401, 2015.
- (7) T. P. Devereaux and R. Hackl, “Inelastic light scattering from correlated electrons,” Reviews of modern physics, vol. 79, no. 1, p. 175, 2007.
- (8) M. Yoshikawa, Y. Mori, M. Maegawa, G. Katagiri, H. Ishida, and A. Ishitani, “Raman scattering from diamond particles,” Applied Physics Letters, vol. 62, no. 24, pp. 3114–3116, 1993.
- (9) M. Yoshikawa, Y. Mori, H. Obata, M. Maegawa, G. Katagiri, H. Ishida, and A. Ishitani, “Raman scattering from nanometer-sized diamond,” Applied Physics Letters, vol. 67, no. 5, pp. 694–696, 1995.
- (10) S. Osswald, V. Mochalin, M. Havel, G. Yushin, and Y. Gogotsi, “Phonon confinement effects in the raman spectrum of nanodiamond,” Physical Review B, vol. 80, no. 7, p. 075419, 2009.
- (11) Y. Gao, X. Zhao, P. Yin, and F. Gao, “Size-dependent raman shifts for nanocrystals,” Scientific reports, vol. 6, 2016.
- (12) R. Bahariqushchi, S. Gündoğdu, and A. Aydinli, “Correlation of tem data with confined phonons to determine strain and size of ge nanocrystals in embedded sixny matrix,” Superlattices and Microstructures, 2017.
- (13) A. K. Arora, M. Rajalakshmi, T. Ravindran, and V. Sivasubramanian, “Raman spectroscopy of optical phonon confinement in nanostructured materials,” Journal of Raman Spectroscopy, vol. 38, no. 6, pp. 604–617, 2007.
- (14) H. Richter, Z. Wang, and L. Ley, “The one phonon raman spectrum in microcrystalline silicon,” Solid State Communications, vol. 39, no. 5, pp. 625–629, 1981.
- (15) I. Campbell and P. M. Fauchet, “The effects of microcrystal size and shape on the one phonon raman spectra of crystalline semiconductors,” Solid State Communications, vol. 58, no. 10, pp. 739–741, 1986.
- (16) J. Zi, K. Zhang, and X. Xie, “Comparison of models for raman spectra of si nanocrystals,” Physical Review B, vol. 55, no. 15, p. 9263, 1997.
- (17) D. Zhang and R. Zhang, “Signature of nanodiamond in raman spectra: a density functional theoretical study,” The Journal of Physical Chemistry B, vol. 109, no. 18, pp. 9006–9013, 2005.
- (18) J. Filik, J. N. Harvey, N. Allan, P. May, J. Dahl, S. Liu, and R. Carlson, “Raman spectroscopy of nanocrystalline diamond: An ab initio approach,” Physical Review B, vol. 74, no. 3, p. 035423, 2006.
- (19) W. Li, S. Irle, and H. A. Witek, “Convergence in the evolution of nanodiamond raman spectra with particle size: A theoretical investigation,” ACS nano, vol. 4, no. 8, pp. 4475–4486, 2010.
- (20) B. Chase, N. Herron, and E. Holler, “Vibrational spectroscopy of fullerenes (c60 and c70). temperature dependant studies,” The Journal of Physical Chemistry, vol. 96, no. 11, pp. 4262–4266, 1992.
- (21) G. Faraci, S. Gibilisco, P. Russo, A. R. Pennisi, and S. La Rosa, “Modified raman confinement model for si nanocrystals,” Physical Review B, vol. 73, no. 3, p. 033307, 2006.
- (22) W. Ke, X. Feng, and Y. Huang, “The effect of si-nanocrystal size distribution on raman spectrum,” Journal of Applied Physics, vol. 109, no. 8, p. 083526, 2011.
- (23) A. Valentin, J. Sée, S. Galdin-Retailleau, and P. Dollfus, “Study of phonon modes in silicon nanocrystals using the adiabatic bond charge model,” Journal of Physics: Condensed Matter, vol. 20, no. 14, p. 145213, 2008.
- (24) V. I. Korepanov and H.-o. Hamaguchi, “Quantum-chemical perspective of nanoscale raman spectroscopy with the three-dimensional phonon confinement model,” Journal of Raman Spectroscopy, vol. 48, no. 6, pp. 842–846, 2017.
- (25) A. Jorio, M. Dresselhaus, R. Saito, and G. Dresselhaus, “Raman spectroscopy in graphene related systems. 2011.”
- (26) D. Snoke and M. Cardona, “A bond polarizability model for the c60 raman spectrum,” Solid state communications, vol. 87, no. 2, pp. 121–126, 1993.
- (27) S. Guha, J. Menéndez, J. B. Page, and G. B. Adams, “Empirical bond polarizability model for fullerenes,” Phys. Rev. B, vol. 53, pp. 13106–13114, May 1996.
- (28) J. Menéndez and J. B. Page, “Vibrational spectroscopy of c60,” in Light Scattering in Solids VIII, pp. 27–95, Springer, 2000.
- (29) W. Cheng and S.-F. Ren, “Calculations on the size effects of raman intensities of silicon quantum dots,” Physical Review B, vol. 65, no. 20, p. 205305, 2002.
- (30) M. Born and K. Huang, Dynamical theory of crystal lattices. Clarendon press, 1954.
- (31) A. Maradudin, E. Montroll, G. Weiss, and I. Ipatova, “Theory of lattice dynamics in the harmonic approximation (academic, new york, 1971),” Google Scholar, p. 582.
- (32) P. Keating, “Effect of invariance requirements on the elastic strain energy of crystals with application to the diamond structure,” Physical Review, vol. 145, no. 2, p. 637, 1966.
- (33) R. M. Martin, “Elastic properties of zns structure semiconductors,” Physical Review B, vol. 1, no. 10, p. 4005, 1970.
- (34) E. Kane, “Phonon spectra of diamond and zinc-blende semiconductors,” Physical Review B, vol. 31, no. 12, p. 7865, 1985.
- (35) S. Steiger, M. Salmani-Jelodar, D. Areshkin, A. Paul, T. Kubis, M. Povolotskyi, H.-H. Park, and G. Klimeck, “Enhanced valence force field model for the lattice properties of gallium arsenide,” Physical Review B, vol. 84, no. 15, p. 155204, 2011.
- (36) E. Anastassakis, A. Cantarero, and M. Cardona, “Piezo-raman measurements and anharmonic parameters in silicon and diamond,” Physical Review B, vol. 41, no. 11, p. 7529, 1990.
- (37) J. Warren, J. Yarnell, G. Dolling, and R. Cowley, “Lattice dynamics of diamond,” Physical Review, vol. 158, no. 3, p. 805, 1967.
- (38) M. Schwoerer-Böhning, A. Macrander, and D. Arms, “Phonon dispersion of diamond measured by inelastic x-ray scattering,” Physical review letters, vol. 80, no. 25, p. 5572, 1998.
- (39) E. Burkel, “Determination of phonon dispersion curves by means of inelastic x-ray scattering,” Journal of Physics: Condensed Matter, vol. 13, no. 34, p. 7627, 2001.
- (40) J. Kulda, H. Kainzmaier, D. Strauch, B. Dorner, M. Lorenzen, and M. Krisch, “Overbending of the longitudinal optical phonon branch in diamond as evidenced by inelastic neutron and x-ray scattering,” Physical Review B, vol. 66, no. 24, p. 241202, 2002.
- (41) U. Monteverde, J. Pal, M. Migliorato, M. Missous, U. Bangert, R. Zan, R. Kashtiban, and D. Powell, “Under pressure: control of strain, phonons and bandgap opening in rippled graphene,” Carbon, vol. 91, pp. 266–274, 2015.
- (42) J. W. Ager, D. K. Veirs, and G. M. Rosenblatt, “Spatially resolved raman studies of diamond films grown by chemical vapor deposition,” Phys. Rev. B, vol. 43, pp. 6491–6499, Mar 1991.
- (43) M. Chaigneau, G. Picardi, H. A. Girard, J.-C. Arnault, and R. Ossikovski, “Laser heating versus phonon confinement effect in the raman spectra of diamond nanoparticles,” Journal of Nanoparticle Research, vol. 14, no. 6, p. 955, 2012.
- (44) J. Martin and S. Montero, “Raman intensities of ethane and deuterated derivatives,” The Journal of Chemical Physics, vol. 80, no. 10, pp. 4610–4619, 1984.
- (45) A. G. Yashenkin, O. I. Utesov, and S. V. Koniakhin unpublished.
- (46) R. M. Martin and F. L. Galeener, “Correlated excitations and raman scattering in glasses,” Physical Review B, vol. 23, no. 6, p. 3071, 1981.
- (47) R. Elliott, J. Krumhansl, and P. Leath, “The theory and properties of randomly disordered crystals and related physical systems,” Reviews of modern physics, vol. 46, no. 3, p. 465, 1974.
- (48) C. Wang and R. Barrio, “Theory of the raman response in fibonacci superlattices,” Physical review letters, vol. 61, no. 2, p. 191, 1988.
- (49) P. Alfaro-Calderón, M. Cruz-Irisson, and C. Wang-Chen, “Theory of raman scattering by phonons in germanium nanostructures,” Nanoscale Research Letters, vol. 3, no. 2, p. 55, 2008.
- (50) W. Research, “Mathematica 8.0,” 2010.
- (51) M. J. Frisch, G. W. Trucks, H. B. Schlegel, G. E. Scuseria, M. A. Robb, J. R. Cheeseman, G. Scalmani, V. Barone, B. Mennucci, G. A. Petersson, H. Nakatsuji, M. Caricato, X. Li, H. P. Hratchian, A. F. Izmaylov, J. Bloino, G. Zheng, J. L. Sonnenberg, M. Hada, M. Ehara, K. Toyota, R. Fukuda, J. Hasegawa, M. Ishida, T. Nakajima, Y. Honda, O. Kitao, H. Nakai, T. Vreven, J. A. Montgomery, J. E. Peralta, F. Ogliaro, M. Bearpark, J. J. Heyd, E. Brothers, K. N. Kudin, V. N. Staroverov, R. Kobayashi, J. Normand, K. Raghavachari, A. Rendell, J. C. Burant, S. S. Iyengar, J. Tomasi, M. Cossi, N. Rega, J. M. Millam, M. Klene, J. E. Knox, J. B. Cross, V. Bakken, C. Adamo, J. Jaramillo, R. Gomperts, R. E. Stratmann, O. Yazyev, A. J. Austin, R. Cammi, C. Pomelli, J. W. Ochterski, R. L. Martin, K. Morokuma, V. G. Zakrzewski, G. A. Voth, P. Salvador, J. J. Dannenberg, S. Dapprich, A. D. Daniels, Farkas, J. B. Foresman, J. V. Ortiz, J. Cioslowski, and D. J. Fox, “Gaussian 09, Revision B.01,” 2009.
- (52) J. J. Stewart, “Optimization of parameters for semiempirical methods ii. applications,” Journal of computational chemistry, vol. 10, no. 2, pp. 221–264, 1989.
- (53) A. Meilakhs and S. Koniakhin, “New explanation of raman peak redshift in nanoparticles,” Superlattices and Microstructures, vol. 110, pp. 319–323, 2017.
- (54) This picture partly matches the approach of Zi et. al. in Ref. zi1997comparison and of Faraci et. al. in Ref. faraci2006modified , where the phonon amplitude envelope in the PCM was taken as a sphere eigenfunction. This assumption, however, is not correct because all the sphere eigenfucntions are the phonon amplitudes itself and do not contain any oscillations with higher wave vectors.
- (55) O. I. Utesov, S. V. Koniakhin, and A. G. Yashenkin unpublished.
- (56) P. Pavone, K. Karch, O. Schütt, D. Strauch, W. Windl, P. Giannozzi, and S. Baroni, “Ab initio,” Phys. Rev. B, vol. 48, pp. 3156–3163, Aug 1993.
- (57) A. Prokofiev, A. Poddubny, and I. Yassievich, “Phonon decay in silicon nanocrystals: Fast phonon recycling,” Physical Review B, vol. 89, no. 12, p. 125409, 2014.
- (58) R. Nemanich, S. Solin, and R. M. Martin, “Light scattering study of boron nitride microcrystals,” Physical Review B, vol. 23, no. 12, p. 6348, 1981.
- (59) S. Stehlik, M. Varga, M. Ledinsky, V. Jirasek, A. Artemenko, H. Kozak, L. Ondic, V. Skakalova, G. Argentero, T. Pennycook, J. C. Meyer, A. Fejfar, A. Kromka, and B. Rezek, “Size and purity control of hpht nanodiamonds down to 1 nm,” The Journal of Physical Chemistry C, vol. 119, no. 49, pp. 27708–27720, 2015. PMID: 26691647.
- (60) S. Stehlik, M. Varga, M. Ledinsky, D. Miliaieva, H. Kozak, V. Skakalova, C. Mangler, T. J. Pennycook, J. C. Meyer, A. Kromka, et al., “High-yield fabrication and properties of 1.4 nm nanodiamonds with narrow size distribution,” Scientific Reports, vol. 6, p. 38419, 2016.
- (61) O. A. Shenderova, I. I. Vlasov, S. Turner, G. Van Tendeloo, S. B. Orlinskii, A. A. Shiryaev, A. A. Khomich, S. N. Sulyanov, F. Jelezko, and J. Wrachtrup, “Nitrogen control in nanodiamond produced by detonation shock-wave-assisted synthesis,” The Journal of Physical Chemistry C, vol. 115, no. 29, pp. 14014–14024, 2011.
- (62) A. Aleksenskii, M. Baidakova, A. Y. Vul’, V. Y. Davydov, and Y. A. Pevtsova, “Diamond-graphite phase transition in ultradisperse-diamond clusters,” Physics of the Solid State, vol. 39, no. 6, pp. 1007–1015, 1997.
- (63) A. C. Ferrari and J. Robertson, “Raman spectroscopy of amorphous, nanostructured, diamond–like carbon, and nanodiamond,” Philosophical Transactions of the Royal Society of London A: Mathematical, Physical and Engineering Sciences, vol. 362, no. 1824, pp. 2477–2512, 2004.
- (64) V. I. Korepanov, H.-o. Hamaguchi, E. Osawa, V. Ermolenkov, I. K. Lednev, B. J. Etzold, O. Levinson, B. Zousman, C. P. Epperla, and H.-C. Chang, “Carbon structure in nanodiamonds elucidated from raman spectroscopy,” Carbon, vol. 121, pp. 322–329, 2017.