Hard X-ray View of HCG 16 (Arp 318)
Abstract
We report the hard X-ray (3–50 keV) view of the compact group HCG 16 (Arp 318) observed with Nuclear Spectroscopic Telescope Array (NuSTAR). NGC 838 and NGC 839 are undetected at energies above 8 keV, showing no evidence of heavily obscured active galactic nuclei (AGNs). This confirms that these are starburst-dominant galaxies as previously suggested. We perform a comprehensive broadband (0.3–50 keV) X-ray spectral analysis of the interacting galaxies NGC 833 and NGC 835, using data of NuSTAR, Chandra, and XMM-Newton observed on multiple epochs from 2000 to 2015. NuSTAR detects the transmitted continua of low-luminosity active galactic nuclei (LLAGNs) in NGC 833 and NGC 835 with line-of-sight column densities of cm-2 and intrinsic 2–10 keV luminosities of erg s-1. The iron-K to hard X-ray luminosity ratios of NGC 833 and NGC 835 suggest that their tori are moderately developed, which may have been triggered by the galaxy interactions. We find that NGC 835 underwent long-term variability in both intrinsic luminosity (by a factor of 5) and absorption (by cm-2). We discuss the relation between the X-ray and total infrared luminosities in local LLAGNs hosted by spiral galaxies. The large diversity in their ratios is consistent with the the general idea that the mass accretion process in the nucleus and the star forming activity in the disk are not strongly coupled, regardless of the galaxy environment.
Subject headings:
galaxies: active – galaxies: individual (HCG 16) – X-rays: galaxies1. Introduction
It is generally believed that galactic bulges and the supermassive black holes (SMBHs) in their centers “co-evolve” (see Kormendy & Ho 2013 for a review), although a detailed understanding of this process is still missing. One of the mechanisms responsible for the co-evolution could be major mergers, which cause vigorous starburst activity together with rapid mass accretion onto SMBHs (e.g., Hopkins et al., 2008). During this accreting phases, systems would be observed as an Active Galactic Nuclei (AGNs), and emit strongly in the X-ray band. In the late stages of the merger process, the nuclei are expected to be heavily obscured by gas and dust, and even become Compton-thick, with hydrogen column densities of cm-2. To detect such hidden AGNs in merging galaxies, hard X-ray observations at energies above 10 keV are a promising approach, being the least biased against heavy obscuration. In fact, recent studies using Nuclear Spectroscopic Telescope Array (NuSTAR; Harrison et al. 2013), which achieve the best sensitivity above 10 keV to date, have revealed the presence of heavily obscured AGNs in many interacting galaxies in the local Universe (e.g., Ricci et al. 2017).
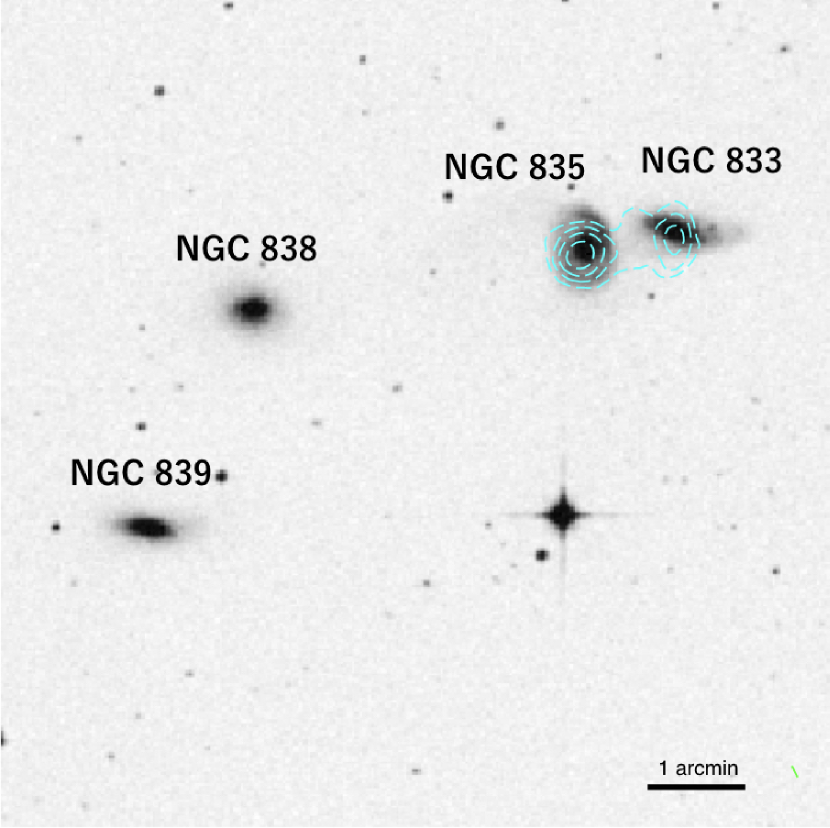
HCG 16 (Hickson, 1982), also known as Arp 318, is one of the nearest compact groups of galaxies and hence an ideal target to study galaxy interactions and its influences on AGN activities. It consists of seven member galaxies, which include the central four spiral galaxies originally identified by Hickson (1982), NGC 833, NGC 835, NGC 838, and NGC 839. Verdes-Montenegro et al. (2001) and Gallagher et al. (2008) determined that HGC 16 is an intermediate evolutionary stage of compact groups. Table 1 summarizes the basic properties of the four major galaxies in HCG 16. Figure 1 displays the Digitized Sky Survey R-band image of the central region of HCG 16. NGC 833 is lopsided because of a recent interaction with NGC 835, which has a east tidal tail toward NGC 838 (Konstantopoulos et al. 2013). Véron-Cetty & Véron (2010) optically classified NGC 833 as a LINER, and NGC 835 as a Seyfert 2. NGC 838 is included in the sample of the Great Observatories All-sky LIRG Survey (GOALS; Armus et al. 2009), and is classified as a starburst galaxy (Sanders et al. 2003; Bitsakis et al. 2014). NGC 839 is optically classified as a LINER. These four galaxies are luminous in the mid-to-far infrared band, indicative of powerful energy sources (starburst and/or AGN), and have been investigated with Spitzer and Herschel. Following an earlier work by Gallagher et al. (2008), who systematically analyzed the Spitzer photometric data of 12 nearby HCGs, Bitsakis et al. (2014) estimated the star formation rates and the 8–1000 m infrared luminosities of the individual galaxies in HCG 16 by fitting the UV to submillimeter spectral energy distributions (SEDs) obtained with GALEX, SDSS, Spitzer, and Herschel. These luminosities are summarized in Table 1.
| Name | HCG Name | Morphology | Nuclear classification | SFR | log | ||
|---|---|---|---|---|---|---|---|
| (J2000) | (J2000) | yr-1] | [] | ||||
| (1) | (2) | (3) | (3) | (4) | (5) | ||
| NGC 833 | HCG 16B | Sab | LINER | 02h09m20.8s | -1007′59′′ | 0.04 | 9.74 |
| NGC 835 | HCG 16A | SBab | Seyfert 2 | 02h09m24.6s | -1008′09′′ | 3.10 | 10.76 |
| NGC 838 | HCG 16C | Im | Starburst | 02h09m38.5s | -1008′48′′ | 11.5 | 11.09 |
| NGC 839 | HCG 16D | Im | LINER | 02h09m42.9s | -1011′03′′ | 1.16 | 10.94 |
Note. — (1) The galaxy morphology based on Hickson et al. (1989). (2) The classification of the nucleus based on Gallagher et al. (2008). (3) The coordinates (R.A. and Dec.). (4) The star formation rates estimated by Bitsakis et al. (2014). (5) The 8–1000 m infrared luminosities based on the Herschel observations (Bitsakis et al. 2014).
X-ray data provide unique insights on the dominant energy sources of infrared galaxies and the properties of their AGNs. The X-ray emission from the HGC 16 system was first detected by the Einstein Observatory (Bahcall et al. 1984). Using X-ray Multi-Mirror Mission (XMM-Newton, Jansen et al. 2001), Turner et al. (2001b) discovered obscured AGNs in NGC 833, NGC 835, and NGC 839, which co-exist with starburst activities. They found no evidence for AGN in NGC 838, and hence classified it as a pure starburst galaxy. Chandra observations of HCG 16 have been conducted five times between 2000 and 2013 (see Table 2), including the first one reported by González-Martín et al. (2006). Analyzing the spectra of all the five Chandra observations, O’Sullivan et al. (2014) confirmed the presence of obscured AGNs in NGC 833 and NGC 835, whereas they concluded that NGC 838 and NGC 839 are starburst-dominated galaxies. Although the presence of a heavily obscured and/or faint AGN in NGC 839 was not excluded, they suggested that its hard X-ray emission is likely to arise from high mass X-ray binaries (HMXBs). Also, O’Sullivan et al. (2014) found that the X-ray flux of NGC 835 increased compared with the 2000 and 2008 observations, mainly due to changes in the luminosity. Focusing on the long-term time variability of NGC 835, González-Martín et al. (2016) presented more detailed studies with Chandra. They compared the X-ray luminosities with the mid-infrared ones obtained from the high spatial resolution CanariCam/GTC data and concluded that the X-ray variability is due to a change in the column density, and not to variability of the intrinsic flux.
Thus, there still remain unsettled issues on X-ray properties of the member galaxies in HCG 16. Sensitive hard X-ray data above 8 keV are useful to tackle these problems, and allow us to determine the AGN intrinsic luminosity and absorption with the best accuracy. In this paper, we report the results of the first hard X-ray ( keV) imaging observation of HCG 16 performed with NuSTAR in 2015, which covered the four major galaxies. We particularly focus on the broadband X-ray spectral analysis of NGC 833 and NGC 835 including the Chandra and XMM-Newton data to best understand the nature of their AGNs. The paper is organized as follows. In Section 2, we present the observations and data reduction. Section 3 describes the details of the broadband X-ray spectral analysis of NGC 833 and NGC 835. Section 4 presents new constraints from the NuSTAR observation on the nature of NGC 838 and NGC 839. We discuss the implications of our results in Section 5 and summarize our findings in Section 6. Throughout the paper, we adopt a distance of 34 Mpc (González-Martín et al., 2016) for all the member galaxies, which corresponds to a redshift of =0.007939 for the cosmological parameters km s-1 Mpc-1, , and . We assume the solar abundances by Anders & Grevesse (1989) and the photoelectric absorption cross-sections by Balucinska-Church & McCammon (1992). All the uncertainties in spectral parameters correspond to the 90% confidence level for a single parameter of interest.
2. Observations and Data Reduction
Table 2 gives the log of of all the NuSTAR, Chandra, and XMM-Newton observations of HCG 16 performed up to date. The details of the observations and the data reduction procedures of each satellite are described below. We analyze the NuSTAR, Chandra, and XMM-Newton data of NGC 833 and NGC 835 to perform simultaneous spectral fitting (Section 3). Since NGC 838 and NGC 839 are not detected by NuSTAR (Section 2.1), we do not analyze the Chandra and XMM-Newton data of these galaxies, whose results were already reported in detail by O’Sullivan et al. (2014) and Turner et al. (2001b).
| Instrument | Observation ID | Start Time | End Time | Exposure | |
|---|---|---|---|---|---|
| [UT] | [UT] | [ks] | |||
| (1) | (1) | (2) | |||
| NuSTAR | FPMA, FPMB | 60061346002 | 2015 September 13 05:11 | 2015 September 13 15:56 | 18.1/18.4 |
| Chandra | ACIS | 15667 | 2013 July 21 10:58 | 2013 July 22 04:02 | 58.3 |
| 15666 | 2013 July 18 21:06 | 2013 July 19 06:15 | 29.7 | ||
| 15181 | 2013 July 16 04:49 | 2013 July 16 19:28 | 49.5 | ||
| 923 | 2000 November 16 21:47 | 2000 November 01:58 | 12.6 | ||
| XMM-Newton | EPIC-pn, EPIC-MOS1,2 | 0115810301 | 2000 January 23 17:30 | 2000 January 24 08:52 | 34.7/46.2/43.1 |
Note. — (1) Based on FPMA for NuSTAR and EPIC-MOS1 for XMM-Newton. (2) The exposure time of NuSTAR (FPMA/FPMA), Chandra, and XMM-Newton (EPIC-pn/EPIC-MOS1/EPIC-MOS2).
2.1. NuSTAR
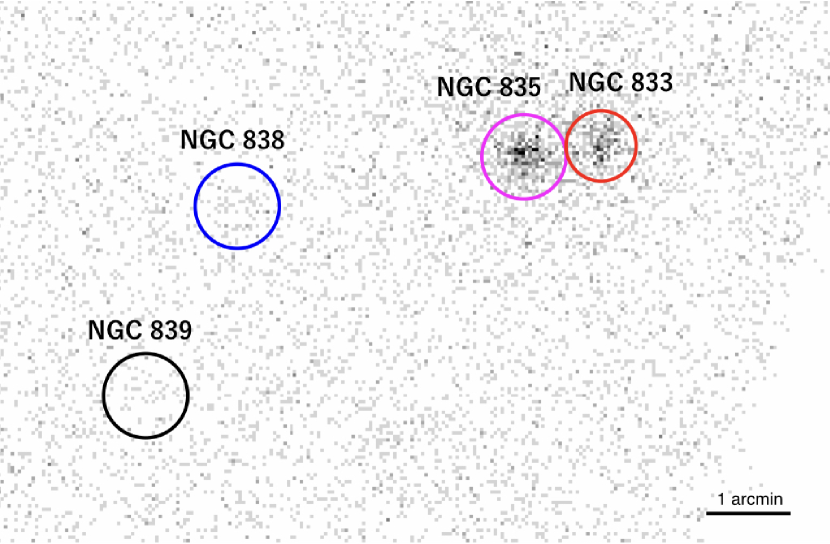
The NuSTAR mission, launched on 2012 June 13, is the first astronomical observatory that employs focusing optics in the hard X-ray band above 10 keV. It carries two co-aligned grazing incidence telescopes coupled with two focal plane modules (FPMs): FPMA and FPMB, and covers the 3–79 keV band. HCG 16 was observed by NuSTAR on 2015 September 13 for a net exposure of 36.6 ks. We reduced the data using HEAsoft version 6.19 and calibration database (CALDB) version 2016 September 22. We created calibrated event files with the nupipeline script after removing any background flares. Figure 2 displays the combined image of FPMA and FPMB in the 3-79 keV band.
Strong signals were detected from NGC 833 and NGC 835, for which we perform detailed broadband spectral analysis combining the Chandra and XMM-Newton data in Section 3. We used the nuproducts script for spectral extraction. The angular separation between NGC 833 and NGC 835 is , which is large enough to reduce the individual spectra of the two targets with NuSTAR. We selected source photon events from circular regions with radii of and for NGC 833 and NGC 835, respectively. The background (cosmic X-ray background plus non X-ray background) was taken from a source-free circular region with a radius of , and was used for all the targets. We confirmed that the flux normalizations of FPMA and FPMB spectra were consistent with each other. Thus, we co-added the spectra of FPMA and FPMB for each target. Although NGC 833 and NGC 835 are spatially well resolved by NuSTAR and their spectra are mostly separated, small contamination to one spectrum from the other is expected because of the tail of the point spread function of NuSTAR beyond . The fractions of this contamination are estimated to be % and % in the total fluxes (not including the background) contained in the NGC 833 and NGC 835 spectrum-extraction regions, respectively, by performing spectral simulations. We subtracted it as an additional background for each target.
NuSTAR failed to detect significant signals of NGC 838 and NGC 839. To evaluate the upper limits, we extracted the source spectra of these two galaxies from circular regions with a radius of . FPMA and FPMB spectra were combined using the script addascaspec. We find that 3 upper limits of the count rates in the 3–8 keV and 8–24 keV bands are respectively 0.0011 and 0.00084 counts s-1 for NGC 838, 0.00072 and 0.00061 counts s-1 for NGC 839. These upper limits are all larger than those predicted from the model adopted by O’Sullivan et al. (2014). We discuss this result in Section 4.
| Instrument | Source radius | Background radius | Counts per energy bin | Energy band | Net count rate | |
|---|---|---|---|---|---|---|
| [arcsec] | [arcsec] | [counts] | [keV] | [ count s-1] | ||
| (1) | (2) | (3) | (4) | (5) | ||
| NuSTAR | FPMs | 25 | 50 | 50 | 4.5–40 | 1.13 |
| Chandra | ACIS (2013) | 15 | 20 | 50 | 0.3–9 | 0.94 |
| ACIS (2000) | 15 | 20 | 25 | 0.75–8 | 1.93 | |
| XMM-Newton | EPIC-pn | 25 | 25 | 20 | 0.5–8.5 | 0.67 |
| EPIC-MOSs | 25 | 25 | 50 | 0.45–10 | 1.26 |
Note. — (1) The radius of the spectral extraction region for the source. (2) The radius of the spectral extraction region for the background. (3) The minimum photon counts of each spectral bin. (4) The energy band used in the spectral analysis. (5) The net count rate in this energy band after background subtraction.
| Instrument | Source radius | Background radius | Counts per energy bin | Energy band | Net count rate | |
|---|---|---|---|---|---|---|
| [arcsec] | [arcsec] | [counts] | [keV] | [ count s-1] | ||
| (1) | (2) | (3) | (4) | (5) | ||
| NuSTAR | FPMs | 30 | 50 | 50 | 4.5–49 | 1.82 |
| Chandra | ACIS (2013) | 15 | 20 | 50 | 0.5–9 | 3.18 |
| ACIS (2000) | 15 | 20 | 25 | 0.45–7 | 2.58 | |
| XMM-Newton | EPIC-pn | 25 | 25 | 50 | 0.3–7.5 | 5.49 |
| EPIC-MOSs | 25 | 25 | 50 | 0.3–8 | 1.54 |
Note. — (1)–(5) The same parameters as those of Table 3.
2.2. Chandra
HCG 16 was observed five times with the Chandra X-ray observatory (CXO; Weisskopf et al. 2002), which carries two focal plane science instruments: the High-Resolution Camera (HRC) and the Advanced CCD Imaging Spectrometer (ACIS). The four major galaxies were covered by the ACIS-S3 chip in ObsIDs 923, 15181, 15666 and 15667, whereas only NGC 835 and NGC 838 were observed in ObsID 10394. We reduced the data following the standard guidelines, using the Chandra Interactive Analysis of Observations (CIAO) version 4.8 and the latest CALDB version 4.7.2.
We utilized the script chandra_repro and specextract to produce the spectra of NGC 833 and NGC 835 for each ObsID. Checking the background light curves, we confirmed that none of the data suffered from background flares. We did not use the ObsID 10394 data (2008) for our spectral fitting, since NGC 833 was not in the field-of-view and NGC 835 was located close to the edge of the camera, with poor photon statistics available. As no significant spectral variability was found among the 3 observations carried out in July 2013, we co-added these spectra using the addascaspec task.
2.3. XMM-Newton
XMM-Newton observed HCG 16 on 2000 January 23 and 24 as a first-light observation111 We have confirmed that the first-light data can be validly reduced with the standard pipeline processing (Ehle, M., private communication). XMM-Newton carries three X-ray CCD cameras on board: one EPIC-pn (Strüder et al. 2001) and two EPIC-MOS (Turner et al. 2001a). The data were reprocessed with the Science Analysis Software (SAS) version 15.0.0 and using the Current Calibration File (CCF) of 2016 May. The pipeline scripts epproc for EPIC-pn and emproc for MOS were used to produce calibrated photon event files. We selected only PATTERN 4 and PATTERN 12 events for EPIC-pn and EPIC-MOS, respectively. We excluded data suffering from background flares when the count rates above 10 keV exceeded 2 count s-1 for EPIC-pn and 0.4 count s-1 for EPIC-MOS. The net exposures are 34.7 ks (EPIC-pn), 46.2 ks (EPIC-MOS1), and 43.1 ks (EPIC-MOS2).
The source spectra of NGC 833 and NGC 835 were extracted from circular
regions with a radius of for all the cameras. The background
spectrum was taken from a source-free region in the same CCD chip. We
created the Redistribution Matrix File (RMF) and Ancillary Response File
(ARF) with the rmfgen and arfgen task,
respectively. The source spectra, background spectra, RMFs, and ARFs of
EPIC-MOS1 and EPIC-MOS2 were merged by using the addascaspec
script.
3. Broadband Spectral Analysis of NGC 833 and NGC 835
We simultaneously analyze the broadband spectra of NGC 833 and NGC 835 observed with NuSTAR/FPMs, Chandra/ACIS, XMM-Newton/EPIC-pn, and EPIC-MOSs. We determine the energy band used for our analysis by considering the signal-to-noise ratio of each spectrum. The detailed information of the spectra (including binning and net count rate) is summarized in Tables 3 and 4 for NGC 833 and NGC 835, respectively. XSPEC 12.9.0s is utilized for spectral fitting with statistics.
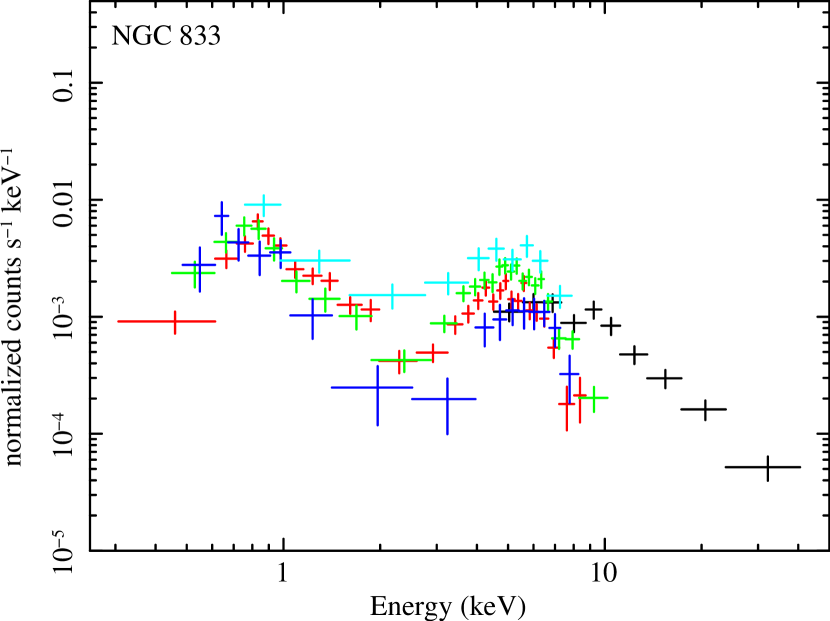
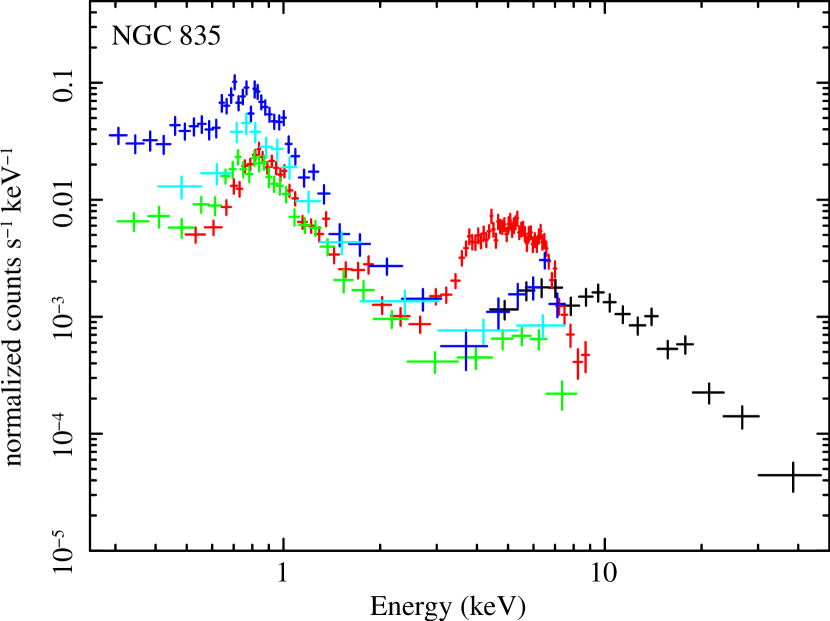
Figure 3 plots the spectra of NGC 833 and NGC 835 folded with the energy responses. To consider the Galactic absorption, we multiply phabs to all models and fix the hydrogen column density to , as estimated by Kalberla et al. (2005). Cross calibration uncertainties among different instruments are taken into account by multiplying a constant factor (const0) with respect to the FPMs and ACIS spectra222The cross-normalizations between the FPMs and ACIS transmission grating spectrosmeters are consistent within 10% according to Madsen et al. (2015)., which are taken as the calibration references in this paper. The const0 factor is left free for EPIC-pn and EPIC-MOSs.
| Note∗ | Parameter | base model | e-torus model |
|---|---|---|---|
| (1) | |||
| (2) | |||
| (3) | |||
| (4) | – | ||
| (5) | |||
| (6) | |||
| (7) | |||
| (8) | |||
| (9) | |||
| (10) | |||
| (11) | |||
| (12) | |||
| (13) | |||
| (14) | |||
| (15) | |||
| (16) | |||
| (17) | |||
| (18) | |||
| dof | 61.9 / 78 | 62.1 / 78 |
3.1. NGC 833
3.1.1 Analytical Model
Turner et al. (2001b) and O’Sullivan et al. (2014), who analyzed the XMM-Newton and Chandra spectra, respectively, found that NGC 833 has at least three components: an absorbed cutoff power law, an unabsorbed power law, and soft thermal components. We thus start from this model, which can reproduce our spectra including the NuSTAR one with /dof = 65.8/79. As a more realistic model, we also include a reflection component accompanied by an iron-K emission line, which is known to be commonly present in obscured AGNs (e.g., Nandra & Pounds 1994; Kawamuro et al. 2016a). The fit is improved (/dof = 61.9/78) at the 95% confidence level with an F-test. The adopted model in the XSPEC terminology is expressed as:
| (1) | |||||
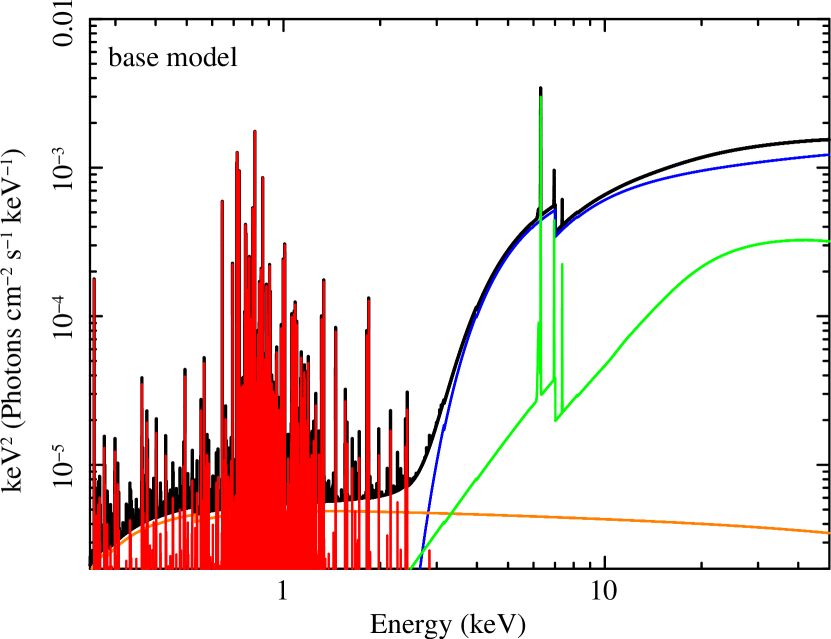
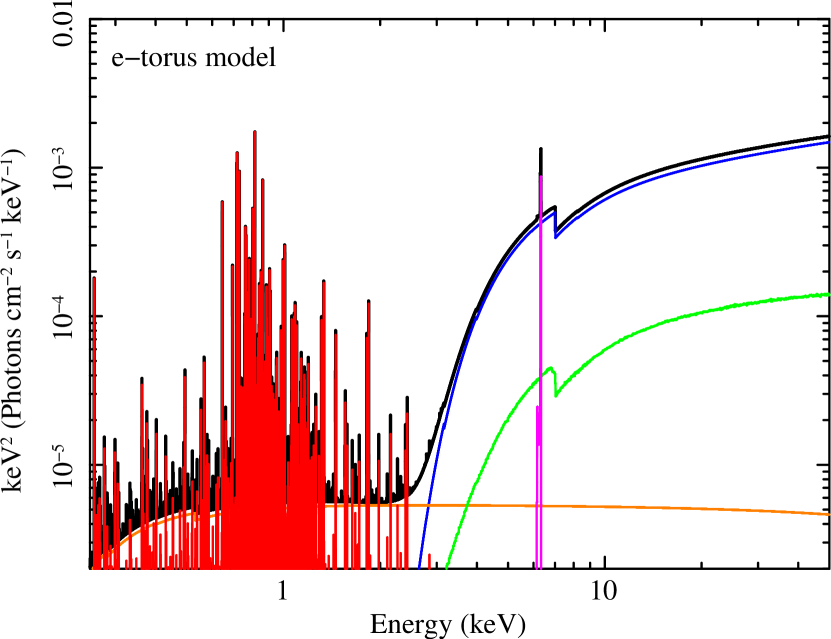
The model consists of four components. The first term represents the transmitted emission from the AGN, which is described by an absorbed power law with a high-energy cutoff (primary component). We fix a cutoff energy at 360 keV in zhighect, which cannot be constrained from the data, for consistency with the torus model by Ikeda et al. (2009) (see Section 3.1.2). The cabs model is multiplied to take into account Compton scattering. The constant factor (const1) is introduced to consider possible time variability of the primary component among multiple observation periods; we set it unity for the FPM spectrum, which is adopted as the flux reference.
The second term accounts for a reflection component from cold matter, most likely the “torus” of the AGN. We utilize the pexmon code (Nandra et al. 2007), which calculates a Compton-reflection continuum from a plane-parallel, semi-infinite cold matter (pexrav, Magdziarz & Zdziarski 1995) including fluorescence lines. The reflection strength is defined as ( is the solid angle of the reflector), and we allow it to vary within a range of (a negative value means that the direct component is not included in the model). The inclination angle is fixed at 60 as a representative value, whereas the photon index and normalization are linked to those of the primary component. We do not apply the same absorption as for the primary emission (zphabs) to the reflection component, since it does not improve the fit at 90% confidence level. The same time variability constant const1 as for the primary component is multiplied by the reflection component, assuming that they roughly follow the long time variability of the transmitted emission. If we instead assume that the reflection component is mainly produced by matter located far from the black hole (several pc) and is constant over the whole observation epochs (i.e., const11), the results do not change over the statistical uncertainties333This is also true for NGC 835 (Section 3.2).
The third term mainly represents a scattered component of the AGN emission, which is modeled with an unabsorbed cutoff power law. Considering possible contribution from high mass X-ray binaries, we set the photon index independent of that of the primary component. For convenience, we tie the power law normalizations of the first and third terms, and multiply a scattering fraction (const2, ) to the latter, which is defined as the ratio of the unabsorbed fluxes at 1 keV between the primary and scattered components. Since the scattering region is believed to be large (kpc), we assume no time variability of this component among our observation epochs. The fourth term describes optically-thin thermal emission from the host galaxy. We also assume that this did not vary among the observations because it likely originates from the starburst activity.
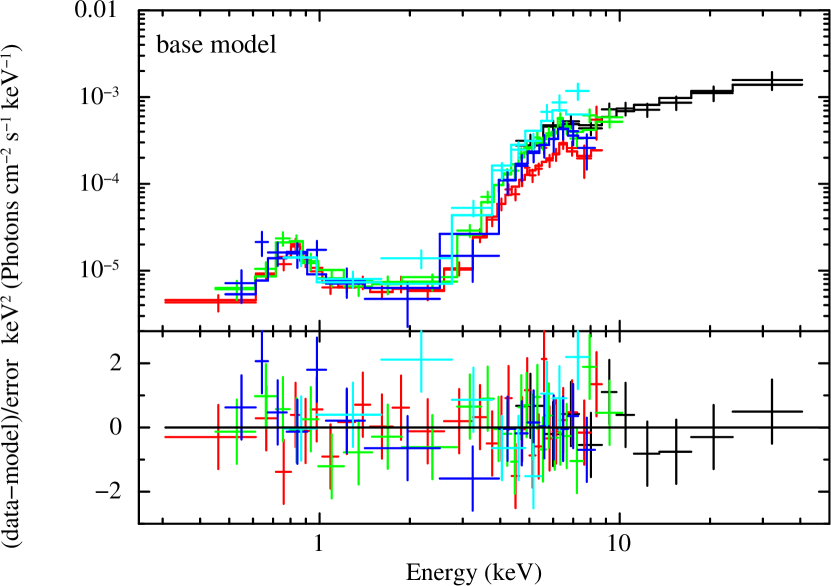
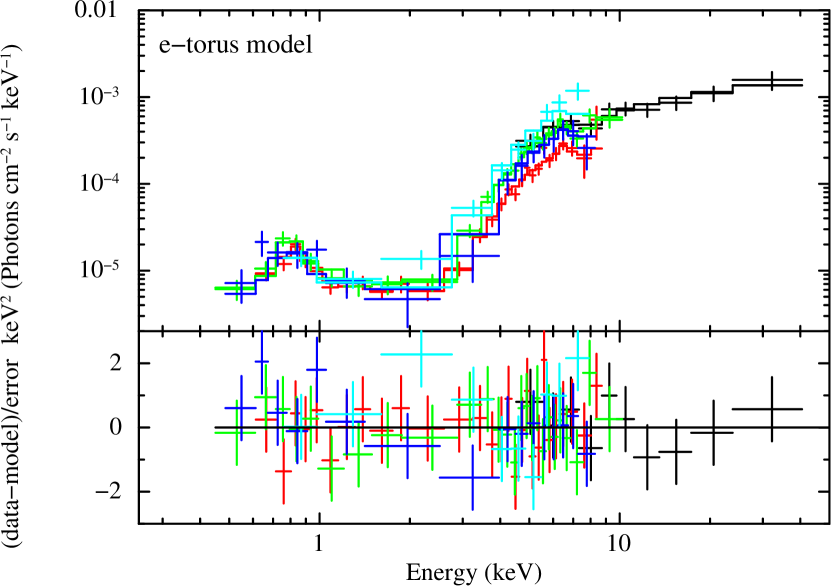
This model gives an acceptable fit of the combined spectra covering the 0.3–40 keV band (/dof = 61.9/78). Table 5 lists the best-fit parameters, the observed fluxes and de-absorbed luminosities in the 2–10 keV and the 10–50 keV bands (based on the FPM spectrum), and the equivalent width of the iron-K emission line with respect to the total continuum444To estimate the error in the iron K equivalent width, we fit the spectra by replacing the pexmon component with a pexrav continuum plus a narrow gaussian fixed at 6.4 keV.. The unfolded spectra and best-fit model are plotted in Figures 4 and Figure 5, respectively. We obtain the line-of-sight hydrogen column density of the transmitted component of cm-2.
3.1.2 Torus Model
To consider a realistic geometry of the torus, we fit the spectra with a Monte-Carlo based numerical spectral model from a smooth torus developed by Ikeda et al. (2009) (hereafter “e-torus” model). The e-torus model reproduces reflected spectra from a torus composed of constant-density cold matter that has two cone-shaped holes along the polar axis (see Figure 2 in Ikeda et al. 2009). The torus parameters are the ratio of the inner () and outer () radii, which is fixed at , the hydrogen column density along the equatorial plane (), and the half-opening angle ( within a range of 0–70). The primary X-ray spectrum is modeled by a power law with a high energy cutoff at 360 keV. The other parameters are the photon index ( within a range of 1.5–2.5) and the inclination angle ( within a range of 1–89). In this work, we fix at 80 to ensure a type-2 AGN based on the optical classification, and at 60 as a representative value, both cannot be well constrained from our data. In the XSPEC terminology, the full spectral model utilizing the e-torus model is expressed as it follows:
| (2) | |||||
The model consists of five components: the transmitted component from the AGN, the torus reflection component, the fluorescent iron-K emission line, the scattered component multiplied by a scattering fraction of , and the optically-thin thermal component. For a given torus geometry, we can convert the equatorial hydrogen column density () into the line-of-sight one () using Equation (3) in Ikeda et al. (2009), which is represented by the torusabs model; for and , . The photon indices are linked between the transmitted and reflection components. The power-law normalizations are linked among the transmitted, reflection, and scattered components. As is the case with the analytical model, the cross calibration (const0) and time variability (const1) are defined with respect to the NuSTAR spectrum. We do not use the energy band below 0.45 keV, where the e-torus model is unavailable.
We find that this model also well reproduces the combined spectra of NGC 833 covering the 0.45–40 keV band (/dof = 62.1/78). Table 5 lists the best-fit parameters, the observed fluxes and intrinsic luminosities in the 2–10 keV and the 10–50 keV energy band (based on the FPM spectrum), and the equivalent width of the iron-K emission line. Figure 4 and Figure 5 represent the unfolded spectra and best-fit model, respectively. The line-of-sight column density is found to be cm-2, which is consistent with the result from the analytical model.
3.2. NGC 835
3.2.1 Analytical Model
We adopt essentially the same model as for NGC 833. It is expressed as:
| (3) | |||||
A difference from NGC 833 is that we include two optically thin thermal emission components with different temperatures, which are required from the data. They are likely to originate from the core and outer-ring star-forming regions as discussed in Turner et al. (2001b).
As mentioned in Section 1, O’Sullivan et al. (2014) and González-Martín et al. (2016) suggested that the X-ray spectrum of NGC 835 was variable on timescales of months to years due to changes in the luminosity or absorption. Accordingly, we first allow the column density to vary among the NuSTAR (2015 September), Chandra (2013 July), Chandra (2000 November), and XMM-Newton (2000 January) observations. We find that the column densities obtained are consistent between the NuSTAR and Chandra (2013) data, whereas that measured with XMM-Newton () is significantly larger than the one measured with Chandra (2013) at a 90% confidence level. Unfortunately, the column density in 2000 November cannot be well constrained owing to the limited photon statistics of the Chandra data. Thus, in the final model, we tie the column densities of the NuSTAR and Chandra (2013) spectra together (), and also those of the XMM-Newton and Chandra (2000) spectra (). Even if we instead link the column density of the Chandra (2000) spectrum to those of the NuSTAR and Chandra (2013) spectra, the column density inferred from the XMM-Newton spectrum does not change significantly and our conclusions are not affected.
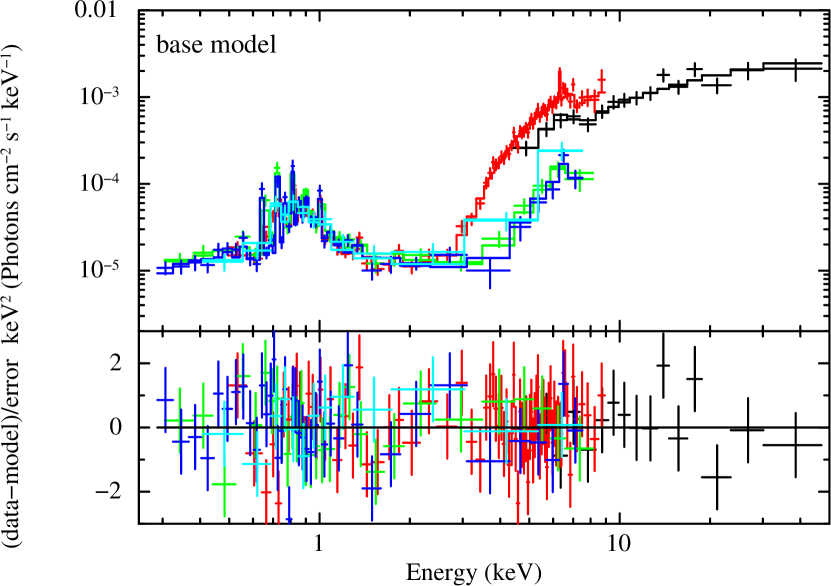
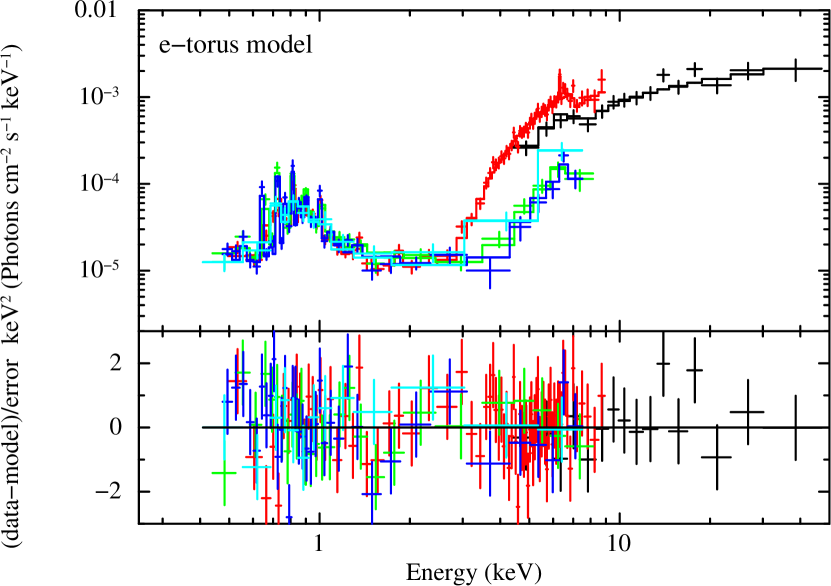
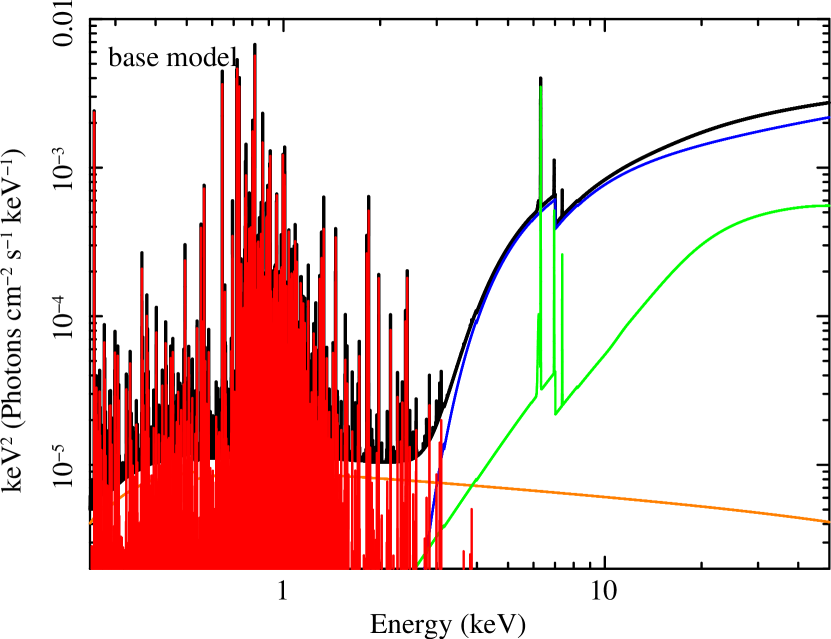
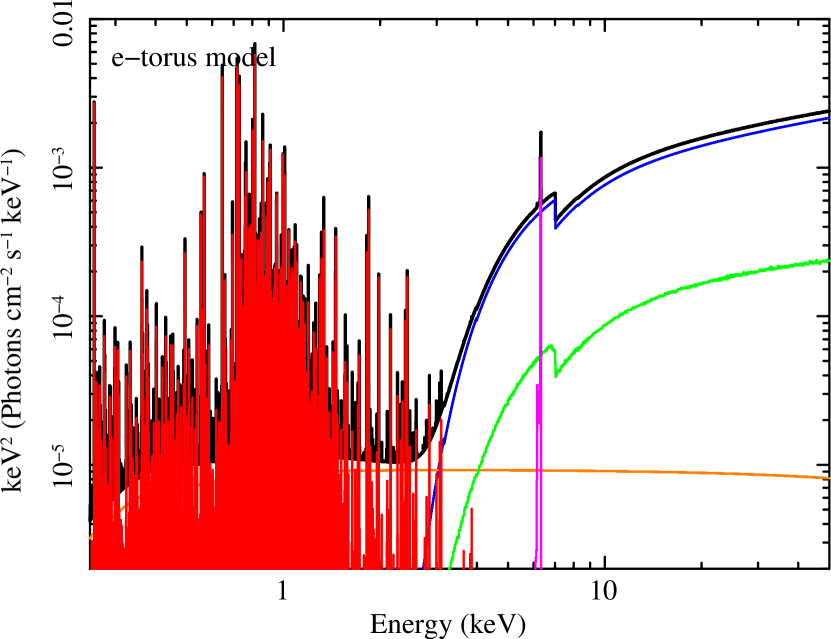
This model well reproduces all the spectra covering the 0.3–49 keV band (/dof = 150.6/162). We confirm that inclusion of the reflection component (the second term of Equation (3)) significantly improves the fit (/dof = 164.7/163 without it). The fitting results are summarized in Table 6. Figures 6 and 7 plot the unfolded spectra and the best-fit model, respectively. We find that the column density varied from cm-2 (2000) to cm-2 (2013/2015). In addition, the 2–10 keV intrinsic luminosity () was also variable: it was erg s-1 in 2000 January (XMM-Newton), erg s-1 in 2000 November (Chandra), erg s-1 in 2013 (Chandra), and erg s-1 in 2015 (NuSTAR).
| Note∗ | Parameter | base model | e-torus model |
|---|---|---|---|
| (1) | |||
| (2) | |||
| (3) | |||
| (4) | – | ||
| (5) | |||
| (6) | |||
| (7) | |||
| (8) | |||
| (9) | |||
| (10) | |||
| (11) | |||
| (12) | |||
| (13) | |||
| (14) | |||
| (15) | |||
| (16) | |||
| (17) | |||
| (18) | |||
| (19) | |||
| (20) | |||
| (21) | 80 | 69 | |
| dof | 150.6 / 162 | 152.0 / 156 |
3.2.2 Torus Model
We also adopt essentially the same torus model as for NGC 833 expressed as:
| (4) | |||||
We include two thermal components as in the case of the analytical model. The inclination angle and half-opening angle are fixed at 80 and 60, respectively, because they cannot be constrained from the data. To take into account the variability in the line-of-sight column density, we simply allow the parameters to be independent between the observations in 2000 and 2013/2015. This would be an unrealistic assumption if the overall structure of the torus was stable on a timescale of years and only the local absorption was variable e.g., due to a passage of a clump across the line-of-sight. Nevertheless, even if we make only the line-of-sight absorption variable among the two epochs (2000 and 2013/2015), being decoupled from a constant value, the results do not change over the statistical errors.
The model also well reproduces all the spectra of NGC 835 covering the 0.45–49 keV band (/dof = 152.0/156). The results are summarized in Table 6, and the unfolded spectra and the best-fit model are plotted in Figures 6 and 7, respectively. It is found that the line-of-sight column density changed from cm-2 (XMM-Newton/Chandra) to cm-2 (NuSTAR/Chandra). The intrinsic 2–10 keV luminosity was also variable: erg s-1 in 2000 January (XMM-Newton), erg s-1 in 2000 November (Chandra), erg s-1 in 2013 (Chandra), and erg s-1 in 2015 (NuSTAR). These results are consistent with those of the analytic model (see Section 3.2.1).
4. Hard X-ray Constraints on AGNs in NGC 838 and NGC 839
As we mention in Section 2.1, NGC 838 and NGC 839 are not detected with NuSTAR in the 3–24 keV band, with the upper flux limits consistent with the extrapolation from the spectrum determined at energies below 10 keV. This suggests that their AGNs, if present, must be very weak as suggested by the previous works (Turner et al. 2001b; O’Sullivan et al. 2014), and/or are subject to extremely heavy obscuration, e.g., cm-2, from which even hard X-rays cannot escape.
Here we evaluate the upper limits of the intrinsic luminosities of possible AGNs that may be present in these two galaxies, using the NuSTAR data. According to O’Sullivan et al. (2014), the Chandra spectra of both galaxies are well reproduced by a model consisting of an optically-thin thermal plasma and emission from HMXBs expected from the star forming activities. Subtracting the extrapolated fluxes of these components, we finally obtain the 3 upper limits of 0.00050 and 0.00021 counts s-1 in the NuSTAR 8–24 keV band for NGC 838 and NGC 839, respectively, for the AGN contribution. To convert these count rates into the intrinsic luminosities, we utilize the same torus model as described in Section 3.1.2 and 3.2.2 (without the scattered and thermal components). We assume an inclination angle of 80, a half-opening angle of 60, and a photon index of 1.9. Table 7 lists the upper limits of the intrinsic 2–10 keV luminosities of AGNs in NGC 838 and NGC 839 for three assumed column densities. Even in an extreme case of cm-2, the AGN must be less luminous than a few times erg s-1 (2–10 keV).
Our results support the argument by O’Sullivan et al. (2014) that NGC 838 and NGC 839 are starburst-dominant galaxies without luminous AGNs, which is consistent with their optical classifications (see Vogt et al. 2013 for a detailed study). The issue whether the hard X-ray component below 10 keV observed from NGC 839 mainly originates from a very low-luminosity AGN (Turner et al. 2001b) or from HMXBs (O’Sullivan et al. 2014) is, however, still left for an open question.
| [erg s-1] | ||
|---|---|---|
| [cm-2] | NGC 838 | NGC 839 |
| 24 | ||
| 24.5 | ||
| 25 | ||
Note. — is an equatorial hydrogen column density of the torus. denotes the 2–10 keV intrinsic AGN luminosity.
5. Discussion
We have analyzed the first hard X-ray ( keV) imaging data of the compact group HCG 16 observed with NuSTAR. NGC 833 and NGC 835 are significantly detected with NuSTAR, whereas we obtain the tightest flux upper-limit for NGC 838 and NGC 839 above 10 keV. Simultaneous broadband (0.3–50 keV) spectral analysis utilizing the NuSTAR, Chandra, and XMM-Newton data, with a total exposure of 310.6 ks, has enabled us to best constrain the X-ray properties of NGC 833 and NGC 835. In the analysis, we have carefully corrected for contamination to the NuSTAR spectrum of one target from the other. In this section, we focus on the results of NGC 833 and NGC 835 and discuss their implications,
It has been revealed that both galaxies contain moderately obscured LLAGNs ( cm-2 and erg s-1 based on the NuSTAR spectra), confirming the previous reports by Turner et al. (2001b) and O’Sullivan et al. (2014). Their spectra are well reproduced with both the analytical model and the numerical torus model. We confirm that the two models give very similar results on the photon index, line-of-sight absorption, and intrinsic luminosity for each target. Hereafter we refer to the values obtained with the torus model, where a realistic geometry is considered, unless otherwise stated.
5.1. Torus Structure of LLAGNs in NGC 833 and NGC 835
The fitting results with the analytical model show that the reflection strength from cold matter is not strong in both targets, for NGC 833 and for NGC 835. This suggests that their tori are only moderately developed. In fact, the spectra are also consistent with the torus model with an opening angle fixed at 60. Here we compare this result with the previous ones obtained for isolated (non-interacting) LLAGNs.
Kawamuro et al. (2016b) studied broadband X-ray spectra of nearby LLAGNs observed with Suzaku. Using the luminosity ratio of the iron-K line to the hard X-ray (10–50 keV) continuum as a good indicator of the torus covering fraction (Ricci et al. 2014), they suggested that the Eddington ratio would be a key parameter that determines the torus structure of LLAGNs; at its solid angle is large, whereas it is significantly smaller.
The ratios are found to be for NGC 833 and for NGC 835. The bolometric luminosities of NGC 833 and NGC 835 in 2015 are estimated to be erg s-1 and erg s-1, respectively, which are converted from the 2–10 keV intrinsic luminosities by adopting to equation (21) of Marconi et al. (2004). Using the SMBH mass versus galaxy velocity-dispersion correlation of Tremaine et al. (2002), we estimate the black hole mass of NGC 833 to be with the stellar velocity dispersion available in the Hypercat database (Paturel et al. 1997, http://www-obs.univ-lyon1.fr/hypercat). This yields an Eddington ratio of for NGC 833. The value of is consistent with what found by Kawamuro et al. (2016b) for the range of , locating it around the transition region between the well-developed tori at high and underdeveloped ones at low . Although the stellar velocity dispersion (hence SMBH mass) of NGC 835 is unavailable, we infer that its Eddington ratio is similar to that of NGC 833 on the basis of the value. A possibility is that the galaxy interaction has just triggered new AGN activities in both objects.
5.2. Origin of Flux Variability of NGC 835
We have confirmed the flux variability of NGC 835 below 10 keV between 2000 (XMM-Newton/Chandra) and 2013 (Chandra) found by O’Sullivan et al. (2014). Our spectral fitting results including the NuSTAR data in 2015 suggest that a significant variation in the line-of-sight absorption of cm-2 is required to explain the spectral difference between 2000 (observed with XMM-Newton and Chandra) and 2013/2015 (Chandra/NuSTAR), in addition to changes in the intrinsic luminosity by a maximum factor of 5 among the three epochs (Table 6). Such large long-term variability in the intrinsic luminosity is often observed in nearby LLAGNs (e.g., Kawamuro et al. 2016b).
The variable absorption on a timescale of years may be associated with a transit of high density clouds in the clumpy torus, as already discussed by O’Sullivan et al. (2014) and González-Martín et al. (2016). Markowitz et al. (2014) detected such events with column densities of cm-2 from 10 nearby Seyferts by analyzing their long-term monitoring X-ray light curves. They estimated the distance of clumps from the SMBHs to be ( is the gravitational radius). Because of the limited number of multiple observations, we are not able to measure the clump crossing-time in NGC 835 except its lower limit, 0.7 day (duration of the XMM-Newton observation in 2000 January; we conservatively adopt this value because the column density of the Chandra spectrum in 2000 January is highly uncertain). With this lower limit, the clump distance is constrained to be by assuming the SMBH mass of , the ionizing luminosity of erg s-1, and the ionization parameter of , according to equation (3) in Lamer et al. (2003). This lower limit corresponds to a typical location of broad line regions but does not contradict the results by Markowitz et al. (2014).
5.3. Infrared to X-ray Luminosity Relation of Local LLAGNs
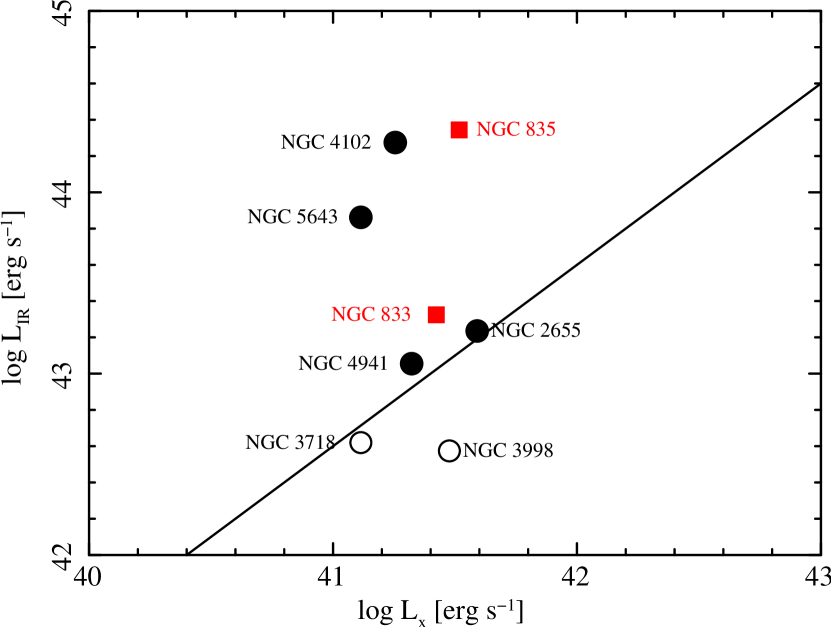
In this subsection we briefly investigate possible connection between the AGN and star-forming activities in local galaxies hosting LLAGNs. Figure 8 plots the relation between AGN X-ray luminosity in the 2–10 keV band () and the infrared luminosity in the 8–1000 m band () for NGC 833 and NGC 835 (red-filled squares). For comparison, we also plot the data of non-interacting LLAGNs, NGC 2655, NGC 3718, NGC 3998, NGC 4102, NGC 4941, and NGC 5643 (black-filled circles and black-open circles) reported in Kawamuro et al. (2016b), for which the Infrared Astronomical Satellite (IRAS) photometric data are available555 The 8–1000 m luminosities are calculated as (Sanders & Mirabel 1996), where is a luminosity distance in unit of Mpc, and , , , and are the IRAS fluxes at 12, 25, 60, and 100 m in unit of Jy, respectively.. The average relation obtained for PG QSOs by Teng & Veilleux (2010) is represented by the solid line as reference.
The X-ray and infrared luminosities are indicators of the mass accretion rate onto the SMBH and star forming rate in the host galaxy (after subtracting AGN contribution), respectively. Assuming a bolometric correction factor of (Marconi et al., 2004), we find that the ratio of the AGN bolometric luminosity to the observed infrared luminosity is much smaller than unity in these objects except for NGC 3998. Since the torus in NGC 3998 is known to be almost absent (e.g., Kawamuro et al. 2016b), the hot dust emission from the torus in the infrared band is expected to be very small compared to the AGN bolometric luminosity. Hence, we can regard that AGN contribution to the infrared luminosities is negligible in all the objects plotted here.
Figure 8 indicates large diversity in the versus relation (hence, mass accretion rate versus star forming rate relation) in the local LLAGNs, regardless if the galaxy is in interacting systems (red filled squares) or not (black filled circles and black open circles). All the objects are spiral galaxies and the star forming rate is dominated by that in the disk. Our results are not surprising, given the fact that there is little correlation between SMBH mass and stellar mass in the disk component in the local universe, unlike the tight correlation between SMBH mass and bulge mass (see Kormendy & Ho 2013). In fact, we find no evidence that the torus structure is largely different between NGC 833 and NGC 835 despite of the large difference in the / ratio, supporting the general idea that the star forming activity in the disk is not strongly coupled to the mass accretion process in the nucleus.
6. Conclusion
In this paper, we report the first hard X-ray (10 keV) observation of HCG 16 performed with NuSTAR. We particularly study the broadband X-ray spectra of the interacting galaxies NGC 833 and NGC 835 by including the data of Chandra and XMM-Newton observed on multiple epochs. Our main findings are summarized as follows.
-
•
We have obtained the tightest upper limits of the hard X-ray flux above 10 keV for NGC 838 and NGC 839, supporting the previous arguments by O’Sullivan et al. (2014) that they are both starburst dominant galaxies without luminous AGNs ( erg s-1 even assuming a column density of ).
-
•
We have confirmed that both NGC 833 and NGC 835 contain obscured LLAGNs with intrinsic 2–10 keV luminosities of erg s-1 and line-of-sight column densities of cm-2. Reprocessed X-ray radiation from cold matter is detected, indicating that the tori are moderately developed in both objects.
-
•
We have revealed that NGC 835 underwent long-term variability in both intrinsic luminosity and absorption. The line-of-sight column density was changed from cm-2 in 2000 to cm-2 in 2013/2015. This can be interpreted as a transit of clouds as expected for clumpy tori.
-
•
We point out that there is large diversity in the relation between the 2–10 keV AGN luminosity and the 8–1000 m infrared luminosity in local LLAGNs, regardless of their environments (in interacting systems or not). This is consistent with the general idea that the mass accretion process in the nucleus and the star forming activity in the disk are not strongly coupled.
References
- Anders & Grevesse (1989) Anders, E., & Grevesse, N. 1989, Geochim. Cosmochim. Acta, 53, 197
- Armus et al. (2009) Armus, L., Mazzarella, J. M., Evans, A. S., et al. 2009, PASP, 121, 559
- Bahcall et al. (1984) Bahcall, N. A., Harris, D. E., & Rood, H. J. 1984, ApJ, 284, L29
- Balucinska-Church & McCammon (1992) Balucinska-Church, M., & McCammon, D. 1992, ApJ, 400, 699
- Bitsakis et al. (2014) Bitsakis, T., Charmandaris, V., Appleton, P. N., et al. 2014, A&A, 565, A25
- Ferrarese & Merritt (2000) Ferrarese, L., & Merritt, D. 2000, ApJ, 539, L9
- Gallagher et al. (2008) Gallagher, S. C., Johnson, K. E., Hornschemeier, A. E., Charlton, J. C., & Hibbard, J. E. 2008, ApJ, 673, 730-741
- Gebhardt et al. (2000) Gebhardt, K., Bender, R., Bower, G., et al. 2000, ApJ, 539, L13
- González-Martín et al. (2006) González-Martín, O., Masegosa, J., Márquez, I., Guerrero, M. A., & Dultzin-Hacyan, D. 2006, A&A, 460, 45
- González-Martín et al. (2016) González-Martín, O., Hernández-García, L., Masegosa, J., et al. 2016, A&A, 587, A1
- Harrison et al. (2013) Harrison, F. A., Craig, W. W., Christensen, F. E., et al. 2013, ApJ, 770, 103
- Hickson (1982) Hickson, P. 1982, ApJ, 255, 382
- Hickson et al. (1989) Hickson, P., Kindl, E., & Auman, J. R. 1989, ApJS, 70, 687
- Ho (2009) Ho, L. C. 2009, ApJ, 699, 626
- Hopkins et al. (2008) Hopkins, P. F., Hernquist, L., Cox, T. J., & Kereš, D. 2008, ApJS, 175, 356-389
- Ikeda et al. (2009) Ikeda, S., Awaki, H., & Terashima, Y. 2009, ApJ, 692, 608
- Jansen et al. (2001) Jansen, F., Lumb, D., Altieri, B., et al. 2001, A&A, 365, L1
- Kalberla et al. (2005) Kalberla, P. M. W., Burton, W. B., Hartmann, D., et al. 2005, A&A, 440, 775
- Kawamuro et al. (2016a) Kawamuro, T., Ueda, Y., Tazaki, F., Ricci, C., & Terashima, Y. 2016, ApJS, 225, 14
- Kawamuro et al. (2016b) Kawamuro, T., Ueda, Y., Tazaki, F., Terashima, Y., & Mushotzky, R. 2016, ApJ, 831, 37
- Konstantopoulos et al. (2013) Konstantopoulos, I. S., Maybhate, A., Charlton, J. C., et al. 2013, ApJ, 770, 114
- Kormendy & Ho (2013) Kormendy, J., & Ho, L. C. 2013, ARA&A, 51, 511
- Lamer et al. (2003) Lamer, G., Uttley, P., & McHardy, I. M. 2003, MNRAS, 342, L41
- Lusso et al. (2012) Lusso, E., Comastri, A., Simmons, B. D., et al. 2012, MNRAS, 425, 623
- Madsen et al. (2015) Madsen, K. K., Harrison, F. A., Markwardt, C. B., et al. 2015, ApJS, 220, 8
- Magdziarz & Zdziarski (1995) Magdziarz, P., & Zdziarski, A. A. 1995, MNRAS, 273, 837
- Magorrian et al. (1998) Magorrian, J., Tremaine, S., Richstone, D., et al. 1998, AJ, 115, 2285
- Matsuoka & Ueda (2017) Matsuoka, K., & Ueda, Y. 2017, ApJ, 838, 128
- Marconi & Hunt (2003) Marconi, A., & Hunt, L. K. 2003, ApJ, 589, L21
- Marconi et al. (2004) Marconi, A., Risaliti, G., Gilli, R., et al. 2004, MNRAS, 351, 169
- Markowitz et al. (2014) Markowitz, A. G., Krumpe, M., & Nikutta, R. 2014, MNRAS, 439, 1403
- Nandra et al. (2007) Nandra, K., O’Neill, P. M., George, I. M., & Reeves, J. N. 2007, MNRAS, 382, 194
- Nandra & Pounds (1994) Nandra, K., & Pounds, K. A. 1994, MNRAS, 268, 405
- Netzer (2009) Netzer, H. 2009, MNRAS, 399, 1907
- O’Sullivan et al. (2014) O’Sullivan, E., Zezas, A., Vrtilek, J. M., et al. 2014, ApJ, 793, 73
- Paturel et al. (1997) Paturel, G., Andernach, H., Bottinelli, L., et al. 1997, A&AS, 124,109
- Ricci et al. (2017) Ricci, C., Bauer, F. E., Treister, E., et al. 2017, MNRAS, 468, 1273
- Ricci et al. (2016) Ricci, C., Bauer, F. E., Arevalo, P., et al. 2016, ApJ, 820, 5
- Ricci et al. (2014) Ricci, C., Ueda, Y., Paltani, S., et al. 2014, MNRAS, 441, 3622
- Sanders & Mirabel (1996) Sanders, D. B., & Mirabel, I. F. 1996, ARA&A, 34, 749
- Sanders et al. (2003) Sanders, D. B., Mazzarella, J. M., Kim, D.-C., Surace, J. A., & Soifer, B. T. 2003, AJ, 126, 1607
- Strüder et al. (2001) Strüder, L., Briel, U., Dennerl, K., et al. 2001, A&A, 365, L18
- Teng & Veilleux (2010) Teng, S. H., & Veilleux, S. 2010, ApJ, 725, 1848
- Tremaine et al. (2002) Tremaine, S., Gebhardt, K., Bender, R., et al. 2002, ApJ, 574, 740
- Turner et al. (2001a) Turner, M. J. L., Abbey, A., Arnaud, M., et al. 2001, A&A, 365, L27
- Turner et al. (2001b) Turner, M. J. L., Reeves, J. N., Ponman, T. J., et al. 2001, A&A, 365, L110
- Vasudevan et al. (2009) Vasudevan, R. V., Mushotzky, R. F., Winter, L. M., & Fabian, A. C. 2009, MNRAS, 399, 1553
- Verdes-Montenegro et al. (2001) Verdes-Montenegro, L., Yun, M. S., Williams, B. A., et al. 2001, A&A, 377, 812
- Véron-Cetty & Véron (2010) Véron-Cetty, M.-P., & Véron, P. 2010, A&A, 518, A10
- Vogt et al. (2013) Vogt, F. P. A., Dopita, M. A., & Kewley, L. J. 2013, ApJ, 768, 151
- Weisskopf et al. (2002) Weisskopf, M. C., Brinkman, B., Canizares, C., et al. 2002, PASP, 114, 1