Connections between star cluster populations and their host galaxy nuclear rings
Abstract
Nuclear rings are excellent laboratories for probing diverse phenomena such as the formation and evolution of young massive star clusters (YMCs), nuclear starbursts, as well as the secular evolution and dynamics of their host galaxies. We have compiled a sample of 17 galaxies with nuclear rings, which are well resolved by high-resolution Hubble and Spitzer Space Telescope imaging. For each nuclear ring, we identified the ring star cluster population, along with their physical properties (ages, masses, extinction values). We also determined the integrated ring properties, including the average age, total stellar mass, and current star-formation rate (SFR). We find that Sb-type galaxies tend to have the highest ring stellar mass fraction with respect to the host galaxy, and this parameter is correlated with the ring’s SFR surface density. The ring SFRs are correlated with their stellar masses, which is reminiscent of the main sequence of star-forming galaxies. There are striking correlations between star-forming properties (i.e., SFR and SFR surface density) and non-axisymmetric bar parameters, appearing to confirm previous inferences that strongly barred galaxies tend to have lower ring SFRs, although the ring star-formation histories turn out to be significantly more complicated. Nuclear rings with higher stellar masses tend to be associated with lower cluster mass fractions, but there is no such relation with the ages of the rings. The two youngest nuclear rings in our sample, NGC 1512 and NGC 4314, which have the most extreme physical properties, represent the young extremity of the nuclear ring age distribution.
Subject headings:
globular clusters: general – galaxies: evolution – galaxies: individual (NGC 1512) – galaxies: star clusters: general – galaxies: star formation1. INTRODUCTION
In the local Universe, the observed bar fraction is around two-thirds among normal, luminous galaxies (e.g., Mulchaey & Regan, 1997; Knapen, 1999; Eskridge et al., 2000; Laurikainen et al., 2004; Marinova & Jogee, 2007). Stellar bars, which can redistribute disk material via non-axisymmetric gravitational torques, are one of the essential internal drivers of the secular evolution of disk galaxies (for a review, see e.g. Kormendy & Kennicutt, 2004, and references therein). Such bar-driven secular processes can cause the inflow of gas from the outer disk to the central regions, possibly trigging nuclear starbursts (e.g. Sheth et al., 2005). This usually leads to the formation of interesting substructures in the central regions of the galaxies, including circumnuclear starburst rings (e.g. Mazzuca et al., 2008) as well as nuclear spirals (e.g. Shlosman et al., 1990; van de Ven & Fathi, 2010) inside these rings, which may represent a channel for gas infall to fuel the central supermassive black hole (SMBH).
The great majority of nuclear rings are believed to form as a result of gas inflow along shocks delineated by dust lanes at the leading edge of the bar (e.g. Athanassoula, 1992). This gaseous material will be driven to the circumnuclear region of the host galaxy after angular momentum loss (e.g. Combes & Gerin, 1985) by the bar’s non-axisymmetric gravitational potential. The inflowing material would accumulate around those radii at which the stellar orbits experience dynamical resonances with the rotating bar potential (e.g. Binney & Tremaine, 2008). In the inner galactic region, it is typically located at so-called inner Lindblad resonances (ILRs) which arise from the interplay between the bar and the stellar orbits (e.g. Buta & Combes, 1996; Böker et al., 2008). As the inflowing gas migrates toward the ILRs, it gradually speeds up in the azimuthal direction, and the trajectory gradually changes from radial to nearly circular (e.g. Shlosman, 2001). This allows for the accumulation of gas, yielding ring-like structure surrounding the nucleus.
When the molecular gas density exceeds a certain critical value, massive star-forming activity would be initiated to form the nuclear rings we see today. In some unbarred galaxies, other large-scale non-axisymmetric features such as ovals and strong spiral arms, have similar dynamical effects as bars in producing nuclear rings (e.g. Combes, 2001; Kormendy & Kennicutt, 2004; Mazzuca et al., 2006; Laurikainen et al., 2009). Meanwhile, some dusty red nuclear rings have been identified in elliptical and early-type lenticular galaxies exhibiting little or no star formation (e.g. Wozniak et al., 1995). They may be generated by the inside-out depletion of dusty nuclear disks (e.g. Lauer et al., 2005; Comeron et al., 2010).
Nuclear rings are among the most intense star-forming regions in normal disk galaxies. They often dominate the entire star-formation activity of their host galaxies (e.g. Mazzuca et al., 2008). They are primarily found in barred Sa–Sc-type spiral galaxies. Characterized by intense starbursts and by responding to large-scale dynamics, nuclear rings can dramatically alter the structure of their host galaxies (e.g. Kormendy & Kennicutt, 2004). Therefore, they are commonly used as a tracer of the recent inflow of material and they affect the appearance of pseudobulges (e.g. Knapen et al., 2006). In addition, the properties of nuclear rings can be used as indicators to constrain galaxy-wide parameters (e.g. Weiner et al., 2001; Li et al., 2015). High resolution, multi-passband Hubble Space Telescope (HST) observations of nearby galaxies have shown that the starburst environments in nuclear rings can harbor large populations of young massive star clusters (YMCs) (e.g., Barth et al., 1995; Buta et al., 2000; Maoz et al., 2001; de Grijs & Anders, 2012; de Grijs et al., 2017). Their ages and masses can be determined based on a careful analysis of their integrated spectral energy distributions (SEDs) (e.g. Tinsley, 1968; Leitherer et al., 1999; Anders et al., 2004a). Such star clusters, and in particular the YMCs, are therefore crucial in probing a ring’s dynamical and star-formation properties (e.g., Maoz et al., 1996, 2001; de Grijs & Anders, 2012; van der Laan et al., 2013; Väisänen et al., 2014).
In this paper, we have performed an extensive statistical analysis of a sample of nuclear rings, to understand how ring environments/properties affect the early evolution of their cluster populations and to explore whether the derived integrated ring properties—such as the star-formation rate (SFR), the star-formation density, and the total stellar mass—are linked to any galaxy-wide parameters (including Hubble type, stellar mass, etc.). We have compiled a statistically carefully selected sample of nuclear rings which have already been observed and are well-resolved by both the HST and the Spitzer Space Telescope. For each ring in our catalog, HST multi-passband imaging covers the optical wavelength range in at least four filters, so as to derive reliable physical cluster parameters (e.g. Anders et al., 2004a). As demonstrated by Ma et al. (2017, hereafter Paper I), our newly developed approach to determining integrated nuclear ring properties represents a significant improvement in our measurement accuracy compared with previous efforts. We can thus determine numerous physical properties of our nuclear rings, including their SEDs, SFRs, and the average age and total stellar masses. We will combine these results with the properties of the star cluster populations to investigate any relevant physical correlations.
This paper has the following structure. In Section 2, we present the information about both our sample selection and the data reduction. Section 3 focuses on the technical methods used for determining the physical parameters of both the rings and the associated star clusters. Section 4 is devoted to a discussion of how the derived ring parameters are related to the properties of the ring cluster populations and their host galaxies. We summarize our results and conclusions in Section 5.
2. Ring sample selection and data reduction
2.1. Sample selection
In order to obtain a statistically significant nuclear ring sample, we extensively mined the literature for suitable target galaxies. Most of our final sample is based on the compilation of Comeron et al. (2010). From our initial sample of 108 galaxies exhibiting nuclear rings, we selected those that had been observed and resolved by any HST camera, including the Wide Field Camera 3 (WFC3), the Wide Field and Planetary Camera 2 (WFPC2), the Advanced Camera for Surveys (ACS), the Near-Infrared Camera and Multi-Object Spectrometer (NICMOS), and the Faint Object Camera (FOC). We then collected their broad- and medium-band images from the HST Legacy Archive (HLA)111http://hla.stsci.edu/hlaview.html in as many filters as possible, ensuring that they covered the largest available wavelength range. Our multi-wavelength imaging data set was pipeline-processed and calibrated using the standard HLA reduction software.
We excluded rings from our selection based on the following criteria: (i) inclination angle ; (ii) central regions exhibiting dusty features which are classified as star-forming rings, which may require infrared or radio observations to provide direct access to the star formation activity. Since very few clusters are detected in HST optical imaging of such target galaxies (particularly in the band), these configurations prevent us from studying the cluster population; (iii) dusty red rings with no signs of star formation, usually identified in elliptical galaxies; the formation of such rings may have nothing to do with dynamical resonances but is probably related to the inside-out depletion of dusty nuclear disks (Lauer et al., 2005). Note that such rings should be distinguished from those described by criterion (ii) because of the different formation mechanisms involved; (iv) no well-defined ring morphology in optical passbands: Comeron et al. (2010) identified nuclear rings through visual inspection of archival HST imaging, which is not equivalent to a quantitative approach to sample selection. Therefore, the radial profiles of some rings (i.e., the isophotal intensity as a function of the radial range covered by the ring) are too shallow to be detected and distinguished from adjacent nuclear discs in broad HST passbands, thus yielding unreasonable galfit 2D component fits. We rejected such rings.
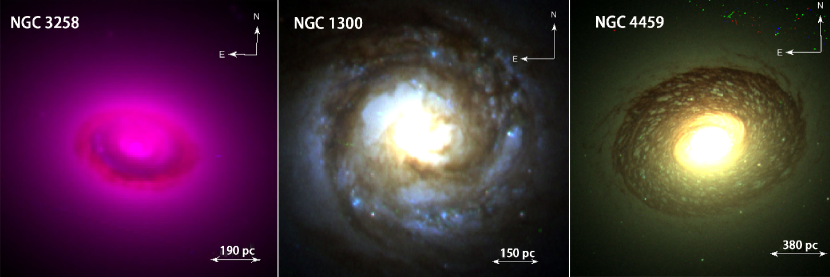
Figure 1 includes examples of composite images of three central rings that were excluded from our original sample based on these selection criteria. The left-hand panel shows the red dusty nuclear ring in the elliptical galaxy NGC 3258. Since only two HST optical filters are available for this galaxy, the F435W and F814W images are rendered in blue and red, respectively. The ring in the middle panel, located in strongly barred galaxy NGC 1300, does not show a well-defined ring structure based on its radial profile, while the right-hand panel presents the ring of NGC 4459, which is obscured by dust.
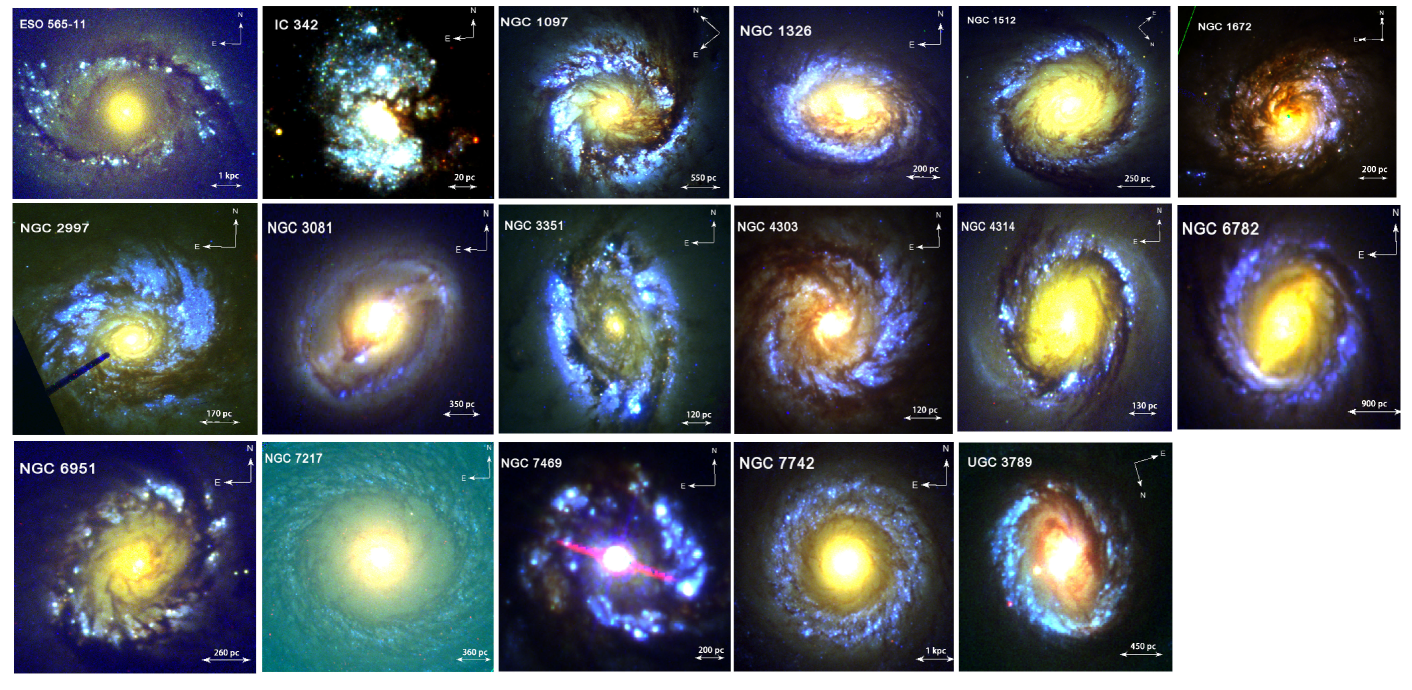
The final sample consists of 17 galaxies, for which we have included the relevant information in Table 1. Figure 2 shows the composite images of our sample rings. The , , and images are shown in blue, green, and red, respectively. The band (either F330W or F336W, depending on the HST camera used) primarily traces the young stellar populations; nuclear rings are most prominent in -band filters. Images observed through the corresponding narrow-band H filters were also retrieved if available. From the Spitzer Heritage Archive we downloaded any available broad-band infrared images (post-basic calibrated data, with a pixel scale of 0.6″) observed with the Spitzer/Infrared Array Camera (IRAC). Table 1 includes the relevant observational details and host galaxy’s parameters.
Most of our sample galaxies are early-type (S0+–Sbc) barred spirals, reaffirming previous studies that nuclear star formation is preferentially observed in early-type systems. Ho et al. (1997) argued that the enhancement of star formation in the centers of early-type barred spirals can be explained in terms of the structural differences between bars in early- and late-type spirals. Three sample galaxies—NGC 7217, NGC 7742, and UGC 3789—are known to be unbarred, which thus casts doubt on the notion that a bar may be an essential driver to form the nuclear ring. For both NGC 7217 and NGC 7742, both nuclear rings and counter-rotating components (with respect to the host stellar background disk) have been reported (see de Zeeuw et al. 2002 and Merrifield & Kuijken 1994 for NGC 7742 and NGC 7217, respectively). This can be interpreted as having resulted from a past minor merger with a gas-rich dwarf galaxy on a retrograde orbit (Sil’chenko & Moiseev, 2006), and the resulting merger-induced ovals could have had similar dynamical effects as those associated with bars, thus potentially leading to ring formation. In the presence of these counter-rotating components, the corresponding ring morphologies tend to be relatively more circular than those in barred galaxies, as shown in Figure 2.
The final column of Table 1 lists the non-axisymmetric torque parameter, , which quantifies the strength of non-axisymmetric perturbations in a galaxy (Combes & Sanders, 1981; Buta & Block, 2001). It is defined as the highest value of the tangential forces normalized by the axisymmetric force field and is expressed as
| (1) |
where the numerator is the maximum tangential force at a given radius and symbolizes the average radial force at the same radius. The values provide a clean measurement of the total non-axisymmetric bar strength, with higher values associated with more significant bars. For galaxies with a strong spiral pattern but a weak or no bar, this parameter mainly reflects the spiral strength. Lower values of are statistically related to spiral-arm perturbations and oval distortions.
The values in this paper were taken from Comeron et al. (2010), who performed extensive and consistent measurements for their much larger ring sample based on -band images from the Two Micron All Sky Survey (2MASS). The value for UGC 3789 has not been reported. Although our sample is ultimately limited by available number of galaxies, the values in our sample cover a large range, from 0.026 to 0.432, in broad agreement with the range covered by the sample of Comeron et al. (2010). It appears, therefore, that our sample is a diverse and representative subsample of the overall population of nuclear-ring galaxies.
| Galaxy | Hubble Type | Distance Modulus (mag) | Filters | |
|---|---|---|---|---|
| ESO 565-11 | (R)SB(r)0/a | 34.23 | F255W, F336W, F439W, F555W, F814W | 0.316 |
| IC 342 | SAB(rs)cd | 27.54 | F275W, F336W, F438W, F547M, F814W | 0.177 |
| NGC 1097 | SB(s)b | 31.40 | F336W, F438W, F547M, F658N, F814W, 8 m | 0.241 |
| NGC 1326 | (R)SB(r) | 30.86 | F255W, F336W, F439W, F555W, F814W | 0.163 |
| NGC 1512 | SB(r)a | 30.48 | F336W, F438W, F555W, F658N, F814W, 3.6 m, 8 m | 0.366 |
| NGC 1672 | SB(s)b | 30.81 | F330W, F435W, F550M, F606W, F814W | 0.349 |
| NGC 2997 | SAB(rs)c | 30.2 | F220W, F330W, F336W, F555W, F606W, F814W, 8 m | 0.306 |
| NGC 3081 | (R)SAB(r)0/a | 32.09 | F255W, F336W, F439W, F555W, F814W | 0.194 |
| NGC 3351 | SB(r)b | 30.0 | F275W, F336W, F438W, F450W, F555W, F606W, F657N | 0.311 |
| F814W, 3.6 m, 4.5 m, 5.8 m, 8 m | ||||
| NGC 4303 | SAB(rs)bc | 30.91 | F218W, F330W, F555W, F814W, 8 m | 0.285 |
| NGC 4314 | SB(rs)a | 29.93 | F336W, F439W, F569W, F606W, F658N, F814W, 8 m | 0.432 |
| NGC 6782 | (R)SAB(r)a | 33.61 | F255W, F300W, F450W, F606W, F814W | 0.205 |
| NGC 6951 | SAB(rs)bc | 31.77 | F110W, F160W, F330W, F547M, F606W, F658N, F814W | 0.275 |
| 8 m | ||||
| NGC 7217 | (R)SA(r)ab | 31.41 | F336W, F450W, F547M, F606W, F658N, F814W, 8 m | 0.026 |
| NGC 7469 | (R’)SAB(rs)a | 34.07 | F330W, F435W, F550M, F606W, F814W | 0.049 |
| NGC 7742 | SA(r)b | 32.91 | F336W, F555W, F675W, F814W, 5.8 m, 8 m | 0.055 |
| UGC 3789 | (R)SA(r)ab | 33.49 | F110W, F160W, F336W, F438W, F814W | —— |
-
•
Notes. The distance moduli represent the geometric means of 10 individual distance measurements compiled in the NASA Extragalactic Database (NED; http://ned.ipac.caltech.edu). The morphological types were also obtained from NED, while the values of the non-axisymmetric bar parameter were collected from Comeron et al. (2010).
2.2. Data reduction
We determine the current (i.e., more recent than 10 Myr) SFR in any nuclear ring using the calibration recipe of Kennicutt et al. (2009),
| (2) |
where (H)obs and m) are the observed H (uncorrected for internal dust attenuation) and Spitzer 8 m polycyclic aromatic hydrocarbon (PAH) emission-line luminosities, respectively, both in units of erg s-1. These luminosities can be derived from the continuum-subtracted HST/H (e.g., F658N) narrow-band filters and Spitzer 8 m bands (for technical details, see Paper I). H emission traces the presence of young massive stars and is traditionally used as current SFR indicator for star-formation timescales of 3–10 Myr (e.g. Hao et al., 2011). However, the downside of using the H flux alone as a tracer of star-forming regions is that H emission is very sensitive to dust extinction, and the missing H flux that has been absorbed and scattered by dust would be re-emitted at infrared wavelengths. Therefore, combination of the H and 8 m luminosities offers a better choice for calculating the SFR. Six of our sample galaxies (NGC 1512, NGC 1097, NGC 3351, NGC 4314, NGC 6951, and NGC 7217) were observed through both H and infrared (3.6 m and 8 m) filters, so that we could determine their ring SFRs.
3. Method and analysis
Before understanding how the ring environment influences the early evolution of the cluster population, we need to characterize the physical properties of the star clusters and their host galaxies’ nuclear rings. In this section, we describe the methods used for collecting the star cluster catalogs and performing their photometry, and we summarize the technique used to estimate the cluster masses and ages. We then briefly present our recently improved approach to deriving the integrated ring properties (see also Paper I for details) and discuss the results obtained at the end of this section.
3.1. Cluster detection and photometry
We used customized idl222The Interactive Data Language (idl) is licensed by Research Systems Inc., of Boulder, CO, USA. procedures on two adjacent HST filters occupying the middle wavelength range of the available filter coverage to find the ring cluster candidates (e.g. de Grijs et al., 2013; Li et al., 2015; de Grijs et al., 2017). Using such middle-wavelength images guarantees that we do not reject extremely blue or extremely red objects from our initial sample of cluster candidates. The standard deviations () of the number of counts in empty sections of images in both filters were determined using the Iraf333The Image Reduction and Analysis Facility (Iraf) is distributed by the National Optical Astronomy Observatories, which is operated by the Association of Universities for Research in Astronomy, Inc., under cooperative agreement with the U.S. National Science Foundation. We used Iraf version 2.16.1 (October 2013) for the data reduction performed in this study./imstat routine. Multiples of this background count in units of , i.e. [2, 3, 4, 5, 6], were used as thresholds above which the numbers of source detections in both filters were calculated with the help of the idl/find task. The number of detections initially decreases rapidly with increasing detection threshold; subsequently, the curves become shallower. This suggests that our source detections are dominated by noise in the low-threshold regime (e.g. Barker et al., 2008). When the rapid decline changes to a flatter trend, ‘real’ objects (either cluster candidates or background-intensity variations) start to dominate our detections. Therefore, we need to determine the knee in the curve, where real sources begin to dominate the noise. We found that the most suitable minimum detection thresholds are at 3 or 4 depending on the adopted master filters and the specific ring. Note that by adopting these thresholds, we opted to set conservative minimum flux limits; in this first selection step, we did not want to discard objects that might be real clusters, but we simply wanted to remove most of the spurious noise detections from our sample; this procedure is directly based on that adopted and justified by de Grijs et al. (2013, 2017). Thus, in the remainder of this paper, we will only consider the objects in the ‘source-dominated’ domain, i.e. for source brightnesses above the relevant detection threshold.
To ensure that we are dealing with real objects in at least these two middle-wavelength ‘master’ filters, we applied a cross-identification procedure in idl to select only those sources that have intensity peaks within 1.4 pixels of each other in our master filter combination (i.e. allowing a maximum positional mismatch of only 1 pixel in both spatial dimensions). As shown by de Grijs et al. (2017), releasing this constraint, adjusted to 2- and 3-pixel positional mismatches in both directions, does not have a significant effect on the number of objects retained for further analysis. In our next step, we made use of a standard Gauss-fitting routine in idl, applied to all selected sources, to determine their sizes, . Size selection can help us to remove unlikely cluster candidates. To define the minimum size for extended cluster candidates, we generated artificial HST point-spread functions (PSFs) using the TinyTim package (Krist & Hook, 1997), and determined their best-fitting Gaussian widths. Cluster candidates with sizes smaller than the model size (which may be artifacts of the detector or caused by cosmic rays) were discarded. We adopted a conservative size-cut criterion in order not to reject some marginally extended sources. Although the series of selection criteria adopted tends to lead to the rejection of a large fraction of our initial source population, the method has been extensively validated and shown to lead to well-understood final cluster samples (e.g. Anders et al., 2004b; Barker et al., 2008; de Grijs et al., 2013, 2017).
We next proceeded to obtain photometric measurements for our final selection of sample clusters to acquire their SEDs. Our customized idl aperture-photometry task uses source radii and sky annuli tailored to the properties of individual cluster candidates (e.g. de Grijs & Anders, 2012; de Grijs et al., 2013; Li et al., 2015; de Grijs et al., 2017). We used a source aperture radius of , and and for the inner and outer sky annuli, respectively. The exact scaling was determined by checking the stellar growth curves, to identify where the objects’ radial profiles vanish into the background noise. We confirmed that the choice of our source radii was conservative enough so as not to miss any genuine source flux, and we also verified that our selected sky annuli were not significantly contaminated by neighboring sources. We calibrated our aperture photometry using the prevailing zero-point offsets. The photometric zero points (zpt) rely on the HST image header keywords photflam and photzpt, with zpt = 2.5 log(photflam) + photzpt. We have included the multi-passband cluster photometry for all sample galaxies except NGC 1512 and NGC 6951 in the Appendix; the equivalent data for NGC 1512 and NGC 6951 were published as Supplementary Data by de Grijs et al. (2017).
3.2. Cluster parameter determination
In order to determine the age (), mass (), and internal extinction () for each ring cluster candidate, we compared the observed cluster SEDs to those of simple stellar population (SSP) models using a minimization method (Anders et al., 2004a):
| (3) |
where is the number of available filters for each cluster, and are the absolute magnitudes in each band, respectively, and are the observational uncertainties. We used the galev SSP models (Kotulla et al., 2009, and references therein; http://www.galev.org) to generate our model SED suite, covering ages from yr to yr, with an age resolution of yr. The model grid was completed by inclusion of extinction effects (Calzetti et al., 2000), with the reddening, , spanning the range from 0.0 mag to 2.0 mag, with a resolution of 0.1 mag. We adopted a Kroupa (2001) stellar initial mass function (IMF) for stellar masses from 0.1 to 100 , which is the same as used in Eq. (1) for determination of the SFR. Note that the broad-band SED shape reveals information pertaining to a cluster’s best-fitting age, metallicity, and extinction, while the associated cluster mass is the normalization factor to scale the models to the observed SEDs. Each model SED (and its associated physical parameters) was assigned a probability based on the value of this comparison. For each cluster, we selected the model with the smallest reduced to retrieve the cluster’s most appropriate age, mass, and extinction. Models with decreasing probabilities were summed up until a 68.26% total probability (1 confidence level) was reached, to estimate the uncertainties in the best-fitting model (see Anders et al., 2004a).
To determine robust ages and masses within a given cluster system, our fitting algorithm requires cluster photometry in at least four separate filters as input parameters (de Grijs et al., 2005), of which the band filter is fundamental to break the age–extinction degeneracy in the colors of young clusters (Anders et al., 2004a). In principle, we need the wavelength coverage to be as broad as possible, but the availability of HST images limits the filter set used for our SED fitting. Allard et al. (2006) and Sarzi et al. (2007) demonstrated that the circumnuclear regions of barred massive galaxies can be modeled well by adopting solar metallicity. Given that all galaxies in our sample are nearby luminous and massive spiral galaxies, we decided to keep the model cluster metallicities unchanged by adopting solar metallicity, retaining the cluster ages, masses, and extinction values as free parameters. The advantage of this approach is that it leaves us with one fewer free parameter to determine, which in turn renders our resulting age, mass, and extinction estimates more reliable (we only need a minimum of three filters to obtain credible cluster parameters).
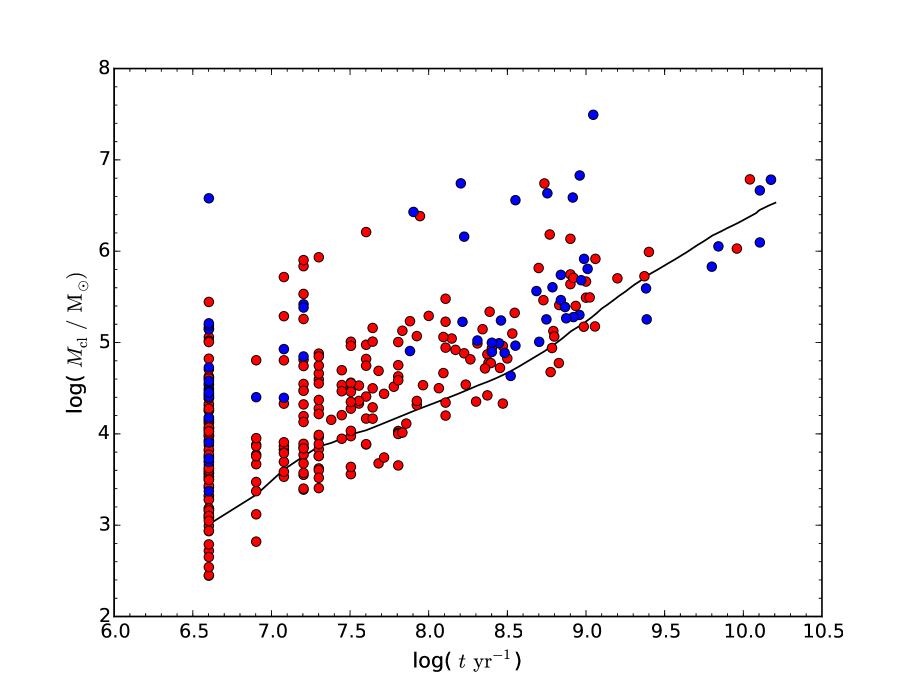
As an example, Fig. 3 shows the distribution of our detected NGC 1512 cluster candidates in the age–mass plane. We have not included the error bars in age and mass for the sake of clarity; the 1 age and mass ranges are included in Table 2. The red points represent clusters located in the nuclear ring region, while the blue points represent the clusters found in the main nuclear disk. For this galaxy, we have access to HST images taken through the WFC3/UVIS F336W, F438W, F555W, and F814W broad-band filters. Since our object selection is based on source detection and cross-identification in the F438W and F555W filters, our sample is intrinsically limited by the least sensitive of the latter filters. Our NGC 1512 cluster sample is therefore a ‘-band detection-limited’ sample. As regards the procedures used to perform our completeness tests, we refer the reader to de Grijs et al. (2017, their Section 2.5), where a detailed description can be found. Here, for the sake of clarity, we briefly describe the main steps followed for determining the completeness limits. For a given filter, we generated 500 artificial clusters (with sizes representative of our target galaxy’s cluster population; see below) by applying standard Iraf tasks, which we subsequently added to the ring region of our science image, adopting randomly generated () coordinates. We assigned the mean size of the galaxy’s genuine cluster sample to our artificial clusters. The input artificial sources, as well as their photometry in the relevant passbands, were retrieved using the same source discovery routines as applied to find the real clusters, in order to evaluate how many input artificial objects may have been missed by our processing technique. Finally, we repeated this procedure by varying magnitudes of the input sources from 19.0 mag to 27.0 mag, in steps of 0.5 mag, in all relevant filters.
The black solid line in Fig. 3 is the evolutionary track of an SSP model for the band’s 90% completeness limit, mag, at the distance of NGC 1512. This mass evolution curve was calculated using the galev models for solar metallicity and zero extinction, i.e., the completeness limit of 22.7 mag in the F438W passband was converted to a minimum mass estimate for each age. This shows the expected effect of evolutionary fading of an instantaneously formed SSP. As one can see from Fig. 3, there are some clusters with best-fitting masses below the limiting model prediction. This is probably due to the fact that the mass of a cluster is determined by scaling the complete model SED, rather than scaling a single band, which in essence implies that stochastic sampling effects might cause the observed scatter in cluster mass.
| # | log( ) | log() | |||||||
| Best | Min. | Max. | Best | Min. | Max. | (mag) | |||
| 0 | 9.00 | 6.60 | 9.58 | 5.67 | 4.80 | 6.28 | 0.0 | ||
| 1 | 8.23 | 6.60 | 8.99 | 4.88 | 3.47 | 5.38 | 0.1 | ||
| 2 | 6.60 | 6.60 | 9.58 | 5.06 | 4.37 | 6.35 | 0.8 | ||
| 3 | 9.06 | 6.60 | 10.18 | 5.18 | 3.35 | 6.22 | 0.0 | ||
| 4 | 6.60 | 6.60 | 9.20 | 4.03 | 3.16 | 5.30 | 0.6 | ||
Most of the ring clusters are matched by model SEDs that are younger than 100 Myr, covering a continuous age range, and they have low extinction values, on average = 0.18 mag, which is in good agreement with Maoz et al. (2001). The figure also exhibits a number of small-scale features in the cluster distribution, with gaps at some ages and apparent overdensities of clusters at other ages. These types of features are expected when estimating ages by comparing observed cluster SEDs with SSP models provided for a distinct set of ages. We inspected an apparent overdensity of data points at and found that 90 ring clusters are located in this ‘chimney’ feature. This artifact is attributed to our fitting routines, i.e. the large density of clusters at this location is simply caused by the fact that our youngest isochrone has an age of 4 Myr (we are limited by the age range covered by the Padova isochrones on which the galev SSP models are based). Younger clusters would therefore be assigned the minimum model age (cf. Bastian et al., 2005; Gieles et al., 2005). Because of the limitations related to the number of available filters, we are forced to use an almost continuously distributed model suite to fit our observed SEDs derived from observations in a number of discrete filters. This will inevitably lead to local minima in the landscape (manifested as older chimneys in Fig. 3). In fact, we would expect their ages to scatter somewhat more (by about 0.15 dex) around the mean age of such a chimney (e.g. Anders et al., 2004a). However, these small-scale artifacts do not significantly affect the broad distribution of cluster masses and ages. The ring cluster parameters for the other galaxies in our sample are included in the Appendix. In Table 3, we present the basic parameters of our sample ring cluster populations.
| Galaxy | (kpc-2) | Limiting filter | Mag | log() | log(/) | log | ||
|---|---|---|---|---|---|---|---|---|
| (1) | (2) | (3) | (4) | (5) | (6) | (7) | (8) | (9) |
| ESO 565-11 | 143 | 0.77 | 8 | F439W | 22.4 | 7.59 | 5.56 | 6.7 |
| IC 342 | 64 | 0.17 | 1280 | F438W | 20.5 | 8.20 | 4.73 | 6.0 |
| NGC 1097 | 1064 | 0.55 | 213 | F438W | 22.3 | 8.83 | 6.11 | 7.4 |
| NGC 1326 | 242 | 0.56 | 484 | F439W | 21.3 | 8.11 | 5.58 | 6.6 |
| NGC 1512 | 319 | 0.33 | 363 | F438W | 22.7 | 8.18 | 5.15 | 5.9 |
| NGC 1672 | 302 | 0.30 | 3020 | F435W | 21.3 | 8.69 | 6.25 | 6.8 |
| NGC 2997 | 251 | 0.57 | 179 | F555W | 24.1 | 7.72 | 4.41 | 5.4 |
| NGC 3081 | 27 | 0.63 | 18 | F439W | 21.3 | 7.87 | 6.39 | 6.5 |
| NGC 3351 | 448 | 0.59 | 1120 | F438W | 21.0 | 8.47 | 5.40 | 6.4 |
| NGC 4303 | 143 | 0.78 | 600 | F555W | 22.3 | 7.79 | 5.10 | 6.2 |
| NGC 4314 | 209 | 0.82 | 565 | F439W | 23.0 | 7.96 | 4.60 | 5.8 |
| NGC 6782 | 45 | 0.92 | 7 | F450W | 20.4 | 8.59 | 5.92 | 6.4 |
| NGC 6951 | 82 | 0.79 | 108 | F547M | 21.8 | 8.24 | 6.08 | 6.6 |
| NGC 7217 | 116 | 0.64 | 49 | F450W | 23.6 | 8.64 | 5.32 | 5.7 |
| NGC 7469 | 57 | 0.81 | 61 | F435W | 21.0 | 8.63 | 7.11 | 7.4 |
| NGC 7742 | 271 | 0.61 | 22 | F555W | 23.7 | 7.44 | 5.49 | 7.2 |
| UGC 3789 | 81 | 0.77 | 39 | F438W | 22.6 | 7.52 | 5.93 | 6.7 |
-
•
Notes. Columns: 1 – Host galaxy name; 2 – Number of clusters in the final selected ring cluster population; 3 – Ratio of the number of objects in the final ring cluster population with respect to that in the initial cluster population; 4 – Ring cluster surface density in units of kpc-2; 5, 6 – Limiting master filter used for the cluster selection and corresponding 90% completeness limit; 7 – Average age of the ring cluster sample; 8 – Average mass of the ring cluster sample; 9 – Total mass of YMCs in the ring region with ages up to 10 Myr and masses greater than .
3.3. Determination of the integrated ring properties
To measure the physical properties of nuclear rings, we follow exactly the same procedures as previously established in Paper I, where a detailed description can be found. We refer the reader to that paper for details, and so we only summarize the main steps here. Based on the observed radial profile shape of the nuclear region (see Fig. 2 of Paper I), we divide the images into two parts, i.e. the host galaxy’s background and nuclear ring areas. We model these galactic components by adopting analytical functions, using the galfit fitting program, including a truncation function for the nuclear ring, and a combination of Gaussian and Sérsic functions aiming for the background galactic disk (for a detailed description, see also Peng et al., 2010). We found a good match between the best-fitting model and the real data, and we demonstrated that the results are not affected by the lower Spitzer resolution. We applied our improved method to our ring sample to derive their integrated optical-to-mid-infrared SEDs.
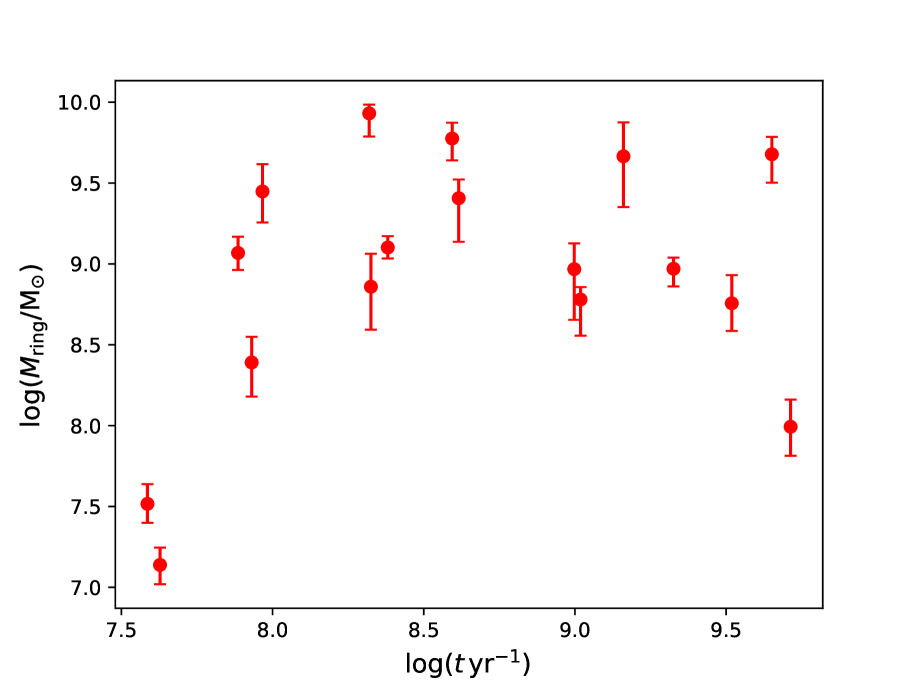
We next fitted the observed SEDs of our ring sample to determine their average age and total stellar mass using Flexible Stellar Population Synthesis models (FSPS; Conroy et al., 2009; Conroy & Gunn, 2010). By assuming a Kroupa (2003) IMF, stellar population model templates were produced, with the metallicity again fixed to the solar value. The age–mass distribution of our ring sample is shown in Fig. 4, which reveals an average age of 1.2 Gyr. Both previous observational (e.g. Allard et al., 2006; Sarzi et al., 2007) and numerical (e.g. Regan & Teuben, 2003) results indicate that star-forming nuclear rings are long-lived structures with multiple epochs of starburst activity. Based on the observed nuclear ring fraction (%) in disk galaxies from their unbiased sample, Comeron et al. (2010) estimated an approximate effective nuclear ring lifetime on the order of 2–3 Gyr, which is indeed compatible with our sample-averaged current ring age. Nevertheless, we note that our measurements are much more accurate given our systematic approach based on multi-passband SED analysis. The derived ring masses for our sample galaxies vary widely; they are in the range of , while the total gas mass in each ring is almost constant at approximately a few (e.g. Buta et al., 2000; Benedict et al., 2002; Sheth et al., 2005). The ages and masses we determined for our nuclear rings, as well as their 1 uncertainties, are summarized in columns 2 and 3 of Table 4, respectively. For rings with measured SFRs (see Table 4, column 4), the best-fitting ring stellar masses are an order of magnitude higher than the deduced stellar masses (based on assuming constant SFRs as observed over the current ring lifetimes, i.e., their ages). This therefore illustrates that nuclear ring star-formation histories are more complicated than represented by our simple assumption of a constant SFR. Indeed, some evidence has revealed that the observed emission lines in starburst rings might be best modeled by adopting multiple starburst episodes of varying intensity rather than by a constant SFR (e.g. Allard et al., 2006; Sarzi et al., 2007)
| Galaxy | log() | log(/) | SFR ( yr-1) | |
|---|---|---|---|---|
| ESO 565-11 | — | — | ||
| IC 342 | — | — | ||
| NGC 1097 | ||||
| NGC 1326 | — | — | ||
| NGC 1512 | ||||
| NGC 1672 | — | — | ||
| NGC 2997 | — | — | ||
| NGC 3081 | — | — | ||
| NGC 3351 | ||||
| NGC 4303 | — | — | ||
| NGC 4314 | ||||
| NGC 6782 | — | — | ||
| NGC 6951 | ||||
| NGC 7217 | ||||
| NGC 7469 | — | — | ||
| NGC 7742 | — | — | ||
| UGC 3789 | — | — |
-
•
Notes. Columns: 1 – host galaxy name; 2 – best-fitting age; 3 – total stellar mass; 4 – current SFR for the past 10 Myr in units of yr-1; 5 – corresponding SFR surface density in units of yr-1 kpc-1.
4. Analysis and discussion of possible correlations
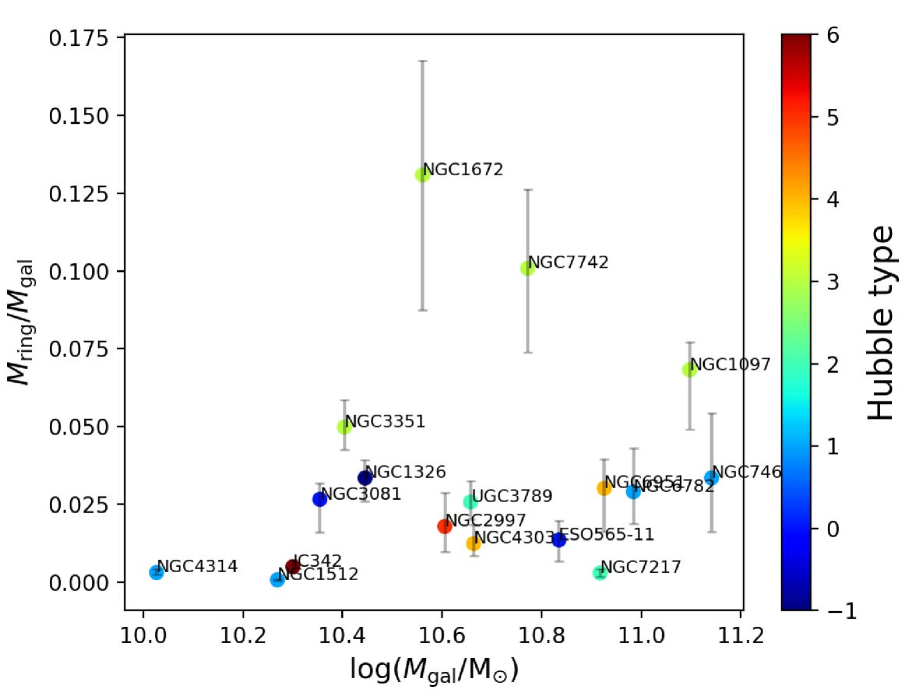
In this section we will explore the possible correlations between a range of integrated ring and host galaxy properties, as well as those pertaining to the ring cluster populations. Figure 5 displays , i.e. the ratio of the ring mass to the overall host galaxy’s stellar mass, as a function of , color-coded based on the galaxies’ revised Hubble types. The stellar masses were calculated based on the color-dependent -band mass-to-light ratios (), using (Bell et al., 2003)
| (4) |
where the ratio is given in solar units. The -band luminosity () and the corresponding color were obtained from the HyperLeda444http://leda.univ-lyon1.fr data base. Of particular interest in this figure is that all Sb-type () galaxies, i.e. NGC 1097, NGC 1672, NGC 3351, and NGC 7742, have the highest stellar ring-mass fraction with respect to the stellar mass of their host galaxies.
4.1. Star formation in the ring
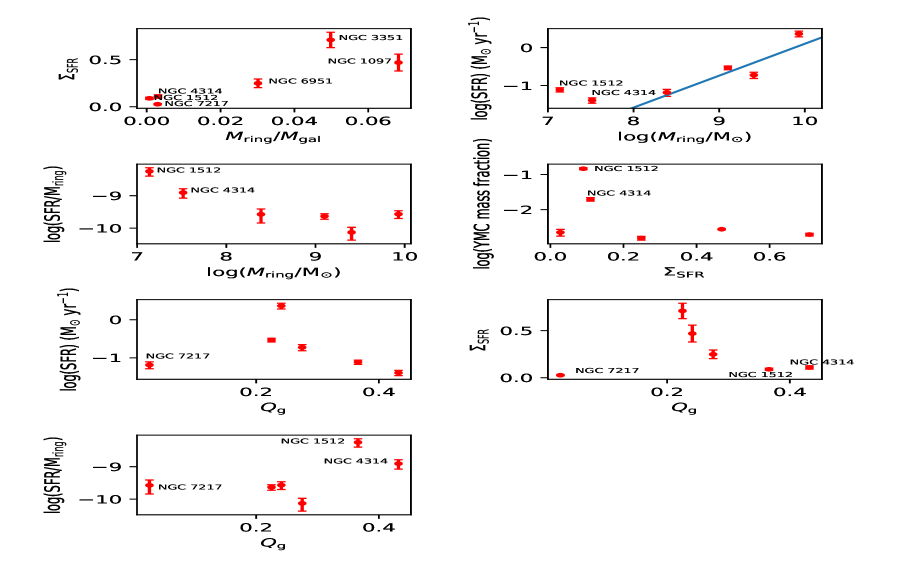
For six of the 17 galaxies in our sample (including NGC 1512, NGC 1097, NGC 3351, NGC 4314, NGC 6951, and NGC 7217), we could calculate the current ring SFR, since both H and 8 m images were available (see Table 4). Figure 6 shows the ring star-formation properties, SFR and , compared with various ring parameters; is the SFR surface density, defined as the SFR divided by the ring area. In the top row of Fig. 6, we show how and SFR are correlated with the ring mass fraction (left) and the absolute stellar mass in the ring (right). The top right-hand panel is reminiscent of the main sequence (MS) of star-forming galaxies (e.g. Renzini & Peng, 2015; Lin et al., 2017), but it applies here only to local starburst-ring environments within galaxies. Interestingly, these subgalactic regions exhibit a similar correlation as their full counterparts, except for NGC 1512 and NGC 4314, which are also the two least massive rings with the youngest ages in our sample. The blue line in this panel denotes the –log(SFR) correlation for MS star-forming galaxies, characterized by a best-fitting slope of 0.8 (e.g., Speagle et al., 2014; Pannella et al., 2015). The left-hand panel in the second row of Fig. 6 shows a negative trend for the specific SFR (i.e. the ring stellar mass-normalized SFR, SFR/) as function of the ring mass. Again, this trend is also seen for the integrated properties of local galaxies (e.g. Behroozi et al., 2013). The right-hand panel in the second row explores the YMC mass fraction as a function of , with the YMCs’ total masses listed in column (9) of Table 3. To obtain the ring YMC samples, we selected clusters younger than 10 Myr and more massive than , but this exploration does not reveal any evident trend.
The two panels in the third row of Fig. 6 show the dependence of the non-axisymmetric torque parameter to the SFR and , respectively, with both panels demonstrating striking correlations between star-forming properties of rings and the non-axisymmetric perturbations by host galaxies. As the bar strength increases, the star-forming intensity in the ring is significantly weakened, except for one discrepant data point (NGC 7217). Unlike the other sample galaxies, NGC 7217 is an unbarred galaxy containing a counter-rotating component. Note that strongly barred galaxies tend to have low SFRs in their rings (Mazzuca et al., 2008; Comeron et al., 2010). It thus appears that our observed trends are in accordance with previously published results, although we emphasize that our sample may be suffering from unquantified selection effects. Examining the bottom left-hand panel of Fig. 6, we also note that the rings’ specific SFR shows a weakly increasing trend with increasing . These observational results may be in contrast with the general expectation that strong bars will tend to drive more material to the central regions of their host galaxies and thus lead to rings with higher SFRs. However, we note that nuclear rings are the products of a complicated interplay of multiple factors, and it is likely that other physical determinants, such as the SFR history, the gas density in the ring region and the gas content within the bar radius, may also have an impact. We leave an exploration of such effects for a follow-up study.
4.2. Nuclear rings and young star clusters
Since bars play an important role in nuclear ring formation and their evolution, the bar strength is possibly the dominant factor in determining the properties of the newly formed ring cluster population. In Fig. 7, we plot the ring’s YMC mass fractions with respect to the ring masses as a function of . For the ring YMCs, we used the same selection criteria as above. Two galaxies, NGC 7217 and NGC 7742, which are unbarred and show minor-merger evidence are labeled in yellow. There is no apparent relationship between the integrated ring properties and the YMC populations.
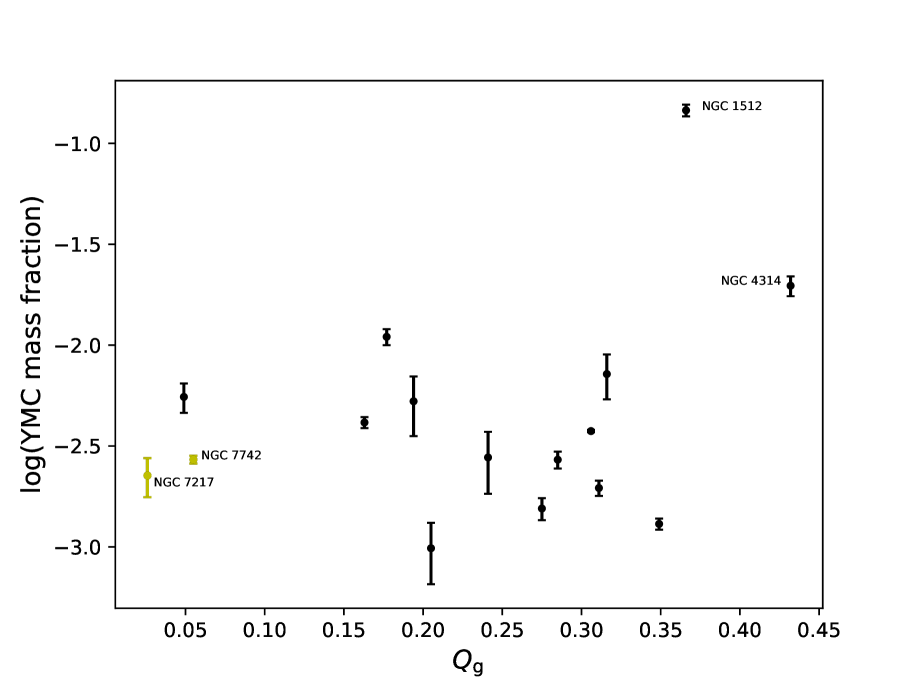
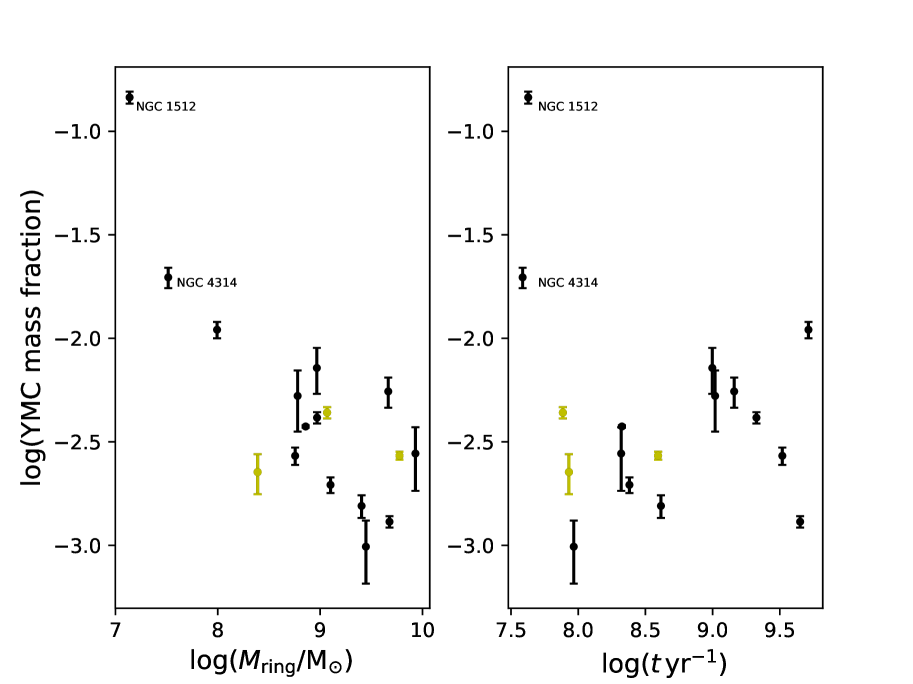
Figure 8 shows the YMC mass fractions as a function of the integrated ring stellar masses (left) and ages (right), where the rings of the unbarred galaxies in our sample (i.e., NGC 7217, NGC 7742, and UGC 3789) are again marked in yellow. In the left-hand panel, a pronounced trend is found, irrespective of the presence of the unbarred sample galaxies, showing that the YMC mass fraction decreases rapidly as the host galaxy’s ring becomes more massive. Our ring masses derived from broad-band SED fitting span a large range of more than two orders of magnitude, from for NGC 1512 to for NGC 1097. YMC samples with ages of up to 10 Myr nevertheless account for merely small fractions of the total ring masses. This is why more massive rings tend to have lower YMC fractions. In the right-hand panel of Fig. 8, where we compare the YMC fractions with the average ring ages, there is no noticeable relationship with or without rings of unbarred galaxies. Considering the broad age and mass ranges among our sample of rings, as well as the wide range of non-axisymmetric parameters () of their host galaxies, our ring catalog is reasonably representative of nearby nuclear-ring galaxies in general, despite the relatively small number of rings. Interestingly, the nuclear ring of NGC 1512 is the second youngest (40 Myr-old) ring in the sample, with the lowest stellar mass, but it is characterized by the highest YMC mass fraction when normalized by parent ring stellar mass, as shown in Fig. 8.
Figures 6 to 8, show that the ring properties in NGC 1512 and NGC 4314 are outliers in almost all cases. These are the least massive and youngest rings with the highest specific SFRs and YMC mass fractions (for which the relatively lower ring stellar masses may play a crucial role in determining their physical properties). We have marked these two rings separately in Figs 6–8. These two youngest rings are different from the other rings in our sample, and excluding them will affect the above observed trends and correlation to a large extent. For example, the decreasing relation in the left-hand panel of Fig. 8 would be less significant if we do not consider the two youngest rings, although we concede that the statistics basis of our sample is limited. The same situation also applies to both Fig. 7 and the relevant panels of Fig. 6. While the most likely interpretation of the physical reasons underlying any of the trends may be ambiguous, perhaps the very young ring populations actually bias the overall picture. Alternatively, the complex SFHs operating in the nuclear rings may affect the results differently.
As regards Fig. 4, even though the number of objects in our sample is small, it appears that the age–mass distribution of our ring sample represents an evolutionary signature, at least qualitatively, with the least massive rings (NGC 1512 and NGC 4314) occupying the youngest end of the rings’ evolutionary sequence. Meanwhile, these two special rings deviate significantly from the star-forming galaxy MS, as shown in the top right-hand panel of Fig. 6. We therefore propose that they may represent the young-age tail of the nuclear ring age distribution, rather than forming a separate population of nuclear rings. As the ring ages increase, more gaseous material is channeled into the ring region by the galactic bar potential, which contributes to the gradual increase in the total stellar mass of the nuclear rings. However, we caution that this is only a tentative explanation. The physical mechanisms behind the observed phenomena are difficult to quantify without knowing the details of the ring SFHs, gas content, and dynamics in the circumnuclear regions, among others, all of which should be further explored in future studies. A larger ring sample benefiting from observations of higher spatial resolution and a longer wavelength coverage would also help to further resolve these conundrums. This is left for future work.
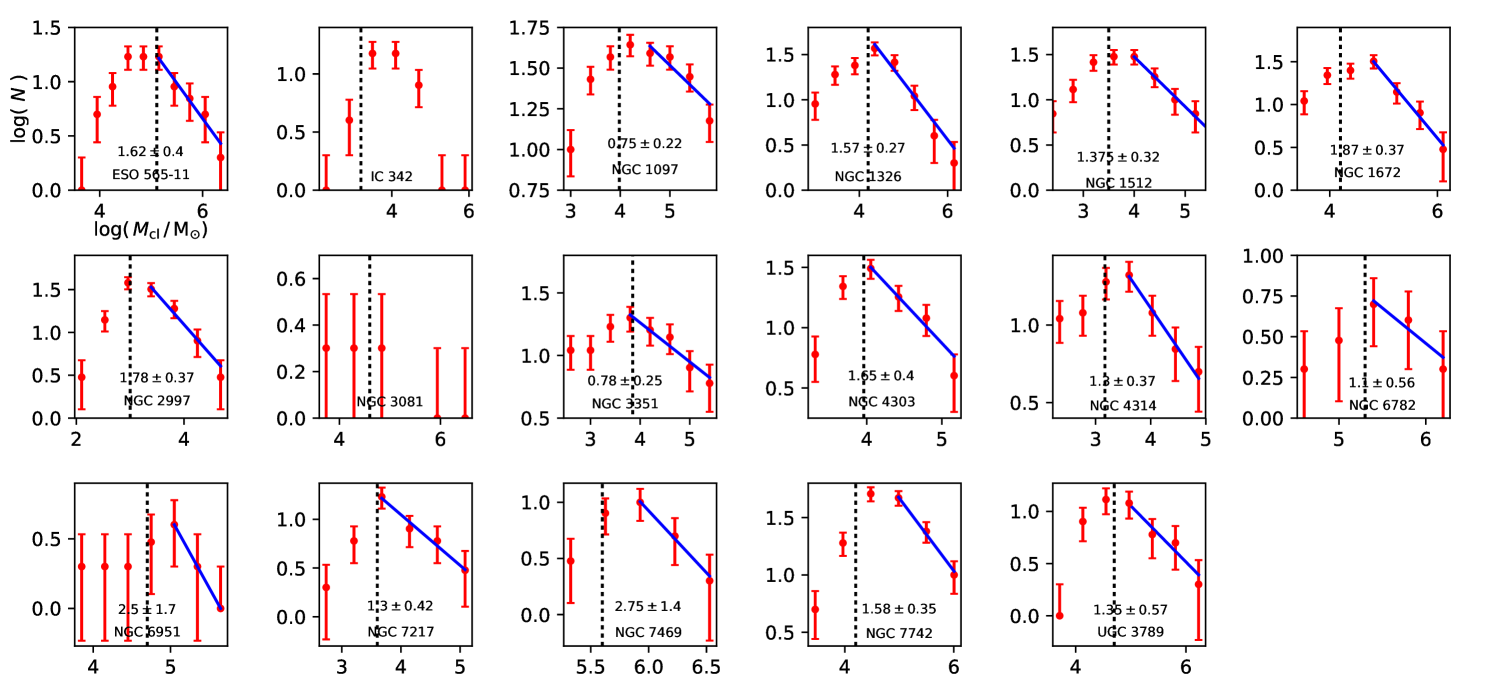
A number of early studies (e.g. de Grijs & Anders, 2012; Konstantopoulos et al., 2013; Väisänen et al., 2014) have revealed an environmental dependence of the timescale of young cluster disruption based on analyses of cluster mass functions (CMFs). CMFs are basic tools to explore the formation and evolution histories of entire star cluster populations, as well as of the imprints the galactic environment leaves on the properties of its cluster population. It is well-known that the distributions of young star cluster populations can be approximated by a power-law function of the form with for a large range of cluster masses in nearby spiral and starburst galaxies (e.g., Zhang & Fall, 1999; de Grijs et al., 2003; Portegies Zwart et al., 2010; Fall & Chandar, 2012). It is of paramount importance to understand what governs the cluster formation process and how the ring environment may affect their formation and evolution. A more systematic assessment of CMF evolution in such rings therefore has the potential to open up this entire field.
We next proceeded to explore the impact of various ring properties on the form of the CMF defined by young ring clusters. In Fig. 9, we show the ring CMFs of young star cluster populations, with ages younger than 10 Myr. The associated error bars are derived from Poissonian statistics in the respective mass bins. To the left of CMF turnover (commonly defined as the conservative detection limits) in each panel, these relatively low-mass star clusters are severely affected by incompleteness effects. The vertical dashed lines in each panel are the mass-detection limits calculated based on the corresponding 90% photometric completeness limit for the ring area only and for the most restrictive filter (see also Section 3.2 for a detailed discussion), and based on galev SSPs.
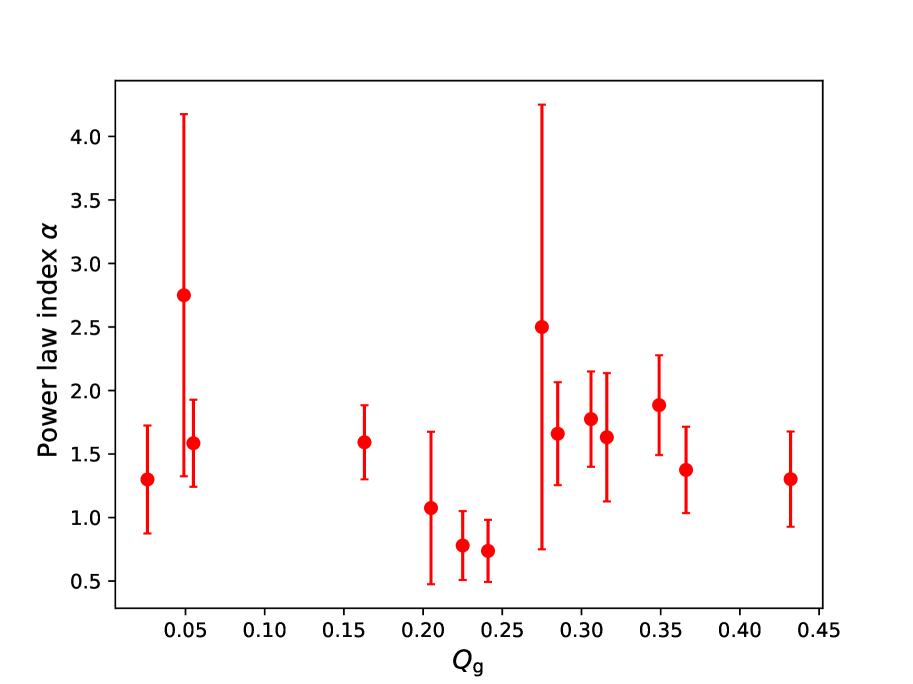
Since the mass-to-light ratio increases with age, we adopted the oldest age (10 Myr) to estimate the mass threshold. We can discern clearly, for all galaxies, that the cluster mass thresholds for the oldest age of 10 Myr are consistent with (or a little below) the observed peaks in the CMFs. We therefore used a pure power-law function to fit the data points at the high-mass ends, i.e. on the right-hand side of the CMFs, which are observationally most complete. The best-fitting indices and the associated errors are also included in each panel. The best-fitting power-laws are shown as blue lines. We did not fit power-law functions to IC 342 or NGC 3081 because of the small numbers of clusters in those galaxies. Figure 10 shows the best-fitting power-law index as a function of . It is not surprising that no tight relationship is observed given the complicated interplay between the local star-forming environments and the young star cluster populations. The bar strength may just be one of the dominant factors (in addition to the star-formation history, the gas content, the inflow rate, dynamical effects, etc.) in determining the properties of the young cluster systems in the rings. Further statistical analysis of larger ring samples is required before we can make definitive statements.
5. Summary and Conclusions
In this paper, we aimed to look for the possible correlations between ring properties and their host galaxy parameters, and investigate the influence of ring properties on their young star cluster systems. Based on an extensive survey of the literature and imaging archives (i.e. the Hubble Legacy Archive and the Spitzer Heritage Archive), we collected a catalog of 17 nearby nuclear rings which were observed and well-resolved in multiple passband by both the HST and Spitzer. Our sample is currently the most complete collection of nuclear rings with high-resolution observations, which enables us to simultaneously study the ring properties and their star cluster populations. We applied our recently improved method to our ring sample to derive the integrated ring properties, including their SEDs, the average ages, and the total stellar masses, while for each ring we also compiled catalogs of ring cluster populations with their ages and masses estimated based on fitting their SEDs with SSP models. The average ring age for the sample is around 1.2 Gyr, i.e. well within the average ring lifetime proposed by Comeron et al. (2010) based on the observed nuclear ring fraction in disk galaxies. However, we emphasize that our SED fit results are much more accurate than their rough estimations. The rings’ total stellar masses span a large range of .
We found that Sb-type () galaxies tend to have the highest ratios. Six nuclear rings (NGC 1512, NGC 1097, NGC 3351, NGC 4314, NGC 6951, and NGC 7217) have observational combinations of H and 8 m filters, allowing us to obtain their current ring SFRs, i.e. within the last 10 Myr, based on the prescription of Kennicutt et al. (2009). It is clear that increases with , and that the ring SFRs are correlated with the rings’ stellar masses, which is reminiscent of the main sequence of star-forming galaxies, but only for local starburst-ring regions in this case, with the two outlier galaxies NGC 1512 and NGC 4314 located slightly off-trend. A clearly decreasing relationship was found between SFR/ on the one hand and on the other, because the ring stellar mass coverage in our sample is much more extensive than their SFRs. We did not uncover any dependence of the YMC mass fraction (with respect to the ring stellar mass) on , probably due to small-number statistics. Excluding the outlier ring in NGC 7217, there are significant correlations between star-forming parameters (SFR and ) and the non-axisymmetric parameter , which thus corroborates previous discoveries that strongly barred galaxies tend to have lower SFRs in their nuclear rings. However, we caution that our sample is limited. Other physical effects may also play important roles in the complexities of the star-formation properties, and compilation of a more extended ring sample will help further address these fundamental questions. The number of rings with measured SFRs in our sample is too limited to make conclusive statements. We also found that the ring stellar masses resulting from SED fitting are much higher than the values derived based on assuming a constant current SFR over a ring’s lifetime, indicating that the star-forming history of nuclear ring is likely more complex.
Two special rings in NGC 1512 and NGC 4314 are usually located away from the trends observed for the other rings in our sample. We speculate that they may represent the young extremity of the nuclear ring age distribution rather than a separate class of nuclear rings. We explored the correlations, if any, between bar strength and YMC mass fraction for clusters more massive than and with ages younger than 10 Myr, although no clear trends were found. Since our sample covers a large mass range, as inferred from SED analysis, rings with higher stellar masses tend to be associated with lower YMC mass fractions, and high-mass rings appear to exhibit significant scatter in the distribution of the YMC mass fractions. These trends change little even if we exclude the two youngest rings in our sample (NGC 1512 and NGC 4314). This does not apply to the ring ages. Finally, we analyzed the CMFs of the YMC populations for all rings and fitted the high-mass regime, which suffers less from incompleteness effects, using the canonical power-law function. The best-fitting power-law indices were compared with the host galaxies’ bar strengths, but no correlations were found.
Acknowledgments
We are greatly indebted to Peter Anders for his help with the SED fitting techniques. This paper is based on observations obtained with the NASA/ESA HST and obtained from the Hubble Legacy Archive, which is a collaboration between the Space Telescope Science Institute (STScI/NASA), the Space Telescope European Coordinating Facility (ST-ECF/ESA), and the Canadian Astronomy Data Centre (CADC/NRC/CSA). This research has also made use of NASA’s Astrophysics Data System Abstract Service. This work was supported by the National Key Research and Development Program of China through grants 2017YFA0402702 (C. M. and R. d. G.) and 2016YFA0400702 (L. C. H). We also acknowledge research support from the National Natural Science Foundation of China through grants 11373010 and U1631102 (C. M. and R. d. G.), and 11303008 and 11473002 (L. C. H.).
References
- Allard et al. (2006) Allard, E. L., Knapen, J. H., Peletier, R. F., & Sarzi, M. 2006, MNRAS, 371, 1087
- Anders et al. (2004a) Anders, P., Bissantz, N., Fritze-v. Alvensleben, U., & de Grijs, R. 2004, MNRAS, 347, 196 SED fitting
- Anders et al. (2004b) Anders, P., de Grijs, R., Fritze-v. Alvensleben, U. et al. 2004b, MNRAS, 347, 17
- Athanassoula (1992) Athanassoula, E., 1992, MNRAS, 259, 345
- Barker et al. (2008) Barker, S., de Grijs, R., & Cerviño, M. 2008, A&A, 487, 711
- Barth et al. (1995) Barth, A. J., Ho, L. C., Filippenko, A. V., & Sargent, W. L. W. 1995, AJ, 110, 1009
- Bastian et al. (2005) Bastian, N., Gieles, M., Lamers, H. J. G. L. M., Scheepmaker, R. A., & de Grijs, R. 2005, A&A, 431, 905
- Behroozi et al. (2013) Behroozi, P. S., Wechsler, R. H., Conroy, C., 2013, ApJ, 770, 57
- Bell et al. (2003) Bell, E. F., McIntosh, D. H., Katz, N., & Weinberg, M. D. 2003, ApJS, 149, 289
- Benedict et al. (2002) Benedict, G. F., Howell, D. A., Jørgensen, I., Kenney, J. D. P., & Smith, B. J. 2002, AJ, 123, 1411
- Binney & Tremaine (2008) Binney, J., & Tremaine, S. 2008, Galactic Dynamics, eds J. Binney & S. Tremaine, 2nd edn. (Princeton NJ: Princeton Univ. Press)
- Böker et al. (2008) Böker, T., Falcón-Barroso, J., Schinnerer, E., Knapen, J. H., & Ryder, S. 2008, AJ, 135, 479
- Buta & Block (2001) Buta, R. J., & Block, D. L. 2001, ApJ, 550, 243
- Buta & Combes (1996) Buta, R., & Combes, F. 1996, Fund. Cosmic Phys., 17, 95
- Buta et al. (2000) Buta, R., Treuthardt, P. M., Byrd, G. G., & Crocker, D. A. 2000, AJ, 120, 1289
- Calzetti et al. (2000) Calzetti, D., Armus, L., Bohlin, R. C., et al. 2000, ApJ, 533, 682
- Combes & Gerin (1985) Combes, F., & Gerin, M. 1985, A&A, 150, 327
- Combes (2001) Combes, F. 2001, in Aretxaga I., Kunth, D., Mújica, R., eds, Advanced Lectures on the Starburst–AGN Connection. Singapore: World Scientific, p. 223
- Combes & Sanders (1981) Combes, F., & Sanders, R. H. 1981, A&A, 96, 164
- Comeron et al. (2010) Comeron, S., Knapen, J. H., Beckman, J. E., Laurikainen, E., Salo, H., Martínez-Valpuesta I., & Buta, R. J. 2010, MNRAS, 402, 2467
- Conroy & Gunn (2010) Conroy, C., & Gunn, J. E. 2010, ApJ, 712, 833
- Conroy et al. (2009) Conroy, C., Gunn, J. E., White, M. 2009, ApJ, 699, 486
- de Grijs et al. (2003) de Grijs, R., Anders, P., Lynds, R., Bastian, N., Lamers, H. J. G. L. M., & O’Neill Jr., E. J. 2003b, MNRAS, 343, 1285
- de Grijs et al. (2013) de Grijs, R., Anders, P., Zackrisson, E., & Östlin, G. 2013, MNRAS, 431, 2917
- de Grijs et al. (2017) de Grijs, R., Ma, C., Jia, S. Y., Ho, L. C., & Anders, P. 2017, MNRAS, 465, 2820
- de Grijs & Anders (2012) de Grijs, R., & Anders, P. 2012, ApJ, 758, L22
- de Grijs et al. (2005) de Grijs, R., Anders, P., Lamers, H. J. G. L. M., et al. 2005, MNRAS, 359, 874
- de Zeeuw et al. (2002) de Zeeuw, P. T., et al. 2002, MNRAS, 329, 513
- Eskridge et al. (2000) Eskridge, P. B., Frogel, J. A., Pogge, R. W., et al. 2000, AJ, 119, 536
- Fall & Chandar (2012) Fall, S. M., & Chandar, R. 2012, ApJ, 752, 96
- Gieles et al. (2005) Gieles, M., Bastian, N., Lamers, H. J. G. L. M., & Mout, J. N. 2005, A&A, 441, 949
- Hao et al. (2011) Hao, C.-N., Kennicutt, R. C., Johnson, B. D., et al. 2011, ApJ, 741, 124
- Ho et al. (1997) Ho, L. C., Filippenko, A. V., & Sargent, W. L. W. 1997, ApJ, 487, 591
- Kennicutt et al. (2009) Kennicutt, R. C., Hao, C.-N., Calzetti, D., et al. 2009, ApJ, 703, 1672
- Knapen (1999) Knapen, J. H. 1999, in ASP Conf. Ser. 187, The Evolution of Galaxies on Cosmological Timescales, eds J. E. Beckman & T. J. Mahoney (San Francisco: ASP), p. 73
- Knapen et al. (2006) Knapen, J. H., Mazzuca, L. M., Böker, T., Shlosman, I., Colina, L., Combes, F., & Axon, D. J. 2006, A&A, 448, 489
- Konstantopoulos et al. (2013) Konstantopoulos, I. S., Smith, L. J., Adamo, A., et al. 2013, AJ, 145, 137
- Kormendy & Kennicutt (2004) Kormendy, J., Kennicutt, R. C. Jr. 2004, ARA&A, 42, 603
- Kotulla et al. (2009) Kotulla, R., Fritze, U., Weilbacher, P., & Anders, P. 2009, MNRAS, 396, 462
- Krist & Hook (1997) Krist, J. E., & Hook, R. N. 1997, HST Calibration Workshop with a New Generation of Instruments, Casertano, S., Jedrzejewski, R., Keyes, T., & Stevens, M., eds, (Baltimore: STScI), p. 192
- Kroupa (2001) Kroupa, P. 2001, MNRAS, 322, 231
- Lauer et al. (2005) Lauer, T. R., Faber, S. M., Gebhardt, K., et al. 2005, AJ, 129, 2138
- Laurikainen et al. (2009) Laurikainen E., Salo H., Buta R., & Knapen J. H. 2009, ApJ, 692, 34
- Laurikainen et al. (2004) Laurikainen, E., Salo, H., Buta, R., & Vasylyev, S. 2004, MNRAS, 355, 1251
- Li et al. (2015) Li, S., de Grijs, R., Anders, P., & Li, C. 2015, ApJS, 216, 6
- Li et al. (2015) Li, Z., Shen, J., & Kim W.-T. 2015, ApJ, 806, 150
- Lin et al. (2017) Lin, L., Belfiore, F., Pan, H.-A., et al. 2017, ApJ, 851, 18
- Leitherer et al. (1999) Leitherer, C., Schaerer, D., Goldader, J. D., et al. 1999, ApJS, 123, 3
- Ma et al. (2017) Ma, C., de Grijs, R., & Ho, L. C. 2017, ApJS, 230, 14
- Maoz et al. (2001) Maoz, D., Barth, A. J., Ho, L. C., Sternberg, A., & Filippenko, A. V. 2001, AJ, 121, 3048
- Maoz et al. (1996) Maoz, D., Barth, A. J., Sternberg, A., et al. 1996, AJ, 111, 2248
- Marinova & Jogee (2007) Marinova, I., & Jogee, S. 2007, ApJ, 659, 1176
- Mazzuca et al. (2008) Mazzuca, L. M., Knapen, J. H., Veilleux, S., & Regan, M. W. 2008, ApJ, 174, 337
- Mazzuca et al. (2006) Mazzuca, L. M., Sarzi M., Knapen, J. H., Veilleux, S., & Swaters, R. 2006, ApJ, 649, 79
- Mazzuca et al. (2011) Mazzuca, L. M., Swaters, R. A., Knapen, J. H., & Veilleux, S. 2011, ApJ, 739, 104
- Merrifield & Kuijken (1994) Merrifield, M. R., & Kuijken, K. 1994, ApJ, 432, 575
- Mulchaey & Regan (1997) Mulchaey, J. S., & Regan, M. W. 1997, ApJ, 482, 135
- Pannella et al. (2015) Pannella, M., Elbaz, D., Daddi, E., et al. 2015, ApJ, 807, 141
- Peng et al. (2010) Peng, C. Y., Ho, L. C., Impey, C. D., et al. 2010, AJ, 139, 2097
- Portegies Zwart et al. (2010) Portegies Zwart, S. F., McMillan, S. L. W., & Gieles, M. 2010, ARA&A, 48, 431
- Regan & Teuben (2003) Regan, M. W., & Teuben, P. 2003, ApJ, 582, 723
- Renzini & Peng (2015) Renzini, A., Peng, Y., 2015, ApJ, 801, L29
- Sarzi et al. (2007) Sarzi, M., Allard, E. L, Knapen, J. H., & Mazzuca, L. M. 2007, MNRAS, 380, 949
- Sheth et al. (2005) Sheth, K., Volgel, S. N., Regan, M. W., Thornley, M.D., & Teuben, P. J. 2005, ApJ, 632, 217
- Shlosman et al. (1990) Shlosman, I., Begelman, M. C., & Frank, J. 1990, Natur, 345, 679
- Shlosman (2001) Shlosman, I., 2001, in Knapen, J. H., Beckman, J. E., Shlosman, I., Mahoney, T. J., eds, ASP Conf. Ser. Vol. 249, The Central Kiloparsec of Starbursts and AGN: The La Palma Connection. San Francisco: ASP, p. 55
- Sil’chenko & Moiseev (2006) Sil’chenko, O. K., & Moiseev, A. V. 2006, AJ, 131, 1336
- Speagle et al. (2014) Speagle, J. S., Steinhardt, C. L., Capak, P. L., et al., 2014, ApJS, 214, 15
- Tinsley (1968) Tinsley, B. M. 1968, ApJ, 151, 547
- Väisänen et al. (2014) Väisänen, P., Barway, S., & Randriamanakoto, Z. 2014, ApJ, 797, L16
- van de Ven & Fathi (2010) van de Ven, G., & Fathi, K. 2010, ApJ, 723, 767
- van der Laan et al. (2013) van der Laan, T. P. R., Schinnerer, E., Emsellem, E., et al. 2013, A&A, 551, A81
- Weiner et al. (2001) Weiner, B. J., Sellwood, J. A., & Williams, T. B. 2001, ApJ, 546, 931
- Wozniak et al. (1995) Wozniak, H., Friedli, D., Martinet, L., Martin, P., & Bratschi, P. 1995, A&A, 111, 115
- Zhang & Fall (1999) Zhang, Q., & Fall, S. M. 1999, ApJL, 527, L81
In this Appendix we provide our star cluster data in tabulated form. For each galaxy, we provide one table containing the cluster photometry and a second including the derived physical parameters. Note that we do not provide the photometry for NGC 1512 and NGC 6951, given that those tables were already published by de Grijs et al. (2017).
All tables are published in their entirety in the electronic version of The Astrophysical Journal. Smaller portions are shown here for guidance regarding their form and content.
| # | R.A. (J2000) | Dec. (J2000) | |||||||
| (hh mm ss.ss) | (mag) | (mag) | (mag) | (mag) | (mag) | ||||
| 0 | 142.3189 | 9 29 16.54 | 20.3805 | 20 22 49.98 | 23.924.11 | —— | 25.001.44 | 26.581.23 | —— |
| 1 | 142.3178 | 9 29 16.29 | 20.3805 | 20 22 50.03 | 21.601.32 | 22.150.51 | 22.490.44 | 22.940.18 | 24.100.27 |
| 2 | 142.3193 | 9 29 16.64 | 20.3805 | 20 22 49.81 | 21.471.23 | 23.791.12 | 24.551.18 | 24.560.43 | 26.511.04 |
| 3 | 142.3178 | 9 29 16.29 | 20.3804 | 20 22 49.80 | 22.922.49 | 23.621.02 | 23.990.88 | 24.400.37 | 25.480.52 |
| 4 | 142.3173 | 9 29 16.15 | 20.3804 | 20 22 49.75 | 21.431.24 | 23.440.97 | 23.840.84 | 23.930.32 | 24.760.40 |
| # | log( ) | log() | |||||||
| Best | Min. | Max. | Best | Min. | Max. | (mag) | |||
| 0 | 6.60 | 6.60 | 10.18 | 6.00 | 6.00 | 6.00 | 0.80 | ||
| 1 | 6.60 | 6.60 | 8.16 | 5.00 | 4.63 | 6.04 | 0.20 | ||
| 2 | 6.60 | 6.60 | 10.18 | 5.34 | 4.67 | 10.20 | 0.80 | ||
| 3 | 6.60 | 6.60 | 9.81 | 4.58 | 4.10 | 6.83 | 0.30 | ||
| 4 | 6.60 | 6.60 | 8.73 | 4.93 | 4.38 | 6.11 | 0.40 | ||
| # | R.A. (J2000) | Dec. (J2000) | |||||||
| (hh mm ss.ss) | (mag) | (mag) | (mag) | (mag) | (mag) | ||||
| 0 | 56.7021 | 3 46 48.52 | 68.0955 | 68 5 43.80 | 22.260.74 | 21.680.37 | 21.370.23 | 21.380.21 | 21.720.18 |
| 1 | 56.7019 | 3 46 48.46 | 68.0956 | 68 5 44.39 | 21.740.63 | 21.620.50 | 22.000.65 | 22.080.62 | 22.910.88 |
| 2 | 56.7021 | 3 46 48.50 | 68.0956 | 68 5 44.43 | 20.910.43 | 20.810.33 | 20.730.26 | 20.450.18 | 20.280.09 |
| 3 | 56.7009 | 3 46 48.23 | 68.0957 | 68 5 44.54 | 22.861.03 | 22.580.67 | 21.790.33 | 21.470.24 | 21.710.21 |
| 4 | 56.7021 | 3 46 48.52 | 68.0957 | 68 5 44.56 | 19.780.29 | 19.230.18 | 19.180.16 | 19.250.16 | 19.390.12 |
| # | log( ) | log() | |||||||
| Best | Min. | Max. | Best | Min. | Max. | (mag) | |||
| 0 | 6.60 | 6.60 | 8.95 | 3.96 | 3.40 | 4.70 | 0.80 | ||
| 1 | 6.60 | 6.60 | 8.36 | 3.20 | 2.43 | 3.90 | 0.50 | ||
| 2 | 6.90 | 6.60 | 8.20 | 4.03 | 3.82 | 5.20 | 0.50 | ||
| 3 | 9.38 | 6.60 | 10.04 | 4.93 | 3.32 | 5.56 | 0.00 | ||
| 4 | 6.60 | 6.60 | 8.37 | 4.69 | 4.13 | 5.49 | 0.70 | ||
| # | R.A. (J2000) | Dec. (J2000) | ||||||
| (hh mm ss.ss) | (mag) | (mag) | (mag) | (mag) | ||||
| 0 | 41.5828 | 2 46 19.87 | 30.2772 | 30 16 38.27 | 23.460.83 | 22.420.37 | 22.850.38 | 23.610.32 |
| 1 | 41.5812 | 2 46 19.49 | 30.2784 | 30 16 42.29 | —— | 25.361.51 | 24.140.69 | 23.770.33 |
| 2 | 41.5815 | 2 46 19.56 | 30.2779 | 30 16 40.57 | 24.101.13 | 24.491.09 | 23.540.54 | 24.260.46 |
| 3 | 41.5834 | 2 46 20.02 | 30.2763 | 30 16 34.74 | 25.241.91 | 24.310.90 | 24.280.73 | 23.980.36 |
| 4 | 41.5829 | 2 46 19.91 | 30.2766 | 30 16 35.89 | 24.001.07 | 23.390.58 | 23.250.45 | 23.580.30 |
| # | log( ) | log() | |||||||
| Best | Min. | Max. | Best | Min. | Max. | (mag) | |||
| 0 | 8.58 | 6.60 | 9.05 | 5.16 | 4.00 | 5.67 | 0.00 | ||
| 1 | 6.60 | 6.60 | 10.18 | 4.91 | 4.25 | 8.75 | 1.10 | ||
| 2 | 6.60 | 6.60 | 10.18 | 4.00 | 3.47 | 6.39 | 0.40 | ||
| 3 | 7.45 | 6.60 | 10.18 | 4.87 | 3.89 | 6.43 | 0.60 | ||
| 4 | 9.00 | 6.60 | 10.18 | 5.50 | 3.73 | 6.43 | 0.10 | ||
| # | R.A. (J2000) | Dec. (J2000) | |||||||
| (hh mm ss.ss) | (mag) | (mag) | (mag) | (mag) | (mag) | ||||
| 0 | 50.9851 | 3 23 56.42 | 36.4654 | 36 27 55.45 | —— | —— | 23.440.89 | 22.740.23 | 23.650.38 |
| 1 | 50.9845 | 3 23 56.30 | 36.4653 | 36 27 55.33 | 18.440.31 | 19.040.14 | 19.680.18 | 20.460.24 | 21.660.47 |
| 2 | 50.9857 | 3 23 56.57 | 36.4653 | 36 27 55.23 | 21.161.24 | 20.430.25 | 20.420.22 | 20.550.15 | 20.990.16 |
| 3 | 50.9848 | 3 23 56.37 | 36.4653 | 36 27 55.25 | 21.821.63 | 21.620.45 | 21.270.30 | 21.720.22 | 22.510.31 |
| 4 | 50.9857 | 3 23 56.57 | 36.4653 | 36 27 55.23 | 21.811.78 | 20.890.31 | 20.910.27 | 21.270.19 | 21.480.19 |
| # | log( ) | log() | |||||||
| Best | Min. | Max. | Best | Min. | Max. | (mag) | |||
| 0 | 6.60 | 6.60 | 10.18 | 4.41 | 3.43 | 6.30 | 0.70 | ||
| 1 | 6.60 | 6.60 | 6.60 | 4.35 | 4.35 | 4.35 | 0.00 | ||
| 2 | 6.90 | 6.60 | 8.46 | 4.80 | 4.43 | 6.11 | 0.20 | ||
| 3 | 8.15 | 6.60 | 8.65 | 5.14 | 3.96 | 5.57 | 0.00 | ||
| 4 | 7.20 | 6.60 | 8.38 | 5.02 | 4.22 | 5.87 | 0.20 | ||
| # | R.A. (J2000) | Dec. (J2000) | |||||||
|---|---|---|---|---|---|---|---|---|---|
| (hh mm ss.ss) | (mag) | (mag) | (mag) | (mag) | (mag) | ||||
| 0 | 71.4280 | 4 45 42.73 | 59.2485 | 59 14 54.68 | 19.820.17 | 19.690.08 | 19.940.11 | 19.930.04 | 20.520.09 |
| 1 | 71.4274 | 4 45 42.59 | 59.2485 | 59 14 54.66 | 19.080.12 | 19.520.08 | 20.210.13 | 20.330.06 | 21.480.12 |
| 2 | 71.4281 | 4 45 42.74 | 59.2484 | 59 14 54.48 | 19.900.18 | 19.780.10 | 20.150.13 | 20.180.07 | 20.760.09 |
| 3 | 71.4294 | 4 45 43.06 | 49.2484 | 59 14 54.40 | 23.140.83 | 22.840.42 | 22.480.39 | 22.260.17 | 22.360.18 |
| 4 | 71.4284 | 4 45 42.82 | 59.2484 | 59 14 54.37 | 20.900.29 | 20.540.15 | 21.140.25 | 21.240.18 | 22.250.46 |
| # | log( ) | log() | |||||||
| Best | Min. | Max. | Best | Min. | Max. | (mag) | |||
| 0 | 6.60 | 6.60 | 8.49 | 5.37 | 4.86 | 6.23 | 0.50 | ||
| 1 | 6.60 | 6.60 | 6.60 | 4.61 | 4.61 | 4.79 | 0.10 | ||
| 2 | 7.78 | 6.60 | 8.40 | 5.70 | 4.62 | 6.04 | 0.10 | ||
| 3 | 6.60 | 6.60 | 10.05 | 5.18 | 4.33 | 6.54 | 1.00 | ||
| 4 | 8.11 | 6.60 | 8.51 | 5.34 | 4.19 | 5.64 | 0.00 | ||
| # | R.A. (J2000) | Dec. (J2000) | ||||||||
|---|---|---|---|---|---|---|---|---|---|---|
| (hh mm ss.ss) | (mag) | (mag) | (mag) | (mag) | (mag) | (mag) | ||||
| 0 | 146.4102 | 9 45 38.44 | 31.1929 | 31 11 34.50 | 25.725.18 | 25.422.31 | 25.341.98 | 25.580.95 | 26.210.71 | 28.242.55 |
| 1 | 146.4110 | 9 45 38.65 | 31.1928 | 31 11 34.25 | —— | 25.762.71 | 25.962.63 | 24.270.50 | 25.660.50 | 25.250.52 |
| 2 | 146.4107 | 9 45 38.59 | 31.1926 | 31 11 33.40 | —— | 24.211.32 | 24.251.20 | 24.980.72 | 25.510.48 | 25.780.68 |
| 3 | 146.4105 | 9 45 38.52 | 31.1925 | 31 11 33.31 | 22.511.15 | 22.710.66 | 22.960.66 | 23.880.42 | 24.290.26 | 25.390.56 |
| 4 | 146.4104 | 9 45 38.50 | 31.1925 | 31 11 33.32 | 22.561.18 | 22.670.65 | 23.040.69 | 24.050.48 | 25.220.53 | 25.590.69 |
| # | log( ) | log() | |||||||
| Best | Min. | Max. | Best | Min. | Max. | (mag) | |||
| 0 | 6.60 | 6.60 | 10.18 | 1.89 | 1.89 | 7.95 | 0.00 | ||
| 1 | 7.20 | 6.60 | 10.18 | 3.00 | 2.52 | 5.39 | 0.00 | ||
| 2 | 8.00 | 6.60 | 10.18 | 3.43 | 2.27 | 5.38 | 0.00 | ||
| 3 | 6.60 | 6.60 | 7.78 | 2.62 | 2.62 | 3.80 | 0.00 | ||
| 4 | 6.60 | 6.60 | 7.60 | 2.51 | 2.51 | 3.55 | 0.00 | ||
| # | R.A. (J2000) | Dec. (J2000) | |||||||
|---|---|---|---|---|---|---|---|---|---|
| (hh mm ss.ss) | (mag) | (mag) | (mag) | (mag) | (mag) | ||||
| 0 | 149.8739 | 9 59 29.74 | 22.8274 | 22 49 38.98 | 20.230.68 | 20.830.28 | 21.380.26 | 22.120.14 | 23.230.24 |
| 1 | 149.8736 | 9 59 29.66 | 22.82746 | 22 49 38.88 | 21.521.26 | 21.490.38 | 21.510.28 | 21.920.17 | 22.190.22 |
| 2 | 149.8744 | 9 59 29.86 | 22.8273 | 22 49 38.62 | 22.372.23 | 21.070.35 | 19.970.18 | 19.820.13 | 19.700.11 |
| 3 | 149.8733 | 9 59 29.60 | 22.8273 | 22 49 38.39 | 20.790.89 | 20.990.31 | 21.250.26 | 21.450.14 | 21.890.21 |
| 4 | 149.8724 | 9 59 29.39 | 22.8272 | 22 49 38.14 | 22.932.42 | 24.641.81 | 23.800.88 | 24.260.63 | 26.905.20 |
| # | log( ) | log() | |||||||
| Best | Min. | Max. | Best | Min. | Max. | (mag) | |||
| 0 | 6.60 | 6.60 | 7.30 | 4.37 | 4.17 | 4.99 | 0.10 | ||
| 1 | 7.30 | 6.60 | 8.40 | 5.38 | 4.46 | 6.04 | 0.20 | ||
| 2 | 8.13 | 6.60 | 10.07 | 7.37 | 6.71 | 8.10 | 0.60 | ||
| 3 | 7.30 | 6.60 | 8.16 | 5.52 | 4.76 | 5.97 | 0.20 | ||
| 4 | 6.60 | 6.60 | 10.18 | 3.61 | 3.23 | 10.11 | 0.20 | ||
| # | R.A. (J2000) | Dec. (J2000) | |||||||||
| (hh mm ss.ss) | (mag) | (mag) | (mag) | (mag) | (mag) | (mag) | (mag) | ||||
| 0 | 160.9910 | 10 43 57.85 | 11.7014 | 11 42 5.28 | 23.021.064 | 22.540.55 | 21.790.27 | 21.960.19 | 21.890.15 | 22.090.20 | 22.490.18 |
| 1 | 160.9907 | 10 43 57.77 | 11.7014 | 11 42 5.30 | 22.480.82 | 23.210.75 | 23.910.83 | 24.080.66 | 24.570.82 | 25.031.15 | —— |
| 2 | 160.9905 | 10 43 57.72 | 11.7015 | 11 42 5.64 | 21.960.65 | 21.880.40 | 22.050.31 | 22.310.24 | 22.340.18 | 22.770.27 | 23.740.41 |
| 3 | 160.9909 | 10 43 57.83 | 11.7016 | 11 42 5.89 | 22.410.80 | 23.040.71 | 23.180.57 | 23.760.53 | 23.950.52 | 24.520.74 | 25.390.95 |
| 4 | 160.9903 | 10 43 57.69 | 11.7016 | 11 42 5.93 | 20.000.26 | 20.240.19 | 20.040.12 | 20.290.09 | 20.190.07 | 20.350.09 | 20.700.08 |
| # | log( ) | log() | |||||||
| Best | Min. | Max. | Best | Min. | Max. | (mag) | |||
| 0 | 8.89 | 6.60 | 9.13 | 5.27 | 3.84 | 5.53 | 0.00 | ||
| 1 | 6.60 | 6.60 | 7.88 | 2.32 | 2.32 | 3.74 | 0.00 | ||
| 2 | 6.60 | 6.60 | 8.19 | 3.60 | 3.29 | 4.53 | 0.30 | ||
| 3 | 6.60 | 6.60 | 7.90 | 2.68 | 2.48 | 3.78 | 0.10 | ||
| 4 | 6.90 | 6.90 | 8.09 | 4.55 | 4.55 | 5.71 | 0.20 | ||
| # | R.A. (J2000) | Dec. (J2000) | |||||
| (hh mm ss.ss) | (mag) | (mag) | (mag) | ||||
| 0 | 185.4785 | 12 21 54.85 | 4.4727 | 4 28 21.86 | 23.881.13 | 23.580.39 | 23.660.26 |
| 1 | 185.4792 | 12 21 55.02 | 4.4727 | 4 28 21.94 | 24.201.31 | 25.010.93 | 25.320.64 |
| 2 | 185.4789 | 12 21 54.95 | 4.4728 | 4 28 22.08 | 22.890.71 | 23.180.30 | 24.190.34 |
| 3 | 185.4790 | 12 21 54.98 | 4.4729 | 4 28 22.52 | 21.890.45 | 21.660.19 | 23.040.28 |
| 4 | 185.4793 | 12 21 55.04 | 4.4729 | 4 28 22.53 | 22.270.54 | 22.470.22 | 23.630.25 |
| # | log( ) | log() | |||||||
| Best | Min. | Max. | Best | Min. | Max. | (mag) | |||
| 0 | 6.60 | 6.60 | 10.18 | 4.56 | 3.54 | 6.38 | 0.90 | ||
| 1 | 6.60 | 6.60 | 10.18 | 3.81 | 2.79 | 8.10 | 0.80 | ||
| 2 | 6.60 | 6.60 | 8.59 | 3.86 | 3.33 | 4.96 | 0.40 | ||
| 3 | 6.60 | 6.60 | 8.68 | 4.35 | 3.85 | 5.52 | 0.40 | ||
| 4 | 6.60 | 6.60 | 8.49 | 4.12 | 3.62 | 5.11 | 0.40 | ||
| # | R.A. (J2000) | Dec. (J2000) | |||||||
| (hh mm ss.ss) | (mag) | (mag) | (mag) | (mag) | (mag) | ||||
| 0 | 185.6327 | 12 22 31.86 | 29.8932 | 29 53 35.77 | 23.280.87 | 23.450.69 | 24.390.42 | 24.490.30 | 25.020.48 |
| 1 | 185.6340 | 12 22 32.16 | 29.8934 | 29 53 36.40 | 22.220.55 | 21.230.25 | 21.900.13 | 22.240.11 | 22.430.13 |
| 2 | 185.6345 | 12 22 32.28 | 29.8935 | 29 53 36.65 | 22.080.51 | 22.170.39 | 23.080.27 | 23.720.31 | 23.560.28 |
| 3 | 185.6342 | 12 22 32.21 | 29.8935 | 29 53 36.66 | 21.640.41 | 21.630.30 | 22.190.15 | 22.410.11 | 22.580.14 |
| 4 | 185.6344 | 12 22 32.26 | 29.8935 | 29 53 36.93 | 22.000.51 | 22.280.44 | 23.330.45 | 23.450.36 | 22.940.21 |
| # | log( ) | log() | |||||||
| Best | Min. | Max. | Best | Min. | Max. | (mag) | |||
| 0 | 7.30 | 6.60 | 8.38 | 3.25 | 2.47 | 4.03 | 0.00 | ||
| 1 | 8.30 | 7.56 | 8.75 | 5.00 | 4.58 | 5.21 | 0.10 | ||
| 2 | 7.30 | 6.60 | 8.19 | 3.73 | 3.16 | 4.36 | 0.00 | ||
| 3 | 7.38 | 6.90 | 8.31 | 4.28 | 3.49 | 4.84 | 0.10 | ||
| 4 | 7.20 | 6.90 | 8.20 | 3.83 | 3.21 | 4.62 | 0.10 | ||
| # | R.A. (J2000) | Dec. (J2000) | |||||||
| (hh mm ss.ss) | (mag) | (mag) | (mag) | (mag) | (mag) | ||||
| 0 | 290.9916 | 19 23 57.99 | 59.9239 | 59 55 26.16 | —— | 23.210.90 | 23.270.41 | 23.730.33 | 24.350.49 |
| 1 | 290.9910 | 19 23 57.84 | 59.9238 | 59 55 25.68 | 21.010.99 | 21.320.38 | 22.310.35 | 23.190.53 | 24.551.41 |
| 2 | 290.9905 | 19 23 57.72 | 59.9237 | 59 55 25.49 | 20.270.70 | 20.890.30 | 21.720.21 | 22.140.19 | 23.010.29 |
| 3 | 290.9902 | 19 23 57.65 | 59.9237 | 59 55 25.57 | 19.970.62 | 19.880.19 | 20.230.12 | 20.700.12 | 21.260.15 |
| 4 | 290.9928 | 19 23 58.29 | 59.9236 | 59 55 25.23 | 20.880.95 | 21.180.35 | 21.240.14 | 21.490.09 | 21.850.12 |
| # | log( ) | log() | |||||||
| Best | Min. | Max. | Best | Min. | Max. | (mag) | |||
| 0 | 8.11 | 6.60 | 8.58 | 5.49 | 4.30 | 5.94 | 0.00 | ||
| 1 | 6.60 | 6.60 | 7.81 | 4.40 | 4.40 | 5.76 | 0.00 | ||
| 2 | 7.30 | 6.60 | 7.68 | 5.58 | 4.95 | 5.88 | 0.00 | ||
| 3 | 7.94 | 6.60 | 8.16 | 6.59 | 5.71 | 6.78 | 0.00 | ||
| 4 | 7.64 | 6.60 | 8.30 | 6.38 | 5.55 | 6.65 | 0.20 | ||
| # | log( ) | log() | |||||||
| Best | Min. | Max. | Best | Min. | Max. | (mag) | |||
| 0 | 9.90 | 6.60 | 10.10 | 6.53 | 4.93 | 6.82 | 0.10 | ||
| 1 | 7.15 | 6.60 | 9.40 | 5.02 | 4.29 | 5.87 | 0.60 | ||
| 2 | 7.25 | 6.95 | 7.35 | 6.15 | 5.66 | 6.36 | 0.80 | ||
| 3 | 7.25 | 6.90 | 8.40 | 5.00 | 4.37 | 5.73 | 0.60 | ||
| 4 | 7.30 | 6.95 | 7.45 | 5.54 | 4.99 | 5.65 | 0.30 | ||
| # | R.A. (J2000) | Dec. (J2000) | ||||||
| (hh mm ss.ss) | (mag) | (mag) | (mag) | (mag) | ||||
| 0 | 331.9677 | 22 7 52.26 | 31.3564 | 31 21 23.08 | 24.751.73 | 23.690.42 | 24.030.47 | 24.820.33 |
| 1 | 331.9665 | 22 7 51.97 | 31.3566 | 31 21 23.82 | 23.721.07 | 23.860.49 | 24.130.55 | 24.860.43 |
| 2 | 331.9663 | 22 7 51.91 | 31.3566 | 31 21 23.95 | 23.280.87 | 23.010.31 | 23.550.38 | 24.940.37 |
| 3 | 331.9690 | 22 7 52.57 | 31.3567 | 31 21 24.46 | 23.160.83 | 23.030.33 | 23.280.35 | 23.770.23 |
| 4 | 331.9695 | 22 7 52.69 | 31.3568 | 31 21 24.54 | 23.711.07 | 24.210.57 | 23.800.44 | 25.240.46 |
| # | log( ) | log() | |||||||
| Best | Min. | Max. | Best | Min. | Max. | (mag) | |||
| 0 | 8.45 | 6.60 | 9.72 | 4.64 | 3.19 | 5.76 | 0.00 | ||
| 1 | 8.58 | 6.60 | 10.04 | 4.69 | 3.15 | 5.98 | 0.00 | ||
| 2 | 6.60 | 6.60 | 8.58 | 3.75 | 3.22 | 4.96 | 0.30 | ||
| 3 | 7.64 | 6.60 | 8.94 | 4.74 | 3.58 | 5.44 | 0.20 | ||
| 4 | 8.50 | 6.60 | 10.10 | 4.58 | 3.09 | 5.99 | 0.00 | ||
| # | R.A. (J2000) | Dec. (J2000) | |||||||
| (hh mm ss.ss) | (mag) | (mag) | (mag) | (mag) | (mag) | ||||
| 0 | 345.8152 | 23 3 15.64 | 8.8737 | 8 52 25.54 | 18.460.09 | 18.840.04 | 19.170.07 | 19.600.04 | 20.400.05 |
| 1 | 345.8150 | 23 3 15.62 | 8.8737 | 8 52 25.62 | 19.640.16 | 19.710.09 | 19.750.10 | 20.000.07 | 20.350.07 |
| 2 | 345.8152 | 23 3 15.66 | 8.8737 | 8 52 25.67 | 20.220.22 | 20.550.13 | 20.310.13 | 21.020.13 | 21.56 0.14 |
| 3 | 345.8149 | 23 3 15.58 | 8.8737 | 8 52 25.66 | 19.960.18 | 19.940.07 | 20.280.11 | 20.380.06 | 20.910.08 |
| 4 | 345.8151 | 23 3 15.63 | 8.8738 | 8 52 25.73 | 21.150.32 | 21.710.23 | 22.050.33 | 22.450.27 | 23.260.51 |
| # | log( ) | log() | |||||||
| Best | Min. | Max. | Best | Min. | Max. | (mag) | |||
| 0 | 6.60 | 6.60 | 7.81 | 6.42 | 6.42 | 7.19 | 0.20 | ||
| 1 | 6.90 | 6.60 | 8.27 | 6.37 | 6.20 | 7.52 | 0.20 | ||
| 2 | 6.90 | 6.60 | 8.27 | 5.69 | 5.69 | 6.96 | 0.00 | ||
| 3 | 7.72 | 6.60 | 8.28 | 6.89 | 5.86 | 7.21 | 0.10 | ||
| 4 | 6.60 | 6.60 | 7.98 | 5.29 | 4.94 | 6.18 | 0.20 | ||
| # | R.A. (J2000) | Dec. (J2000) | ||||||
| (hh mm ss.ss) | (mag) | (mag) | (mag) | (mag) | ||||
| 0 | 356.0654 | 23 44 15.69 | 10.7636 | 10 45 49.27 | 25.122.29 | 23.940.42 | 26.342.67 | 25.160.75 |
| 1 | 356.0650 | 23 44 15.62 | 10.7637 | 10 45 49.53 | 23.971.21 | 23.980.32 | 25.621.05 | 25.350.55 |
| 2 | 356.0667 | 23 44 16.03 | 10.7638 | 10 45 49.83 | 24.181.33 | 24.930.61 | 24.420.38 | 25.860.83 |
| 3 | 356.0663 | 23 44 15.91 | 10.7638 | 10 45 49.97 | 25.272.29 | 25.400.68 | 25.540.63 | 26.040.72 |
| 4 | 356.0670 | 23 44 16.09 | 10.7638 | 10 45 49.95 | —— | 24.520.40 | 24.360.34 | 24.150.27 |
| # | log( ) | log() | |||||||
| Best | Min. | Max. | Best | Min. | Max. | (mag) | |||
| 0 | 6.60 | 6.60 | 10.18 | 4.06 | 3.79 | 6.67 | 0.20 | ||
| 1 | 6.60 | 6.60 | 10.18 | 3.88 | 3.74 | 6.50 | 0.10 | ||
| 2 | 6.60 | 6.60 | 10.18 | 4.23 | 3.56 | 8.89 | 0.50 | ||
| 3 | 6.60 | 6.60 | 10.18 | 4.13 | 3.32 | 8.65 | 0.60 | ||
| 4 | 8.71 | 6.90 | 10.18 | 6.37 | 4.71 | 9.18 | 0.70 | ||
| # | R.A. (J2000) | Dec. (J2000) | |||||
| (hh mm ss.ss) | (mag) | (mag) | (mag) | ||||
| 0 | 41.5856 | 2 46 20.56 | 30.2757 | 30 16 32.72 | 25.402.09 | 24.621.06 | 24.710.53 |
| 1 | 41.5862 | 2 46 20.68 | 30.2752 | 30 16 31.03 | 23.891.04 | 23.830.74 | 24.570.52 |
| 2 | 41.5857 | 2 46 20.57 | 30.2756 | 30 16 32.35 | 22.570.59 | 22.140.38 | 22.210.25 |
| 3 | 41.5857 | 2 46 20.57 | 30.2756 | 30 16 32.24 | 23.350.90 | 22.950.68 | 22.710.39 |
| 4 | 41.5859 | 2 46 20.61 | 30.2754 | 30 16 31.66 | 22.680.63 | 23.110.62 | 25.031.26 |
| # | log( ) | log() | |||||||
| Best | Min. | Max. | Best | Min. | Max. | (mag) | |||
| 0 | 6.60 | 6.60 | 10.18 | 5.09 | 4.56 | 8.68 | 0.80 | ||
| 1 | 8.46 | 6.60 | 10.18 | 5.78 | 4.14 | 7.01 | 0.20 | ||
| 2 | 6.60 | 6.60 | 9.82 | 6.07 | 5.18 | 7.65 | 0.80 | ||
| 3 | 6.90 | 6.60 | 10.07 | 5.46 | 5.08 | 7.59 | 0.50 | ||
| 4 | 6.60 | 6.60 | 10.18 | 4.47 | 4.01 | 8.06 | 0.20 | ||