Electronic band structure of optimal superconductors:
from cuprates to ferropnictides and back again
Abstract
While the beginning decade of the high- cuprates era passed under domination of local theories, Abrikosov was one of the few who took seriously the electronic band structure of cuprates, stressing the importance of an extended Van Hove singularity near the Fermi level. These ideas have not been widely accepted that time mainly because of a lack of experimental evidence for correlation between saddle point position and superconductivity. In this short contribution, based on the detailed comparison of the electronic band structures of different families of cuprates and iron based superconductors I argue that a general mechanism of the enhancement in all known high- superconductors is likely related with the proximity of certain Van Hove singularities to the Fermi level. While this mechanism remains to be fully understood, one may conclude that it is not related with the electron density of states but likely with some kind of resonances caused by a proximity of the Fermi surface to topological Lifshitz transition. One may also notice that the electronic correlations often shifts the electronic bands to optimal for superconductivity positions.
pacs:
74.20.-z, 74.25.Jb, 74.70.Xa, 74.72.-h, 79.60.–iI Introduction
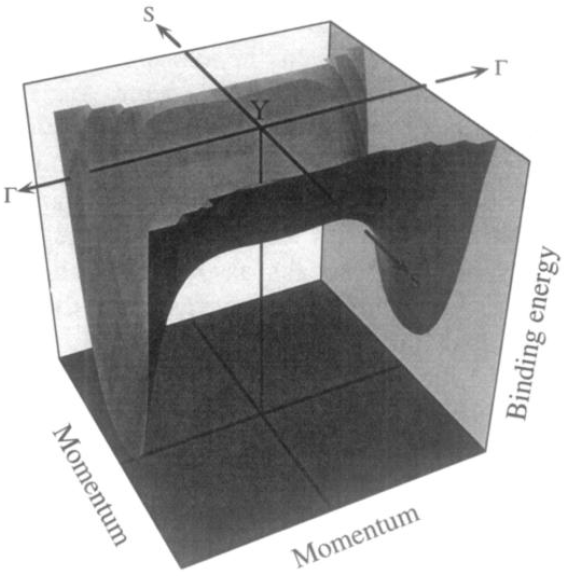
In spite of the fashion for the ”local language” Anderson1987 ; Dagotto1994 ; Imada1998 in application to physics of high- cuprates soon after their discovery, some researchers were keeping to believe that it is the electronic band structure of cuprates that conceals a key to understand them Hirsch1986 ; Dzialoshinskii1987 ; Gorbatsevich1987 ; Labbe1987 ; Friedel1989 ; Markiewicz1989 . Especially many efforts had been made to study possible consequences of close vicinity of the ”saddle point” type Van Hove singularity (VHS) VanHove1953 to the Fermi level (see Fig. 1), as it had been revealed by the band structure calculations Markiewicz1997 and earlier photoemission experiments in a number of cuprates Gofron1994 ; King1994 ; Yokoya1996 . Abrikosov, who advocated ”common sense against fashion” in this respect, was fascinated by rich physics that comes from an ”extended” saddle-point and had derived several formulas to describe it analytically Abrikosov1993 ; Gofron1994 ; Abrikosov1994 ; Abrikosov1998 suggesting finally his ”theory of high- superconducting cuprates based on experimental evidence” Abrikosov1999 ; Abrikosov2000 ; Abrikosov2008 .
The role of saddle point VHS has been discussed in two types of scenarios. The ”direct” scenarios relate the enhancement with VHS related peak in the density of states (DOS) Labbe1987 ; Xu1987 ; Markiewicz1989 , which for the ”extended” singularity Friedel1989 ; Gofron1994 leads to the stronger than logarithmic divergence (”a power law divergence”) in DOS Abrikosov1993 ; Abrikosov2000 . In the ”indirect” scenarios, the superconductivity is enhanced by competing instabilities Dzialoshinskii1987 ; Gorbatsevich1987 ; Hirsch1986 ; Markiewicz1991 ; Kampf2003 . Moreoover, it has been found that strong correlation effects pin this VHS close to the Fermi level Markiewicz1990 ; Newns1991 ; Si1993 ; Monthoux1993 ; Andersen1994 ; Liechtenstein1996 . Other aspects of the saddle point VHS, like the dynamic VHS-Jahn-Teller effect, the pseudogap and striped phases, are discussed in detail in another review by Markiewicz Markiewicz1997a .
The discussed singularity in DOS was later shown to be rather weak to account for high ’s, especially when finite temperature and impurity scattering are taken into account Pashitskii2006 ; Plakida2010 . Applicability of the models with competing instabilities is more difficult to estimate but the overall frustration about them have been arisen mainly because of a lack of experimental evidence for correlation between the position of the saddle point and superconductivity: a number of cuprates with VHS close to the Fermi level show rather low ’s Markiewicz1997 ; King1994 ; Yokoya1996 . In addition, while the saddle point stays close to the Fermi level for the hole doped cuprates, it goes deeper with hole underdoping and should continue to sink further with the electron doping. So, any scenarios of enhancement related to the saddle point VHS cannot universally explain the both sides of the electronic phase diagram.
Here, based on overview of a number of photoemission data, I argue that indeed there is a robust correlation between superconducting critical temperature and a proximity of certain Van Hove singularities to the Fermi level in all known high- superconductors including the iron based superconductors (Fe-SC) and high- cuprates (Cu-SC) on the both sides of the phase diagram. Interestingly, this VHS is usually not a saddle point but an edge (top or bottom) of certain bands which, in the vicinity to topological Lifshitz transition Lifshitz1960 plays, most likely, a role of a ”resonant amplifier” of superconductivity in a multi-band system. While we are looking for microscopic understanding of this correlation, it can be used to search for new high temperature superconductors with higher ’s.
II Electronic band structure
II.1 Cuprates
As it has been mentioned, when Abrikosov was exploring the consequences of the extended saddle point in the electronic band structure of the cuprates, most of the researchers did not believe that the concepts of the one-particle electronic structure or the Fermi liquid are applicable to the cuprates at all. However, already the first angle resolved photoemission experiments on Bi2Sr2CaCu2O8+x (BSCCO or Bi-2212) Takahashi1988 ; Dessau1993 , YBa2Cu3O7-δ (YBCO) Liu1992 , and Nd2-xCexCuO4 King1993 had revealed the dispersion and the Fermi surface very similar to those obtained by conventional density-functional band-structure calculations. The essential development of angle resolved photoemission spectroscopy (ARPES) during the next decade has allowed to shed much more light on this issue revealing the details of the band structure and quasiparticle spectrum of cuprates Damascelli2003 ; 2014_LTP_Kordyuk .
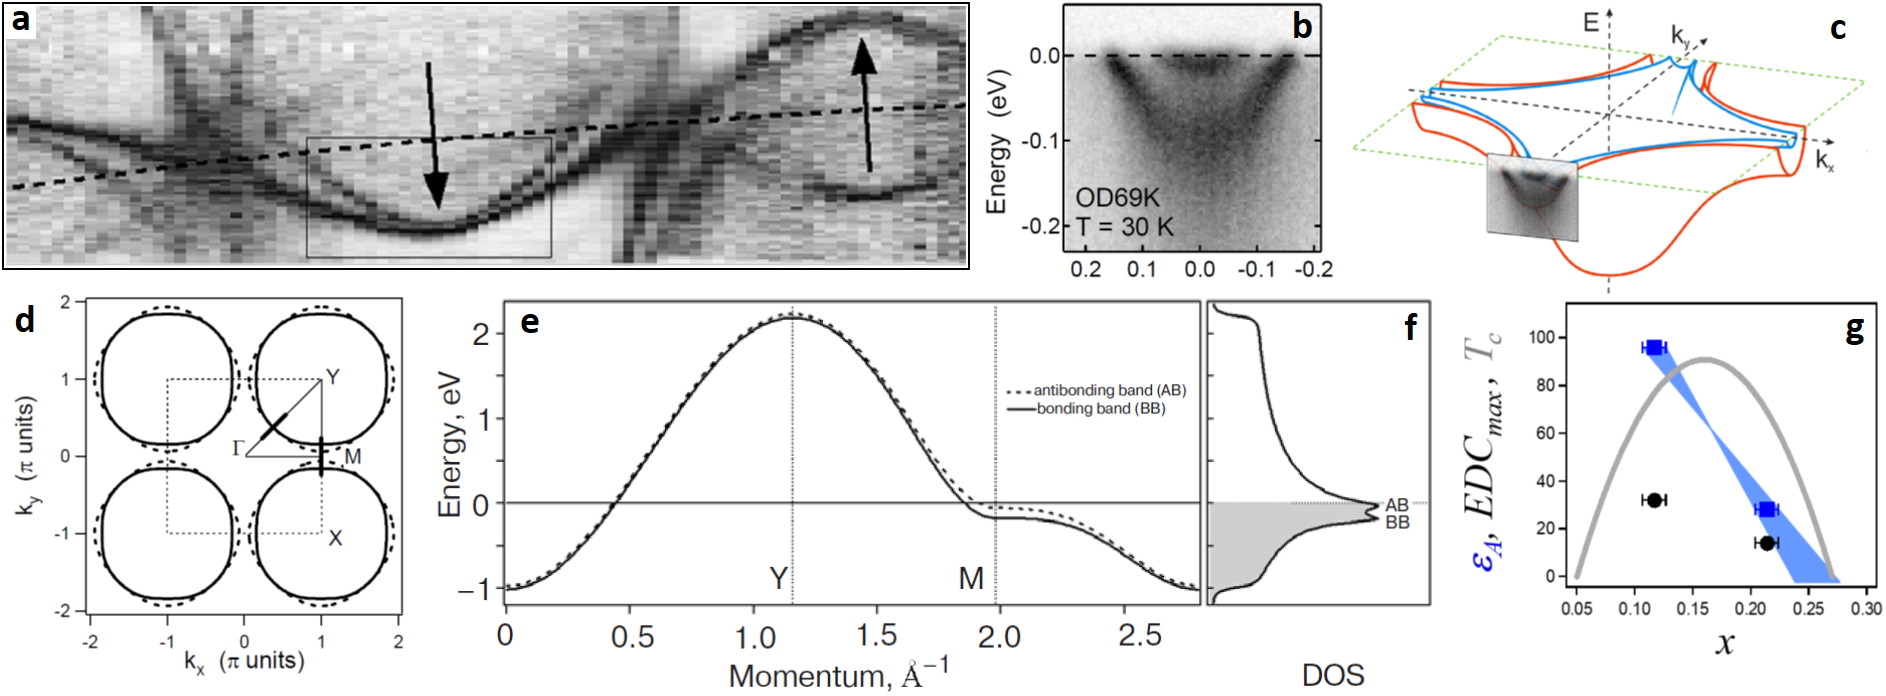
In particular, it has been shown that the hole doped cuprates have a large Fermi surface (FS) in the range of doping when they are superconducting Aebi1994 ; Borisenko2000 ; 2001_PRB_Borisenko ; 2002_PRB_Kordyuk . This FS satisfies the Luttinger theorem, i.e., its volume corresponds to the number of the conduction electrons per unit cell and is proportional to , where is the hole concentration. Then Feng2001 ; Chuang2001 ; 2002_PRB_Kordyuk ; 2002_PRL_Kordyuk ; 2004_PRB_Kordyuk , most of ARPES-groups began to observe the splitting of the conduction band in the bilayer cuprates into the sheets corresponding to the bonding and anti-bonding orbitals (see Fig. 2) that contradicted the idea of spatial confinement of electrons in separate layers Anderson1987 ; Ding1996 . Note that most of ARPES results for cuprates have been obtained on Bi-2212, since the bulk properties of Y-123 are much more difficult to study because of overdoped non-superconducting topmost layer 2007_PRB_Zabolotnyyb ; 2007_PRB_Zabolotnyy .
Based on the FS geometry and low energy electron dispersions one may derive the hopping integrals describing the conduction band 2003_PRB_Kordyuk and, for two-CuO2-layer Bi-2212 we have derived that the onset of the superconducting region in the phase diagram, in the direction of reducing the hole concentration, starts with the Lifshitz topological transition for the anti-bonding Fermi surface 2006_LTP_Kordyuk (Fig. 2g). While the same holds for a single FS of single layer Bi-2201 Kondo2004 , a careful study of Bi-2212 of different doping levels Kaminski2006 has shown that the Lifshitz transition for the anti-bonding band appears a bit later, at between 0.22 and 0.23 holes per Cu atom ( 55 K), that is similar to earlier result on Ino2002 .
Another conclusion that has been derived from the numerous ARPES experiments is that the whole spectra of the superconducting cuprates (except may be the pseudogap effect) can be described by the quasiparticle spectral function 2006_LTP_Kordyuk ; 2010_EPJST_Kordyuk , Im(), , in which the bare Green’s function with the bare electron dispersion are defined by the interaction of the electrons with periodic crystal lattice and the quasiparticle self-energy encapsulates the interaction of electron with other electrons and other degrees of freedom, like in normal metals Valla1999 . Yet the striking difference of ARPES spectra of the cuprates from the spectra of normal metals is in strong scattering that (1) does not stop at the Debye energy (so, the dispersion is hard to follow below eV 2005_PRB_Kordyuk ; 2007_PRL_Inosov ) and (2) is strongly momentum dependent, leading to the ”nodal-antinodal dichotomy”: around point of the Brillouin zone (the ”antinodal” region) the renormalization is highly increasing below , while along the nodal direction its temperature dependence is rather weak 2003_PRL_Borisenko ; 2003_PRL_Kim ; 2006_LTP_Kordyuk .
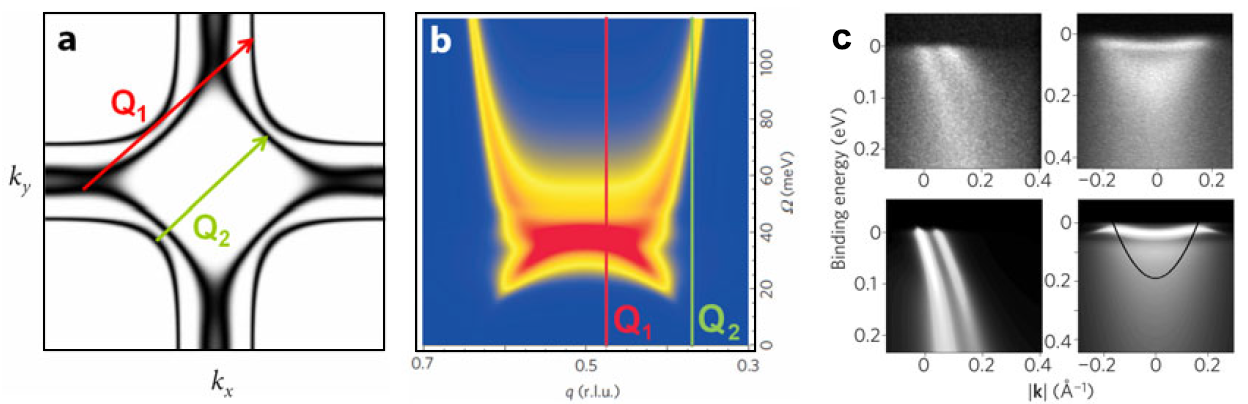
The analysis of the self-energy dependence on energy, momentum Kaminski2001 ; 2003_PRL_Kim , temperature and doping level 2004_PRL_Kordyuk ; 2005_PRB_Kordyuk ; 2006_PRL_Kordyuk has indicated that the main channel of one-electron excitation scattering is related with the spin-fluctuations. The direct comparison of the ARPES and inelastic neutron scattering spectra (Fig. 3) has proved this idea 2009_NP_Dahm , naturally resolving the nodal-antinodal dichotomy: the self-energy of the nodal quasiparticles is defined by scattering by high energy branches of the spin-fluctuation spectrum while the antinodal self-energy is formed by the scattering by the magnetic resonance Eschrig2006 formed below . We can consider as a generalized cross-correlation 2010_EPJST_Kordyuk of one-particle spectrum presented by the Green’s function and the two-particle spectrum of spin-fluctuations: , where is taken for a spin-electron coupling constant. Also, it has been shown Chatterjee2007 ; 2007_PRB_Inosov that the spin-fluctuation spectrum itself is formed by itinerant electrons: . So, one can write an extended Dyson equation for Cu-SC (see 2010_EPJST_Kordyuk for details):
| (1) |
Therefore, one could conclude that ”a conservative view” of Friedel Friedel1989 in late 80’s, that treating the on-site electron interactions as a perturbation to a band scheme is sufficient to describe the physical properties of superconducting cuprates, is largely supported by later ARPES experiments.
The issue of the pseudogap in cuprates is rather complicated since evidently encapsulates a number of mechanisms 2015_LTP_Kordyuk , some of which, like charge or spin density waves can be described by an effect of the new order, but still there is a place for localization effects. I will turn back the the pseudogap issue in Section III.2.
To summarize, the electronic band structure (ES) of cuprates defines the spin-fluctuation spectrum (SF) and the electronic ordering, which likely forms the pseudogap (PG) state. An interplay of ES with SF leads to superconductivity (SC) that competes with PG. So, one can write one more formula for Cu-SC:
| (2) |
The pairing by the spin-fluctuations can lead to high in some theories Monthoux1994 ; Abanov2002 ; Maier2007 or cannot in point of view of others Kee2002 ; Alexandrov2007 .
II.2 Iron based superconductors
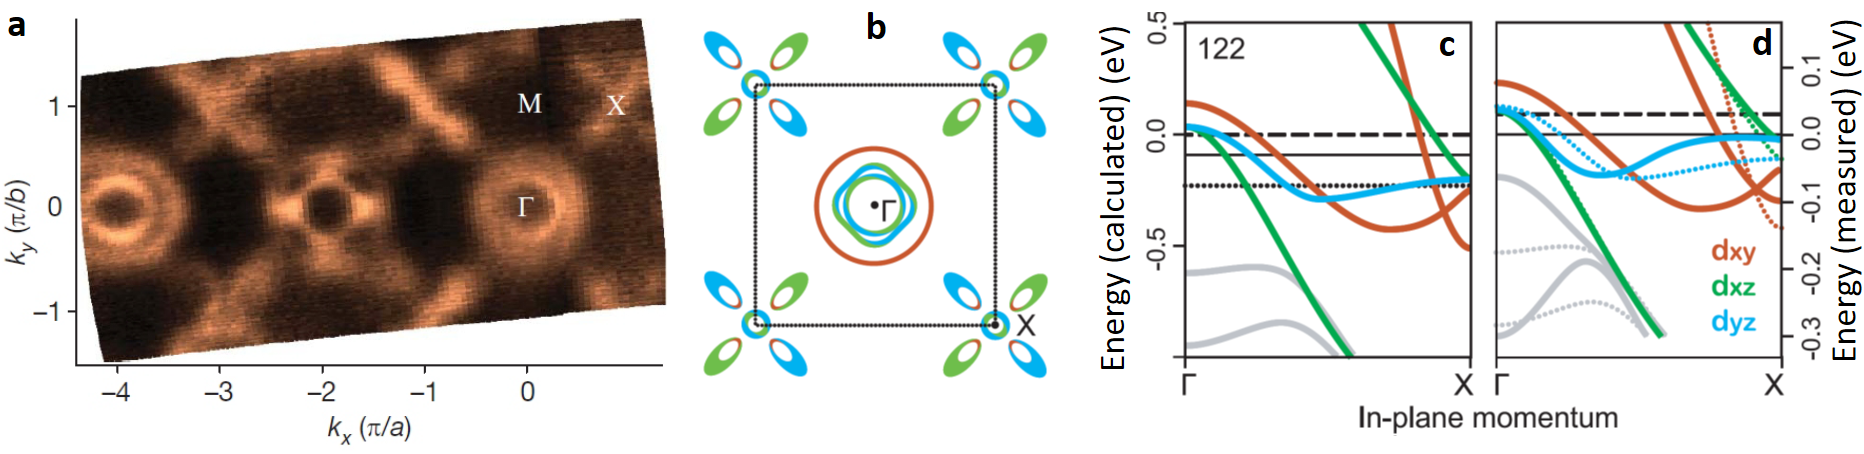
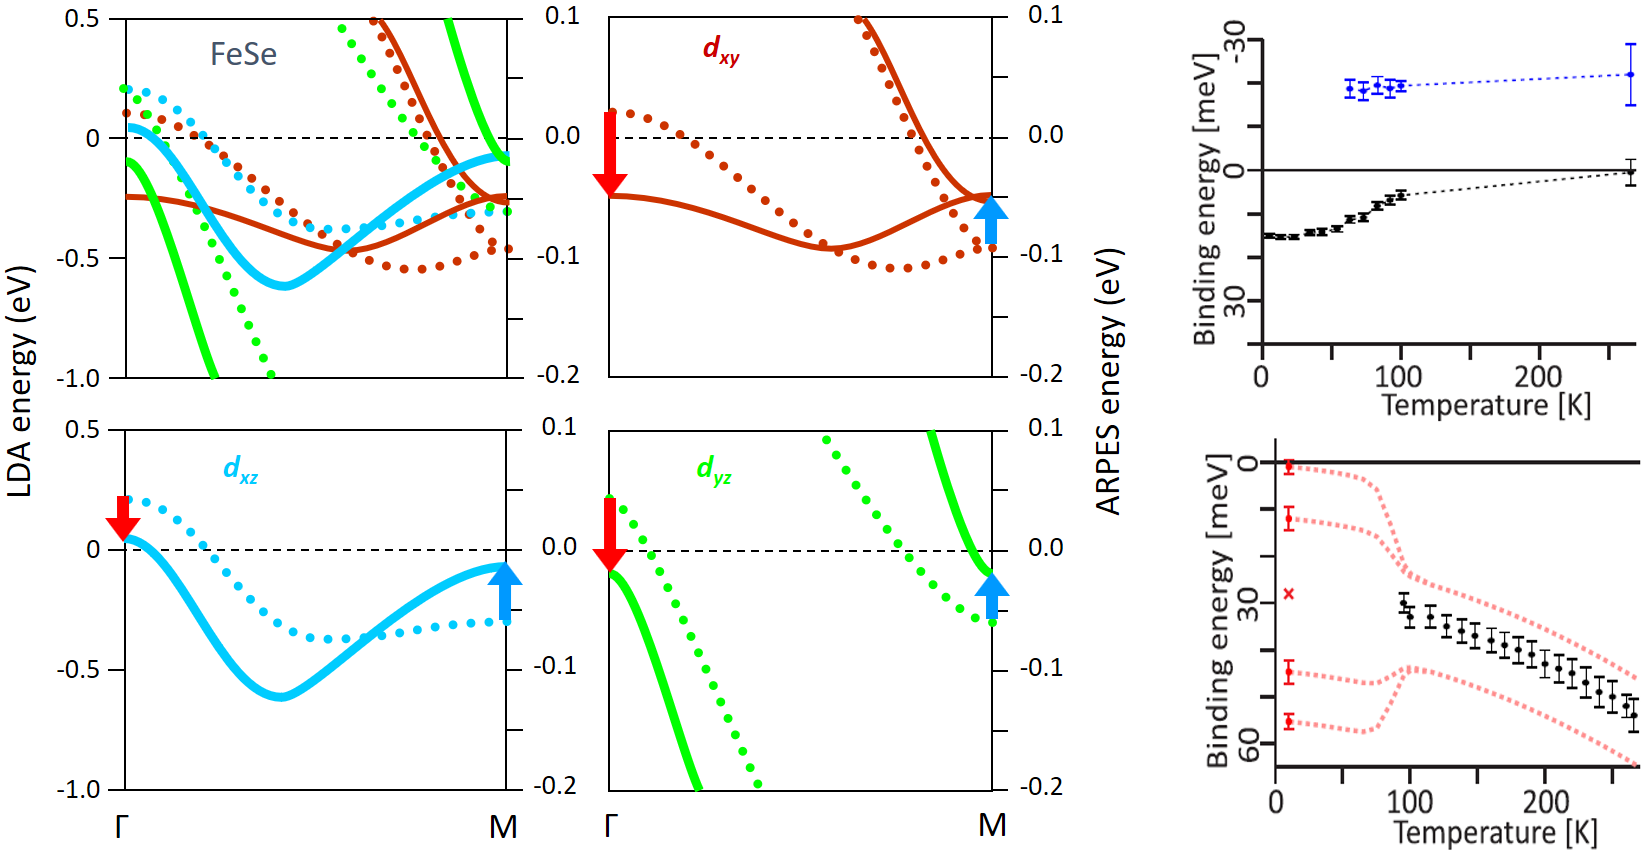
The band structure of the iron based superconductors (Fe-SC) is much more complex than of Cu-SC and consists usually of five conduction bands crossing the Fermi level 2012_LTP_Kordyuk ; 2013_JSNM_Kordyuk (see Fig. 4). It is well captured by DFT calculations Andersen2011 ; Sadovskii2012 but do not take it too literally. The calculated Fermi surface is usually bad starting point for theory, since even topology of the Fermi surface is very sensitive to slight shifts of the bands in respect to and to each other and often differs in experiment and calculations 2009_N_Zabolotnyy ; 2010_PRL_Borisenko .
The band structures of Fe-SC seen in the ARPES experiments differ from the calculated ones mainly in two ways: a strong renormalization (3 times in avarage 2010_PRL_Borisenko ; 2011_PRB_Kordyuk but band-dependent Maletz2014 ; Fanfarillo2016 and peaked at about 0.5 eV 2017_PRB_Evtushinsky ), and a momentum-dependent shift Yi2009 ; 2010_PRL_Borisenko ; Brouet2013 ; Watson2015 (the ”red-blue shift” 2016_LTP_Pustovit ; Lochner2017 ).
The bands forming the Fermi surfaces of Fe-SC have distinct orbital characters mainly of three types: Fe (Fig. 4 b-d). Moreover, it is the bands that carry the largest superconducting gap Ding2008 ; 2009_NJP_Evtushinsky ; 2012_S_Borisenko ; 2014_PRB_Evtushinsky and are therefore the most important for superconductivity in Fe-SC. This simplifies the situation a bit, but, on the other side, the AF ordered phase and preceeding nematic transition Fernandes2014 essentially complicates the electronic band structure of the ”normal” state from which the superconductivity occurs.
From the theory side, the question what drives both the supercoducting pairing and the nematic ordering remains open. The phonons alone, despite some ”firgerprints” they left in the ARPES spectra 2011_PRB_Kordyuk , are not considered seriously Hirschfeld2011 ; Fernandes2014 . Even the state is called ”nematic” rather than ”anisotropic” to stress the electronic origin of the instability, and there is a lot of experimental evidences for this Fernandes2014 , but one prefers to speak about interplay of phonons, charge/orbital fluctuations, and spin fluctuations Yin2010 ; Onari2012 ; Chubukov2012 ; Fernandes2014 ; Chubukov2016 . Although it is agreed that phonons and charge/orbital fluctuations would favour a sign-preserving -wave superconducting order parameter () whereas spin-fluctuations favour a sign-changing -wave () superconductivity Wang2011 ; Hirschfeld2011 ; Fernandes2014 , any agreement on why ’s are so high is absent so far and there is no confirmed prediction for new high temperature superconductors.
III Lifshitz transition
III.1 Iron based superconductors
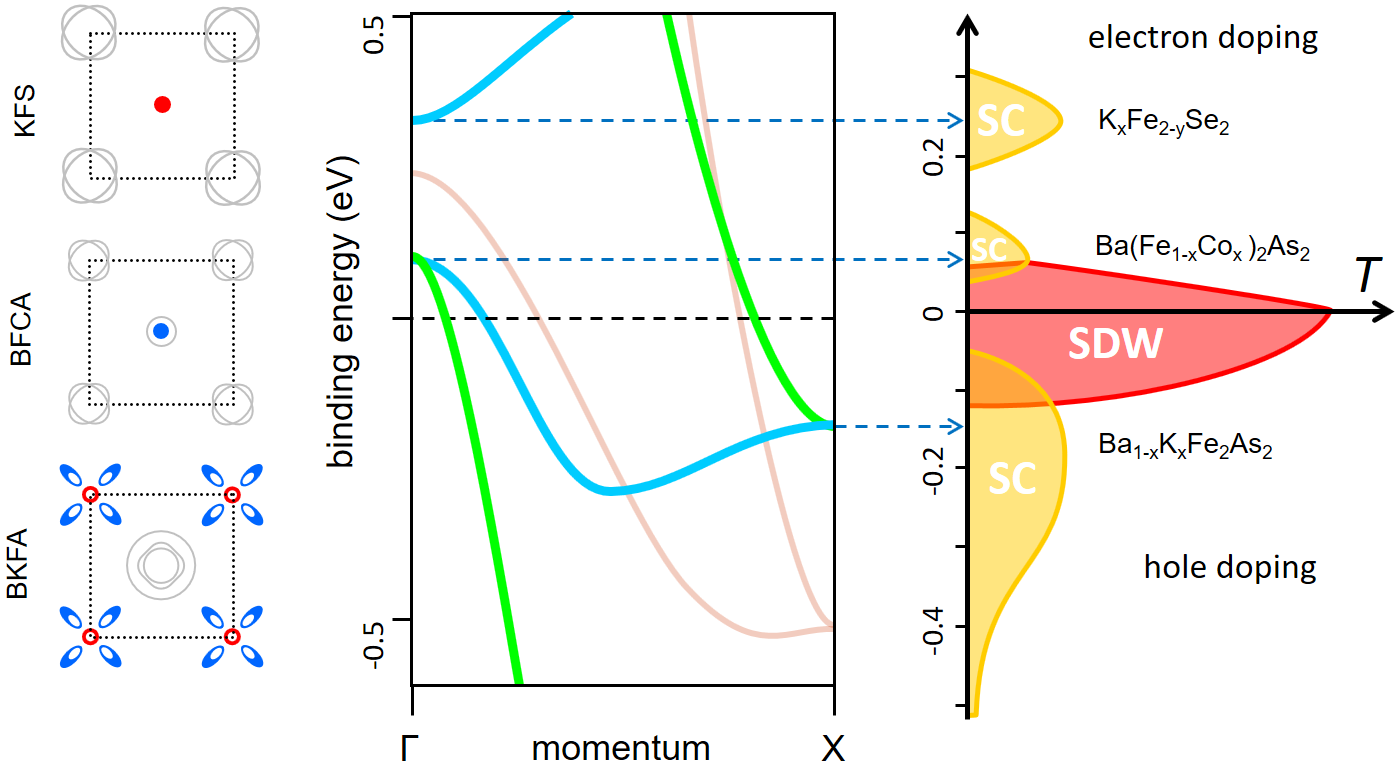
From the experiment side, the complexity of the band structure of Fe-SC seems to play a positive role in the struggle for understanding the pairing mechanism because the multiple electronic bands and the resulting complex fermiology offer exceptionally rich playground for establishing useful empirical correlations. In particular, there is an empirical correlation between the electronic structure and : maximal (optimally doped superconductors) is observed when a proximity of the electronic structure to topological Lifshitz transition Lifshitz1960 takes place 2012_LTP_Kordyuk ; 2013_JSNM_Kordyuk . Interestingly, this Lifshitz transition (LT) is related with VHS wich is usually not a saddle point but an edge (top or bottom) of certain bands, namely bands, as shown in Fig. 5.
This LT- correaltion is observed for all known optimally doped Fe-SC except, may be, some FeSe-based compounds Lee2014 ; 2016_LTP_Pustovit . Indeed, the extremely small Fermi surface sheets of orbital origin are observed for the optimally hole doped Ba1-xKxFe2As2 (BKFA) 2009_N_Zabolotnyy ; 2009_NJP_Evtushinsky ; 2011_JPSJ_Evtushinsky , Ba1-xNaxFe2As2 (BNFA) 2012_PRB_Aswartham , and Ca1-xNaxFe2As2 2013_PRB_Evtushinsky as well as for the optimally electron doped Ba(Fe1-xCox)2As2 (BFCA) Liu2011 ; 2013_JSNM_Kordyuk , i.e. for the both sides of the electron phase diagram for the 122 system. The same holds for the stoichiometric (but optimal for ) LiFeAs 2010_PRL_Borisenko ; 2011_PRB_Kordyuk ; 2012_S_Borisenko , NaFeAs He2010 ; 2012_PRB_Thirupathaiah , and for AxFe2-ySe2 family (A stands for alkali metal: K, Rb, Cs, and Tl) Mou2011 ; Zhang2011 ; 2013_PRB_Maletz . Moreover, the is increasing with the number of band-edge VHS’s at , as it has been shown comparing (CaFeAs)10Pt3.58As8 (three band-edge VHS’s at , = 35 K) to (CaFe0.95Pt0.05As)10Pt3As8 (only one VHS at , = 15 K) Thirupathaiah2013 . Finally, now one can say that the same is true for the 1111-type compounds which exhibit the highest up to 55 K. Having the polar surfaces, these compounds are hard to study by ARPES 2012_LTP_Kordyuk ; 2014_LTP_Kordyuk , but it has been shown that the bulk electronic structure for SmFe0.92Co0.08AsO Charnukha2015 and NdFeAsO0.6F0.4 ( = 38 K) Charnukha2015a is in the same optimal for superconductivity state, having 2-3 band-edge VHS’s in close vicinity to the Fermi level.
As for FeSe, its Fermi surfaces look a bit away from the Lifshitz transition 2016_LTP_Pustovit , but pure FeSe crystals are not optimal for superconductivity: their increases from about 9 to 38 K under pressure Medvedev2009 and by means of intercalation Guo2010 . While it is hard to do ARPES under such a pressure, the results of a DFT+DMFT calculations show that the bulk FeSe under pressure about 9 GPa undergoes a Lifshitz transition Skornyakov2018 .
The possible mechanism of this correlation will be briefly discussed in Section III.3, but it would be tempting to use the observed correlation for a search of new high temperature superconductors with higher ’s. Similar electronic band structure for all the Fe-SC’s results in similar DOS 2013_JSNM_Kordyuk from which one can clearly see that this correlation has nothing to do with DOS enhancement. The bright example is KFe2As2 that has much higher DOS at than any of optimally doped Fe-SC’s and about 4 K. On the other hand, the density of states should be certainly important for superconductivity, so, looking for Fe-SC’s with higher one should find a compound with several bands crossing the Fermi level one or more of which are close to the Lifshitz transition but with the higher density of states from the other bands (similarly to hole-doped 122). This should be the case for hole overdoped KFe2As2 or LiFeAs.
III.2 Cuprates
Unexpectedly, the recent progress in understanding the mechanisms of pseudogap formation in cuprates (see 2015_LTP_Kordyuk for review) leads to conclusion that the same LT- correlation takes place also for cuprates (both for the hole- and the electron-doped ones) in the anti-ferromagnetic (AF) Brillouin zone, i.e. assuming that the pseudogap is caused by an AF-like electronic ordering.
Indeed, it has been shown that while several mechanisms contribute to the pseudogap phenomenon, a short range or slightly incommensurate 2009_PRB_Kordyuk AF-like ordering stays mostly responsible for the pseudogap openning below 2015_LTP_Kordyuk . This ordering is most likely a result of VHS nesting Hashimoto2010 , that is the known mechanism for electronic ordering in ”excitonic insulators” Rossnagel2011 . Some evidence for incommensurate spin density wave (SDW) has been obtained in neutron experiments on YBCO Haug2010 , while in Refs. Hashimoto2010 ; Hashimoto2014 it has been shown that temperature evolution of antinodal ARPES spectrum for Bi-2201 is mostly consistent with a commensurate density wave order.
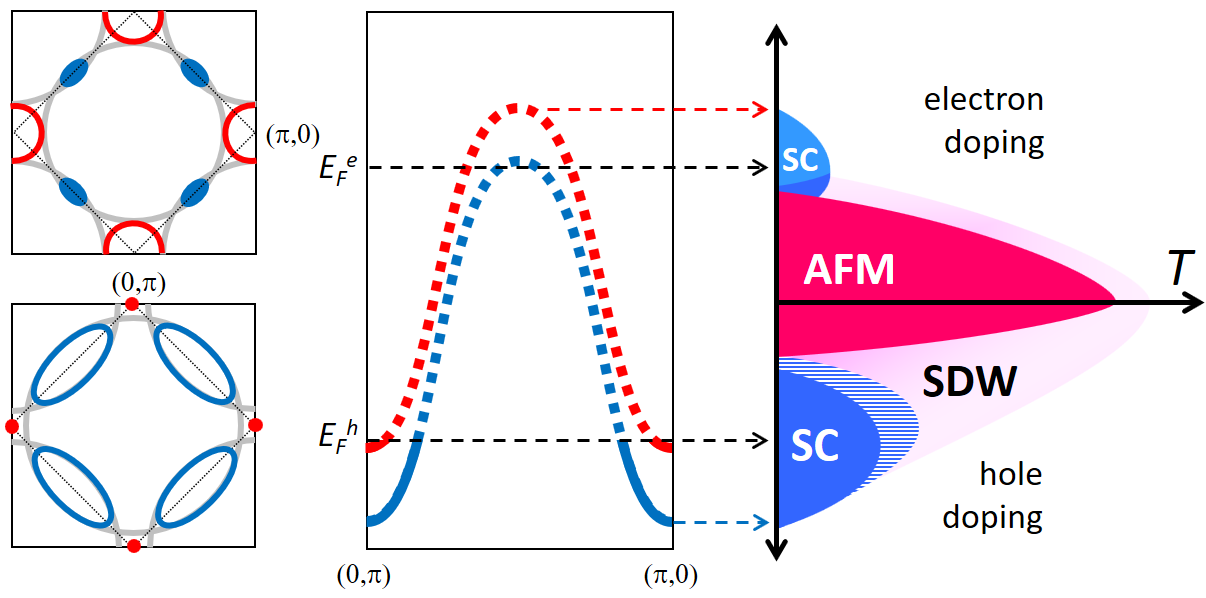
This means that the superconductivity in cuprates with the highest appears in the AF-ordered ”normal” state, the Fermi surfaces of which are shown on the left side of Fig. 6 for the electron (top) and hole (bottom) doped sides of the phase diagram shown on the right. The most representative cut of the electronic bands, taken along the AF Brillouin zone boundary, is shown in center of Fig. 6. The two bands shown here are the result of the hybridization between original CuO-band and its replica folded into the AF Brillouin zone.
One can see that maximal ’s are observed when either higher (red) or lower (blue) band are in close vicinity to Lifshitz transition for the hole and electron doped cuprates, respectively, that is intriguingly similar to the Fe-SC case discussed above.
The splitting between these two bands depends of the mechanism of the ”AF-like” ordering, that brings us to the old discussion on Slater vs Mott insulators Friedel1989 . Effective doubling of the unit cell can be described in many ways: as Peierls or spin-Peierls Jacobs1976 type instability powered by the VHS nesting Rossnagel2011 , in the extended Hubbard model Hirsch1984 , and in the -model Spalek1977 ; Spalek2007 in which the quasiparticles cannot leave the magnetic sublattice in which they were created Loktev2005 . So, the two old but related questions are arising again: (1) whether it possible to decide between Slater and Mott scenarios based on ARPES data and (2) how this mechanism does affect the electronic structure and, subsequently, the transition to superconducting state.
In my opinion, for the hole doped cuprates, this question can be clarified looking for the spectral weight which disappears with pseudogap opening below but reappears below 2015_LTP_Kordyuk . The upper band (in the center panel of Fig. 6) is not clearly visible in ARPES spectra Hashimoto2010 ; Hashimoto2014 , likely because of short range or incommensurate 2009_PRB_Kordyuk character of the ordering. One can also remind here the complication that comes from the ”shadow band” Aebi1994 , later attributed to structural modulations 2004_PRB_Koitzschb ; Mans2006 , and the bilayer splitting Feng2001 ; Chuang2001 ; 2002_PRB_Kordyuk ; 2002_PRL_Kordyuk ; 2004_PRB_Kordyuk , that further complicates the spectra of the bilayer cuprates. So, in order to describe the band gap caused by the AF-like ordering one needs a detailed temperature dependent ARPES study of preferably one layer compounds.
The situation is much simpler for the electron doped cuprates Alff2003 . Despite the chose between Slater and Mott pictures is also discussed here Das2010 ; Weber2010 , the ARPES data clearly shows a gap along the magnetic zone boundary Matsui2005 ; Park2007 and the Fermi surface like in Fig. 6) (left-bottom), confirming the AF doubling of the unit cell.
To summarize, the AF-like ordering in cuprates puts them in a row with the Fe-SC’s following the empirical correlation that highlights the importance of topological Lifshitz transition for high temperature superconductivity. One may speculate that the presence of small Fermi surfaces is a general mechanism for enhancement of superconductivity that is usually observed at the charge/spin density wave phase boundary in a number of quasi-2D systems, and that it is the size or geometry of these small Fermi-surfaces rather than an enhancement of the density of states that powers this mechanism.
III.3 Resonant superconductivity?
The question about possible mechanism of enhancement by a proximity to the Lifshitz transition is evidently not straightforward since the very definition of this transition as the ”2.5 phase transition” in the terminology of Ehrenfest indicates that one may expect (for 3D system) to observe singularity only in between the 2nd and 3rd derivatives of the thermodynamic potential: and singularities, respectively, where is the energy distance of band-edge VHS to the Fermi level Lifshitz1960 .
The effect of Lifshitz transition on electronic properties of metals has been reviewed in Varlamov1989 ; Blanter1994 . In particular, it was shown that, besides evident appearance of cusps in DOS and consequently in the heat capacity, magnetic susceptibility etc., it leads to a special channel of scattering with a specific energy dependent correction in the electron relaxation time, which is responsible for a giant anomaly in the thermoelectric power and other kinetic characteristics of metals. Although the effect on superconductivity has not been discussed in those reviews, one may expect a similar effect since often the growth of thermopower is correlated with the changes in . Moreover, in anisotropic superconductors, the change in due to the change in the Fermi-surface topology becomes stronger and nontrivial Makarov1975 .
Both Fe-SC’s and Cu-SC’s are quasi-2D materials with the step-like singularity in DOS at instead of for 3D compounds, so, one may expect stronger effects here. In addition, they are multi-band superconductors, in which these effects can be enhanced. For example, a ”superlinear” enhancement (with number of valleys) of effective coupling constant has been predicted within the BCS model for multi-valued semimetals taking into account inter-valley coupling Pashitskii1978 .
So, one may expect that the microscopic explanation for the observed LT- correlation may be related with some LT-powered ”resonant amplifier” of superconducting pairing in a multi-band system. This said, the superconductivity in FeAs-based compounds has been assigned to a Feshbach resonance (also called ”shape resonance” Perali1996 ) in the exchange-like interband pairing Caivano2009 . This mechanism has been further developed in Innocenti2010 ; Innocenti2011 ; Bianconi2013 ; Bianconi2015 for a number of systems, including the potassium doped p-Terphenyl Mazziotti2017 with up to 123 K.
Going back to the issue of superconductivity in Fe-SC system, one may subdivide the pairing problem into ”glue” and ”amplifier”. Recently Kalenyuk2018 , we have added an argument to support the scenario based on the phase sensitive Josephson junction experiment. Taking the spin-fluctuations as a main glue for electron pairs in Fe-SC, one may consider the shape resonance as the mechanism for an entanglement of spin and orbital degrees of freedom.
To sumarize, one may assume that the proximity of Fermi surface to topological transition is a universal feature for enhancement mechanism. While this mechanism remains to be fully understood, one may notice that the electronic correlations often shifts the electronic bands to optimal for superconductivity positions. In respect to cuprates, there were a number of experimental evidences and theoretical treatments for the effect of pinning of the saddle-point VHS to the Fermi level. The band-edge VHS, discussed here, is formed due to AF ordering and tuned by the pseudogap value. So, the role of the PG in high- story is not just in competition with superconductivity for the phase space, as suggested by Eq. 2, but also in shifting the upper split band (for the hole doped cuprates) to the Lifshitz transition. Speculating more, this position should be very sensitive to the new order potential and can be pinned to to minimize the electron kinetic energy.
As for the Fe-SC compounds, it is interesting to note that the observed ”red-blue shift” 2016_LTP_Pustovit ; 2017_PRB_Kushnirenko can be a consequense of similar pinning mechanism.
IV ”Red-blue shift”
When one compares the band structure of iron based superconductors derived from ARPES experiment with the result of DFT calculations, one can see that it is not ”rigid” but distorted by a momentum-dependent shift that acts similarly in all Fe-SC’s, shifting the bands up and down in energy: up—in the center of the Brillouin zone and down—in its corners Yi2009 ; 2010_PRL_Borisenko ; Brouet2013 ; 2013_JSNM_Kordyuk , as shown in Fig. 7). Since such a shift persists in all the Fe-SC’s and is a sort of natural degree of freedom for the band structure of a multi-band metal with the Luttinger-volume conserved, that results in synchronous change (shrinking, in this case Coldea2008 ; Watson2015 ; Fanfarillo2016 ) of the hole and electron Fermi surfaces, it is tempting to give it a special name and, following 2016_LTP_Pustovit ; Lochner2017 , I call it the ”red-blue shift” here.
Since it is the electron interactions that are missing in DFT calculations, it is also tempting to ascribe such a shift to these interactions, for which several models have been proposed. The Fermi surface shrinking can be a consequence of the strong particle-hole asymmetry of electronic bands assuming a dominant interband scattering Ortenzi2009 and described by the self-energy corrections due to the exchange of spin fluctuations between hole and electron pockets Benfatto2011 ; Fanfarillo2016 , or it can be formulated in terms of -wave Pomeranchuk ordering Chubukov2016 . On the other hand, one can explain it as a decrease of a band width due to a screening of the nearest neighbor hopping as a result of AF-like ordering 2016_LTP_Pustovit that, similarly to cuprates, can be considered as a consequence of the confinement of the carriers within the magnetic sub-lattice Loktev2005 . One should note that all these mechanisms will lead to Lifshitz transition for non-compensated carriers, that requires hole or electron doping to shift from stoichiometry, multiple bands or both.
If the discussed shift is a result of correlations, one may expect its enhancement with lowering temperature 2016_LTP_Pustovit . Such temperature evolution of the band structure is in agreement with Hall measurements 2011_JPSJ_Evtushinsky and has been observed recently by ARPES on FeSe crystals 2017_PRB_Kushnirenko . This results, however, is not confirmed by other experiments Rhodes2017 ; Pustovit2017 ; Pustovit2018 , so, one may conclude that the temperature effect is more complex and requires further research.
V Summary
The electronic band structure of cuprates defines both the spectrum of the spin-fluctuations, which bound electrons in pairs, and the AF-like electronic ordering, which forms the pseudogap state. The band structure of the iron based superconductors is much more complex than of cuprates. The pairing can be due to spin-fluctuations, phonons or both, but why the ’s are so high is not clear. Nevertheless, there is an empirical correlation between electronic structure and : maximal (optimally doped SC) is observed when proximity of the ES to topological Lifshitz transition takes place. This is observed for all Fe-SC’s.
Interestingly, the same correlation holds for Cu-SC (both for hole- and electron-doped ones) in the anti-ferromagnetic Brillouin zone, i.e. assuming that the PG is caused by the AF-like electronic ordering. So, an interplay of the electronic structure with the spin-fluctuations leads to superconductivity that, on one hand, competes with the pseudogap caused by the AF-ordering, but, on the other hand, can be enhanced by the proximity to Lifshitz transition, also caused by this ordering.
The idea of this review was to stress ones more that this correlation is either annoyingly observed by ARPES or predicted by calculations for all the known high- superconductors. This allows to assume that the proximity of Fermi surface to topological transition is a universal feature for a enhancement mechanism. While we are looking for microscopic understanding of this correlation, it can be used to search new high temperature superconductors with much higher transition temperatures.
Acknowledgements.
I acknowledge discussions with A. Abrikosov, L. Alff, A. Avella, A. Bianconi, B. Büchner, S. V. Borisenko, V. Brouet, A. V. Chubukov, T. Dahm, C. Di Castro, I. Eremin, D. V. Evtushinsky, J. Fink, A. M. Gabovich, M. S. Golden, M. Grilli, D. S. Inosov, I. N. Karnaukhov, A. L. Kasatkin, T. K. Kim, M. M. Korshunov, V. M. Krasnov, A. Lichtenstein, V. M. Loktev, R. Markiewicz, I. V. Morozov, S. G. Ovchinnikov, E. A. Pashitskii, N. M. Plakida, V. M. Pudalov, Yu. V. Pustovit, M. V. Sadovskii, D. J. Scalapino, A. V. Semenov, J. Spałek, T. Valla, A. A. Varlamov, A. N. Vasiliev, A. N. Yaresko, and V. B. Zabolotnyy. The project was supported by the Ukrainian-German grant from the MES of Ukraine (Project M/20-2017) and by the project No. 6250 by STCU and NAS of Ukraine.References
- (1) P. W. Anderson, Science 235, 1196 (1987).
- (2) E. Dagotto, Rev. Mod. Phys. 66, 763 (1994).
- (3) M. Imada, A. Fujimori, and Y. Tokura, Rev. Mod. Phys. 70, 1039 (1998).
- (4) J. E. Hirsch and D. J. Scalapino, Phys. Rev. Lett. 56, 2732 (1986).
- (5) I. E. Dzialoshinskii, Sov. Phys. JETP 66, 848 (1987).
- (6) A. Gorbatsevich, V. Elesin, and Y. Kopaev, Phys. Lett. A 125, 149 (1987).
- (7) J. Labbé and J. Bok, Europhys. Lett. 3, 1225 (1987).
- (8) J. Friedel, J. Phys.: Condens. Matter 1, 7757 (1989).
- (9) R. Markiewicz and B. Giessen, Physica C 160, 497 (1989).
- (10) L. Van Hove, Phys. Rev. 89, 1189 (1953).
- (11) R. Markiewicz, J. Phys. Chem. Solids 58, 1179 (1997).
- (12) K. Gofron et al., Phys. Rev. Lett. 73, 3302 (1994).
- (13) D. M. King et al., Phys. Rev. Lett. 73, 3298 (1994).
- (14) T. Yokoya et al., Phys. Rev. Lett. 76, 3009 (1996).
- (15) A. Abrikosov, J. Campuzano, and K. Gofron, Physica C 214, 73 (1993).
- (16) A. Abrikosov, Physica C 222, 191 (1994).
- (17) A. A. Abrikosov, Phys. Rev. B 57, 8656 (1998).
- (18) A. A. Abrikosov, Int. J. Modern Phys. B 13, 3405 (1999).
- (19) A. Abrikosov, Physica C 341-348, 97 (2000).
- (20) A. A. Abrikosov, Physica C 468, 97 (2008).
- (21) J.-H. Xu et al., Physics Letters A 120, 489 (1987).
- (22) R. S. Markiewicz, J. Phys.: Condens. Matter 3, 3859 (1991).
- (23) A. P. Kampf and A. A. Katanin, Phys. Rev. B 67, 125104 (2003).
- (24) R. S. Markiewicz, J. Phys.: Condens. Matter 2, 665 (1990).
- (25) D. M. Newns, P. C. Pattnaik, and C. C. Tsuei, Phys. Rev. B 43, 3075 (1991).
- (26) Q. Si and G. Kotliar, Phys. Rev. B 48, 13881 (1993).
- (27) P. Monthoux and D. Pines, Phys. Rev. B 47, 6069 (1993).
- (28) O. K. Andersen et al., Phys. Rev. B 49, 4145 (1994).
- (29) A. I. Liechtenstein et al., Phys. Rev. B 54, 12505 (1996).
- (30) R. S. Markiewicz, Phys. Rev. B 56, 9091 (1997).
- (31) E. A. Pashitskii and V. I. Pentegov, Low Temp. Phys. 32, 452 (2006).
- (32) N. Plakida, High-Temperature Cuprate Superconductors: Experiment, Theory, and Applications Springer Series in Solid-State Sciences, Springer, 2010.
- (33) I. M. Lifshitz, Sov. Phys. JETP 11, 1130 (1960).
- (34) T. Takahashi et al., Nature 334, 691 (1988).
- (35) D. S. Dessau et al., Phys. Rev. Lett. 71, 2781 (1993).
- (36) R. Liu et al., Phys. Rev. B 46, 11056 (1992).
- (37) D. M. King et al., Phys. Rev. Lett. 70, 3159 (1993).
- (38) A. Damascelli, Z. Hussain, and Z.-X. Shen, Rev. Mod. Phys. 75, 473 (2003).
- (39) A. A. Kordyuk, Low Temp. Phys. 40, 286 (2014).
- (40) P. Aebi et al., Phys. Rev. Lett. 72, 2757 (1994).
- (41) S. V. Borisenko et al., Phys. Rev. Lett. 84, 4453 (2000).
- (42) S. V. Borisenko et al., Phys. Rev. B 64, 094513 (2001).
- (43) A. A. Kordyuk et al., Phys. Rev. B 66, 014502 (2002).
- (44) D. L. Feng et al., Phys. Rev. Lett. 86, 5550 (2001).
- (45) Y.-D. Chuang et al., Phys. Rev. Lett. 87, 117002 (2001).
- (46) A. A. Kordyuk et al., Phys. Rev. Lett. 89, 077003 (2002).
- (47) A. A. Kordyuk et al., Phys. Rev. B 70, 214525 (2004).
- (48) H. Ding et al., Phys. Rev. Lett. 76, 1533 (1996).
- (49) V. B. Zabolotnyy et al., Phys. Rev. B 76, 064519 (2007).
- (50) V. B. Zabolotnyy et al., Phys. Rev. B 76, 024502 (2007).
- (51) A. A. Kordyuk et al., Phys. Rev. B 67, 064504 (2003).
- (52) A. A. Kordyuk and S. V. Borisenko, Low Temp. Phys. 32, 298 (2006).
- (53) T. Kondo et al., J. Electron Spectrosc. Relat. Phenom. 137-140, 663 (2004).
- (54) A. Kaminski et al., Phys. Rev. B 73, 174511 (2006).
- (55) A. Ino et al., Phys. Rev. B 65, 094504 (2002).
- (56) A. A. Kordyuk et al., Eur. Phys. J. Special Topics 188, 153 (2010).
- (57) T. Valla et al., Phys. Rev. Lett. 83, 2085 (1999).
- (58) A. A. Kordyuk et al., Phys. Rev. B 71, 214513 (2005).
- (59) D. S. Inosov et al., Phys. Rev. Lett. 99, 237002 (2007).
- (60) S. V. Borisenko et al., Phys. Rev. Lett. 90, 207001 (2003).
- (61) T. K. Kim et al., Phys. Rev. Lett. 91, 167002 (2003).
- (62) A. Kaminski et al., Phys. Rev. Lett. 86, 1070 (2001).
- (63) A. A. Kordyuk et al., Phys. Rev. Lett. 92, 257006 (2004).
- (64) A. A. Kordyuk et al., Phys. Rev. Lett. 97, 017002 (2006).
- (65) T. Dahm et al., Nat. Phys. 5, 217 (2009).
- (66) M. Eschrig, Adv. Phys. 55, 47 (2006).
- (67) U. Chatterjee et al., Phys. Rev. B 75, 172504 (2007).
- (68) D. S. Inosov et al., Phys. Rev. B 75, 172505 (2007).
- (69) A. A. Kordyuk, Low Temp. Phys. 41, 319 (2015).
- (70) P. Monthoux and D. Pines, Phys. Rev. B 49, 4261 (1994).
- (71) A. Abanov et al., Phys. Rev. Lett. 89, 177002 (2002).
- (72) T. A. Maier et al., Phys. Rev. B 76, 144516 (2007).
- (73) H.-Y. Kee, S. A. Kivelson, and G. Aeppli, Phys. Rev. Lett. 88, 257002 (2002).
- (74) A. S. Alexandrov, J. Phys.: Condens. Matt. 19, 125216 (2007).
- (75) A. A. Kordyuk, Low Temp. Phys. 38, 888 (2012).
- (76) A. A. Kordyuk et al., J. Supercond. Nov. Magn. 26, 2837 (2013).
- (77) O. K. Andersen and L. Boeri, Annalen der Physik 523, 8 (2011).
- (78) M. Sadovskii, E. Kuchinskii, and I. Nekrasov, J. Magn. Magn. Mater. 324, 3481 (2012) Fifth Moscow international symposium on magnetism.
- (79) V. B. Zabolotnyy et al., Nature 457, 569 (2009).
- (80) S. V. Borisenko et al., Phys. Rev. Lett. 105, 067002 (2010).
- (81) A. A. Kordyuk et al., Phys. Rev. B 83, 134513 (2011).
- (82) J. Maletz et al., Phys. Rev. B 89, 220506 (2014).
- (83) L. Fanfarillo et al., Phys. Rev. B 94, 155138 (2016).
- (84) D. V. Evtushinsky et al., Phys. Rev. B 96, 060501 (2017).
- (85) M. Yi et al., Phys. Rev. B 80, 024515 (2009).
- (86) V. Brouet et al., Phys. Rev. Lett. 110, 167002 (2013).
- (87) M. D. Watson et al., Phys. Rev. B 91, 155106 (2015).
- (88) Y. V. Pustovit and A. A. Kordyuk, Low Temp. Phys. 42, 995 (2016).
- (89) F. Lochner et al., Phys. Rev. B 96, 094521 (2017).
- (90) H. Ding et al., EPL 83, 47001 (2008).
- (91) D. V. Evtushinsky et al., New J. Phys. 11, 055069 (2009).
- (92) S. V. Borisenko et al., Symmetry 4, 251 (2012).
- (93) D. V. Evtushinsky et al., Phys. Rev. B 89, 064514 (2014).
- (94) R. M. Fernandes, A. V. Chubukov, and J. Schmalian, Nat. Phys. 10, 97 (2014).
- (95) P. J. Hirschfeld, M. M. Korshunov, and I. I. Mazin, Rep. Prog. Phys. 74, 124508 (2011).
- (96) W.-G. Yin, C.-C. Lee, and W. Ku, Phys. Rev. Lett. 105, 107004 (2010).
- (97) S. Onari and H. Kontani, Phys. Rev. Lett. 109, 137001 (2012).
- (98) A. Chubukov, Annu. Rev. Condens. Matter Phys. 3, 57 (2012).
- (99) A. V. Chubukov, M. Khodas, and R. M. Fernandes, Phys. Rev. X 6, 041045 (2016).
- (100) F. Wang and D.-H. Lee, Science 332, 200 (2011).
- (101) J. J. Lee et al., Nature 515, 245 (2014).
- (102) D. V. Evtushinsky et al., J. Phys. Soc. Jpn. 80, 023710 (2011).
- (103) S. Aswartham et al., Phys. Rev. B 85, 224520 (2012).
- (104) D. V. Evtushinsky et al., Phys. Rev. B 87, 094501 (2013).
- (105) C. Liu et al., Phys. Rev. B 84, 020509 (2011).
- (106) C. He et al., Phys. Rev. Lett. 105, 117002 (2010).
- (107) S. Thirupathaiah et al., Phys. Rev. B 86, 214508 (2012).
- (108) D. Mou et al., Phys. Rev. Lett. 106, 107001 (2011).
- (109) Y. Zhang et al., Nat. Mater. 10, 273 (2011).
- (110) J. Maletz et al., Phys. Rev. B 88, 134501 (2013).
- (111) S. Thirupathaiah et al., Phys. Rev. B 88, 140505 (2013).
- (112) A. Charnukha et al., Sci. Rep. 5, 10392 (2015).
- (113) A. Charnukha et al., Sci. Rep. 5, 18273 (2015).
- (114) S. Medvedev et al., Nat. Mater. 8, 630 (2009).
- (115) J. Guo et al., Phys. Rev. B 82, 180520 (2010).
- (116) S. L. Skornyakov et al., arXiv:1802.01850 (2018).
- (117) A. A. Kordyuk et al., Phys. Rev. B 79, 020504 (2009).
- (118) M. Hashimoto et al., Nat. Phys. 6, 414 (2010).
- (119) K. Rossnagel, J. Phys.: Cond. Matter 23, 213001 (2011).
- (120) D. Haug et al., New J. Phys. 12, 105006 (2010).
- (121) M. Hashimoto et al., Nat. Phys. 10, 483 (2014).
- (122) I. S. Jacobs et al., Phys. Rev. B 14, 3036 (1976).
- (123) J. E. Hirsch, Phys. Rev. Lett. 53, 2327 (1984).
- (124) J. Spałek and A. Oleś, Physica B+C 86-88, 375 (1977).
- (125) J. Spałek, Acta Phys. Pol. A 111, 409 (2007).
- (126) V. M. Loktev, Low Temp. Phys. 31, 490 (2005).
- (127) A. Koitzsch et al., Phys. Rev. B 69, 220505 (2004).
- (128) A. Mans et al., Phys. Rev. Lett. 96, 107007 (2006).
- (129) L. Alff et al., Nature 422, 698 (2003).
- (130) T. Das, R. S. Markiewicz, and A. Bansil, Phys. Rev. B 81, 174504 (2010).
- (131) C. Weber, K. Haule, and G. Kotliar, Nat. Phys. 6, 574 (2010).
- (132) H. Matsui et al., Phys. Rev. Lett. 94, 047005 (2005).
- (133) S. R. Park et al., Phys. Rev. B 75, 060501 (2007).
- (134) A. Varlamov, V. Egorov, and A. Pantsulaya, Adv. Phys. 38, 469 (1989).
- (135) Y. Blanter et al., Phys. Rep. 245, 159 (1994).
- (136) V. I. Makarov, V. G. Bar’yakhtar, and V. V. Gann, Sov. Phys. JETP 40, 85 (1975).
- (137) E. A. Pashitskii and A. S. Shpigel, Ukr. J. Phys. 23, 669 (1978).
- (138) A. Perali et al., Solid State Commun. 100, 181 (1996).
- (139) R. Caivano et al., Supercond. Sci. Technol. 22, 014004 (2009).
- (140) D. Innocenti et al., Phys. Rev. B 82, 184528 (2010).
- (141) D. Innocenti et al., Supercond. Sci. Technol. 24, 015012 (2011).
- (142) A. Bianconi, Nat. Phys. 9, 536 (2013).
- (143) A. Bianconi et al., Supercond. Sci. Technol. 28, 024005 (2015).
- (144) M. V. Mazziotti et al., EPL 118, 37003 (2017).
- (145) A. A. Kalenyuk et al., Phys. Rev. Lett. 120, 067001 (2018).
- (146) Y. S. Kushnirenko et al., Phys. Rev. B 96, 100504 (2017).
- (147) A. I. Coldea et al., Phys. Rev. Lett. 101, 216402 (2008).
- (148) L. Ortenzi et al., Phys. Rev. Lett. 103, 046404 (2009).
- (149) L. Benfatto and E. Cappelluti, Phys. Rev. B 83, 104516 (2011).
- (150) L. C. Rhodes et al., Phys. Rev. B 95, 195111 (2017).
- (151) Y. V. Pustovit, V. Bezguba, and A. A. Kordyuk, Metallofiz. Noveishie Tekhnol. 39, 709 (2017).
- (152) Y. V. Pustovit et al., Metallofiz. Noveishie Tekhnol. 40, 138 (2018).