Broadband spectroscopy of thermodynamic magnetization fluctuations through a ferromagnetic spin-reorientation transition
Abstract
We use scanning optical magnetometry to study the broadband frequency spectra of spontaneous magnetization fluctuations, or “magnetization noise”, in an archetypal ferromagnetic film that can be smoothly tuned through a spin reorientation transition (SRT). The SRT is achieved by laterally varying the magnetic anisotropy across an ultrathin Pt/Co/Pt trilayer, from the perpendicular to in-plane direction, via graded Ar+ irradiation. In regions exhibiting perpendicular anisotropy, the power spectrum of the magnetization noise, , exhibits a remarkably robust power law over frequencies from 1 kHz to 1 MHz. As the SRT region is traversed, however, spectra develop a steadily-increasing critical frequency, , below which the noise power is spectrally flat, indicating an evolving low-frequency cutoff for magnetization fluctuations. The magnetization noise depends strongly on applied in- and out-of-plane magnetic fields, revealing local anisotropies and also a field-induced emergence of fluctuations in otherwise stable ferromagnetic films. Finally, we demonstrate that higher-order correlators can be computed from the noise. These results highlight broadband spectroscopy of thermodynamic fluctuations as a powerful tool to characterize the interplay between thermal and magnetic energy scales, and as a means of characterizing phase transitions in ferromagnets.
Spontaneous magnetization fluctuations can occur in ferromagnetic materials, even in thermal equilibrium, particularly when the magnetic anisotropy energy becomes comparable to or less than the available thermal energy Bittel ; Ocio ; Silva ; Smith ; WeissmanSG ; Bean ; Sinwani . These intrinsic thermodynamic fluctuations encode valuable information about the magnetization dynamics of the system itself, because their frequency spectrum is intimately and necessarily related to the dissipative (imaginary) part of the magnetic susceptibility , in accord with the fluctuation-dissipation theorem Kubo ; Ocio (namely, , where is the thermal energy). Spectroscopy of this intrinsic “magnetization noise” can therefore provide an alternative and entirely passive means of measuring magnetization dynamics, that does not require driving, exciting, or perturbing the system away from thermal equilibrium – in contrast to most conventional methods for measuring magnetic resonance or ac susceptibility.
A fascinating and technologically-relevant testbed in which to study thermodynamic magnetization fluctuations are thin ferromagnetic films, because magnetic anisotropy energies can be readily engineered over a very wide range via material choice and by growth and post-processing conditions Johnson ; Vaz . This tunability arises from the competition and delicate balance between shape anisotropy (which generally favors in-plane magnetic alignment) and interfacial anisotropy (which can favor out-of-plane magnetic alignment for certain material combinations). Especially interesting are films in which the total magnetic anisotropy is continuously tuned to and through zero, by laterally varying either the film’s thickness Allenspach ; Qiu or its degree of interfacial disorder Chappert ; Fassbender . In this case the film can exhibit a spin-reorientation transition (SRT) Pappas ; Pescia ; Jensen ; Millev wherein the direction of ferromagnetic ordering transitions from out-of-plane (perpendicular) to in-plane. In perpendicularly-magnetized films with small net anisotropy, it is well established that the combination of exchange and dipolar energies leads to the formation of maze-like patterns of magnetic domains Hubert ; Yafet , as observed and studied extensively in ultrathin films of (Fe/Ni)/Cu Wu ; Won ; Kronseder2012 , Co/Pt Belliard ; Bergeard ; Ando , and CoFeB Yamanouchi . As the SRT is approached and the net magnetic anisotropy is reduced to zero, it has recently been observed that these domain patterns begin to fluctuate markedly in time. These thermodynamic magnetization fluctuations have been measured by electron microscopy Portmann ; Kronseder ; Kronseder2012 ; Meier , magneto-optic Kerr effect (MOKE) Bergeard ; Balk , x-ray scattering Seu , and transport Diao , revealing spatial correlations, topological effects, suceptibilities, and higher-order anisotropy. However, timescales of these measurements are typically slow, being limited to 1 ms. Fluctuations at frequency scales faster than 1 kHz were not resolved. However, the full frequency spectrum of these fluctuations contains rich information about the distributions of relaxation rates and the evolution of the anisotropy landscape through the SRT, which provide important insight for developing theoretical models.
To address this need and to complement these recent studies, here we develop a fast optical magnetometer to investigate the broadband frequency spectrum of thermodynamic magnetization fluctuations in ferromagnetic films that are smoothly tuned through a SRT. Using Pt/Co/Pt trilayers with laterally-graded magnetic anisotropy, we find that the frequency spectrum of the magnetization noise, , exhibits a remarkably robust power law from 1 kHz to 1 MHz in regions exhibiting perpendicular magnetization, indicating a broad distribution of fluctuation rates. However as the SRT region is traversed, develops a steadily-increasing critical frequency () below which the noise tends towards spectrally flat, indicating a minimum relaxation rate that becomes increasingly fast through the SRT. The magnetization fluctuations also depend strongly on applied magnetic fields, which can be understood within the context of the fluctuation-dissipation theorem and from considerations of the magnetic free energy. Field-dependent maps of the noise reveal detailed local magnetic anisotropies, and field-induced fluctuations are found to emerge even in trilayers with nominally stable perpendicular ferromagnetism. Finally we show that these methods can be used to analyze higher-order noise correlations, which can probe non-gaussian noise and time-reversal breaking effects. These results demonstrate that broadband optical detection of magnetization fluctuations provides a powerful and straightforward method for studying the subtle interplay between thermal energy and magnetic anisotropy that can drive phase transitions in ferromagnets, and in particular the spin-reorientation transition in ultrathin films.
.1 Pt/Co/Pt trilayers with laterally-graded magnetic anisotropy
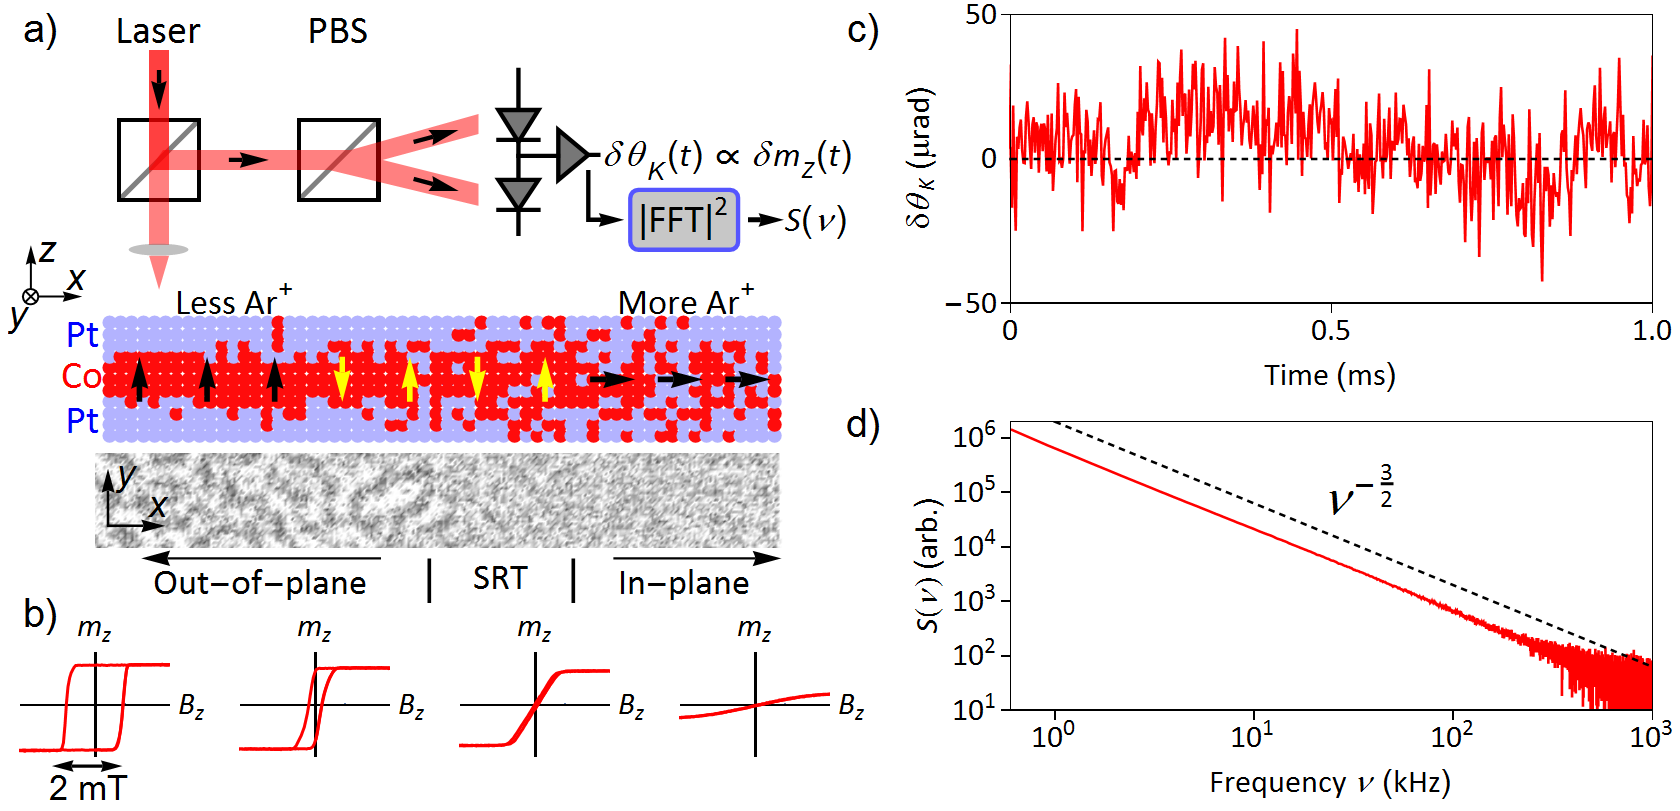
Figure 1a depicts the experiment and samples. The samples are Ta(3.8 nm)/Pt(3.9 nm)/Co(0.8 nm)/Pt(1.9 nm) ultrathin ferromagnetic films sputtered on Si substrates under high vacuum conditions. Conventional polar MOKE measurements of the average out-of-plane magnetization ( versus ) confirm that the as-grown films have perpendicularly-oriented magnetization, with approximately square hysteresis loops and coercive fields mT. To tune the magnitude and direction of the net magnetic anisotropy, we irradiate the samples with a laterally-varying dose of low-energy (100 eV) Ar+, which generates disorder and reduces the interfacial (perpendicular) magnetic anisotropy Chappert . The net magnetization direction that results from the competition between interfacial and shape anisotropy is therefore oriented out-of-plane () on regions of the sample with lower disorder, but switches to in-plane orientation () on sample regions with higher disorder, as depicted. Between these regions the spin reorientation transition occurs.
Shown below the cartoon of the trilayer is a magnetic contrast image of the surface of a laterally-graded Pt/Co/Pt trilayer (obtained via MOKE), showing the maze-like magnetic domain patterns that exist at =0 in its fully relaxed and demagnetized state. Dark and bright domains correspond to out-of-plane magnetization oriented along and , respectively. As also observed in many prior studies of ultrathin ferromagnets Wu ; Kronseder2012 ; Balk ; Meier , the characteristic size of the domains decreases as the SRT region is approached and the perpendicular magnetic anisotropy is reduced. Near the SRT, the images become increasingly blurry as thermodynamic fluctuations of the domain walls increase and become faster than the image acquisition rate (typically video-rate, or 30 Hz Balk ; Meier ; Bergeard , but as fast as 1 kHz in recent work by Kronseder Kronseder ). Our goal is to measure the relevant timescales and frequency distributions of these magnetization fluctuations over a much broader range of timescales and deep into (and through) the SRT, where the temporal resolution of imaging techniques can be limited.
Figure 1b shows conventional polar MOKE measurements of across the sample, confirming the graded magnetic anisotropy: The open hysteresis loops become narrower as perpendicular anisotropy is reduced, and the coercive field as the SRT is approached. Near the SRT, no hysteresis is observed and the low-field magnetization is effectively linear (constant susceptibility ), indicating that the trilayer is able to relax to an equilibrium maze domain pattern on a timescale faster than the (slow) sweep rate of the the applied field . Beyond the SRT the magnetization direction switches to in-plane and is suppressed.
.2 Optical spectroscopy of magnetization fluctuations
To detect and quantify the broadband magnetization fluctuations that exist in thermal equilibrium in these Pt/Co/Pt trilayers, we developed a real-time optical noise magnetometer based on polar MOKE. A linearly-polarized probe laser (632.8 nm, 1 mW) is focused to a small (4 m diameter) spot on the sample, which in turn is mounted on an x-y positioning stage for lateral scanning. This arrangement exclusively measures stochastic magnetization fluctuations in the out-of-plane direction, , which impart a fluctuating Kerr rotation on the reflected probe laser that is detected using balanced photodiodes. The resulting noise signal is continuously digitized, processed, and averaged in real time. Typically we compute and analyze , the power spectral density of the fluctuation signal. That is, where is the Fourier transform of and the brackets indicate an average over repeated measurements. Equivalently, is the real Fourier transform of the second-order (two-point) time correlator . Importantly, we note that this setup also allows for measurement and analysis of higher-than-second order noise correlators, as demonstrated in the last section.
The measurement bandwidth is determined by the speed of the photodetectors and digitizers. For these Pt/Co/Pt trilayers we use low-noise detectors and amplifiers with frequency response of several megahertz. The spectral density of the measured Kerr rotation is small, typically below 1 rad/. The fundamental photon shot noise of the probe laser itself contributes 50 nrad/ of (white) background noise; this constitutes the dominant source of non-magnetic noise at frequencies above a few hundred hertz. This shot noise can be mitigated by signal averaging and background subtraction. At lower frequencies, acoustic noise and mechanical vibrations limit accurate recovery of small magnetization fluctuations. Unless otherwise noted, we therefore restrict detailed analysis to frequencies kHz. These methods are adapted from studies of “optical spin noise spectroscopy” in atomic vapors and semiconductors, which are typically based on Faraday rotation at much higher (MHz) frequencies Crooker ; Oestreich ; Crooker2 ; Zapasskii .
Figure 1c shows an example of the spontaneous magnetization fluctuations that are measured in thermal equilibrium at an out-of-plane region of the Pt/Co/Pt trilayer, at room temperature (=295 K) and without any applied magnetic field. The induced Kerr rotation signal, , fluctuates in time about zero with a typical standard deviation of several microradians. Figure 1d shows the corresponding power spectral density of this magnetization noise, , averaged over many minutes. Strikingly, exhibits a very robust power-law decay over the frequency range from =1 kHz to 1 MHz, falling as where . As shown below, this power-law exponent is very robust and is independent of changes in magnetic anisotropy, temperature, and small applied magnetic fields .
In general, power law dynamics indicate that a system cannot be characterized by a single timescale but rather exhibits a broad distribution of relaxation and fluctuation timescales Press ; Weissman ; Milotti . Given that many magnetic domains and fluctuating domain walls are simultaneously probed within the focused laser spot, it is therefore worthwhile to ask what distribution of timescales or relaxation rates might generate the measured noise spectrum.
In a simple case, consider a system comprising many independent simple fluctuators, each characterized by a single exponentially-decaying correlation time (i.e., ). Individually, each fluctuator therefore contributes a Lorentzian power spectral density, , to the total measured noise spectrum; that is, is approximately flat up to the characteristic relaxation rate before falling off as at high frequencies. In this case the total noise spectrum is the weighted sum of many Lorentzians Milotti , where the weight is determined by the distribution, , of fluctuators having characteristic relaxation rate :
| (1) |
The distribution determines the functional form of , and the upper and lower cutoffs prevent divergences. If itself follows a power-law , then for . Note that if is truncated below some minimum relaxation rate , then will deviate from a pure power law and will tend towards spectrally flat at low frequencies below , as will become relevant in the next section. Moreover, if is truncated above a maximum rate , then will eventually decay as at high frequencies. Therefore the noise spectrum measured in Fig. 1d is (at least) consistent with an ensemble of simple fluctuators with distribution . Furthermore, no signature of or is evident in the data – at this location on the sample these limits clearly lie well below and above our measured frequency range, respectively. While clearly an oversimplification –ferromagnets are, after all, correlated systems and are not composed of independent fluctuators– these arguments help to provide a basis for understanding how changes in the functional form of can emerge.
A broad distribution of relaxation rates can be expected in ultrathin ferromagnetic films due to microscopic variations of the magnetic exchange, anisotropy, and dipolar energies. In particular, these variations can be caused by a spatially disordered magnetic energy landscape arising from the interface roughness, which can be comparable to film thickness. Indeed, a disordered magnetic energy forms the basis for a variety of statistical models Alessandro ; Cizeau ; Kuntz which have been applied to understand, e.g., the Barkhausen (magnetic switching) noise that arises in ferromagnets that are driven by a changing applied magnetic field. Predictions and measurements Narayan ; Bohn of the Barkhausen noise spectrum often yield power laws with exponents in the range of to , in potential correspondence with the value of determined in our studies of purely thermodynamic (undriven) magnetization fluctuations.
.3 Laterally scanning through the SRT at fixed temperature
Having established a power-law spectrum of magnetic fluctuations in a region of the trilayer exhibiting out-of-plane ferromagnetism, we now explore the much more interesting question of how the fluctuation spectrum evolves when the net magnetic anisotropy is reduced through zero and the sample undergoes a SRT. Figure 2 shows as the probe laser is scanned laterally across the sample, beginning (on the left) at a region of low interfacial disorder and strong perpendicular magnetic anisotropy, then moving through regions of increasing disorder where the sample undergoes a SRT, and ending (on the right) in the region of large disorder where the magnetization orientation is in-plane. As discussed in the previous section, Fig. 2a shows that in regions of perpendicular magnetization. As the probe laser is scanned toward the SRT region and perpendicular magnetic anisotropy becomes weaker, continues to exhibit a robust power law. However, the magnitude of and therefore also the integrated noise power, , increases significantly. Given that the thermal energy is not changing, the increase in thermodynamic fluctuations is consistent with the reduction of magnetic anisotropy as the SRT is approached.
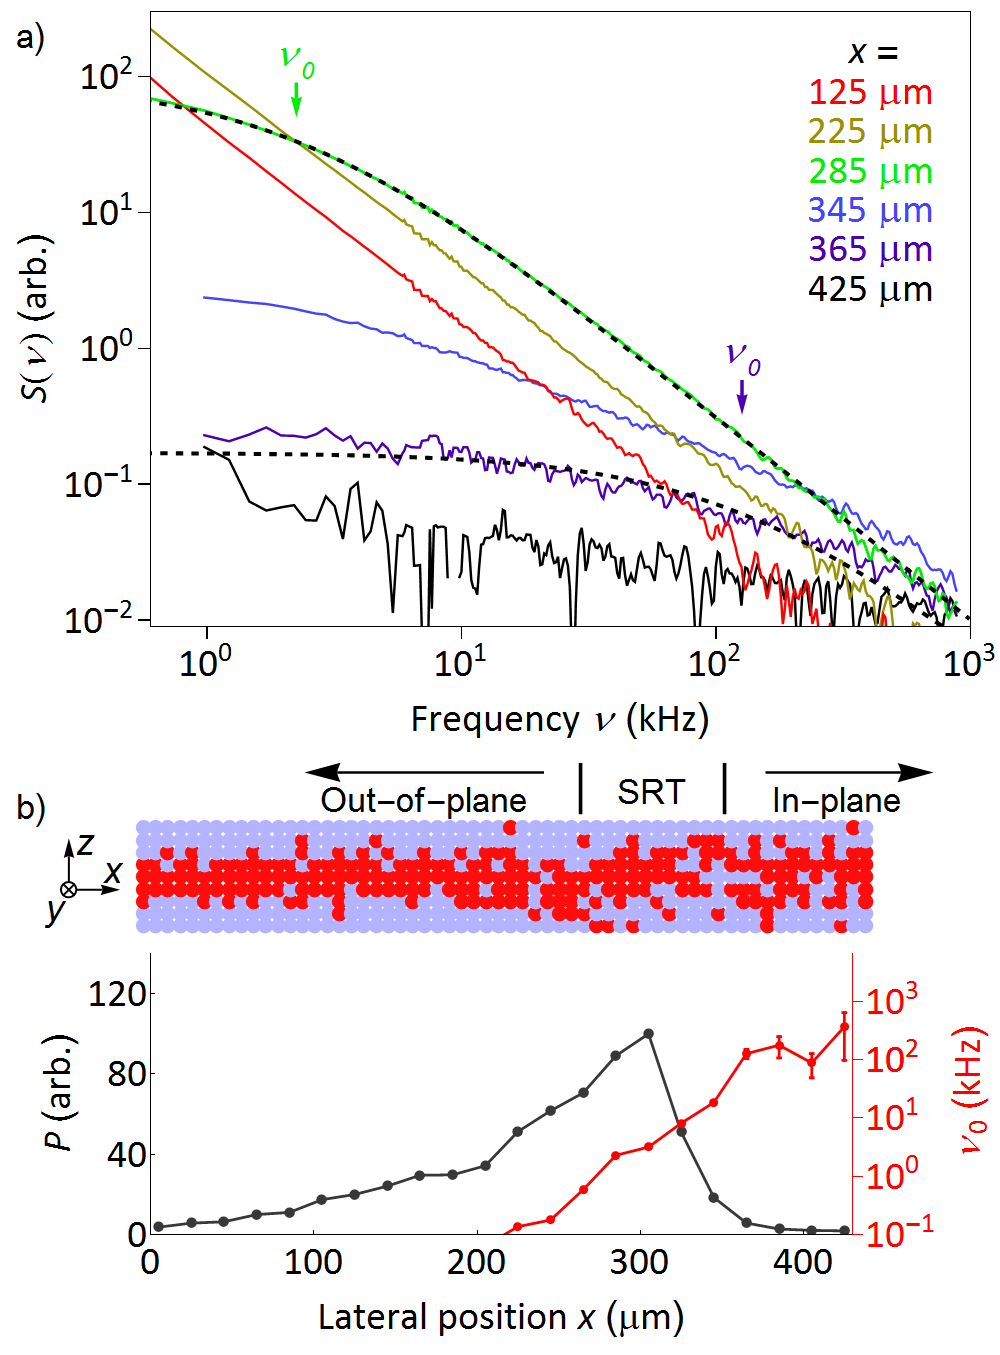
Crucially, the functional form of the magnetization fluctuation spectrum begins to evolve dramatically upon entering the SRT region. As seen in Fig. 2a, spectra develop a critical frequency, , below which the noise power rolls off and tends toward approximately flat. This critical frequency increases rapidly as the SRT region is traversed. Concomitantly, the integrated noise power markedly decreases. Beyond the SRT region, where the magnetization is in-plane, exceeds the measurement bandwidth and is small and nearly frequency-independent. Besides an overall scaling factor Crooker , we emphasize that the spectral shape of is not affected by the size of the laser spot.
Empirically, we find that all these noise spectra can be reasonably fit over the measured frequency range to the functional form . Examples of the fits are shown by dashed lines in Fig. 2a. Although not strictly physical [in principle, should equal ], this fitting allows us to better identify how the total noise power and the critical frequency evolve through the SRT. Figure 2b shows how these parameters vary as a function of the lateral position across the sample. reaches a maximum at the location where the coercive field . Near this point, begins to increase rapidly through the measurement frequency range and is subsequently rapidly suppressed.
As discussed in the previous section, the presence of is consistent with the development of a low-frequency truncation, or minimum rate , in the distribution of relaxation rates exhibited by the Pt/Co/Pt film. The slowest out-of-plane magnetization fluctuations , with characteristic relaxation rate less than , are the first to be suppressed upon entering the SRT region. As the SRT region is traversed and the magnetic anisotropy is further reduced, this low-frequency cutoff increases rapidly through our measurement bandwidth, after which point all out-of-plane fluctuations are very weak and the sample magnetization lies entirely in-plane. These trends therefore provide a means of characterizing the loss of perpendicular magnetic order through the spin-reorientation transition by the frequency distribution of the thermodynamic fluctuations.
.4 Temperature-tuning through the SRT
Because the SRT is defined by the interplay between magnetic anisotropy and thermal energy, we also can expect that the temperature will have a significant influence on the location of the SRT on the sample Pappas ; Pescia ; Jensen , and therefore on the magnetization fluctuations measured at a fixed location. This is confirmed in Fig. 3, where is measured at a fixed location on the Pt/Co/Pt film as a function of . Effectively, changing moves the SRT region through the location of the probe laser. We find that first exhibits a power law across the measured 0.1 kHz to 200 kHz frequency range at low (where the magnetization is out-of-plane), then follows a dependence at intermediate (in the SRT regime), and finally evolves at high towards spectrally flat and small (where the magnetization has switched to in-plane).
The effect of increased on at a fixed location is therefore effectively equivalent to measuring different sample regions with increasing interfacial disorder at fixed (as in Fig. 2), and again we find that can be used to characterize the SRT. It is also noteworthy that the exponent of the power-law decay, , is insensitive to over the range of the experiment.
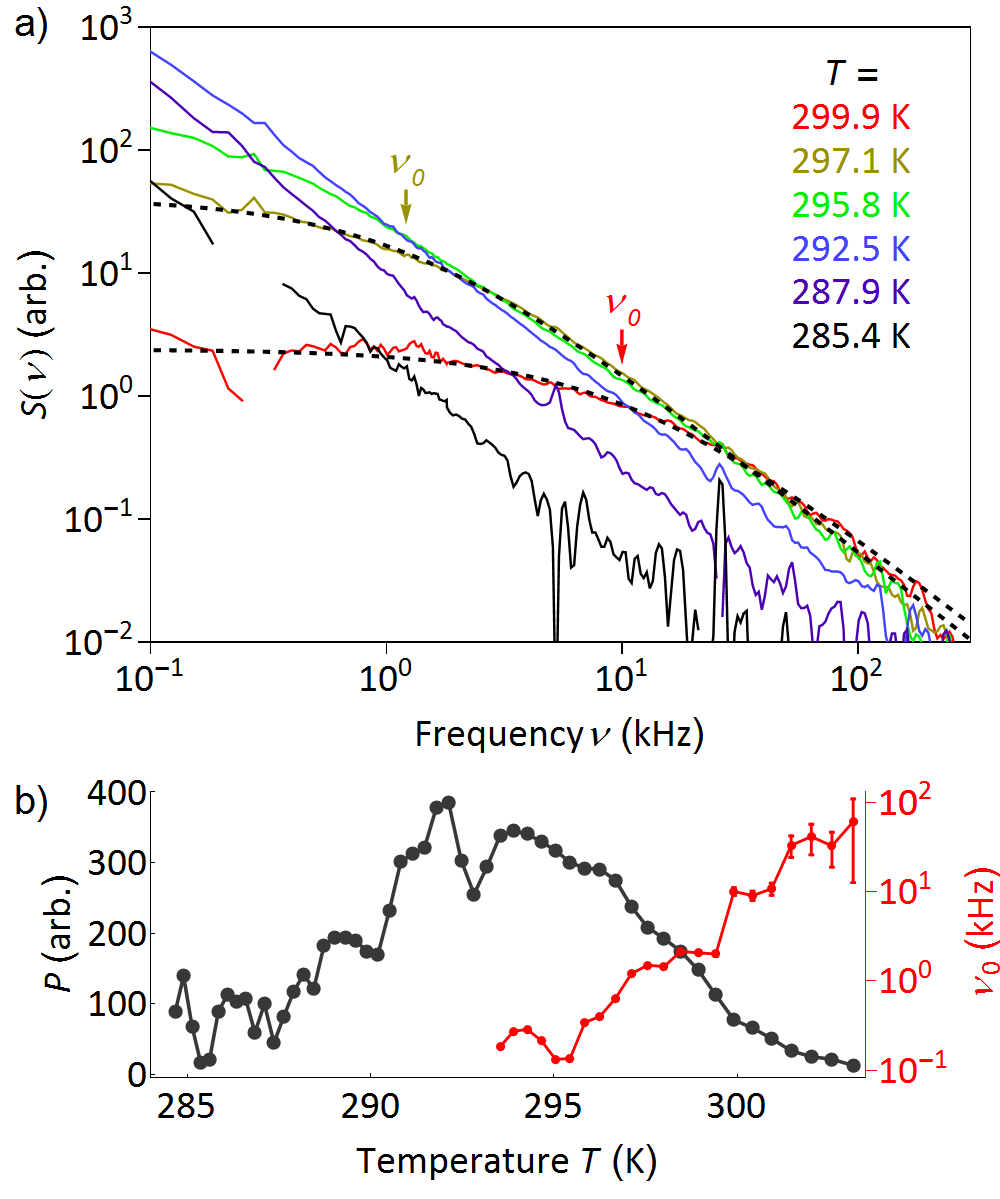
At other lateral positions on the sample with different net magnetic anisotropy, the SRT occurs at different temperatures. Qualitatively similar thermodynamic fluctuations are nonetheless obtained (albeit peaked at different temperatures), as shown in Supplemental Fig. S1. In all cases studied, at low , but develop an increasing cutoff frequency as is increased through the SRT.
.5 Magnetization fluctuations in applied out-of-plane fields , and relation to the susceptibility via the fluctuation-dissipation theorem
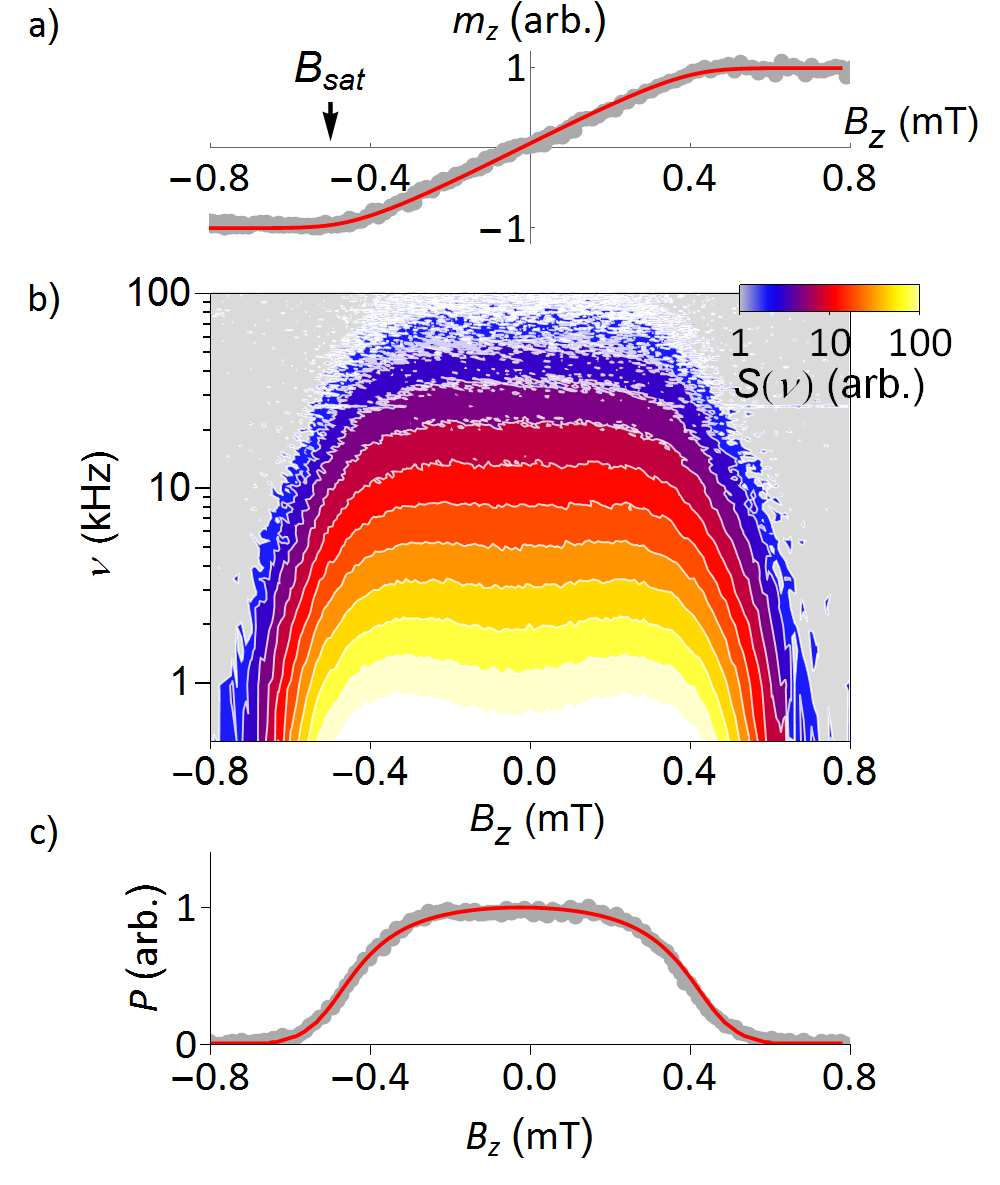
Since the magnetization of these Pt/Co/Pt trilayers is strongly field-dependent, we next investigate how magnetization fluctuations are influenced by applied fields, beginning with the simplest case of purely out-of-plane fields . Here we expect that sufficiently large will completely align and saturate the magnetization along , thereby suppressing fluctuations. For reference, Fig. 4a shows the magnetization at a location near the SRT, as measured by conventional polar MOKE using a very slow (quasi-static) field sweep rate of 22 T/s. The magnetization exhibits no hysteresis and varies approximately linearly with (indicating a constant dc magnetic susceptibility), until it saturates when , where mT. The absence of hysteresis indicates that at this location the trilayer can relax to an equilibrium maze-like magnetic domain pattern on timescales faster than the sweep rate of the external field.
Figure 4b shows a color surface map of the fluctuation spectra versus and , measured at the same location. Note that and are both shown on logarithmic scales, so that equally-spaced contours indicate power-law decays. For all small applied fields , spectra are largely unaffected, and they decay with the same power-law exponent . However, at all frequencies when and the magnetization saturates.
Figure 4c shows the integrated magnetization noise power, , as a function of . Crucially, we note the close correspondence between (which is measured via magnetization fluctuation spectroscopy in Fig. 4b) and the quasi-dc magnetic susceptibility, (which is measured via conventional magnetometry in Fig. 4a). is large and approximately constant between , where is also large and approximately constant. However, both and are rapidly suppressed to zero when . This correspondence is in line with the fluctuation-dissipation theorem Kubo , which relates frequency-dependent magnetization fluctuations to the frequency-dependent imaginary (i.e., dissipative) part of the magnetic susceptibility, :
| (2) |
To relate to the real dc magnetic susceptibility that was measured in Fig. 4a, we note that the real and imaginary parts of the susceptibility are necessarily coupled via Kramers-Kronig relations. The dc () susceptibility is therefore given by
| (3) |
Combining Eq. 2 and 3, we find that . Significant magnetization noise is therefore expected when the dc magnetic susceptibility is large Meier ; Ocio ; Diao , in agreement with our measurements.
.6 Relating the magnetization noise to a simple model of the magnetic free energy
We further note that the field dependence of both the average magnetization and the integrated magnetization noise can also be qualitatively captured by considering the free energy of a mixture of magnetic domains that are oriented along (i.e., within a domain the average magnetization ). We use a minimal mean-field model to describe the free energy (per moment), . It contains only a quadratic exchange term, a linear Zeeman energy term, and a typical Bragg-Williams mixing term for the entropy :
| (4) |
where and are scaling constants. Since the data in Fig. 4a indicates that =0 when =0, has a minimum here and therefore we take the coefficient to be positive. therefore has a single global minimum for any . At any , the equilibrium average magnetization is given approximately by the value of for which is minimized (see Supplemental Fig. S2). More importantly, the curvature of at this minimum value dictates the magnitude of fluctuations: if increases only slightly for a given fluctuation (i.e., if the curvature is small), then fluctuations cost little energy and are thermodynamically likely. In other words the curvature of is inversely related to the variance of magnetization fluctuations, (for details see Supplemental Fig. S2).
The red lines in Figs. 4a and 4c show and calculated using Eq. 4, using a common set of coefficients and that are adjusted to match the experimental data. The minimum of occurs at a value of that increases approximately linearly with until approaches , and the curvature of at this minimum is small and relatively constant until it increases sharply as . The overall trends are qualitatively captured, and again establish the link between the magnetization noise power and the dc magnetic susceptibility .
.7 Mapping magnetization fluctuations in both out-of-plane and in-plane magnetic fields
We also investigate how magnetization fluctuations in Pt/Co/Pt evolve under the additional influence of applied in-plane magnetic fields . In contrast to out-of-plane fields , small in-plane fields are not expected to directly contribute to the Zeeman energy of perpendicularly-oriented magnetic domains, since . However, in-plane fields can influence the energy of the domain walls that bound the domains Thiaville ; Je . The change in domain wall energy at a particular location depends on the relative orientation of with respect to the local magnetization direction in the wall. The local energy can therefore increase or decrease. However, when integrating the total domain wall energy around a closed path, linear changes in energy cancel out by symmetry and the total domain wall energy typically decreases quadratically as Thiaville ; Je . Besides influencing the energy (and fluctuations) of existing domain walls, application of at a point very near magnetic saturation can therefore also increase the likelihood of spontaneously forming new magnetic domains (such as bubble domains) Choi .
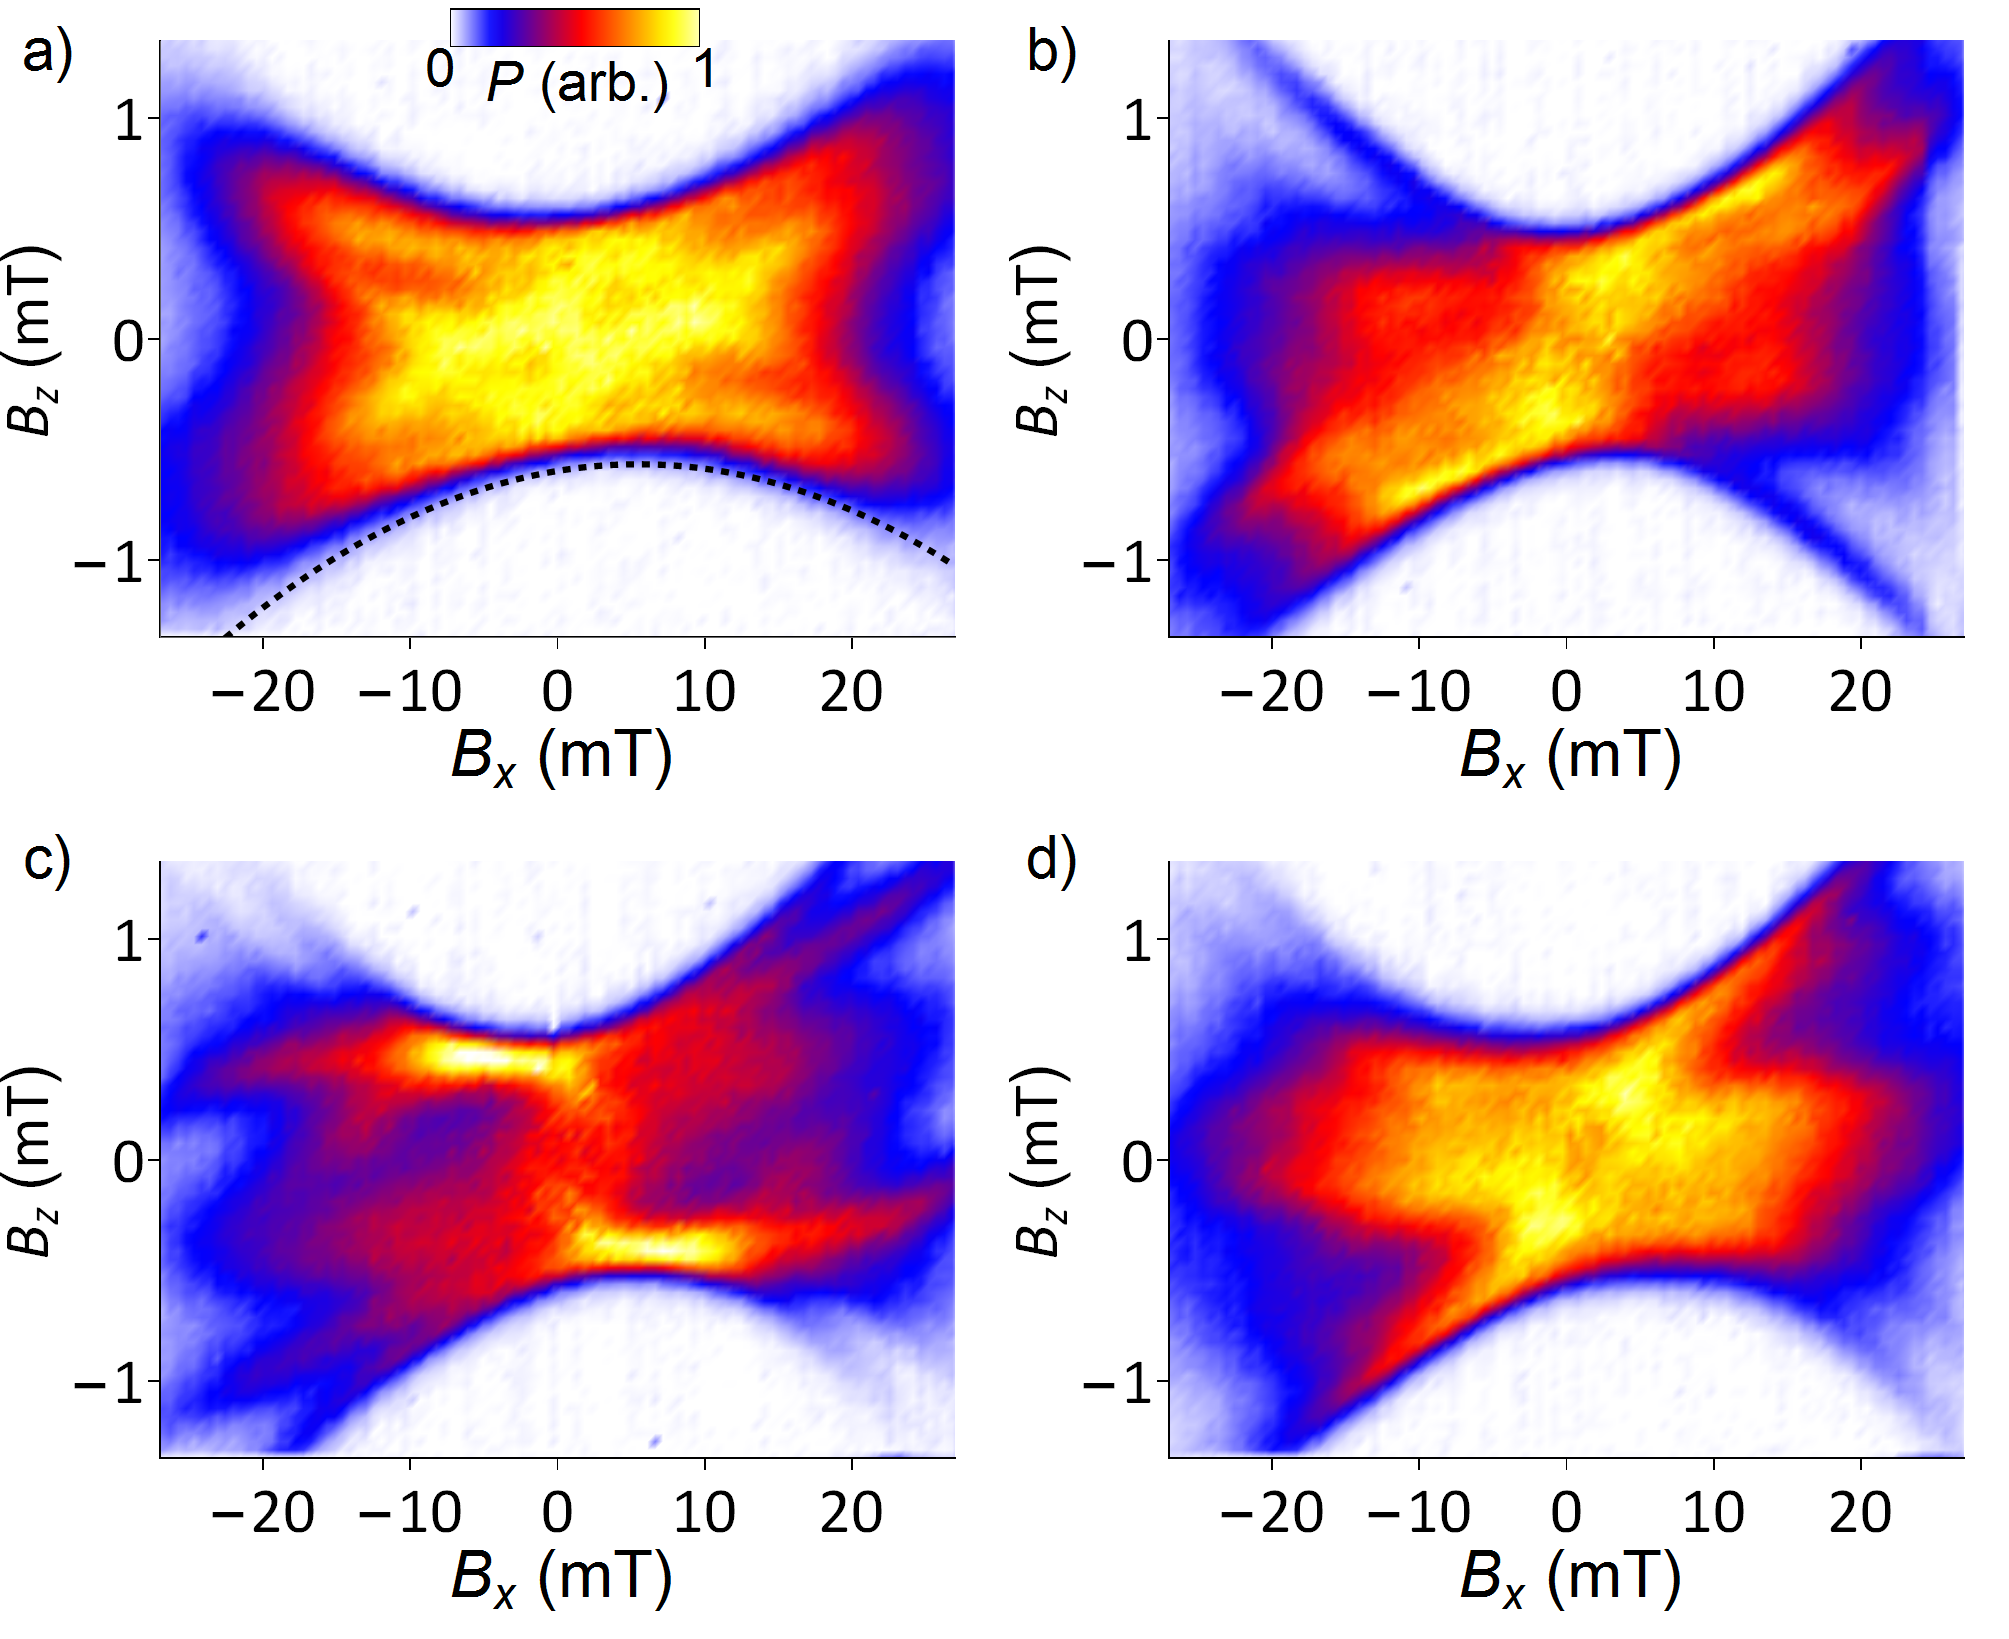
Figures 5a-d show intensity plots of the integrated magnetization noise power as a function of both (vertical axis) and also (horizontal axis), at four locations on the sample that are separated by only a few microns. Rather striking “bowtie” structures are revealed (note, however, the factor-of-ten larger field scale for ). A vertical line-cut through the bowtie at gives a cross-section that corresponds to the plot of shown in Fig. 4c. The magnetic field at which falls abruptly to zero is therefore revealed by the upper and lower borders of the bowtie – this is the applied field at which the average magnetization saturates along , which was defined in Fig. 4 as for the case when =0.
Several interesting properties of these fluctuation maps are immediately apparent. The first obvious aspect is that magnetization fluctuations persist out to larger when is applied, and that this relationship is approximately quadratic in , leading to the characteristic bowtie shape. This is consistent with the preceding discussion of how the net energy cost to form a closed domain wall decreases as : Consider, for example, a Pt/Co/Pt trilayer in an applied perpendicular field slightly larger than , so that is saturated, the susceptibility is zero, and no magnetic domains are present. The available thermal energy is not quite sufficient to induce the spontaneous formation of oppositely-oriented domains, and no fluctuations are present. However, when is applied, the domain-formation energy falls below , at which point domains can spontaneously form and disappear, will no longer be saturated, will no longer equal zero, and magnetization fluctuations will appear. Only by increasing further (by an amount proportional to ) will the magnetization again achieve saturation.
A second obvious property of these images is that the total noise power is not constant within a bowtie. Patterns exist, but interestingly the patterns clearly lack reflection symmetry about the horizontal (=0) and vertical axes (=0). Rather, the images exhibit point inversion symmetry about the =0 origin. This is consistent with a uniaxial magnetic anisotropy at the measurement location that is canted slightly away from perfectly out-of-plane (i.e., it has some in-plane component), so that for a given the influence of will in general be different than that of (and similarly, at a given the influence of and will be different). However, reversing both and preserves the symmetry and gives the same magnetic free energy, susceptibility, and noise, in keeping with the images in Fig. 5.
The final aspect that is quite apparent in Fig. 5 is that the four maps of exhibit markedly different patterns, even though they were acquired at only slightly different locations on the Pt/Co/Pt trilayer ( m apart). This indicates that deviations of the magnetic anisotropy away from are strongly position dependent in the Pt/Co/Pt film, at least down to length scales on the order of the laser spot (4 m). We emphasize that in order to acquire a map of , the sample is forced to undergo many saturation and demagnetization cycles; therefore the patterns cannot be due to some temporary or metastable domain configuration but must instead originate in a physical property of the sample. These variations in the magnetic anisotropy landscape likely derive from spatial inhomogeneity in the disorder that is induced by the Ar+ irradiation and the fact that Co and Pt are not lattice matched.
.8 Inducing magnetization fluctuations in otherwise stable ferromagnetic films
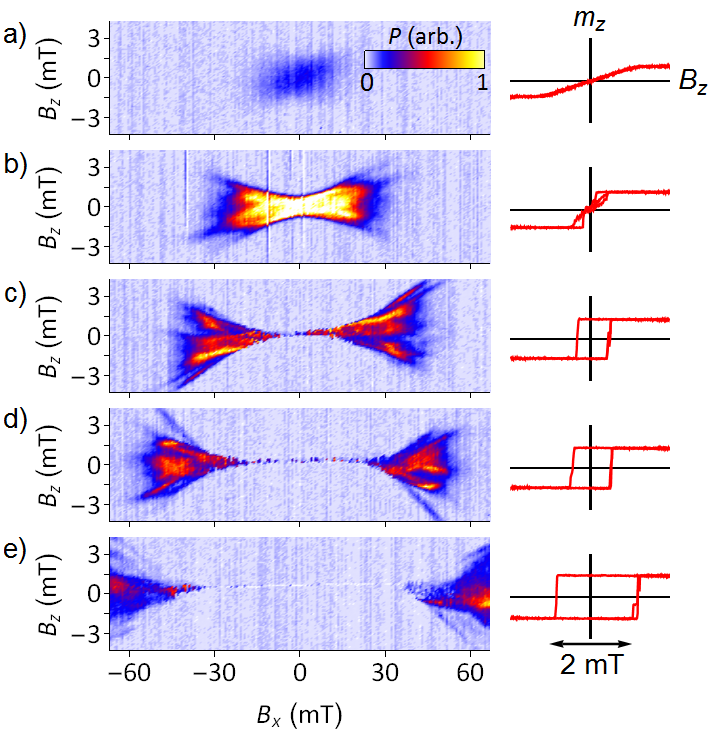
We now investigate how these noise maps evolve over a broad range of magnetic anisotropy. Figure 6 shows maps of acquired at very different lateral positions on the sample, starting in panel (a) in the region with in-plane magnetization where fluctuations are small, continuing in panel (b) through the SRT region that was discussed in the previous section, and finally moving in panels (c-e) to less disordered regions of the sample with perpendicular magnetization and increasingly stable out-of-plane ferromagnetism. For reference, the corresponding magnetization curves (at =0) are also shown. Of particular interest are Figs. 6 (c-e), which show how magnetization fluctuations evolve as the trilayer exhibits increasingly strong and stable perpendicular ferromagnetism. The bowties split apart, with fluctuations appearing at larger . As expected, no fluctuations are observed near zero field when the trilayer exhibits stable perpendicular ferromagnetism, which we define as the presence of an open hysteresis loop and a stable remnant magnetization. The key point, however, is that even in trilayers that are nominally very stable ferromagnets at zero field, magnetization fluctuations can emerge in sufficiently large in-plane fields . Studies of non-irradiated trilayers with even larger confirm this to be generally true (see Supplemental Fig. S3).
This result has a number of consequences. Similar to the data shown in Fig. 5, these noise maps show significant nonuniformity, indicating that even films with robust perpendicular ferromagnetism exhibit some degree of microstructured in-plane anisotropy, which could play a role, for example, during magnetic switching in technological applications. Further, it shows that measurements which use fluctuations to detect subtle micromagnetic effects Demidov may be possible in materials with significant perpendicular anisotropy. Finally, we speculate that these results may be applicable to future neuromorphic magnetic computation schemes Mizrahi , which require the capability to reversibly tune the fluctuations of individual magnetic elements and the interactions between them.
.9 Higher-order correlations of the magnetization noise
In this last section, we demonstrate an important consequence and potential advantage of measuring fluctuations directly in the time domain, which is that all possible time correlators can, in principle, be retrieved and analyzed from the noise signal. Thus far, we have focused on , the power spectral density of the measured fluctuations, which is derived from the second-order (or two-point) time correlator . As previously described, where is the Fourier transform of measured over a sufficiently long duration .
Importantly, however, the -order time correlator can contain additional information that is not trivially related to , particularly in the presence of interactions, inhomogeneous broadening effects, and/or non-gaussian noise due to (for example) the discrete nature of the system. In general, only the full set of all correlators contains complete information about an interacting system. Higher-order correlations have been studied theoretically Fuxiang ; Schad and experimentally in magnetic systems such as spin glasses WeissmanSG and amorphous magnets Petta , but we are not aware of any prior experimental studies of higher-order correlations of fluctuations in magnetic films in thermal equilibrium. Such correlators, however, play an important role in the theory of phase transitions and nonlinear thermodynamics Stratonovich . Therefore their experimental measurement is highly desirable as a tool for characterization of material phases and for tests of fundamental theoretical predictions, such as higher-order fluctuation relations and for testing the universality of scaling exponents.
By way of example we compute from our noise measurements the simplest nontrivial higher (third) order correlator , which can be expressed in the frequency domain as
| (5) |
contains essentially different information compared to a two-point correlator. By construction, it describes correlations between different frequencies and is therefore typically represented as a two-dimensional intensity plot. Furthermore, note that is complex-valued. Its real and imaginary components have different physical meaning, and in principle it is possible for fluctuations to exhibit a real , or an imaginary , or both. The real part of is, for example, sensitive to any skewness or third moment in the distribution of about its mean – e.g., if a simple magnetic fluctuator spends more time in its state than in its state (that being just one example of a non-gaussian noise distribution, as often exemplified by random telegraph noise with statistically inequivalent dwell times in the high and low state).
The imaginary part of is sensitive to time-reversal symmetry breaking of the measured signal, meaning that in a statistical sense. For example a sawtooth wave, though not a noise signal per se, breaks time-reversal symmetry, but a triangular wave or sine wave does not. Random telegraph noise with statistically inequivalent rise and fall times would also generate an imaginary , even when the dwell times in the high and low states are equivalent and the distribution of has no skewness. In general, magnetic systems can of course break time-reversal symmetry. However, is expected to hold for Ising-Glauber spin dynamics that satisfy detailed balance at thermal equilibrium Fuxiang .
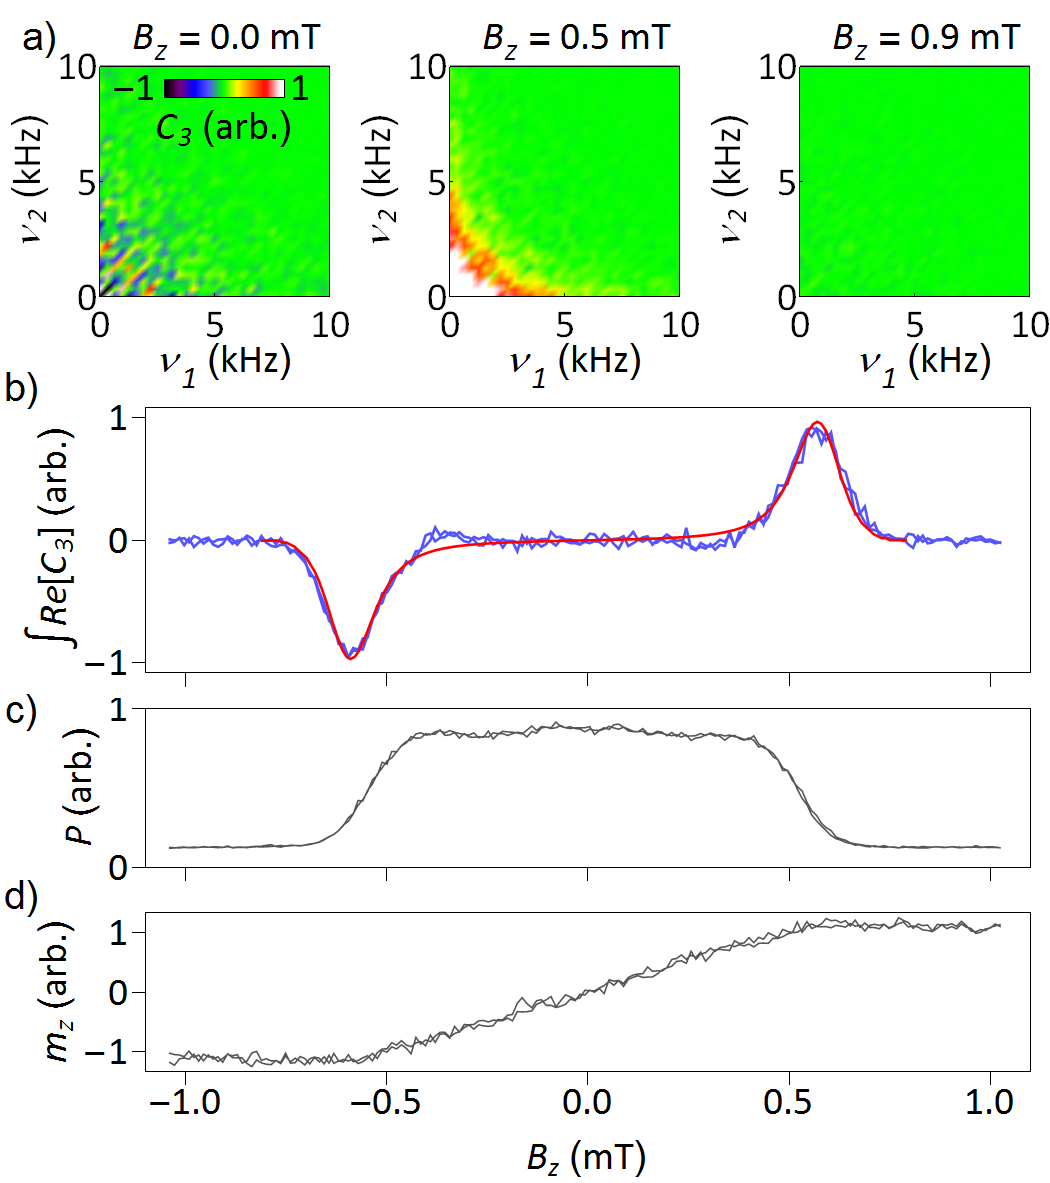
Figure 7 shows the real part of , measured at a location on the trilayer where increases linearly (and the noise power is large) when . Fluctuations at this location are very similar to those shown earlier in Fig. 4, where mT. Figure 7a shows measured at =0 mT, 0.5 mT, and 0.9 mT. Furthermore, Fig. 7b shows the integral as a continuous function of . For comparison and completeness, Figs. 7c and 7d show the simultaneously-measured total noise power and the average magnetization as continuous functions of (cf. Fig. 4).
The real part of is found to be non-zero when and approaches saturation. This indicates a measurable skewness (third moment) in the probability distribution of the noise signal about its mean, which can be viewed as arising from a cubic nonlinearity (i.e., a nonzero third derivative) of the free energy at its minimum value. To show this, we note that integrating over both frequencies yields the equal-time correlator , which in turn is proportional to (see Supplemental Fig. S2). By inspection of Eq. 4, this cubic nonlinearity arises from the entropic contribution to when . The data are in good qualitative agreement with predictions from Eq. 4, where is small when (because the fluctuations are nearly gaussian) and when (because the fluctuations are strongly suppressed), but reaches a local maximum when where both the cubic nonlinearity and the fluctuations are large. The red line in Fig. 7b shows the real part of calculated from the magnetic free energy (derived in detail in the Supplementary Information), showing very good agreement. We further note that other experimental gaussian noise sources such as photon shot noise do not produce a background level to that must be subtracted off (in contrast to ), which further motivates analysis of to reveal subtle non-gaussianity effects in fluctuation signals.
Finally, we find that Im[]=0 to within our experimental accuracy, for all applied . This means that the measured fluctuation signal in our Pt/Co/Pt trilayers did not explicitly break time-reversal symmetry, and that in thermal equilibrium remained indistinguishable from in a statistical sense.
.10 Summary
We have used Kerr magnetometry to study the broadband frequency spectra of thermodynamic magnetization fluctuations in an archetypal ultrathin ferromagnet (a Pt/Co/Pt trilayer). The power spectral density of the fluctuations, , is found to follow a robust power law on regions of the trilayer exhibiting out-of-plane magnetization, indicating a broad distribution of fluctuation and relaxation rates. However, the functional form of changes dramatically as the magnetic anisotropy is reduced to zero and the trilayer is tuned through a SRT (either by increasing temperature or by increasing interfacial disorder). Namely, as the SRT is traversed, develops a steadily-increasing critical frequency below which the noise power tends towards spectrally flat, indicating an evolving low-frequency cutoff for out-of-plane magnetization fluctuations. These results therefore provide a means of characterizing phase transitions in ferromagnets via their influence on spontaneous dynamics. The fluctuations are found to be strongly dependent on applied magnetic fields, which can be understood within the framework of the fluctuation-dissipation theorem and from considerations of the magnetic free energy. Sufficiently large in-plane fields can induce spontaneous fluctuations in films that otherwise exhibit stable out-of-plane ferromagnetism. Finally, we demonstrate that higher-than-second order correlators can be computed and analyzed from the measured fluctuations, which can potentially provide a sensitive and powerful means of revealing subtle influence of non-gaussian noise and time-reversal breaking effects.
We thank Dan Pierce, Vivien Zapf, Mark Stiles, Alice Mizrahi, and Carl Boone for useful discussions. Work at the NHMFL was supported by the Los Alamos LDRD program, National Science Foundation DMR-1157490, the State of Florida, and the US Department of Energy.
References
- (1) H. Bittel, Noise of Ferromagnetic Materials, IEEE Trans. Magn. 5, 359 (1969).
- (2) M. Ocio, H. Bouchiat, and P. Monod, Observation of 1/f Magnetic Fluctuations in Spin Glasses, J. Magn. Magn. Mater 54-57, 11 (1986).
- (3) T. J. Silva and H. N. Bertram, Magnetization Fluctuations in Uniformly Magnetized Thin-film Recording Media, IEEE Trans. Magn. 26, 3129 (1990).
- (4) N. Smith and P. Arnett, White-noise Magnetization Fluctuations in Magnetoresistive Heads, Appl. Phys. Lett. 78, 1448 (2001).
- (5) M. B. Weissman, What is a spin glass? A glimpse via mesoscopic noise, Rev. Mod. Phys. 65, 829 (1993).
- (6) C. P. Bean and J. D. Livingston, Superparamagnetism, J. Appl. Phys. 30, S120 (1959).
- (7) O. Sinwani, J. W. Reiner, and L. Klien, Monitoring Superparamagnetic Langevin Behavior of Individual SrRuO3 Nanostructures, Phys. Rev. B 89, 020404(R) (2014).
- (8) R. Kubo, The fluctuation-dissipation theorem, Rep. Prog. Phys. 29, 255 (1966).
- (9) M. T. Johnson, P. J. H. Bloemen, F. J. A. den Broeder and J. J. de Vries, Magnetic Anisotropy in Metallic Multilayers, Rep. Prog. Phys. 59, 1409 (1996).
- (10) C. A. F. Vaz, J. A. C. Bland, and G. Lauhoff, Magnetism in ultrathin film structures, Rep. Prog. Phys. 71, 056501 (2008).
- (11) R. Allenspach and A. Bischof, Magnetization direction switching in Fe/Cu(100) epitaxial films: Temperature and thickness dependence, Phys. Rev. Lett. 69, 3385 (1992).
- (12) Z. Q. Qiu, J. Pearson, and S. D. Bader, Asymmetry of the Spin Reorientation Transitition in Ultrathin Fe Films and Wedges Grown on Ag(100), Phys. Rev. Lett. 70, 1006 (1993).
- (13) C. Chappert, H. Bernas, J. Ferré, V. Kottler, J.-P. Jamet, Y. Chen, E. Cambril, T. Devolder, F. Rousseaux, V. Mathet, H. Launois, Planar Patterned Magnetic Media Obtained by Ion Irradiation, Science 280, 1919 (1998).
- (14) J. Fassbender, D. Ravelosona, and Y. Samson, Tailoring magnetism by light-ion irradiation, J. Phys. D.: Appl. Phys. 37, R179 (2004).
- (15) D. P. Pappas, K. P. Kämper, and H. Hopster, Reversible Transition Between Perpendicular and In-plane Magnetization in Ultrathin Films, Phys. Rev. Lett. 64, 3179 (1990).
- (16) D. Pescia and V. L. Pokrovsky, Perpendicular Versus In-plane Magnetization in a 2D Heisenberg Monolayer at Finite Temperatures, Phys. Rev. Lett. 65, 2599 (1990).
- (17) P. J. Jensen and K. H. Bennemann, Direction of the magnetization of thin films and sandwiches as a function of temperature, Phys. Rev. B 42, 849 (1990).
- (18) Y. Millev and J. Kirschner, Reorientation transitions in ultrathin ferromagnetic films by thickness- and temperature-driven anisotropy flows, Phys. Rev. B 54, 4137 (1996).
- (19) A. Hubert and R. Schäfer, Magnetic Domains: The Analysis of Magnetic Microstructures, (Springer Science & Business Media, Berlin 2008).
- (20) Y. Yafet and E. M. Gyorgy, Ferromagnetic strip domains in an atomic monolayer, Phys. Rev. B 38, 9145 (1988).
- (21) Y. Z. Wu, C. Won, A. Scholl, A. Doran, H. W. Zhao, X. F. Jin, and Z. Q. Qiu, Magnetic Stripe Domains in Coupled Magnetic Sandwiches, Phys. Rev. Lett. 93, 117205 (2004).
- (22) C. Won, Y. Z. Wu, J. Choi, W. Kim, A. Scholl, A. Doran, T. Owens, J. Wu, X. F. Jin, H. W. Zhao, and Z. Q. Qiu, Magnetic stripe melting at the spin reorientation transition in Fe∕Ni∕Cu(001), Phys. Rev. B 71, 224429 (2005).
- (23) M. Kronseder, M. Buchner, H. G. Bauer, and C. H. Back Dipolar-energy-activated magnetic domain pattern transformation driven by thermal fluctuations, Nat. Comm. 4, 2054 (2013).
- (24) L. Belliard, J. Miltat, V Kottler, V. Mathet, and C. Chappert, Stripe Domains Morphology Versus Layers Thickness in CoPt Multilayers, Jour. Appl. Phys. 81, 5315 (1997).
- (25) N. Bergeard, J. Jamet, A. Mougin, J. Ferré, J. Gierak, E. Bourhis, and R. Stamps, Dynamic Fluctuations and Two-dimensional Melting at the Spin Reorientation Transition, Phys. Rev. B 86, 094431 (2012).
- (26) F. Ando, H. Kakizakai, T. Koyama, K. Yamada, M. Kawaguchi, S. Kim, K.-J. Kim, T. Moriyama, D. Chiba, and T. Ono, Modulation of the Magnetic Domain Size Induced by an Electric Field, Appl. Phys. Lett. 109, 022401 (2016).
- (27) M. Yamanouchi, A. Jande, P. Dhagat, S. Ikeda, F. Matsukura, and H. Ohno, Domain Structure in CoFeB Thin Films With Perpendicular Magnetic Anisotropy, IEEE Magn. Lett. 2, 30000304 (2011).
- (28) O. Portmann, A. Vaterlaus, and D. Pescia, Observation of Stripe Mobility in a Dipolar Frustrated Ferromagnet, Phys. Rev. Lett. 96, 047212 (2006).
- (29) T. N. G. Meier, M. Kronseder, M. Zimmermann, and C. H. Back, Quantification of Thermal Fluctuations in Stripe Domain Patterns, Phys. Rev. B 93, 064424 (2016).
- (30) M. Kronseder, T. N. G. Meier, M. Zimmermann, M. Buchner, M. Vogel, and C. H. Back, Real-time Observation of Domain Fluctuations in a Two-dimensional Magnetic Model System, Nat. Comm. 6, 6932 (2015).
- (31) A. L. Balk, M. D. Stiles, and J. Unguris, Critical Behavior of Zero-field Magnetic Fluctuations in Perpendicularly Magnetized Thin Films, Phys. Rev. B 90, 184404 (2014).
- (32) K. A. Seu, S. Roy, J. J. Turner, S. Park, C. M. Falco, and S. D. Kevan, Cone Phase and Magnetization Fluctuations in Au/Co/Au Thin Films Near the Spin-reorientation Transition, Phys. Rev. B 82, 012404 (2010).
- (33) Z. Diao, E. R. Nowak, G. Feng, and J. M. D. Coey, Magnetic Noise in Structured Hard Magnets, Phys. Rev. Lett. 104, 047202 (2010).
- (34) S. A. Crooker, D. G. Rickel, A. V. Balatsky, and D. L. Smith, Spectroscopy of Spontaneous Spin Noise as a Probe of Spin Dynamics and Magnetic Resonance, Nature 431, 49 (2004).
- (35) M. Oestreich, M. Römer, R. J. Haug, and D. Hägele, Spin Noise Spectroscopy in GaAs, Phys. Rev. Lett. 95, 216603 (2005).
- (36) S. A. Crooker, J. Brandt, C. Sandfort, A. Greilich, D. R. Yakovlev, D. Reuter, A. D. Wieck, and M. Bayer, Spin noise of electrons and holes in self-assembled (In,Ga)As quantum dots, Phys. Rev. Lett. 104, 036601 (2010).
- (37) V. S. Zapasskii, A. Greilich, S. A. Crooker, Yan Li, G. G. Kozlov, D. R. Yakovlev, D. Reuter, A. D. Wieck, and M. Bayer, Optical Spectroscopy of Spin Noise, Phys. Rev. Lett. 110, 176601 (2013).
- (38) W. H. Press, Flicker Noises in Astronomy and Elsewhere, Comments Astrophys. 7, 103 (1978).
- (39) M. B. Weissman, Noise and Other Slow, Nonexponential Kinetics in Condensed Matter, Rev. Mod. Phys. 60, 537 (1988).
- (40) E. Milotti, Linear Processes that Produce 1/f or Flicker Noise, Phys. Rev. E 51, 4 (1995).
- (41) B. Alessandro, C. Beatrice, G. Bertotti, and A. Montorsi, Domain-wall dynamics and Barkhausen effect in metallic ferromagnetic materials. I. Theory, J. Appl. Phys. 68, 2901 (1990).
- (42) P. Cizeau, S. Zapperi, G. Durin, and H. E. Stanley, Dynamics of a Ferromagnetic Domain Wall and the Barkhausen Effect, Phys. Rev. Lett. 79, 4669 (1997).
- (43) M. C. Kuntz and J. P. Sethna, Noise in Disordered Systems: The Power Spectrum and Dynamic Exponents in Avalanche Models, Phys. Rev. B 62, 11699 (2000).
- (44) O. Narayan, Self-Similar Barkhausen Noise in Magnetic Domain Wall Motion, Phys. Rev. Lett. 77 3855 (1996).
- (45) F. Bohn, M. A. Correa, M. Carara, S. Papanikolaou, G. Durin, and R. L. Sommer, Statistical properties of Barkhausen noise in amorphous ferromagnetic films, Phys. Rev. E 90, 032821 (2014).
- (46) A. Thiaville, S. Rohart, E. Jue, V. Cros, and A. Fert, Dynamics of Dzyaloshinskii domain walls in ultrathin magnetic films, Europhys. Lett. 100, 57002 (2012).
- (47) S.-G. Je, D.-H. Kim, S.-C. Yoo, B.-C. Min, K.-J. Lee, and S.-B. Choe, Asymmetric Magnetic Domain-wall Motion by the Dzyaloshinskii-Moriya Interaction, Phys. Rev. B 88, 214401 (2013).
- (48) J. Choi, J. Wu, C. Won, Y. Z. Wu, A. Scholl, A. Doran, T. Owens, and Z. Q. Qiu, Magnetic Bubble Domain Phase at the Spin Reorientation Transition of Ultrathin Fe/Ni/Cu(001) Film, Phys. Rev. Lett. 98, 207205 (2007).
- (49) V. E. Demidov, S. Urazhdin, E. R. J. Edwards, M. D. Stiles, R. D. McMichael, and S. O. Demokritov, Control of Magnetic Fluctuations by Spin Current, Phys. Rev. Lett. 107, 107204 (2011).
- (50) A. Mizrahi, N. Locatelli, R. Matsumoto, A. Fukushima, H. Kubota, S. Yuasa, V. Cros, J.-V. Kim, J. Grollier, and D. Querlioz, Magnetic Stochastic Oscillators: Noise-Induced Synchronization to Underthreshold Excitation and Comprehensive Compact Model, IEEE Trans. Magn. 51, 1 (2015).
- (51) F. Li, A. Saxena, D. Smith, and N. A. Sinitsyn, Higher-order Spin Noise Statistics, New J. Phys. 15, 113038 (2013).
- (52) P. Schad, B. N. Narozhny, Gerd Schön, and A. Shnirman, Nonequilibrium Spin Noise and Noise of Suceptibility, Phys. Rev. B 90, 205419 (2014).
- (53) J. R. Petta, M. B. Weissman, and G. Durin, Barkhausen Pulse Structure in an Amorphous Ferromagnet: Characterization by High-order Spectra, Phys. Rev. E 57, 6363 (1998).
- (54) R. L. Stratonovich, Nonlinear Nonequilibrium Thermodynamics I, Springer-Verlag Berlin, Heidelberg (1992).