A Catalog of Post-starburst Quasars from Sloan Digital Sky Survey Data Release 7
Abstract
We present a catalog of nearby (z 0.5) quasars with significant features of post-starburst stellar populations in their optical spectra, so-called post-starburst quasars, or PSQs. After carefully decomposing spectra from the Sloan Digital Sky Survey (SDSS) Data Release 7 (DR7) Quasar Catalog into quasar and host-galaxy components, we derive a sample of 208 PSQs. Their host-galaxy components have strong H absorption () indicating a significant contribution of an intermediate-aged stellar population formed in a burst of star formation within the past 1 Gyr, which makes them potentially useful for studying the co-evolution of supermassive black holes and their host galaxies.
1 Introduction
Supermassive black holes (SMBHs) exist at the centers of essentially all massive galaxies (Kormendy & Richstone, 1995). Quasars, the most luminous Active Galactic Nuclei (AGNs), are powered by the accretion onto SMBHs. They are not only an important phase of SMBH growth, but also represent a key stage in the life cycle of massive galaxies (Heckman & Best 2014). AGN feedback can terminate star formation in the host galaxy and mass accretion onto the SMBH (Fabian, 2012, and references therein).
Theoretical studies have suggested two mechanisms responsible for triggering starbursts and AGNs. First, in the early universe, major-mergers ignite the the most luminous quasars and starbursts(e.g., Bouwens et al., 2009; Treister et al., 2012). Second, in recent epochs, the main fueling mechanisms may be entirely driven by secular processes (e.g., Hopkins & Hernquist 2009).
Recently, several studies have indicated that AGN and starburst activity may not be coeval. For example, Davies (2007) studied a sample of local AGN with IFU data, and found that strong AGNs are not present when the central stellar populations are of the order of a few 10 Myr old, implying a delay about 50-100 Myr between the onset of central stellar mass growth and subsequent rapid black hole growth. Other recent studies (e.g., Schawinski et al., 2009; Wild et al., 2009, 2010; Yesuf et al., 2014) investigated AGN activity relative to the integrated stellar populations of local galaxies and suggested that AGNs become stronger after the stellar populations reach a few 100 Myr old.
Quasars with massive poststarburst hosts may also represent a vital intermediate phase before total star formation quenching, and may provide insight on the connection between AGNs and starbursts. Various observations lend support for the evolutionary scenario from ULIRGs to quasars to dead ellipticals (e.g., Sanders et al., 1988; Magnelli et al., 2011; Murphy et al., 2011). A significant fraction of advanced merger (U)LIRGs (Guo et al. 2016 ) are obscured transiting post-starburst galaxies (see Yesuf et al., 2014),, which are the starting point of the fast evolutionary track.
The host galaxies of luminous AGNs are found to have intermediate-age stellar populations (e.g. Canalizo & Stockton, 2013; Matsuoka et al., 2015), which may correspond to the stage after gas-rich mergers in the merger driven co-evolutionary scenario. Zhang et al. (2016) found that the specific star formation rates (sSFRs) decrease from ULIRGs to obscured 2MASS quasars (Shi et al., 2014) to unobscured PG quasars. On the other hand, infrared bright QSOs and narrow-line Seyfert 1 (NLS1) galaxies are possibly in the early phase of the evolution from ULIRGs to dead ellipticals (Hao et al., 2005).
Post-starburst quasars (PSQs) simultaneously show the spectral signatures of quasars and post-starburst stellar populations (Brotherton et al., 1999). The observed spectra of PSQs show the power-law continuum and the broad emission lines, as well as strong Balmer absorption,characteristic of intermediate age stellar populations (Brotherton et al., 1999, 2002).
A small sample of luminous PSQs, spectroscopically selected from the SDSS at z 0.3 , was investigated in detailed using HST/ACS F606W imaging (Cales et al. 2011 ), high S/N Keck and KPNO optical spectroscopy (Cales et al., 2013, hereafter C13) and Spitzer mid-infrared spectroscopy (Wei et al., 2013).. The selection criteria of this PSQs sample used the Balmer absorption lines and the Balmer break of the quasar spectra in order to identify the post-starburst signatures.
These aforementioned studies found that PSQs have a heterogeneous host population with different stellar properties (starburst mass and age) and AGN properties (SMBH mass and Eddington fractions). They concluded that the PSQs with early-type hosts likely evolved via major mergers, while those with spiral hosts were triggered by secular processes. In this work, we compile a large sample of PSQs based on careful AGN-host decomposition. Large samples of post-starburst quasars, covering large areas, have not yet been identified before . In the rest of this section we briefly review works relevant to post-starbursts quasars.
Kauffmann et al. (2003b) found that a significant fraction of high-luminosity type 2 AGN have experienced a starburst in the recent past. Likewise, Goto (2006) identified 840 type 2 AGNs with post-starburst hosts from the SDSS, and found that the fraction of post-starburst type 2 AGNs is at least 4.2% of all galaxies in their sample.
Similarly, Matsuoka et al. (2015) identified 191 type 1 quasars at z 1 using high Signal-to-noise ratio (SNR) optical spectra from the 7 deg2 field of the SDSS Reverberation Mapping (RM) project. They derived host stellar properties such as age and mass, and found that half of the quasars in this sample show post-starburst signatures.
Melnick et al. (2015) compiled a sample of 72 nearby PSQs from the SDSS DR7Q catalog. Unlike Matsuoka et al. (2015), who used a spectral decomposition and measured EW(H), Melnick et al. (2015) directly measured the EW(H) from the observed quasar spectra without estimating the dilution of this absorption line by the corresponding quasar emission line. In addition, their lenient (EW(H) ) cut cannot reject large number of quasars which are hosted by normal star-forming galaxies.
This work is different from preceding works for the following reasons: 1) Our work focuses on the post-starburst quasars, which are brighter than mag. In contrast, several large sample studies only focused on post starburst hosts of the low-luminosity type 2 AGNs (cf. Kauffmann et al., 2003b; Goto, 2006; Yesuf et al., 2014). 2) We use the spectral decomposition analysis of our spectra to account for the dilution of post-starburst features by the AGN component. Several previous investigations did not include such analysis (cf. Cales et al., 2011, 2013; Melnick et al., 2015). 3) We applied a stricter criterion of (EW(H) ) to select the pure post-starburst hosts with larger post-starburst stellar populations fractions and effectively reject the normal star-forming hosts (cf. Goto, 2006; Melnick et al., 2015). 4) The parent sample of this work has larger areal coverage than that of SDSSRM quasar sample (cf. Matsuoka et al., 2015). Our spectral decomposition method is similar to that of Matsuoka et al. (2015).
Our sample of quasars and the selection criteria for PSQs are described in subsection 2.1. Details of the spectral fitting method are explained in subsection 2.2. We test our method in subsection A.1. Results and discussion are given in section 3 & 4. At last, we summarize our results in section 5. We will discuss a more detailed study of the properties of PSQs in a subsequent paper. We adopt cosmological parameters , , and throughout this paper.
2 Sample Selection and Fitting Method
For our sample of PSQs, we begin with the SDSS DR7 Quasar Catalog (DR7Q, Schneider et al., 2010), which consists of the 105,783 SDSS quasars with mag and at least one broad optical emission line with . The absolute magnitude limit in DR7Q catalog was calculated by correcting the BEST i-band PSF magnitude measurement for Galactic extinction (using the maps of Schlegel et al. 1998) and assuming that the quasar spectral energy distribution in the ultraviolet-optical can be represented by a power-law with (see details in Schneider et al., 2010).
Our PSQ sample inherits this absolute magnitude cut from the parent DR7Q sample. This absolute magnitude cut is close to the classical quasar threshold (Schmidt & Green 1983), which corresponds to (Matsuoka et al., 2015). However, both AGN and host can contribute to the i-band PSF luminosity. For an observed PSQ spectrum, the fraction of light contributed by the host galaxy must be large enough to show their spectral signatures. Due to this compound nature of PSQs, this absolute magnitude cut () means our sample is not complete down to a specific AGN luminosity or a stellar population luminosity.
2.1 Sample selection
Strong Balmer absorption arises in galaxies that experienced a recent burst of star formation triggered Gyr previously with subsequent rapidly quenching. After a major starburst epoch has ceased, the aging population of the starburst will produce a characteristic post-starburst spectral signature with strong Balmer lines in absorption. The EW of the H absorption line, one of the star-formation history indicators, allows us to constrain mean stellar ages of galaxies and the fractional stellar mass formed in bursts over the past few 100 Myr.
However, unlike the selection of post-starburst galaxies or post-starburst type 2 AGNs, a selection criterion based on the Balmer absorption line of observed quasar spectral depends both on the age of the stellar populations as well as the amount of quasar dilution. Hence, for the most reliable measurements of the host components (H), it is important to apply spectral decomposition methods.
The initial selection criteria for the spectra for which we apply spectral decomposition are:
-
•
10
-
•
z 0.5
-
•
EW(H)
is the continuum signal-to-noise ratio between the rest-wavelengths of 4150 and 4250 Å. This S/N criterion requires that spectra have enough S/N to decompose robustly, and approximately corresponds to .
We limit the redshift range to z 0.5 and reject higher redshift quasars because they have luminous AGN contributions and weak stellar features, making them hard to decompose. That is also the reason why we did not use a later SDSS data release, which mainly focus on high-luminosity, high-redshift quasars. For example, a z = 0.5 quasar with (i.e. ) has an absolute magnitude . If the host is a massive galaxy with , there is only 25% light contributed by the host which is only 2.5 times the noise.
The EW(H) used for this initial step is the direct measurement of the total observed quasar spectrum. EW(H) ensures that the broad Balmer emission line from the quasar BLR is not too strong to hide the Balmer absorption line from the host.
There are 1682 quasar spectra that satisfy the above criteria in the SDSS DR7Q catalog. We performed fitting and decomposition (see next section) of the spectra of those quasars. We exclude 438 objects with the fraction of light contributed by AGN () larger than 75%, because the light contributed by the host may be comparable to the noise, which makes the spectral fitting results unreliable. After a careful check by eye, 80% (987/1244) spectra have successful spectral fitting and decomposition.
For classification as a post-starburst quasar, one additional criterion from the decomposition result below has to be fulfilled: EW(H) . According to the tests in appendix A, EW(H) is the most robust parameter of the host component that we can recover with our spectral decomposition. It is pointed out that, although our decomposition provides quantitative measurements of mean stellar age, in the rest of this paper we use EW(H) as the primary diagnostic parameter.
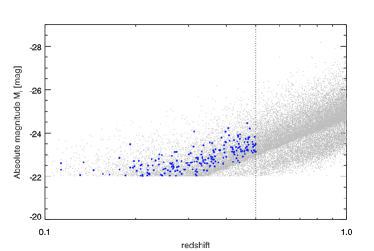
We found that about 21% of the objects (208 out of 987) have rest-frame equivalent withs of H greater than 6Å in absorption, which is the final PSQs sample as listed in Table 1. Figure 2 displays the distribution of their redshifts and absolute magnitudes in SDSS i band (). Our PSQ fraction is significantly higher than the 4.2% post-starburst AGNs studied by Goto (2006) in a volume-limited sample of SDSS galaxies, where they derive the fraction of all AGN with strong H in absorption, while our sample is restricted to objects classified as quasars (fAGN 75%). In our sample, 25 PSQs meet the criteria of Melnick et al. (2015), and 6 PSQs are in the 38 PSQs sample of Cales et al. (2013).
Kauffmann et al. (2003b) find that 95% of galaxies with EW(H) have experienced a burst with a mass fraction greater than 5% during the last 2 Gyr. If using a more relaxed H absorption criterion (i.e. EW(H) Å), it is difficult to distinguish post-starbursts from normal star-forming galaxies with constant SFR. Therefore, the selection post-starburst galaxies also uses a limit on nebular emission to restrict the amount of on-going star formation. However, Falkenberg et al. (2009) found this approach to be too narrow to cover the full range in post-starburst populations. Recent investigations (e.g., Wild et al., 2009; Yesuf et al., 2014) have identified the precursors of post-starburst galaxies have shown that AGNs are more common in these objects but that there is a significant time lag between the starburst and the AGN phase. In fact, while requiring nebular lines to be weak only identifies objects in the quenched post-starburst (Yesuf et al., 2014, QPSB) phase, but overlooks the quenching post-starburst galaxies in transit between the starburst stage and the fully QPSB stage Furthermore, limits on nebular emissions also exclude any post-starburst galaxies hosting AGNs since AGNs can power nebular emission lines. Given these issues, the non-negligible number of AGNs found in post-starburst galaxies should cause us to reconsider the relative importance of the presence of an AGN in post-starbursts. We should not be too surprised that only 1% of all galaxies are quenched post-starbursts galaxies (Wong et al., 2012), because of the underestimation of the transiting post-starbursts with ongoing star formation or AGN activity .
We therefore did not place limits on [OII] or H emission. The only constraint we used is that the equivalent width of H in absorption is EW(H) 6 Å. It ensures that high A-star fraction in the stellar population dominating the luminosity. This is similar to Yesuf et al. (2014) who invented plausible criteria for identifying transiting post-starbursts, as well as Bergvall et al. (2016). There may be some more contemporary starburst in our PSQs without limits on the [OII] or H lines. From the figure 6 of Kauffmann et al. (2003a), we can see there still exist starburst components at EW(H) . In future work, we will use [OII]/[OIII] to gauge the ionization level, and use mid-infrared data and the SED of PSQ to estimate the SFRs of PSQs, and to determine the fraction of starbursts in our sample.
| SDSS DR7 NAME | RA (2000) | DEC (2000) | fAGN | H | H | |||
|---|---|---|---|---|---|---|---|---|
| (deg) | (deg) | (mag) | (mag) | (Å) | (Å) | |||
| (1) | (2) | (3) | (4) | (5) | (6) | (7) | (8) | (9) |
| 000104.92+160101.2 | 0.27 | 16.02 | 0.45 | 18.97 | -23.36 | 0.60 | 0.71 | 6.21 |
| 002815.78+004247.5 | 7.07 | 0.71 | 0.31 | 18.27 | -23.30 | 0.39 | 5.93 | 9.45 |
| 002959.03+150817.2 | 7.50 | 15.14 | 0.21 | 18.04 | -22.40 | 0.57 | 0.00 | 7.52 |
| 021652.47-002335.3 | 34.22 | -0.39 | 0.30 | 18.29 | -23.31 | 0.53 | -1.24 | 7.66 |
| 031715.10-073822.3 | 49.31 | -7.64 | 0.27 | 18.32 | -22.93 | 0.51 | 0.74 | 8.32 |
| 032628.53-002741.4 | 51.62 | -0.46 | 0.45 | 18.75 | -23.72 | 0.65 | 0.90 | 8.50 |
| 072837.76+443646.0 | 112.16 | 44.61 | 0.28 | 18.35 | -23.07 | 0.27 | 2.66 | 6.92 |
| 074310.24+461014.5 | 115.79 | 46.17 | 0.27 | 17.99 | -23.32 | 0.21 | 2.65 | 6.38 |
| 074621.06+335040.7 | 116.59 | 33.84 | 0.28 | 18.08 | -23.26 | 0.23 | 3.54 | 6.66 |
| 074844.87+441422.0 | 117.19 | 44.24 | 0.43 | 18.72 | -23.51 | 0.41 | 4.40 | 9.17 |
| … |
Note. — This table is available in its entirety in a machine-readable form in the online journal. A portion is shown here for guidance regarding its form and content.
2.2 Spectral-fitting method
In order to disentangle the AGN contribution from that of the host galaxy, we performed a spectral fitting and decomposition. We utilized the IDL MPFIT to model the host stellar populations and AGN contributions to the DR7 SDSS spectra. The minimization technique of MPFIT simultaneously models multiple components:
| (1) |
is the observed spectrum. denotes the UV and optical iron emission line blends, which are modeled using the UV and optical Fe II templates derived from I Zw 1 (Vestergaard & Wilkes, 2001; Boroson & Green, 1992). We convolved a Gaussian of width with the Fe II templates to simulate different velocity widths. represents the templates of Balmer emission lines and Balmer continuum broadened by convolving with a Lorentzian of width with a specific Balmer decrement. The AGN power-low continuum is assumed to be . The slope is assumed to extend from 2.5 to 0, which approximately reproduces the observed range (Shen et al., 2011). Finally, represents the starlight component modeled by the 6 Simple Stellar Populations templates with the solar metallicity and different age (30 Myr, 100 Myr, 300 Myr, 1 Gyr, 3 Gyr and 10 Gyr), which had been built up from the spectral template library of (Bruzual & Charlot, 2003, hereafter BC03). These were broadened by convolving the spectra with a Gaussian of width to match the stellar velocity dispersion of the host galaxy.
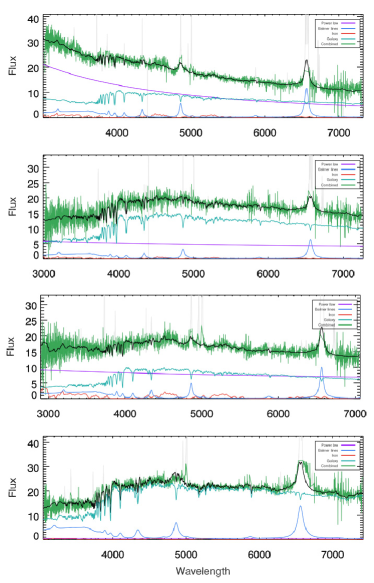
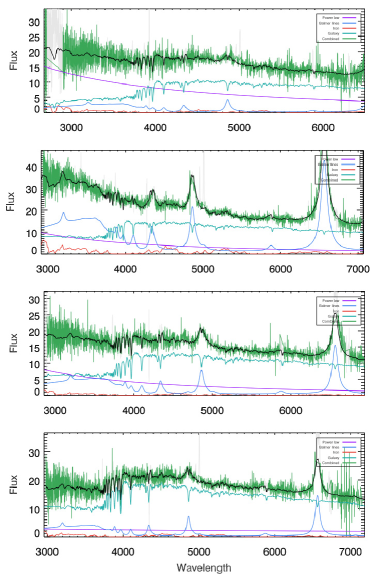
The fitting was performed by minimizing with , , , , , , , and being non-negative free parameters. We give plots of the run corresponding to the best fit of first eight objects as examples in Figure 1.
We note that we did not employ younger SSP templates (e.g., 30 Myr) because they may be degenerate with the quasar power-law continuum. We emphasize that we only use our fitting to approximately reconstruct the host spectra. This fitting does not do detailed modeling of the stellar populations of the hosts. A more sophisticated model may use more SSP templates of varying ages and metallicities than we did.
The narrow emission lines from the interstellar medium (ISM) and the AGN narrow-line region (NLR) are masked out during the fitting. Our default models do not incorporate the effects of dust extinction. The amount of intrinsic extinction observed in unobscured quasars is usually small (Richards et al., 2003; Hopkins et al., 2004; Salvato et al., 2009; Matute et al., 2012) and its effect is limited. For half of our sample, the rest-frame spectral range doesn’t cover blueward of the Mg II line, because of the redshift distribution of our sample. Hence we did not fit the Mg II line.
3 Results
We constructed a catalog of 208 PSQs. Most of them are identified as such for the first time here. We used spectral decomposition of AGN and stellar population of the host galaxies. We defined post-starbursts as host galaxies with EW(H) . Since we are interested in PSQs as a class as well as their typical characteristics, we derived composite optical spectra and composite SEDs.
3.1 Composite spectra of PSQs
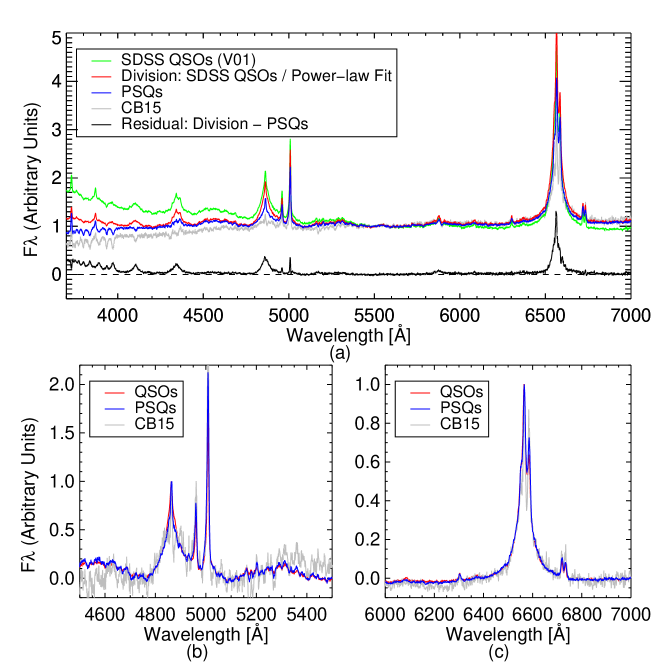
We computed the composite optical spectra of the total sample of 208 PSQs by rebinning the spectra to the rest frame using accurate redshifts, normalizing the spectra at rest-frame 5500Å, and applying a median stacking. A previous study (Cales & Brotherton, 2015, hereafter CB15) also created composite spectra of PSQs, but the AGN luminosity and post-starburst criteria are different between our sample and theirs. In Figure 3, we compare our composite spectrum of PSQs with that of SDSS QSOs (Vanden Berk et al., 2001, hereafter V01) and that of CB15.
Our PSQs spectrum has a relatively flat continuum compared to V01. In order to better compare our spectrum to the V01 spectrum, we normalized the V01 spectrum by dividing out its power-law continuum. Our spectrum is similar to the normalized V01 and CB15 spectra at the red end. At the blue end, we can see the obvious the Balmer high-order absorption lines in our PSQ spectrum similar to the spectrum of CB15, which shows the post-starburst characteristics, unlike V01 which only has Ca K absorption line. We can also see the Fe emission features in our spectrum. The H and H profiles are very similar to those of V01, which indicates that they have similar widths and asymmetries of broad Balmer emission, similar ratio of narrow Balmer line to broad Balmer line, and the ratio of SII to H.
3.2 Composite SED of PSQs
We also derived the composite SED of the PSQ sample, where the optical photometric data are from SDSS DR7, the near-ultraviolet (NUV) magnitudes are from the GALEX satellite (Martin et al., 2005), near-infrared magnitudes are from 2MASS, and the mid-infrared magnitudes are from WISE.
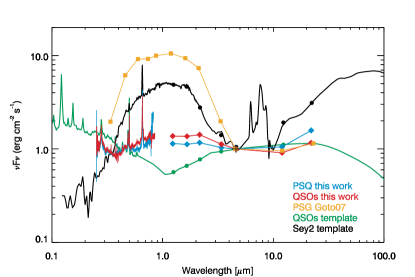
We created the composite SED of the PSQs by normalizing their spectra at rest-frame 4.6µm and applying a median combine at rest-frame wavelengths. We repeated the procedure for the quasar sample. In Figure 4, we show composite SED of PSQs and the SED templates of Seyferts 2, QSOs (SWIRE Template Library; Polletta et al. (2007)), and post-starburst galaxies (Goto, 2007).
It is clear that the PSQs lie between Seyfert 2 and QSO SEDs in the mid-infrared, especially between 3.4µm and 12µm where they are closer to QSOs. The bumps at optical and near-infrared wavelengths are due to a significant stellar fraction in our PSQs. The flat mid-infrared SED of post-starburst galaxies is very similar to our quasar and QSO templates, which can be fitted with a hot dust component plus an AGN model (Sajina et al., 2012). The 22µm excess of PSQs might correspond to the dust heated by young stars created during ongoing star formation.
4 Discussion
4.1 Modeling of composite SEDs
We performed the detailed modeling of the composite SEDs in Figure 4 with an AGN SED fitting code to determine the age of stellar component and the properties of the star-forming. The code is AGNfitter (Calistro Rivera et al., 2016), an open-source code allows the user to disentangle components responsible for their emission robustly through a fully Bayesian Markov Chain Monte Carlo algorithm to fit the SEDs of AGNs. A large library of theoretical, empirical, and semi-empirical models are used to characterize both the AGN and its host radiation simultaneously. Four physical radiation components constitute the model: stellar populations, cold dust in star-forming regions, an emitting accretion disk and a torus of hot dust surrounding the AGN. AGNfitter allows the user to derive the integrated luminosities, dust attenuation parameters, stellar masses, and SFRs, by calculating the posterior distributions of numerous parameters governing AGNs’ physics through a fully Bayesian treatment of errors and parameter degeneracies. We use the mean value of the probability density function (PDF) as the final value of each parameter (see Table 2), while the 16th and 84th percentiles of the distribution give the associated uncertainty.
| Type | PDF percentiles | Age | M⋆ | ||||
|---|---|---|---|---|---|---|---|
| (Gyr) | (log yr) | (log M⊙) | () | (M⊙) | |||
| (1) | (2) | (3) | (4) | (5) | (6) | (7) | |
| 16% | 1.83 | 7.96 | 10.32 | 40.74 | 0.00 | ||
| PSQs | 50% | 5.69 | 8.74 | 10.58 | 44.19 | 6.02 | |
| 84% | 12.02 | 9.21 | 10.82 | 44.59 | 15.12 | ||
| 16% | 3.47 | 8.80 | 10.74 | 40.22 | 0.00 | ||
| QSOs | 50% | 7.87 | 9.32 | 10.92 | 42.38 | 0.09 | |
| 84% | 12.11 | 9.64 | 11.05 | 44.28 | 7.46 |
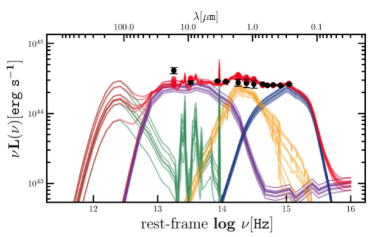
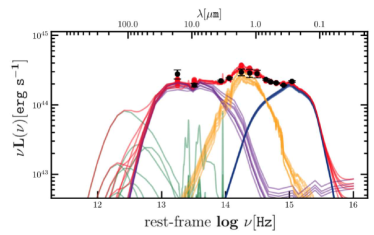
Figure 5 shows the composite SEDs and the AGNfitter fits. We scaled the composite SEDs to the median 4.6µm luminosity of the corresponding sample. The starburst (green), host galaxy (orange), the hot-dust emission (purple) and the “big-blue bump” (blue) components combine for the composite model (red), which is shown in the panels in Figure 5. We randomly pick eight different realizations from the posterior PDFs and over-plot the corresponding component SEDs in order to visualize the dynamic range of the parameter values included in the PDF. In the Table 2 and Figure 5, we can see our composite PSQ SED shows younger stellar age, shorter exponential star formation history (SFH) timescale , and higher specific star formation rates (sSFR; SFR/M⋆) than those of the QSOs sample. The fitting result of age 500 Myr supports that our PSQs sample have the intermediate-age hosts.
5 Summary
We constructed a catalog of 208 post-starburst quasars (PSQs) from the SDSS DR7 quasar catalog. The PSQs have H absorption equivalent width EW(H) greater than or equal to 6 , indicating that they contain large fraction of intermediate-aged stellar populations formed in a recent burst of star formation. Our catalog will be used to study the relationship between post-starburst quasars and normal quasars. In particular, in our future work, we will test the hypothesis that post-starburst quasars represent an important phase in the evolution of the massive galaxies and that supermassive black holes and their hosts co-evolve. To that end, we will study additional properties of the PSQs and their host galaxies such as their ages, stellar masses, SFRs, black hole masses and Eddington ratios.
Appendix A Appendix material
A.1 Mock spectra test
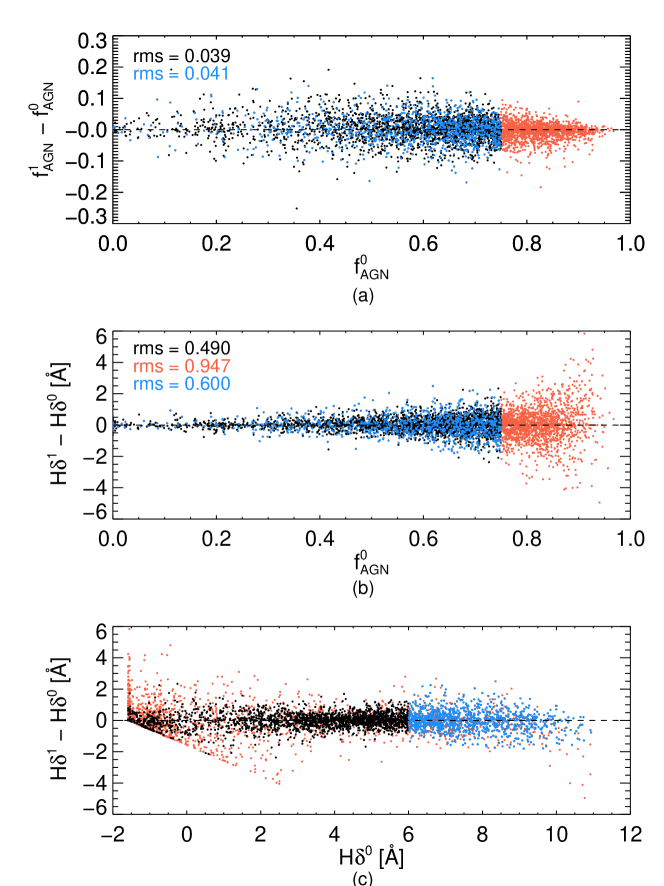
In order to evaluate the reliability of our method, we generated 5000 mock spectra by combining spectral models of quasar power-law continuum, Fe emission template, broad Balmer emissions and 6 SSPs host stellar population as described in subsection 2.2, and 10% random noise. We built a probability distribution function (PDF) of each input parameter by a linear interpolation of the measured distribution of that parameter. The fitting results of the free parameters are plotted in Figure 6. We found that the output best-fitting fAGN is reliable, and the scatter of EW(H) is not greater than 0.6Å until the AGN comes to dominate the spectral flux (fAGN). We therefore excluded the objects with fAGN which their host results are considered unreliable. In Figure A1 (c), there are some patterns in the the region between -2Å and 2Å. The reason is that when the Balmer absorption features are not obvious, e.g. the age of host is relatively old, our fitting result may reach the boundary value of -2Å. But this problem of an old age host does not affect the results of this investigation.
We also applied our spectral-fitting method for the sample of C13 to further test our method. Although our sample and theirs only partially overlap because the AGN luminosity and post-starburst criteria are different, we still obtained a tight correlation between our EW(H) measurements and the starburst ages of PSQs from C13 (see Figure 7), showing that our methods are at least consistent with this previous careful work.

References
- Bergvall et al. (2016) Bergvall, N., Marquart, T., Way, M. J., et al. 2016, A&A, 587, A72
- Boroson & Green (1992) Boroson, T. A., & Green, R. F. 1992, ApJS, 80, 109
- Bouwens et al. (2009) Bouwens, R. J., Illingworth, G. D., Franx, M., et al. 2009, ApJ, 705, 936
- Brotherton et al. (2002) Brotherton, M. S., Grabelsky, M., Canalizo, G., et al. 2002, PASP, 114, 593
- Brotherton et al. (1999) Brotherton, M. S., van Breugel, W., Stanford, S. A., et al. 1999, ApJ, 520, L87
- Bruzual & Charlot (2003) Bruzual, G., & Charlot, S. 2003, MNRAS, 344, 1000
- Cales & Brotherton (2015) Cales, S. L., & Brotherton, M. S. 2015, MNRAS, 449, 2374
- Cales et al. (2011) Cales, S. L., Brotherton, M. S., Shang, Z., et al. 2011, ApJ, 741, 106
- Cales et al. (2013) —. 2013, ApJ, 762, 90
- Calistro Rivera et al. (2016) Calistro Rivera, G., Lusso, E., Hennawi, J. F., & Hogg, D. W. 2016, ApJ, 833, 98
- Canalizo & Stockton (2013) Canalizo, G., & Stockton, A. 2013, ApJ, 772, 132
- Davies (2007) Davies, R. I. 2007, MNRAS, 375, 1099
- Fabian (2012) Fabian, A. C. 2012, ARA&A, 50, 455
- Falkenberg et al. (2009) Falkenberg, M. A., Kotulla, R., & Fritze, U. 2009, MNRAS, 397, 1940
- Goto (2006) Goto, T. 2006, MNRAS, 369, 1765
- Goto (2007) —. 2007, MNRAS, 381, 187
- Hao et al. (2005) Hao, C. N., Xia, X. Y., Mao, S., Wu, H., & Deng, Z. G. 2005, ApJ, 625, 78
- Hopkins et al. (2004) Hopkins, P. F., Strauss, M. A., Hall, P. B., et al. 2004, AJ, 128, 1112
- Kauffmann et al. (2003a) Kauffmann, G., Heckman, T. M., White, S. D. M., et al. 2003a, MNRAS, 341, 33
- Kauffmann et al. (2003b) Kauffmann, G., Heckman, T. M., Tremonti, C., et al. 2003b, MNRAS, 346, 1055
- Kormendy & Richstone (1995) Kormendy, J., & Richstone, D. 1995, ARA&A, 33, 581
- Magnelli et al. (2011) Magnelli, B., Elbaz, D., Chary, R. R., et al. 2011, A&A, 528, A35
- Martin et al. (2005) Martin, D. C., Fanson, J., Schiminovich, D., et al. 2005, ApJ, 619, L1
- Matsuoka et al. (2015) Matsuoka, Y., Strauss, M. A., Shen, Y., et al. 2015, ApJ, 811, 91
- Matute et al. (2012) Matute, I., Márquez, I., Masegosa, J., et al. 2012, A&A, 542, A20
- Melnick et al. (2015) Melnick, J., Telles, E., De Propris, R., & Chu, Z.-H. 2015, A&A, 582, A37
- Murphy et al. (2011) Murphy, E. J., Chary, R.-R., Dickinson, M., et al. 2011, ApJ, 732, 126
- Polletta et al. (2007) Polletta, M., Tajer, M., Maraschi, L., et al. 2007, ApJ, 663, 81
- Richards et al. (2003) Richards, G. T., Hall, P. B., Vanden Berk, D. E., et al. 2003, AJ, 126, 1131
- Sajina et al. (2012) Sajina, A., Yan, L., Fadda, D., Dasyra, K., & Huynh, M. 2012, ApJ, 757, 13
- Salvato et al. (2009) Salvato, M., Hasinger, G., Ilbert, O., et al. 2009, ApJ, 690, 1250
- Sanders et al. (1988) Sanders, D. B., Soifer, B. T., Elias, J. H., Neugebauer, G., & Matthews, K. 1988, ApJ, 328, L35
- Schawinski et al. (2009) Schawinski, K., Virani, S., Simmons, B., et al. 2009, ApJ, 692, L19
- Schneider et al. (2010) Schneider, D. P., Richards, G. T., Hall, P. B., et al. 2010, AJ, 139, 2360
- Shen et al. (2011) Shen, Y., Richards, G. T., Strauss, M. A., et al. 2011, ApJS, 194, 45
- Shi et al. (2014) Shi, Y., Rieke, G. H., Ogle, P. M., Su, K. Y. L., & Balog, Z. 2014, ApJS, 214, 23
- Treister et al. (2012) Treister, E., Schawinski, K., Urry, C. M., & Simmons, B. D. 2012, ApJ, 758, L39
- Vanden Berk et al. (2001) Vanden Berk, D. E., Richards, G. T., Bauer, A., et al. 2001, AJ, 122, 549
- Vestergaard & Wilkes (2001) Vestergaard, M., & Wilkes, B. J. 2001, ApJS, 134, 1
- Wei et al. (2013) Wei, P., Shang, Z., Brotherton, M. S., et al. 2013, ApJ, 772, 28
- Wild et al. (2010) Wild, V., Heckman, T., & Charlot, S. 2010, MNRAS, 405, 933
- Wild et al. (2009) Wild, V., Walcher, C. J., Johansson, P. H., et al. 2009, MNRAS, 395, 144
- Wong et al. (2012) Wong, O. I., Schawinski, K., Kaviraj, S., et al. 2012, MNRAS, 420, 1684
- Yesuf et al. (2014) Yesuf, H. M., Faber, S. M., Trump, J. R., et al. 2014, ApJ, 792, 84
- Zhang et al. (2016) Zhang, Z., Shi, Y., Rieke, G. H., et al. 2016, ApJ, 819, L27