Translucent windows: how uncertainty in competitive interactions impacts detection of community pattern
Abstract
Trait variation and similarity among coexisting species can provide a window into the mechanisms that maintain their coexistence. Recent theoretical explorations suggest that competitive interactions will lead to groups, or clusters, of species with similar traits. However, theoretical predictions typically assume complete knowledge of the map between competition and measured traits. These assumptions limit the plausible application of these patterns for inferring competitive interactions in nature. Here we relax these restrictions and find that the clustering pattern is robust to contributions of unknown or unobserved niche axes. However, it may not be visible unless measured traits are close proxies for niche strategies. We conclude that patterns along single niche axes may reveal properties of interspecific competition in nature, but detecting these patterns requires natural history expertise firmly tying traits to niches.
Keywords: Community structure, Competition, Functional traits, Noise, Uncertainty, Self-organized similarity, Species clusters, Trait pattern
Corresponding author: Rafael D’Andrea, rdandrea@illinois.edu, (631) 645-5710, 172 Morrill Hall 505 S Goodwin Ave, Urbana, IL, 61801
Data accessibility statement: This study made use of simulations. The code to generate and analyze the data is available on GitHub, https://github.com/rafaeldandrea/Translucent-windows-2018-code.
Statement of Authorship: RD, AO, and JD conceived the study. RD performed modeling work and analyzed output data. RD wrote the first draft of the manuscript, and all authors contributed substantially to revisions.
This is the peer reviewed version of the following article: “Translucent windows: how uncertainty in competitive interactions impacts detection of community pattern”, which has been accepted for publication at Ecology Letters, DOI: 10.1111/ele.12946. This article may be used for non-commercial purposes in accordance with Wiley Terms and Conditions for Self-Archiving.
Introduction
How does competition shape the distribution of species traits in nature? The classic answer, based on the idea that similarity breeds competition, is that coexisting species will be more different than expected by chance (MacArthur and Levins,, 1967; Abrams,, 1983). Although intuitive, this prediction of limiting similarity lacks widespread empirical support (Chase and Leibold,, 2003; Götzenberger et al.,, 2012) despite extensive research (D’Andrea and Ostling,, 2016). Recent studies have found that trait-mediated competition can actually lead to the emergence of clusters, or groups of similar species (Bonsall et al.,, 2004; Scheffer and van Nes,, 2006; Hernández-García et al.,, 2009; Sakavara et al.,, 2018). Although contradictory on the surface, clusters are a natural extension of limiting similarity. If left alone, competitive sorting culminates in maximally differentiated species, each occupying a niche. But an influx of new individuals and species due to speciation or immigration may keep the number of extant species above the number of local niches (D’Andrea et al.,, 2018). In that case, species whose traits place them near a niche will persist longer (Scranton and Vasseur,, 2016; D’Andrea and Ostling,, 2017), and species in between are quickly excluded as they are not well adapted to any niche (Barabás et al.,, 2013; Vergnon et al.,, 2013). The incorporation of species clusters to traditional trait-pattern theory may help explain the mixed evidence for limiting similarity, and may help understand coexistence in species-rich systems such as tropical forests.
Nevertheless, clusters are not a widely observed phenomenon in nature outside specific communities (Scheffer and van Nes,, 2006; Scheffer et al.,, 2015; Segura et al.,, 2011, 2013; Vergnon et al.,, 2009; Yan et al.,, 2012). While this can in part be due to clusters having only recently been connected with competition in the theoretical literature (D’Andrea and Ostling,, 2016), it is not clear that clusters should occur outside idealized models. Theoretical studies typically make two critical assumptions that do not hold in real communities, thus limiting their applicability. First, they assume that species can be arranged on a line such that distances between their relative positions on the line determine how strongly they compete with one another (MacArthur and Levins,, 1967). In reality, it is unlikely that positions along a single line can fully predict the degree of competition. For example, birds that eat very distinct foods may still compete strongly for nesting sites, or may be under apparent competition because they share predators or parasites. Knowledge of the birds’ diets will predict degree of competition better than chance, but the relationship will appear noisy because of the contribution of these other factors. In this study we will refer to the line as a niche axis, such that separation on that axis predicts the degree of competition between species. From the vantage point of the food-niche axis, the unknown contributions of the nesting site axis, predator axis, etc loosen the link between diet and competition. While there is theoretical evidence that multidimensional niche space may cause multidimensional niche clustering (Fort et al.,, 2010), it is unclear whether any pattern should be expected along a single niche axis in the presence of these other unobserved factors.
The second assumption is that measurable traits such as body size and leaf tissue density are actual niche axes, so patterns driven by competition should be visible as patterns in the distribution of these traits. However, there is a conceptual distinction between aspects of phenotype directly responsible for competitive interactions and aspects of phenotype that are typically measured. The former may form niche axes, but are unlikely to perfectly coincide with easily measurable morphological or physiological traits (Appendix A). At best, measured functional traits are good predictors of the true causes of competitive interactions (McGill et al.,, 2006; Violle et al.,, 2007), but that map is inevitably noisy. For example, consider plant strategies regarding light capture and shade tolerance, or the “light-niche” axis. Leaf tissue density correlates with shade tolerance in forests, but will not fully predict the light-niche because the latter is also affected by many other plant traits, such as maximum plant height and wood density (Wright et al.,, 2010). Pattern in the distribution of light strategies across species will translate into pattern in the distribution of leaf tissue density only to the extent that the latter reflects the former.
Little is known about how this inevitable uncertainty might affect our ability to detect pattern in nature (Fig. 1). If the clusters predicted by theory are robust to uncertainty, then they are useful for diagnosing competition based on overlap in niche strategies. But if measuring an incomplete or inaccurate set of traits means we are unlikely to detect clusters, then there is little value in searching for them in nature.
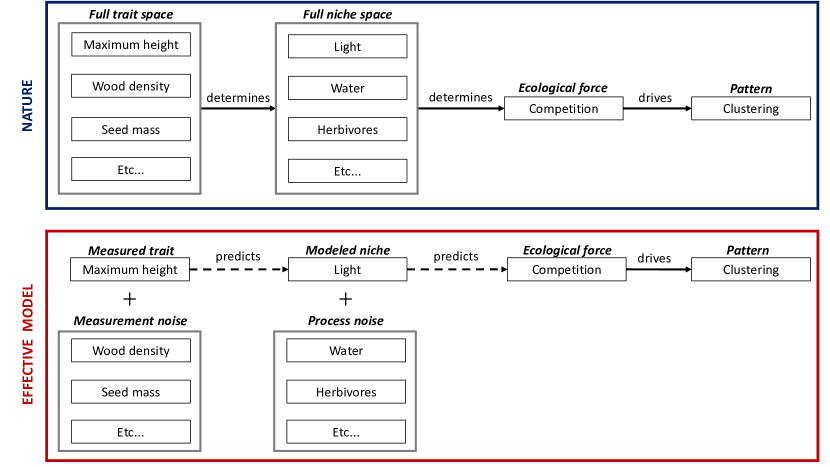
Here we test this robustness. We start by asking what happens when only one of the niche axes responsible for competitive interactions is fully known. We find that pattern on one niche axis is surprisingly robust to the contributions of other niche axes. Next we ask whether this niche pattern translates well into trait pattern, given that traits are imperfect predictors of niches. We find that the pattern is quite sensitive to this error, and its detectability quickly fades as we loosen the link between niche axis and measured trait. We then show that measuring multiple traits can provide more accurate estimates and thus reduce measurement noise, but ultimately a tight functional relation between traits and niche strategies is key.
Materials and Methods
Niche dynamics
Many ecological communities consist of multiple species competing for resources, and often these resources are thought of as falling on a continuous gradient. One such example is seed-eating birds that may feed on seeds of various sizes. The species niche reflects its resource preferences within the gradient, so that similarity in niche values denotes the amount of overlap between those strategies (MacArthur and Levins,, 1967; Leimar et al.,, 2013).
We represent this scenario using a Lotka-Volterra model of competitive dynamics.
where are the abundance, intrinsic (maximal) growth rate, and carrying capacity of species , and the competition coefficients quantify the per-capita competitive impact of species on species . Steady immigration maintains all abundances above zero.
We use species in our simulations, and let species differ only by niche strategy, affecting . We set parameters , , and immigrating individuals per species per year, identical across all species. These parameter choices lead to equilibrium community sizes between 600 and 35,000 individuals. As a reference point, the 50-hectare forest plot in Barro Colorado Island has approximately 300 species, 20,000 trees, and an estimated immigration event per birth (Hubbell,, 2001). We verified that our results are robust to a four-fold change in immigration rates. All simulations are performed using library deSolve in the R language (R Core Team,, 2017).
Competition coefficients—the kernel
We will refer to the matrix of competition coefficients as the competition kernel, by analogy with continuous formulations. We set
where is the distance in niche space between species and , and the scaling factor is some constant. This quartic function is a generic monotonic shape commonly used in competition models (Pigolotti et al.,, 2010; Leimar et al.,, 2013). A plot of this function reveals two distinct zones: a plateau of intense competition between similar species, and a steep drop-off beyond a threshold niche distance (Fig. S3A). We refer to the inner region as the “core” of the kernel, and the outer region as its “tail”. As we will show, this core-tail structure is instrumental in pattern-formation. The threshold distance is somewhat arbitrary, and here we take it to be the niche distance where the kernel is equal to its mean value. Other choices do not qualitatively change our results.
Process noise: competition in two-dimensional niche space
Consider a case where competitive interactions are collectively determined by species strategies along two niche axes, e.g. two different types of resources such as food and nesting sites, or two different types of food such as seeds and insects. Suppose also we only have access to one such axis. The contributions of the unknown niche axis add randomness (i.e. noise) to the otherwise monotonic relationship between competition kernel and niche differences on the known axis (Fig. 2). We call this process noise.
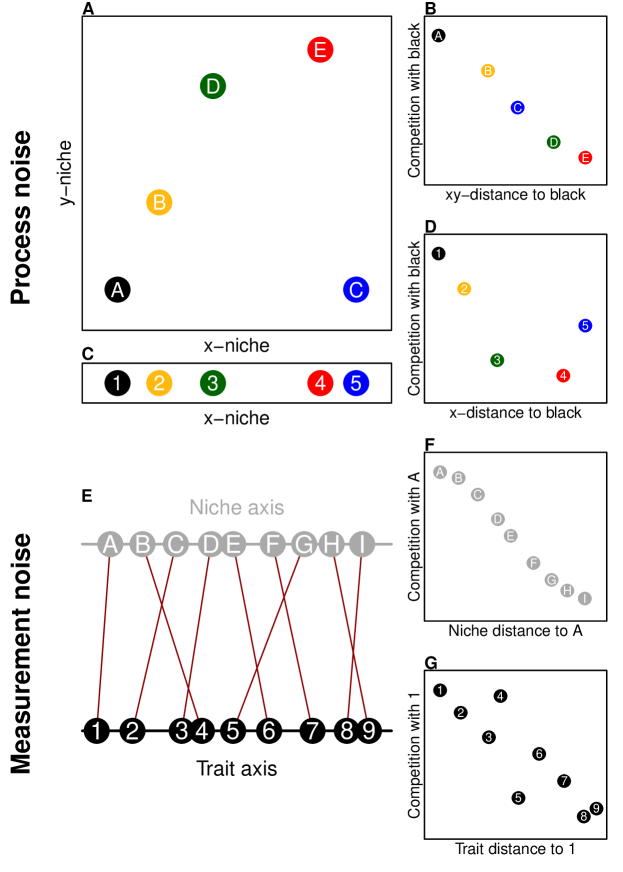
Two different niche axes can interact in various ways to determine niche overlap (Holt,, 1987). For example, the two niche axes may reflect strategies for acquiring complementary resources. In this case, similarity on one niche axis (e.g. similar preferences in insect prey) can be compensated via differences along the other axis (foraging for very different seeds). Alternatively, the niche axes may represent fundamentally different needs such as food and nesting sites for birds, or water and light for plants. In this case, no amount of niche differences on one axis can compensate for similarity on the other. We term these scenarios complementary and essential niche axes, respectively.
In our model, these different scenarios define the two-dimensional niche separation between species. In the case of complementary niche axes, we set
where () is the x-niche strategy of species (), which can range from 0 to 1, is a scaling factor that weighs the x-niche difference relative to the y-niche difference, and vice-versa for y-based parameters. Notice that if niche differences on either axis are large, will be large, and therefore the competition coefficient will be small, regardless of differences on the other.
In the essential niche axes case, we set
In this case, will be small if either the x- or y-niche separation is small, regardless of how large the other niche separation may be. Here species cannot compensate for similarity on one axis by dissimilarity on another, and the limiting resource is the one for which they compete the most.
The constants and define the relative weight of each niche axis to the overall niche separation. In the complementary niche axes scenario, the y-contribution vanishes when is very large relative to , and dominates the coefficient when it is very small. In the essential niche axes scenario, the reverse is true. If we can measure the x-niche strategies of our species but have no access to the y-niche, we anticipate that pattern on the x-axis should be likely to the extent that the x-niche dominates competitive interactions—i.e. when the process noise from the perspective of the x-niche is sufficiently low. To quantify this, we fix , and test the x-axis for species clustering as we dial up or down.
Species x- and y-niche values are drawn from a uniform distribution between 0 and 1, with the latter being redrawn for every new run. We simulate 100 replicates of each scenario to ensure that results are robust. In each replicate we tune the scaling factor to ensure that the community-wide average intensity of competition is the same in all our simulations.
Lotka-Volterra equations approximate more complex dynamics near equilibrium (Schoener,, 1974, 1976), hence their widespread use in ecological theory. However, true consumer-resource interactions do not map trivially onto niche differences. We therefore tested our approach against models where species dynamics are explicitly based on their use of resources. Rather than prescribe the competition coefficients, we obtain them from simulation outcomes of the model, and then compare with distances in niche space. In Appendix B we present a resource-consumer model with two types of essential resources, such as different nutrients. The results confirm that the minimum niche distance is a good predictor of pairwise competitive impacts. In Appendix C we present a model of complementary niche axes: plants compete for space in a heterogeneous landscape, and high competition due to similar affinity for one environmental property (e.g. humidity) can be compensated by dissimilar affinities for another property (e.g. salinity). Results confirm that the Euclidean niche distance accurately predicts competitive interactions.
Measurement noise
Even if niche space consists of a single niche axis, niche axes are typically not directly measurable; traits are. Whether clustering on a niche axis (e.g. competence in acquiring and processing light) translates as clustering on a measurable trait axis (e.g. maximum height) depends on how close is the relation between the trait and the niche axis (Fig. 2). We call the noise in this relation measurement noise.
To examine the impact of this type of noise, here we assume a simpler niche space than above, consisting of a single niche axis. The niche axis fully determines competitive interactions (i.e. there is no process noise), and we now assume that competition coefficients are monotonically tied to niche differences. This leads to strong clustering along the niche axis.
Knowing that the niche axis is clustered, we want to assess the probability of clustering along a measurable trait axis, given that the trait is statistically associated with the niche. We then arrange species on a proxy trait axis such that trait values are random variables correlated with the niche values (Fig. 5A-D). Because of measurement noise, species relative positions on the niche axis will not be entirely preserved on the trait axis. As a result, competition will not be a strictly monotonic function of trait separation (Fig. 5E-H), and the clustered niche pattern will be somewhat randomized on the trait axis. Mathematically, we write , where is the trait value of species , is its niche value, and is the measurement noise between the two. The are normally distributed random variables with mean 0 and whose variance determines the magnitude of the noise. Note that trait noise does not affect species dynamics, as the noise here is at the level of how we measure species and not at the level of their interactions.
Using multiple traits to mitigate measurement noise
In nature, a single niche axis will correlate with multiple trait axes. For example, niche strategy regarding competition for light in forests will reflect on specific leaf area, leaf nitrogen content, twig length, maximum plant height, etc. Individually, each trait will be an imperfect predictor of the species’ light-related niche strategy, but together they may provide a better estimate. Combining multiple traits associated with the same niche axis may lead to a better estimate of the true niche values, and therefore clustering that is lost on any individual trait axis may appear on an aggregate axis.
We test this idea using a simulated set of proxy traits, and their first principal component as the aggregate axis. The trait value of species on trait axis () is a random variable linearly related to its niche value . We then write , where and are constants specific to trait axis and is the measurement noise, which is normally distributed with mean 0 and variance . This variance can be different for different trait axes, as the niche axis may be more tightly linked to some traits than others—e.g. the light-niche may be more directly influenced by maximum height than wood density.
Although we write the trait as a function of the niche, we are not assuming the latter determines the former, but merely that they are correlated (see discussion in Appendix E). We also distinguish between multidimensional niche space and the present scenario of a one-dimensional niche axis that maps to multiple traits. An example of the former is competition based on the combined overlap in strategies for capturing light and strategies for acquiring water, whereas an example of the latter is when the light-niche strategy fully determines competitive interactions (possibly because all species involved have identical strategies in all other niche axes), and maps to various traits such as maximum height and specific leaf area. Finally, we note that our multiple traits correlate with each other through their association with the niche strategy, as is common in nature (Litchman and Klausmeier,, 2008; Wright et al.,, 2010; Shoval et al.,, 2012), but we are assuming no further correlation between these traits. This leads to the best-case-scenario where every new trait adds maximal information about the niche; were there any further correlations between the traits, new traits added to the analysis could be partially predicted by the existing ones, and therefore we would gain less information by incorporating them.
Quantifying the noise
Without process or measurement noise, competition will be strong between similar species, and weak between dissimilar ones. We therefore quantify noise as the degree of departure from this ideal scenario. We do so using two summary statistics.
Spearman’s rank correlation coefficient, , quantifies the degree to which competition coefficients are monotonically related to pairwise distances on the niche or trait axis (McDonald,, 2009). The index ranges from (perfectly monotonic relationship) to 0 (no relationship).
As noted above, the kernel has a core (competition coefficients of species with small niche or trait differences) and a tail (large differences). We quantify the degree to which this core-tail structure predicts competitive relations by calculating the difference in proportion of tail and core elements that are greater than the kernel mean, . In the noise-free scenario, the first proportion is 0 and the second is 1, leading to a difference of , while in a completely random matrix both proportions are the same and the expected difference is 0.
As these metrics put both process and measurement noise in the same footing as degrees of kernel disorder, they allow comparison of the relative impact of each.
Quantifying clustering
To determine whether or not a species assemblage is clustered, we use a metric based on the k-means clustering algorithm and the gap statistic method (MacQueen,, 1967; Tibshirani et al.,, 2001). The metric takes into account the niche or trait values of each species as well as their abundances, and estimates the number of clusters that best fits our species assemblage by comparing each fit against randomized null assemblages. The fit itself is based on pairwise distances along the niche or trait axis between all species in the community, weighted by their abundances (we represent each species by its average niche/trait value). Upon comparing results between the assemblage of interest and the null assemblages, we obtain a z-score and a p-value, which tell us the degree to which the assemblage is clustered, and whether the result is statistically significant. We provide the mathematical details of the metric in Appendix F.
Results
Briefly, we found that the kernel’s core-tail structure is key for pattern emergence, and the clustering pattern is robust to a substantial amount of noise between competition and niche strategies (process noise). On the other hand, clustering is sensitive to noise between niche strategies and measured trait values (measurement noise); this is because measurement noise effectively reshuffles species along the axis, thus randomizing the community. Finally, a large set of functional traits may help circumvent the issue, as combined they serve as a more accurate window into the biological niche than an individual trait is likely to be.
Process noise
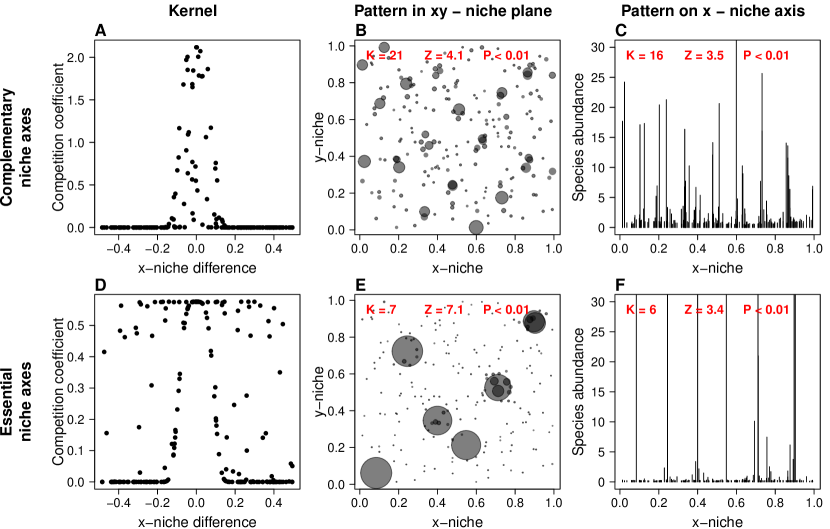
Fig. 3 shows an example of each kind of process noise. In the complementary niche axes case, the noise is concentrated in the core of the kernel (Fig. 3A). In other words, competition is consistently low at large x-niche distances, but noisy at small distances. This is because some species pairs at short x-niche distances are far apart on the y-niche axis, thus bringing down the competition coefficient which would otherwise be high. Our clustering metric confirms that species are distinctly clustered in the xy-niche plane (Fig. 3B), as expected. However, even when the y-niche dimension is lost, clustering is still visible on the x-niche axis (Fig. 3C). Some distinct clusters collapse onto each other with the loss of the y-dimension, leading to detection of a lower number of clusters, but the general clumpy structure is preserved despite the noise.
The essential niche axes scenario has the opposite type of noisy kernel (Fig. 3D): competition between species in the core is reliably high, while the tail is noisy because some species pairs that are far apart on the x-axis are close on the y-axis, bringing competition up. Again the xy-niche space is strongly clustered as expected (Fig. 3E), and again collapsing the y-dimension does not erase the clustering pattern, which is still visible from the x-niche axis alone (Fig. 3F).
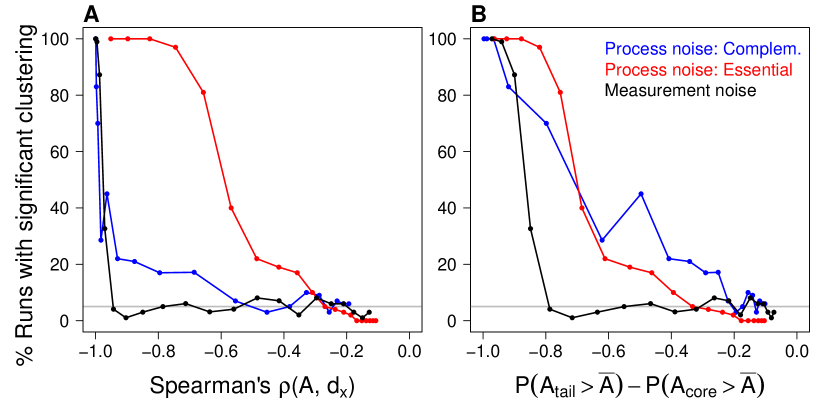
In both of these examples, the process noise onto the x-niche produced by the unacknowledged y-niche contributions is not sufficient to dissipate the pattern on the x-niche axis. However, as the contribution of the y-niche to the competitive relations increases, so does the process noise between the competition coefficients and distances on the x-niche axis, and the clustering on the x-axis weakens and eventually disappears (Fig. 4).
As the rank correlation between competition coefficients and niche differences degrades from (fully monotonic) to (no correlation), the probability of clustering declines (Fig. 4A). In the case of complementary niche axes the drop is fast, but only reaches background levels near . With essential resource axes, clustering remains very likely until , at which point it quickly falls off, but only drops to background levels near .
The strength of the core-tail structure in the kernel predicts clustering in the face of process noise reasonably well, whether the niche axes are complementary or essential (Fig. 4B). In both scenarios, that probability drops below 50% when (Fig. 4B).
In Appendix D we present a generalized process-noise model where we assume an indeterminate number of niche axes and other contributing factors adding noise to the relationship between competition and the known niche axis. We find similar results as the two-dimensional niche space model, indicating that higher niche dimensions add no qualitatively new phenomena.
These results indicate that even when niche space is multidimensional and part of it is unknown, we can expect clustering along a single niche axis to the extent that, on average, species with high niche similarity compete more than dissimilar species. A fully monotonic relationship between competition and niche difference is not strictly required.
Measurement noise
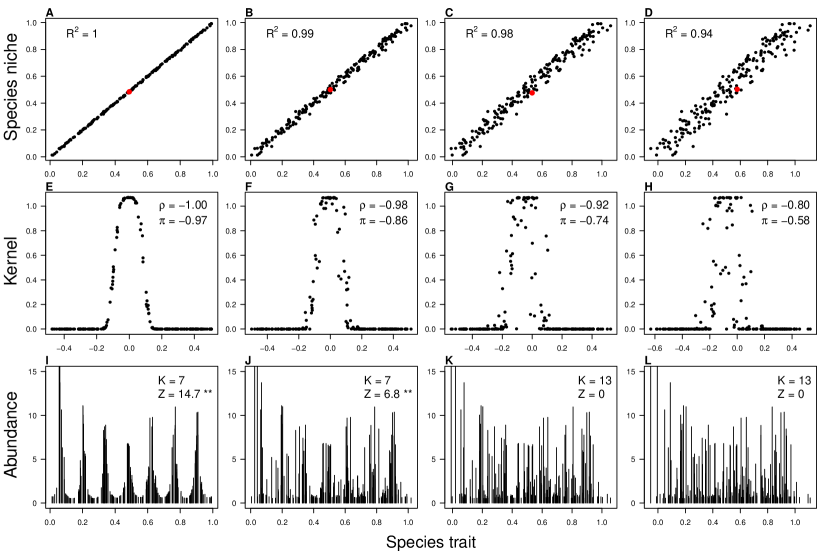
When the noise is between niche strategies and measured trait values (measurement noise), the probability of clustering on the trait axis quickly drops to zero; faster in fact than with noise between competition and niche strategies (process noise), as one can see by comparing the black curve to the colored curves in Fig. 4. A glance at the correspondence between niche and trait values (Fig. 5A-D), compared with the pattern on the trait axis (Fig. 5I-L), shows that the pattern quickly fades to oblivion even while the coefficient of determination between niche and trait values is still very high (). This occurs not because species are not sorting into clusters, but because our imperfect access to their true niche values misaligns them on the x-axis (Fig. 5I-L). In doing so, measurement noise effectively brings the species assemblage closer to the null model against which we compare it. Not only does statistical significance vanish, but the clustering metric also fails to recognize the true number of clusters (compare legend on Fig. 5I-L).
This bodes ill for the prospects of finding niche-assembly patterns in nature, as the exact aspects of phenotype responsible for interactions are unlikely to be known or knowable, and proxy traits will often be our best resource to estimate them (Appendix A).
We note that the plot of competition coefficients against trait differences (as opposed to niche differences) shows visible core-tail structure (Fig. 5E-H). Indeed, it resembles process noise with complementary niche axes (cf. Fig. 3A). And yet, the corresponding patterns are very different. A closer look reveals that the measurement-noise kernel is more structured than the core-noise kernel (Appendix G): unlike the process noise scenario, the matrix is symmetric and the noise is autocorrelated. In fact, the measurement-noise kernel contains the same set of elements as the noise-free kernel, and one can recover the latter via a permutation of the rows and columns of the former. We believe this non-random structure relative to the core-noise scenario is key to understanding the difference in the respective patterns, but at present we lack mathematical proof.
Using multiple traits to estimate niche values
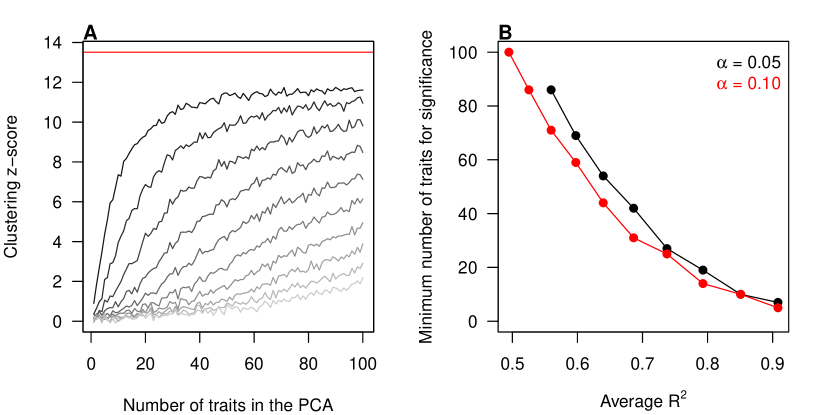
When multiple traits are related to the niche axis and are otherwise uncorrelated with each other, their first principal component is a better proxy for the niche axis than most of the individual traits. Other things being equal, clustering on the first component is stronger as more traits are used (Fig. 6A), reflecting the fact that the quality of the first component as a proxy for the niche axis increases with the number of traits measured. However, the number of traits required for statistically significant clustering on the first component can be very high. Even when the average between niche and trait values is as high as 0.9, we needed at least 5 traits for significant clustering at the level and 7 traits at the level. For lower , denoting looser ties between trait and niche levels, that minimum number quickly rises (Fig. 6B).
We note that although the first component is typically a better proxy than an individual trait axis, it will not necessarily be better than every single trait (see Fig. S5 in Appendix E). If one knows that a given trait is a much better proxy for species niche values than all other traits, it may be better to use that trait alone rather than to run principal component analysis on a set of traits. Realistically, however, such cases would be exceptional, as ecologists have only imperfect knowledge of the connection between measurable traits and niche strategies. Compared to traits with a moderate to high association with the niche axis, the first principal component has a higher chance of revealing niche pattern (Fig. S5); and the more traits, the higher that advantage. Of course, no number of traits is a substitute for high-quality traits, i.e. traits demonstrated to reflect species niche strategies. This is especially true given the high sensitivity of pattern to measurement noise, as seen above.
In general, the number of traits required for detecting pattern will depend on their relation with the niche, which may be more complicated than presented here. Our linear model illustrates how even in a simple case, many traits may be necessary to parse the pattern.
Discussion
Understanding how competition drives biodiversity patterns remains a challenge in ecology. The hypothesis of self-organized similarity or emergent neutrality (Scheffer and van Nes,, 2006; Holt,, 2006) states that competing species may sort into groups of species with similar traits. This concept may generalize classical limiting similarity theory (D’Andrea and Ostling,, 2016) and reconcile it with contrasting empirical findings (Chase and Leibold,, 2003; Götzenberger et al.,, 2012). However, the relevance of these ideas for field ecologists is limited by assumptions idealizing the connection between competition and niche strategies, and between niche strategies and measurable traits. Here we tested how uncertainty in these connections impacts the prospects of detecting the pattern in nature.
When we introduced noise in the link between competition and niches, we found considerable robustness. Clustering remains likely as long as the kernel has a distinctive core-tail structure. In other words, competition between species far apart on the niche axis must be on average lower than between those close together. That the required trend is statistical rather than strict makes clustering on a single niche axis a distinct possibility in nature, even when competition is the product of multiple niche axes. Of course, probing multiple niche axes will make any pattern even clearer as it should minimize process noise. However, this is not automatically achieved by measuring multiple traits. Trait space is constrained by traits’ roles in ecological performance (Shoval et al.,, 2012), and in fact a large set of traits may collapse into a single niche axis (Wright et al.,, 2004). To properly assess multidimensional niche space, one must use traits related to different niche dimensions. Knowledge of these dimensions and their relationship to traits requires natural history expertise. Absent that, process noise is inevitable.
In contrast, we found high sensitivity to measurement noise. This is because measurement noise randomizes species positions along the true niche axis. In doing so, it brings the data closer to the null model. One cannot connect the distribution of species along an axis to mechanism if that distribution is random. Therefore, to stand a chance at finding pattern one must keep measurement noise at a minimum. This requires a tight link between niche axes and the actual traits measured in field studies, such that the proxy traits provide high-accuracy estimates of species niche strategies. A large set of traits with a demonstrated role in niche strategies is better than a few traits with weak functional connections. Demonstrating such roles requires explicit theory (Pacala and Rees,, 1998; Kohyama,, 2006), and extensive empirical work (Violle et al.,, 2007; Litchman and Klausmeier,, 2008; Sterck et al.,, 2011; Herben and Goldberg,, 2014).
The kernel contains all information about species interactions, and hence holds the key to pattern. Mathematical proofs connect kernel and trait patterns in simpler models lacking noise (Hernández-García et al.,, 2009; Fort et al.,, 2009; Leimar et al.,, 2013). However, more general kernels are less amenable to analytical proofs, and as yet have only been studied via simulations. Our results indicate that core-tail kernel structure is critical for trait pattern, but a more complete theory predicting the pattern from the shape of the kernel is still missing. Providing a low-dimensional representation of the kernel that predicts pattern in realistic noisy systems remains an open challenge.
Our study is a step towards more realistic models of trait-based patterns of niche assembly. Our results complement previous explorations of trait-based niche patterns that considered other forms of noise such as demographic or environmental stochasticity (Tilman,, 2004; Gravel et al.,, 2006; Ernebjerg and Kishony,, 2011; D’Andrea et al.,, 2018). Attempts at higher realism would also require dedicated multidimensional niche models. Multidimensional niche space, despite having long been recognized as part and parcel of niche theory (May,, 1975; Tilman,, 1982; Holt,, 1987), remains understudied in theoretical ecology (but see Fort et al., 2010; Geange et al., 2011; Eklöf et al., 2013), and essentially untouched in the trait pattern literature. Finally, our models neglect non-competitive interactions, and require restorative forces such as immigration to replenish otherwise transient clusters. However, our results provide insight into the prospects of finding clusters in systems where both competition and dispersal are known to play a large role in community assembly, such as grasslands (Tilman,, 1994) and tropical forests (Vellend,, 2016).
To our knowledge, we are the first to examine how uncertainty about the drivers of species interactions impacts ecologists’ ability to detect their effect on community structure. Our findings highlight that theoretical results are only useful to field work when they are robust to uncertainty. More broadly, our work can initiate a more general picture of this robustness or lack thereof across different patterns and processes.
Acknowledgments
J.OD. acknowledges the Simons Foundation Grant #376199 and McDonnell Foundation Grant #220020439. A.O. acknowledges the National Science Foundation Grant #1038678, “Niche versus neutral structure in populations and communities” funded by the Advancing Theory in Biology program, the Danish National Research Foundation Grant #DNRF96 through support of the Center of Macroecology, Evolution and Climate, and the Miller Institute for Basic Research in Science at the University of California, Berkeley.
References
- Abrams, (1983) Abrams, P. (1983). The Theory of Limiting Similarity. Annual Review of Ecology and Systematics, 14(1):359–376.
- Barabás et al., (2013) Barabás, G., D’Andrea, R., Rael, R., Meszéna, G., and Ostling, A. M. (2013). Emergent Neutrality or Hidden Niches? Oikos, 122:1565–1572.
- Bonsall et al., (2004) Bonsall, M. B., Jansen, V. A. A., and Hassell, M. P. (2004). Life history trade-offs assemble ecological guilds. Science (New York, N.Y.), 306(5693):111–4.
- Chase and Leibold, (2003) Chase, J. M. and Leibold, M. (2003). Ecological Niches: Linking Classical and Contemporary Approaches. The University of Chicago Press.
- D’Andrea and Ostling, (2017) D’Andrea, R. and Ostling, A. (2017). Biodiversity maintenance may be lower under partial niche differentiation than under neutrality. Ecology, 98(12):3211–3218.
- D’Andrea and Ostling, (2016) D’Andrea, R. and Ostling, A. M. (2016). Challenges in linking trait patterns to niche differentiation. Oikos, 125(10):1369–1385.
- D’Andrea et al., (2018) D’Andrea, R., Riolo, M., and Ostling, A. M. (2018). Competition and immigration lead to clusters of similar species, not trait separation. bioRxiv, (doi: https://doi.org/10.1101/264606).
- Eklöf et al., (2013) Eklöf, A., Jacob, U., Kopp, J., Bosch, J., Castro-Urgal, R., Chacoff, N. P., Dalsgaard, B., de Sassi, C., Galetti, M., Guimarães, P. R., Lomáscolo, S. B., Martín González, A. M., Pizo, M. A., Rader, R., Rodrigo, A., Tylianakis, J. M., Vázquez, D. P., and Allesina, S. (2013). The dimensionality of ecological networks. Ecology Letters, 16(5):577–583.
- Ernebjerg and Kishony, (2011) Ernebjerg, M. and Kishony, R. (2011). Dynamic phenotypic clustering in noisy ecosystems. PLoS computational biology, 7(3):e1002017.
- Fort et al., (2009) Fort, H., Scheffer, M., and van Nes, E. H. (2009). The paradox of the clumps mathematically explained. Theoretical Ecology, 2(3):171–176.
- Fort et al., (2010) Fort, H., Scheffer, M., and van Nes, E. H. (2010). The clumping transition in niche competition: a robust critical phenomenon. Journal of Statistical Mechanics: Theory and Experiment, 2010(05):P05005.
- Geange et al., (2011) Geange, S. W., Pledger, S., Burns, K. C., and Shima, J. S. (2011). A unified analysis of niche overlap incorporating data of different types. Methods in Ecology and Evolution, 2(2):175–184.
- Götzenberger et al., (2012) Götzenberger, L., de Bello, F., Bråthen, K. A., Davison, J., Dubuis, A., Guisan, A., Lepš, J., Lindborg, R., Moora, M., Pärtel, M., Pellissier, L., Pottier, J., Vittoz, P., Zobel, K., and Zobel, M. (2012). Ecological assembly rules in plant communities-approaches, patterns and prospects. Biological Reviews, 87(1):111–127.
- Gravel et al., (2006) Gravel, D., Canham, C. D., Beaudet, M., and Messier, C. (2006). Reconciling niche and neutrality: the continuum hypothesis. Ecology letters, 9(4):399–409.
- Herben and Goldberg, (2014) Herben, T. and Goldberg, D. E. (2014). Community assembly by limiting similarity vs. competitive hierarchies: Testing the consequences of dispersion of individual traits. Journal of Ecology, 102(1):156–166.
- Hernández-García et al., (2009) Hernández-García, E., López, C., Pigolotti, S., and Andersen, K. H. (2009). Species competition: coexistence, exclusion and clustering. Philosophical Transactions of the Royal Society A, 367(1901):3183–95.
- Holt, (1987) Holt, R. (1987). On the Relation between Niche Overlap and Competition : The Effect of Incommensurable Niche Dimensions. Oikos, 48(1):110–114.
- Holt, (2006) Holt, R. D. (2006). Emergent neutrality. Trends in Ecology & Evolution, 21(10):531–3.
- Hubbell, (2001) Hubbell, S. P. (2001). The Unified Neutral Theory of Biodiversity and Biogeography. Princeton University Press, Princeton, NJ.
- Kohyama, (2006) Kohyama, T. (2006). The effect of patch demography on the community structure of forest trees. Ecological Research, 21(3):346–355.
- Leimar et al., (2013) Leimar, O., Sasaki, A., Doebeli, M., and Dieckmann, U. (2013). Limiting similarity, species packing, and the shape of competition kernels. Journal of Theoretical Biology, 339:3–13.
- Litchman and Klausmeier, (2008) Litchman, E. and Klausmeier, C. A. (2008). Trait-Based Community Ecology of Phytoplankton. Annual Review of Ecology, Evolution, and Systematics, 39(1):615–639.
- MacArthur and Levins, (1967) MacArthur, R. H. and Levins, R. (1967). The Limiting Similarity, Convergence, and Divergence of Coexisting Species. The American Naturalist, 101(921):377–385.
- MacQueen, (1967) MacQueen, J. B. (1967). Some Methods for classification and Analysis of Multivariate Observations. 5th Berkeley Symposium on Mathematical Statistics and Probability 1967, 1(233):281–297.
- May, (1975) May, R. M. (1975). Some Notes on Estimating the Competition Matrix. Ecology, 56(3):737–741.
- McDonald, (2009) McDonald, J. H. (2009). Handbook of Biological Statistics. Sparky House Publishing, Baltimore, Maryland, USA, second edition.
- McGill et al., (2006) McGill, B. J., Enquist, B. J., Weiher, E., and Westoby, M. (2006). Rebuilding community ecology from functional traits. Trends in ecology & evolution, 21(4):178–85.
- Pacala and Rees, (1998) Pacala, S. W. and Rees, M. (1998). Models suggesting field experiments to test two hypotheses explaining successional diversity. The American Naturalist, 152(5):729–37.
- Pigolotti et al., (2010) Pigolotti, S., Lopez, C., Hernández-García, E., and H., K. A. (2010). How Gaussian competition leads to lumpy or uniform species distributions. Theoretical Ecology, 3(2):89–96.
- R Core Team, (2017) R Core Team (2017). R: A Language and Environment for Statistical Computing.
- Sakavara et al., (2018) Sakavara, A., Tsirtsis, G., Roelke, D. L., Mancy, R., and Spatharis, S. (2018). Lumpy species coexistence arises robustly in fluctuating resource environments. Proceedings of the National Academy of Sciences.
- Scheffer and van Nes, (2006) Scheffer, M. and van Nes, E. H. (2006). Self-organized similarity, the evolutionary emergence of groups of similar species. Proceedings of the National Academy of Sciences of the United States of America, 103(16):6230–6235.
- Scheffer et al., (2015) Scheffer, M., Vergnon, R., Van Nes, E. H., Cuppen, J. G., Peeters, E. T., Leijs, R., and Nilsson, A. N. (2015). The evolution of functionally redundant species; Evidence from beetles. PLoS ONE, 10(10):1–10.
- Schoener, (1974) Schoener, T. W. (1974). Resource partitioning in ecological communities. Science (New York, N.Y.), 185(4145):27–39.
- Schoener, (1976) Schoener, T. W. (1976). Alternatives to Lotka-Volterra competition: models of intermediate complexity. Theoretical population biology, 10(3):309–33.
- Scranton and Vasseur, (2016) Scranton, K. and Vasseur, D. A. (2016). Coexistence and emergent neutrality generate synchrony among competitors in fluctuating environments. Theoretical Ecology, 9(3):353–363.
- Segura et al., (2011) Segura, A. M., Calliari, D., Kruk, C., Conde, D., Bonilla, S., and Fort, H. (2011). Emergent neutrality drives phytoplankton species coexistence. Proceedings. Biological sciences / The Royal Society, 278(1716):2355–61.
- Segura et al., (2013) Segura, A. M., Kruk, C., Calliari, D., García-Rodriguez, F., Conde, D., Widdicombe, C. E., and Fort, H. (2013). Competition Drives Clumpy Species Coexistence in Estuarine Phytoplankton. Scientific Reports, 3(1):1037.
- Shoval et al., (2012) Shoval, O., Sheftel, H., Shinar, G., Hart, Y., Ramote, O., Mayo, A., Dekel, E., Kavanagh, K., and Alon, U. (2012). Evolutionary trade-offs, pareto optimality, and the geometry of phenotype space. Science, 336(June):1157–1161.
- Sterck et al., (2011) Sterck, F., Markesteijn, L., Schieving, F., and Poorter, L. (2011). Functional traits determine trade-offs and niches in a tropical forest community. Proceedings of the National Academy of Sciences of the United States of America, 108(51):20627–32.
- Tibshirani et al., (2001) Tibshirani, R., Walther, G., and Hastie, T. (2001). Estimating the number of clusters in a data set via the gap statistic. Journal of the Royal Statistical Society: Series B (Statistical Methodology), 63:411–423.
- Tilman, (1982) Tilman, D. (1982). Resource competition and community structure. Princeton University Press, monographs edition.
- Tilman, (1994) Tilman, D. (1994). Competition and Biodiversity in Spatially Structured Habitats. Ecology, 75(1):2–16.
- Tilman, (2004) Tilman, D. (2004). Niche tradeoffs, neutrality, and community structure: a stochastic theory of resource competition, invasion, and community assembly. Proceedings of the National Academy of Sciences of the United States of America, 101(30):10854–61.
- Vellend, (2016) Vellend, M. (2016). The theory of ecological communities. Princeton University Press.
- Vergnon et al., (2009) Vergnon, R., Dulvy, N. K., and Freckleton, R. P. (2009). Niches versus neutrality: uncovering the drivers of diversity in a species-rich community. Ecology letters, 12(10):1079–90.
- Vergnon et al., (2013) Vergnon, R., van Nes, E. H., and Scheffer, M. (2013). Interpretation and predictions of the emergent neutrality model: A reply to Barabás et al. Oikos, 122(11):1573–1575.
- Violle et al., (2007) Violle, C., Navas, M.-L., Vile, D., Kazakou, E., Fortunel, C., Hummel, I., and Garnier, E. (2007). Let the concept of trait be functional! Oikos, 116(5):882–892.
- Wright et al., (2004) Wright, I. J., Reich, P. B., Westoby, M., Ackerly, D. D., Baruch, Z., Bongers, F., Cavender-Bares, J., Chapin, T., Cornelissen, J. H. C., Diemer, M., Flexas, J., Garnier, E., Groom, P. K., Gulias, J., Hikosaka, K., Lamont, B. B., Lee, T., Lee, W., Lusk, C., Midgley, J. J., Navas, M.-L., Niinemets, U., Oleksyn, J., Osada, N., Poorter, H., Poot, P., Prior, L., Pyankov, V. I., Roumet, C., Thomas, S. C., Tjoelker, M. G., Veneklaas, E. J., and Villar, R. (2004). The worldwide leaf economics spectrum. Nature, 428(6985):821–7.
- Wright et al., (2010) Wright, S. J., Kitajima, K., Kraft, N. J. B., Reich, P. B., Wright, I. J., Bunker, D. E., Condit, R., Dalling, J. W., Davies, S. J., Díaz, S., Engelbrecht, B. M. J., Harms, K. E., Hunter, M. O., Marks, C. O., Ruiz-Jaen, M. C., Salvador, C. M., and Zanne, A. E. (2010). Functional traits and the growth-mortality trade-off in tropical trees. Ecology, 91(12):3664–74.
- Yan et al., (2012) Yan, B., Zhang, J., Liu, Y., Li, Z., Huang, X., Yang, W., and Prinzing, A. (2012). Trait assembly of woody plants in communities across sub-alpine gradients: Identifying the role of limiting similarity. Journal of Vegetation Science, 23(4):698–708.