Slowdown of the surface diffusion during early stages of bacterial colonization
Abstract
We study the surface diffusion of the model cyanobacterium Synechocystis sp. PCC during the incipient stages of cell contact with a glass surface in the dilute regime. We observe a twitching motility with alternating immobile “tumble” and mobile “run” periods, resulting in a normal diffusion described by a continuous time random walk with a coefficient of diffusion . Surprisingly, is found to decrease with time down to a plateau. This is observed only when the cyanobacterial cells are able to produce released extracellular polysaccharides, as shown by a comparative study between the wild-type strain and various polysaccharides-depleted mutants. The analysis of the trajectories taken by the bacterial cells shows that the temporal characteristics of their intermittent motion depend on the instantaneous fraction of visited sites during diffusion. This describes quantitatively the time dependence of , related to the progressive surface coverage by the polysaccharides. The observed slowdown of the surface diffusion may constitute a basic precursor mechanism for microcolony formation and provides clues for controlling biofilm formation.
I Introduction
In nature, bacteria develop preferentially in contact with solid surfaces by forming biofilms, i.e. masses of adherent cells embedded in slimy extracellular matrices. Biofilms are essential to bacterial growth and survival to environmental stresses. They capture nutrients in the vicinity of the cells, and the peripheral cells exposed to the noxious agents protect the internal cells Singh et al. (2017); Tuson and Weibel (2013). Biofilms also develop in many industrial and medical situations and their formation is a key mechanism in the infection of a living host by pathogenic organisms Davies (2003); Costerton (1999); Omar et al. (2017).
The biofilm structure depends critically on mass transport, surface chemistry and surface topology Mazza (2016). The initial contact of the bacteria with the surface is followed by the formation of micro-colonies Taktikos et al. (2015). Then, the three dimensional morphology of the mature film develops, and chemical signaling triggers the release of bacteria in the liquid medium which are then transported to other colonization sites via the flow of the liquid medium Vlamakis et al. (2013).
Bacteria are known to produce high molecular weight polymeric substances such as extracellular polysaccharides (EPS) Marshall et al. (1971), that play important roles during the main stages of biofilm formation. For example, the mature biofilm contains the macromolecules adsorbed on the solid substrate which provide mechanical stability and adhesion. A distinction can be made between capsular EPS (firmly bound to the outer cell membrane) and released EPS (easily detached from the outer cell membrane) Jittawuttipoka et al. (2013). Moreover, it has been proved recently that the polysaccharides excreted by motile bacteria form attracting trails, giving rise to spatial accumulation of the cells thereby yielding the localized growth of micro-colonies Ursell et al. (2013); Zhao et al. (2013); Gelimson et al. (2016). The production of EPS is also linked to the emergence of peculiar dynamics during the initial stages of surface colonization, by altering the distribution of the velocity of bacterial cells Hu et al. (2016).
In this work, we study the relationship between excreted EPS and the diffusion coefficient at the early stages of surface colonization.
Investigations are carried out with the unicellular cyanobacterium Synechocystis sp. PCC , a model of environmentally important photosynthetic prokaryote that produces EPS in various forms Panoff et al. (1988); Jittawuttipoka et al. (2013). The motility of Synechocystis on solids relies on the action of type IV pili Bhaya et al. (2000); Ng et al. (2003); Ursell et al. (2013); Chau et al. (2015); Wilde and Mullineaux (2015) (the pili extend, bind on the solid surface and then retract). Results collected for the wild type cells are compared with those obtained with different mutant strains described elsewhere Jittawuttipoka et al. (2013).
Surface motion occurs by the usual twitching motility but the diffusion coefficient is observed to decrease systematically with time down to a plateau. This effect is observed only with the wild type and the sll1581 mutant strain, both able to produce released exopolysaccharides. This is not noticed for two double-mutant strains (sll581-sll1875 and sll0923-sll5052) that produce a lower amount of released EPS level. We propose an interpretation that takes into account the coverage of the solid surface by the trails of the excreted EPS. This affects the temporal characteristics of the intermittent twitching motility of the cells. We believe that such a process constitutes an important step in the adaptation of microorganisms to hard surfaces prior to the formation of microcolonies and biofilms.
II Materials and methods
II.1 Bacterial suspensions and measurement of cell motion
The Wild Type (WT) strain of the model cyanobacterium Synechocystis sp. PCC was obtained from the Pasteur Institute, while the EPS-depleted single mutant (sll1581) and double mutants (sll581-sll1875 and sll0923-sll5052) were previously constructed by some of us Jittawuttipoka et al. (2013). The three mutant strains produce less capsular EPS than the WT cells. The single mutant (sll1581) produces similar amounts of released EPS than the WT cells; both double mutants (sll1581-sll1875) and (sll0923-sll5052) form less released EPS.
All strains are routinely cultured in the BG11 standard mineral medium, and sub-cultivated by diluting mL of a mother culture in 47 mL of fresh BG11. The suspensions are stirred by a magnetic agitator operating at rotations per minute in a clean room at C. They are placed under white light intensity of 1.3 W.m-2 for 7 days followed by 24 hours dark and subsequent 2 hours light before running the experiments. At this stage, the concentration of cyanobacteria is approximately cells per mL. The suspensions are diluted 2-to10-fold in fresh BG11 before introduction in the measurement chamber. With this protocol, some of the cells are dividing, which results in average particle diameter m, slightly larger that single cells, whose size is approximately m.
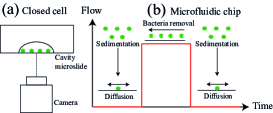
Experiments are conducted in two different systems as represented in Figure 1. One measurement cell consists in a BRAND® cavity microscope slide (2676 mm) closed by a cover slip (Menzel-Gläser, 2222 mm) and sealed with high vacuum grease (Figure 1(a)). The second measurement cell is a Y-junction microfluidic channel of cross section m, see protocol detailed in Figure 1(b).
II.2 Cell tracking
The cyanobacterial cells are observed with a home made inverted microscope equipped with a Nikon TU Plan 10X objective and a white light source. Their motion is recorded with a monochrome camera (Edmund Optics) at one frame per second. The recordings are post-processed with ImageJ software to obtain binary images and then are analyzed for particle tracking Berg et al. with MATLAB. Only trajectories whose duration are longer than 250 seconds are retained for further analysis, while the few non-motile cells are ignored. The number of analyzed trajectories is for section III.1, for the section III.2, and for the experiments in the microfluidic chip. Details on the computation of the mean square displacement (MSD) are given in Appendix A.
III Results
III.1 Cell transport, contact with solid surface and slowdown of motion
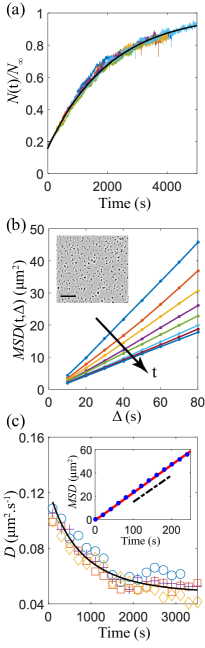
Data recording starts a short time after the introduction of the cyanobacterial cells in the measurement chamber. Due to cell sedimentation, the number of bacterial cells detected on the hard surface increases with observation time until a final value is reached, see Fig.2(a). The sedimentation process is reproducible and can be described by the empirical law
| (1) |
where s and is the initial number of bacteria at the surface. The characteristic time for sedimentation can be obtained from the Stokes velocity , where is the density contrast between the bacterial cells and the culture medium, is the acceleration of gravity, is the volume of the bacterial cells, is their radius and Pa.s is the dynamical viscosity of the suspension as measured by means of a horizontal capillary. With Glaser and Higgins (1989), m, m and the height of the cell mm, we obtain s, consistent with experiments.
The dynamics of surface motion is first described by computing the mean square displacement during a short time interval s, as a function of the observation time (Eq. 4, Appendix A). Figure 2(b) indicates that this short-time MSD is a linear function of for all observation times , as for Fickian diffusion. However, the corresponding time-dependent diffusion coefficient defined by decreases with . Such a slowdown of the dynamics, which constitutes the main result of this work, is reported in Fig.2(c) for different experiments, showing a systematic, gradual decrease of , until a plateau reached at m after approximately s. is independent of the instantaneous bacterial surface density in the range explored here ( to particles/m2). This corresponds to a surface fraction less than and a typical interparticle distance of at least m, larger than the average cells diameter m (see Figure 2(b), inset).
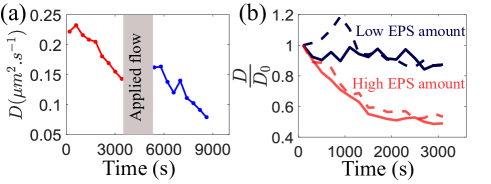
Figure 3(a) shows the results obtained with the microfluidic system, which is used to renew the population of bacteria in the surface vicinity without changing the surface on which diffusion occurs. After the introduction to the microfluidic cell, the cyanobacteria are allowed to sediment and diffuse onto the surface without applied flow. The observed trend is similar to the experiments in the closed chamber: the diffusion coefficient decreases with time. After about one hour of surface diffusion, the cells are detached from the surface by establishing a fluid flow for twenty minutes (vertical grey bar in Fig. 3(a)). Then, the flow is stopped and the cells are allowed to sediment and diffuse onto the surface again. The diffusion coefficient takes the same value as what found just before the washing flow. Since the population of cells was totally renewed by the washing flow, this observation suggests that the surface has retained a signature of the past diffusion events, which influences the behavior of the incoming new cells.
Moreover, we find that the time evolution of the diffusion coefficient is highly dependent on the ability of Synechocystis to produce released EPS, see Figure 3(b). The wild type and the single mutant sll1581 strains, which produce similar high quantities of released EPS as compared to the two double mutant strains (sll1581-sll1875 and sll0923-sll5052), are characterized by the significant decrease of about of the initial diffusion coefficient. In contrast the sll1581-sll1875 and sll0923-sll5052 double mutants, which produce much less released EPS, exhibit a smaller decrease of in their diffusion coefficient. Hence, the released EPS are identified as a major cause for the slowdown of the cell dynamics.
III.2 Normal diffusion resulting from twitching motility
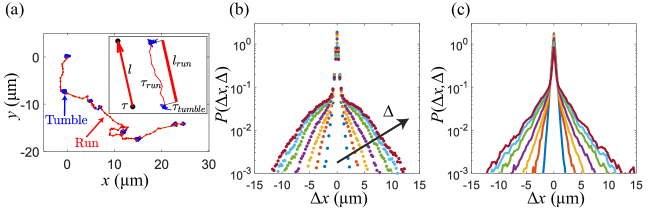
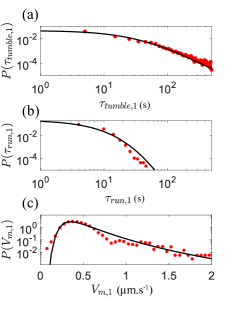
We now focus on the permanent regime once the plateau has been reached, and analyse the trajectories of the bacterial cells for a representative experiment which will be referred to as experiment “1”. Figure 2(c) (inset) displays the linearity of the mean square displacement (Eq. 5) for the representative experiment with a diffusion coefficient at the plateau m. Yet, the apparently normal surface diffusion of Synechocystis stems from the complex dynamics illustrated by the non-Gaussian probability distribution function (PDF) of displacement shown in Figure 4(b). The central part of the distribution corresponds to a state of low mobility (“tumble”) while the tails reflect the higher cell mobility occuring during the “run” periods Berg and Brown (1972). A typical trajectory in Figure 4(a) indeed reveals twitching motility with run and tumble motion. The run periods are directional and detected with the procedure explained in Appendix B, from which we obtain the run times and additionally the tumble times and the mean velocity of runs, defined as where is the distance travelled during the run.
We conduct numerical simulations in order to check for the relevance of the detection procedure, see details in Appendix C. First, we fit the experimental distributions of run and tumble time as in Fig. 9, Appendix B. Additionally, we assume that runs are ballistic excursions of length , as suggested by experiments. Then, for each step of the simulation, , and are chosen randomly along the fits of the experimental distributions. This reproduces the experimental displacement PDF as shown by comparing Figure 4(b) and (c), and provides a diffusion coefficient from simulations (inset of Figure 2(c)).
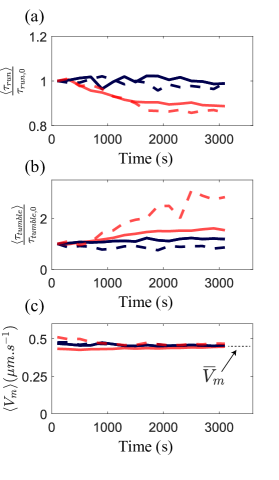
Details on the slowdown of motion are provided by analysing the time variation of , and (here, brackets indicate a time average over temporal windows of s), plotted Figure 5 (a), (b) and (c) respectively. For the wild type and the mutant that produce released EPS, decreases and increases with time. This is not observed with the two double mutants that produce less released EPS and their tumble and run times are almost constant. Importantly, is not only similar but also constant for all the bacterial strains studied.
III.3 Surface area covered by trajectories
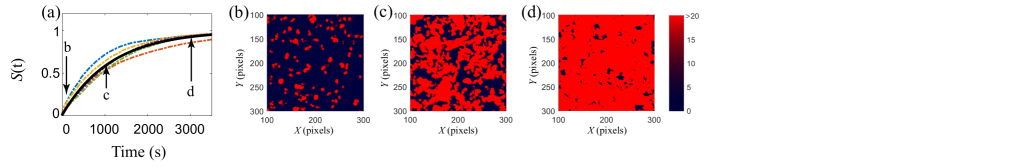
As a basic step for early stages of biofilm formation, we analyse how the surface is explored by the diffusing bacteria. The images are binarised such that the bacteria appear as black disks on a white background, and every black pixel is given a value of (zero otherwise). The cumulated number of visits for each pixel at a given time is then obtained by summing iteratively all preceding images. Figure 6 (b-d) displays how the surface area is progressively filled by the trajectories of the diffusing bacteria during the time scale of the experiment. Moreover, although the experiments are conducted in the dilute regime, the fraction of distinct sites (pixels) visited tends to 1, meaning that the whole surface area of the sample can be screened by EPS. Figure 6(a) points out the robustness of this feature.
IV Discussion
IV.1 Dynamics
The fact that the average velocity of runs is common to all cyanobacterial strains used in this study implies that it is not linked to the production of EPS, and calls for a simple estimate based on lubrication theory.
The motion of cyanobacterial cells is ensured by the traction of type IV pili which provides the force necessary to shear a layer of fluid of viscosity and thickness squeezed between the bacteria and the surface, leading to where is the sheared area ( m is the radius of a bacterial cell). With m.s -1 the maximum velocity during runs, nm the thickness of the sheared layer and Pa.s the dynamical viscosity, we obtain the force exerted by the pili pN, consistent with the order of magnitude obtained from mechanical testing with atomic force microscopy Touhami et al. (2006). The velocity of the bacterial cells during run periods is thus limited by the viscous dissipation of the sheared water (liquid mineral medium BG11) layer at the interface between the bacterial cells and the solid surface.
IV.2 Continuous time random walk
The diffusion coefficient at long times may be obtained by considering a continuous time random walk, where the particle jumps instantaneously over a length after a waiting time Montroll and Weiss (1965); Bouchaud and Georges (1990) as illustrated in the inset of Figure 4(a). We have computed both and (taken consecutively) and verified that the second moment of the jump length PDF and the first moment of the waiting time PDF exist. Then, the diffusion coefficient shall take the simple expression . Ballistic runs occurring at constant velocity m.s-1 (see Fig. 5(c)) suggest the approximation . Therefore, an expression for the diffusion coefficient reads
| (2) |
The computation of the PDF for and leads to well-defined average quantities but without second moment. To calculate from Eq. 2 we use therefore s and s2 with both quantities rounded to the nearest whole number and taken at the plateau value for the representative experiment corresponding to . This provides m2.s-1 which is similar to experimental values, as indicated in the inset of Figure 2(c). From now on, we shall describe the time evolution of the diffusion coefficient presented in Figure 2(c) with the two parameters and .
The coefficient of diffusion is not affected by inter-particle interactions since experiments are achieved in a dilute regime precluding inter-cell friction and adhesion. Instead, our results with the WT strain and various mutant depleted or not in EPS reveal that the amount of released EPS is key. Moreover, renewal of the population of bacterial cells with the microfluidic setup indicates that the decrease of the diffusion coefficient is due to the modification of the surface properties by previously diffusing cells. In the following, we propose a mechanism whereby released EPS stick on the surface in the form of excreted trails Ducret et al. (2012); Yu and Kaiser (2007), which modifies the coefficient of diffusion.
IV.3 Mechanism for the slowdown
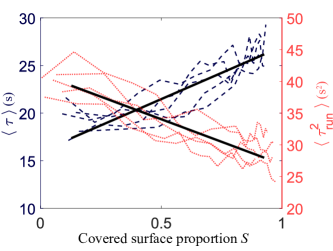
The decrease of the coefficient of diffusion and the progressive surface coverage by the trajectories occur on concomitant timescales. Therefore, it is tempting to correlate the surface coverage and the parameters of the model described by Eq. 2. Figure 7 shows that and vary monotonically with the fraction of distinct sites visited . These two essential temporal parameters, that govern the expression of the diffusion coefficient, may be a function of the probability to be located on a surface coated by extracellular matrix. By approximating , both parameters can be written simply as a weighted sum of the covered surface such as , with the same formula for instead of each .
The computation of for random walkers pertains to a class of long standing problems Larralde and Weiss (1992). Here, both the number of diffusing bacterial cells and the coefficient of diffusion are time dependant and the empirical formula
| (3) |
is used to describe experimental data, resulting in a convenient fit with s (Figure 6(a)): most of the surface is visited before sedimentation is complete.
Then, plugging Eq. 3 into the expression for and as above yields a numerical estimate of the temporal evolution of from Eq. 2, which can be compared to measurements. Fig. 2(c) indicates a good agreement. Therefore, the present analysis implies that the slowdown of the diffusive dynamics can be reasonably attributed to the coverage of the surface by the excreted exopolysaccharides.
Finally, one may ask why cells have longer tumble times and shorter run times on EPS than on glass. Our results show that the decrease of the diffusion coefficient is not related to viscous drag that could result from the shearing of EPS trails left on the surface, since the average velocity during run periods remains constant during the experimental timescale. Moreover, is similar for the wild type strain and for all mutants regardless of their total EPS production rate, confirming that EPS do not provide additional dissipation during motion. However, it is known that during the early stages of the interaction of the bacterial cells with a surface, cells detect the presence of the extracellular matrix which induces a positive feedback loop that in turn leads to enhancement of EPS production and cell accumulation Steinberg and Kolodkin-Gal (2015). For example, B. subtilis uses its flagella as mechanosensory organelles for surface sensing. For other micro-organisms such as Myxococcus xanthus, EPS play a fundamental role in pilus retraction during social motility Li et al. (2003) and pili mediated twitching motility is affected by surface stiffness, topography and chemistry Maier and Wong (2015); Zaburdaev et al. (2014); Tuson and Weibel (2013).
Hence, we propose that Synechocystis cells sense the EPS deposited on the surface, which triggers cellular changes that affect the temporal characteristics of run and tumble motion. This is consistent with the description of run and tumble rates from linear response theory, for bacteria submitted to spatial changes in concentration of chemicals De Gennes (2004); Segall et al. (1986).
V Conclusions
The experimental results presented here show a correlation between the diffusive dynamics of the bacterial cells and their propensity for released EPS excretion. The observed slowdown of the diffusion is due to the evolution of the characteristic times of the intermittent dynamics, rather than to the enhanced dissipation during the “runs” due to the viscosity of EPS. Since the estimated surface fraction of visited sites and the coefficient of diffusion evolve with similar timescales, we propose a model for the decrease of the diffusion coefficient based on the deposition of EPS on the surface. This suggests new strategies for controlling biofilm formation, and therefore limiting the infection of host tissues or undesired adhesion in industrial applications.
Acknowledgements.
We thank A. Di Prima and L. Platzer for assistance with the experimental setup and M. Jaharri (LIMSI, Univ. Paris-Sud) and G. Chau for the help with the microfluidic system. We also thank J. Tailleur (MSC, Univ. Paris Diderot) for helpful discussions.Appendix A Calculation of mean square displacement
In order to study the temporal evolution of the motility, we introduce a time-dependent MSD, which is computed at observation time for different time intervals as follows:
| (4) |
where is half the time separating two successive values of , and is the number of active particles between the times and .
The long time limit of the diffusion is described by computing the ensemble and time-averaged MSD, as defined in Eq.5 where is the total number of particles, the trajectory length , the position of the particle at time , and a given time interval.
| (5) |
Appendix B Run and tumble times
Run times are measured by computing a coarse grained velocity at each time point, with an adjustable time interval:
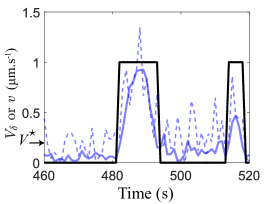
An example of such a computation with is shown Figure 8, where high velocity spikes, corresponding to runs, are separated by periods of low and noisy signal (tumbles). Run periods are selected according to two different criteria: the velocity and the distance travelled where and are some threshold velocity and length, respectively. Once run periods are accepted, the rest of the trajectory is filled with tumble periods.
The criteria m.s-1 and m (as suggested by tails of the PDF Figure 4(b)) provide a faithful distinction between the various types of motion. While the choice of and is somewhat arbitrary, the conclusions based on the use of run and tumble times do not depend significantly on these criteria.
Appendix C Numerical simulations
Numerical simulations are based on the Monte Carlo Method. Here, particles are launched, with trajectories of s. The duration of tumbles and runs is taken from the experimental distributions (Fig.9(a) and (b)), fitted by a power law of the form:
with s, , s, . The tumble motion is simulated by making a given particle to jiggle in the polar system of coordinates whose center is the fixed position between two runs. The coordinates are chosen such that is random and is selected in an exponential distribution of mean m. The run motion is defined by ballistic excursions of duration , during which the travelled distance is where is selected from and is chosen from a Generalized Extreme Value probability law, that conveniently fit the experimental distribution (Fig. 9c). This law is defined with a location parameter m.s-1, a scale parameter m.s-1, and a shape parameter . The angle between two successive runs is random.
References
- Singh et al. (2017) S. Singh, S. K. Singh, I. Chowdhury, and R. Singh, The Open Microbiology Journal 11, 53 (2017).
- Tuson and Weibel (2013) H. H. Tuson and D. B. Weibel, Soft Matter 9, 4368 (2013).
- Davies (2003) D. Davies, Nature Reviews Drug Discovery 2, 114 (2003).
- Costerton (1999) J. W. Costerton, Science 284, 1318 (1999)
- Omar et al. (2017) A. Omar, J. Wright, G. Schultz, R. Burrell, and P. Nadworny, Microorganisms 5, 9 (2017).
- Mazza (2016) M. G. Mazza, Journal of Physics D: Applied Physics 49, 203001 (2016)
- Taktikos et al. (2015) J. Taktikos, Y. T. Lin, H. Stark, N. Biais, and V. Zaburdaev, PLoS ONE 10, 1 (2015).
- Vlamakis et al. (2013) H. Vlamakis, Y. Chai, P. Beauregard, R. Losick, and R. Kolter, Nature Reviews Microbiology 11, 157 (2013)
- Marshall et al. (1971) K. C. Marshall, R. Stout, and R. Mitchell, Microbiology 68, 337 (1971).
- Jittawuttipoka et al. (2013) T. Jittawuttipoka, M. Planchon, O. Spalla, K. Benzerara, F. Guyot, C. Cassier-Chauvat, and F. Chauvat, PLoS ONE 8, e55564 (2013).
- Ursell et al. (2013) T. Ursell, R. M. W. Chau, S. Wisen, D. Bhaya, and K. C. Huang, PLoS Comput Biol 9, e1003205 (2013).
- Zhao et al. (2013) K. Zhao, B. S. Tseng, B. Beckerman, F. Jin, M. L. Gibiansky, J. J. Harrison, E. Luijten, M. R. Parsek, and G. C. L. Wong, Nature 497, 388 (2013)
- Gelimson et al. (2016) A. Gelimson, K. Zhao, C. K. Lee, W. T. Kranz, G. C. L. Wong, and R. Golestanian, Physical Review Letters 117, 178102 (2016)
- Hu et al. (2016) W. Hu, M. L. Gibiansky, J. Wang, C. Wang, R. Lux, Y. Li, G. C. L. Wong, and W. Shi, Scientific Reports 6, 17790 (2016).
- Bénichou et al. (2011) O. Bénichou, C. Loverdo, M. Moreau, and R. Voituriez, Rev. Mod. Phys. 83, 81 (2011).
- Panoff et al. (1988) J. M. Panoff, B. Priem, H. Morvan, and F. Joset, Archives of Microbiology 150, 558 (1988).
- Bhaya et al. (2000) D. Bhaya, N. R. Bianco, D. Bryant, and A. Grossman, Molecular Microbiology 37, 941 (2000).
- Ng et al. (2003) W.-O. Ng, A. R. Grossman, and D. Bhaya, Journal of Bacteriology 185, 1599 (2003)
- Chau et al. (2015) R. M. W. Chau, T. Ursell, S. Wang, K. C. Huang, and D. Bhaya, Biophysical Journal 108, 1623 (2015).
- Wilde and Mullineaux (2015) A. Wilde and C. W. Mullineaux, Molecular Microbiology 98, 998 (2015).
- (21) H. C. Berg, N. Darnton, and J. Jaffe, “http://www.rowland.harvard.edu/labs/bacteria/software/index.php” .
- Glaser and Higgins (1989) D. Glaser and M. Higgins, Journal of Bacteriology 171, 669 (1989).
- Berg and Brown (1972) H. C. Berg and D. a. Brown, Nature 239, 500 (1972).
- Montroll and Weiss (1965) E. Montroll and G. Weiss, Journal of Mathematical Physics 6, 167 (1965).
- Bouchaud and Georges (1990) J. P. Bouchaud and A. Georges, Physics Reports, Vol. 195 (1990) pp. 127–293.
- Touhami et al. (2006) A. Touhami, M. H. Jericho, J. M. Boyd, and T. J. Beveridge, Journal of Bacteriology 188, 370 (2006).
- Ducret et al. (2012) A. Ducret, M.-P. Valignat, F. Mouhamar, T. Mignot, and O. Theodoly, Proceedings of the National Academy of Sciences 109, 10036 (2012).
- Yu and Kaiser (2007) R. Yu and D. Kaiser, Molecular Microbiology 63, 454 (2007).
- Larralde and Weiss (1992) H. Larralde and P. Trunfio and H.E. Stanley and G.H. Weiss, Nature 335, 423 (1992).
- Rossi and De Philippis (2015) F. Rossi and R. De Philippis, Life 5, 1218 (2015).
- Steinberg and Kolodkin-Gal (2015) N. Steinberg and I. Kolodkin-Gal, Journal of Bacteriology 197, 2092 (2015).
- Li et al. (2003) Y. Li, H. Sun, X. Ma, A. Lu, R. Lux, D. Zusman, and W. Shi, Proceedings of the National Academy of Sciences of the United States of America 100, 5443 (2003).
- Maier and Wong (2015) B. Maier and G. C. L. Wong, Trends in Microbiology 23, 775 (2015).
- Zaburdaev et al. (2014) V. Zaburdaev, N. Biais, M. Schmiedeberg, J. Eriksson, A. B. Jonsson, M. P. Sheetz, and D. A. Weitz, Biophysical Journal 107, 1523 (2014).
- De Gennes (2004) P.-G. De Gennes, European Biophysics Journal 33, 691 (2004).
- Segall et al. (1986) J. E. Segall, S. M. Block, and H. C. Berg, 83, 8987 (1986).