Internal and surface waves in vibrofluidized granular materials: Role of cohesion
Abstract
Wave phenomena in vibrofluidized dry and partially wet granular materials confined in a quasi-two-dimensional geometry are investigated with numerical simulations considering individual particles as hard spheres. Short ranged cohesive interactions arising from the formation of liquid bridges between adjacent particles are modeled by changing the velocity dependent coefficient of restitution. Such a change effectively suppresses the formation of surface waves, in agreement with previous experimental observations. The difference in pattern creation arises from the suppressed momentum transfer due to wetting and it can be quantitatively understood from an analysis of binary impacts.
I Introduction
Due to dissipative particle-particle interactions, energy injection is essential for exploring granular dynamics from both physical and engineering perspectives Jaeger et al. (1996); Duran (2000); Aranson and Tsimring (2009), as well as for handling granular materials in widespread applications ranging from geo-technique to chemical engineering F. Radjai and Delenne (2017). Depending on specific configurations, granular flow may be driven by gravity as in a silo Janssen (1895) or in planetary formation Blum and Wurm (2008), by interstitial fluid drag Charru et al. (2013); Bagnold (2005); Groh et al. (2010); Huang et al. (2012) or by a boundary Iveson et al. (2001); Huang et al. (2010); May et al. (2013). Consequently, the balance between the energy injection and dissipation gives rise to various nonequilibrium steady states (NESS) that pose challenges in understanding granular materials as a continuum Goldhirsch (2003); Brilliantov and Poeschel (2004); Jenkins and Savage (1983). Note that such a balance, particularly in the boundary driven case, is rarely established instantaneously and wave propagation plays an essential role in redistributing the injected energy Aoki and Akiyama (1995); Bougie et al. (2002); Huang et al. (2006). For cohesionless dry granular materials under vibrations, theoretical, numerical and experimental investigations have shown that mechanical perturbations evolve into shock waves with abrupt changes of granular temperature, pressure and density Goldshtein et al. (1996); Bougie et al. (2002); Huang et al. (2006); Sano (2011). Furthermore, surface instability Huang et al. ; Bougie (2010); Almazán et al. (2013); Zippelius and Huang (2017), granular flow over obstacles Amarouchene and Kellay (2006); Boudet and Kellay (2013), convection Klongboonjit and Campbell (2008); Fortini and Huang (2015) and, last but not least, sedimentation Almazán et al. (2015), have all been found to be associated with wave propagation in granular materials.
However, much less is known about how mechanical perturbations propagate in partially wet granular materials that are often encountered in nature (e.g., soil), industries (e.g., granulation process) and our daily lives (e.g., sand sculptures)Huang (2014). Here, partially wet refers to the situation with the liquid added being distributed as capillary bridges that bind individual particles together (e.g., wet sand on the beach). In this situation, typical liquid content (i.e., volume of the liquid over the total volume occupied by the partially wet granular sample) is only a few percent Huang (2014). Recent experimental investigations have shown that the collective behavior of partially wet granular materials is dramatically different in comparison to their dry counterparts concerning rheological behavior Schwarze et al. (2013), rigidity Scheel et al. (2008); Huang et al. (2009a), phase transitions Fingerle et al. (2008); Huang et al. (2009b); May et al. (2013); Huang (2015), clustering Huang et al. (2012); Ramming and Huang (2017), and pattern formation Huang and Rehberg (2011); Butzhammer et al. (2015); Zippelius and Huang (2017). For instance, the surface waves reminiscent of the Faraday instability in a Newtonian fluid Melo et al. (1994, 1995); Clément et al. (1996) are completely suppressed in vibrofluidized wet granular layers. Instead, period tripling kink-wave fronts dominate Huang and Rehberg (2011); Butzhammer et al. (2015). This comparison suggests that the collective motion of granular materials is strongly influenced by ‘microscopic’ particle-particle interactions. However, it is still unclear how the ‘micro-’ and ‘macroscopic’ scales are connected with each other.
From a ‘microscopic’ perspective, recent investigations show that the energy loss associated with wet particle-particle interactions is mainly induced by capillary interactions, viscous drag force and inertia of the liquid film covering the particles Antonyuk et al. (2009); Müller et al. (2011); Gollwitzer et al. (2012). The normal coefficient of restitution (COR) that characterizes the energy loss in wet particle impacts can be predicted analytically Müller and Huang (2016). Following this progress, it is intuitive to implement it in numerical simulations for predicting the collective behavior of partially wet granular materials. In comparison to force-based discrete element method (DEM) simulations Cundall and Strack (1979); Zhu et al. (2008), liquid-mediated particle-particle interactions are treated as instantaneous events with the rebound velocities predicted by the COR of wet particle impacts. As the energy loss associated with particle-particle interactions is captured by the COR, an appropriate choice of the COR model is essential for an accurate prediction of the collective behavior in particulate systems.
Using an event-driven (ED) algorithm Rapaport (1980) that predicts the collision event based on particle trajectories, pattern formation in vibrofluidized dry granular materials were reproduced successfully Bizon et al. (1998). Note that the conflict between instantaneous events assumed in the simulation and the finite collision time in reality may lead to unrealistic outcome, such as the inelastic collapse (i.e., diverging number of collisions within a finite time) Luding and McNamara (1998); Müller and Pöschel (2012). Nevertheless, such kind of challenges can be handled with an appropriate implementation of ED algorithms Luding and McNamara (1998). Moreover, it has recently been shown that collisions of soft, frictionless particles can also be modeled by introducing additional coefficients that account for the softness of particles Müller and Pöschel (2013).
Here, I use an ED algorithm to predict the collective behavior of vibrofluidized granular materials based on the velocity dependent COR. Focusing on hard spheres confined in quasi-two-dimensions (Q2D), I show that a modification of the COR from the dry Brilliantov and Poeschel (2004) to the wet Müller and Huang (2016) case effectively suppresses the formation of surface waves, and this change of collective behavior can be traced down to the inhibited momentum transfer at the individual particle level.
II Methods
In the numerical set-up, spherical particles are confined in a monolayer of size delimited by flat hard walls and gravity points in the negative direction. The particles have two translational degrees of freedom in the and directions and one rotational degree of freedom about the perpendicular axis. They are monodisperse with a diameter and mass . The simulation box is driven sinusoidally in the direction; that is, its bottom and lid move according to and respectively with vibration amplitude and frequency as control parameters. A related control parameter is the dimensionless peak acceleration , which is associated with the maximum force acting on the granular layer.
After initialization, the particles are randomly located inside the simulation box with a small random velocity . Subsequently, the particles fly freely under gravity until a collision event occurs. The positions, translational and angular velocities of all particles are recorded every second with the number of recorded phases per vibration cycle. As sketched in the inset of Fig. 1(a), the relative velocity at the contact point of two colliding particles with positions , velocities and angular velocities is calculated with
| (1) |
where with corresponds to the unit vector in the normal direction.
Based on momentum conservation, post-collisional velocities are Walton and Braun (1986); Luding (1995)
| (2) | |||
with the moment of inertia of a sphere . Primed variables correspond to post-collisional quantities. The momentum exchange upon impact is
| (3) |
where and correspond to the normal and tangential component of , and denote the COR in the normal and tangential directions, respectively. The unit vector in tangential direction is . The factor is due to the fact that a change of the translational velocity is coupled to that of the angular velocity and the coupling factor relies on the moment of inertia of the spherical particles considered here Luding (1995).
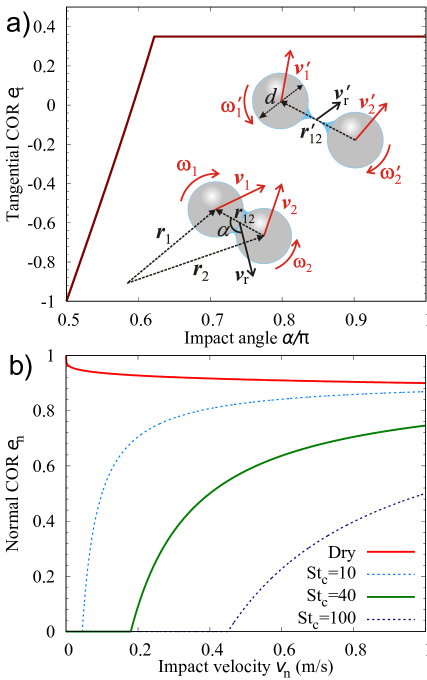
As shown in Fig. 1(b), the dependence of on the magnitude of normal impact velocity differs qualitatively between dry and wet particles. For dry COR , a smaller impact velocity leads to a higher normal COR because of the higher tendency for the particles to interact elastically. For the wet case, an onset velocity , below which no rebound occurs, arises from capillary and viscous drag forces imposed by the wetting liquid Gollwitzer et al. (2012). Due to the dramatic difference of , it is intuitive to use the velocity dependent COR for predicting the different collective dynamics between dry and wet granular materials.
More specifically, dry COR is estimated with Brilliantov and Poeschel (2004)
| (4) |
with the material parameter . The wet COR, on the other hand, is estimated with Müller and Huang (2016)
| (5) |
for and elsewhere, where the two control parameters and Stc correspond to the COR at infinitely large and the onset velocity , respectively. The constant factor with particle density and dynamic viscosity is related to the definition of the Stokes number St, which measures particle inertial over viscous drag force. The same collision rule is implemented for particle-wall collisions. In comparison to previous numerical simulations Fingerle et al. (2008); Ulrich et al. (2009); Roeller and Herminghaus (2011); Schwarze et al. (2013); Roy et al. (2017) of wet granular materials that include predominately capillary interactions, the influence of inertial and viscous drag forces from the liquid film on the COR is also included here.
Since the momentum transfer in the tangential direction is coupled to that in the normal direction by the laws of friction, the tangential COR is estimated with in case of and elsewhere [see Fig. 1(a)], where is the frictional coefficient and is the limiting tangential COR introduced to account for the onset of sliding Luding (1995). For particle-wall collisions, the tangential COR is set to .
In addition, the TC model is implemented to avoid inelastic collapse of the granular layer while colliding with the container Luding and McNamara (1998). Here, TC stands for a collisional time scale. The model considers that only the first collision of each particle within this time scale is inelastic and all subsequent ones are elastic (i.e., ). Here, is chosen to be the contact duration of two colliding elastic spheres with a normal colliding velocity and material parameter . The former variable is chosen to be the maximum velocity of the driving plate , and the latter one is calculated with with and Young’s modulus and Poisson’s ratio of the particle Duran (2000). The simulation parameters are shown in Table 1. They correspond to the case of water wetting glass spheres. Based on a previous investigation Gollwitzer et al. (2012), and are chosen to be and throughout the article unless otherwise stated. Note that for other particle-liquid combinations, the two parameters can be estimated analytically with a wet impact model Müller and Huang (2016). For each parameter set, a simulation time of at least s is chosen.
| Parameters | Value | |
|---|---|---|
| Particle density | 2580 kg m-3 | |
| Particle diameter | 0.002 m | |
| Young’s modulus | 63 GPa | |
| Poisson’s ratio | 0.22 | |
| Container width | 30 | |
| Container height | 30 | |
| Dynamic viscosity of liquid | 1.0 mPa s |
III Stability diagram
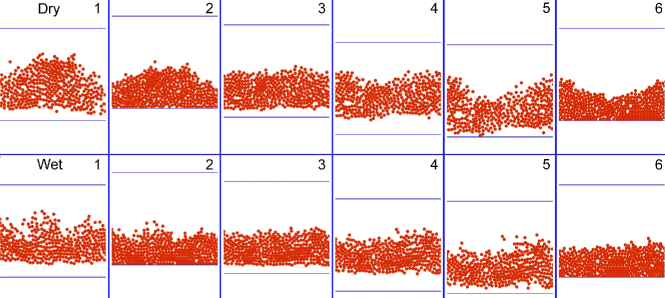
Figure 2 compares the collective motion of dry (upper row) and wet (lower row) particles during one vibration cycle. There exist a free-flying and a compressing regime that occurs directly after the impact of the granular layer with the container bottom for both cases. For the dry case, there is a clear tendency of forming surface waves, in agreement with a previous experiment conducted in Q2D Clément et al. (1996). For wet particles under the same driving conditions, surface waves are suppressed, as expected from previous investigations on wet granular materials Huang et al. (2009b); Butzhammer et al. (2015). An increase of while keeping the same granular layer thickness and a change to periodic boundary condition in the direction yield qualitatively the same behavior.
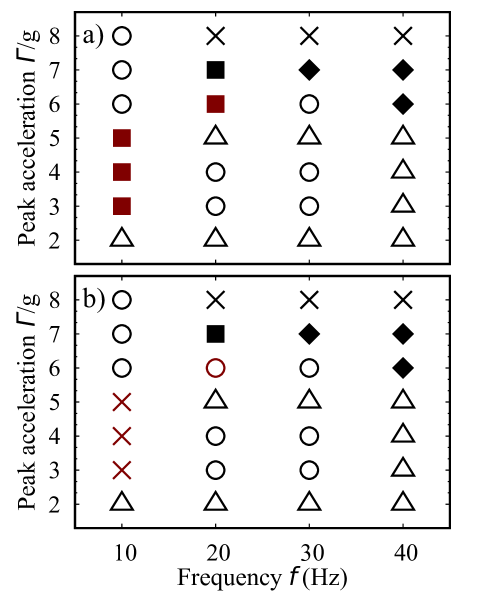
Figure 3 shows the stability diagram for dry (a) and wet (b) particles as a function of and . It is obtained by an inspection of the collective motion of particles during the free-flying period, after the system evolves into a steady state in which the center of mass (CM) of the granular layer fluctuates in a periodic manner. Crystalline and amorphous states are distinguished from whether the particles are caged in a crystalline or a random configuration. In a liquid-like state, the particles can move freely with respect to their neighbors. At the lowest frequency Hz, an increase of from leads to a fluidization of the granular layer for both dry and wet cases until a solidification at , where compression due to collisions with the container lid starts. For , surface waves emerge for a fluidized dry granular layer but not for the wet case (see Fig. 2). As increases, the difference between dry and wet particles becomes less prominent, because the vibration amplitude, which decays with , becomes comparable to and the free-flying time for surface waves to develop also shortens. At , both dry and wet granular layers crystallize again because of the diminished energy injection when the impact velocity of the granular layer matches that of the vibrating plate. This corresponds to the onset of a period doubling bifurcation Melo et al. (1995). Note that for a wet granular layer, the bifurcation threshold is expected to vary with the cohesive force between the granular layer and the vibrating plate Butzhammer et al. (2015). Such a feature does not exist here as instantaneous collisions are assumed in the ED algorithm. Nevertheless, the emerging period doubling kink waves for are in agreement with previous experiments Melo et al. (1995); Zhang et al. (2005); Butzhammer et al. (2015). In short, this comparison indicates that the change of velocity dependent COR captures the collective behavior of granular systems, particularly the difference in pattern creation between dry and wet granular materials.
IV Wave propagation
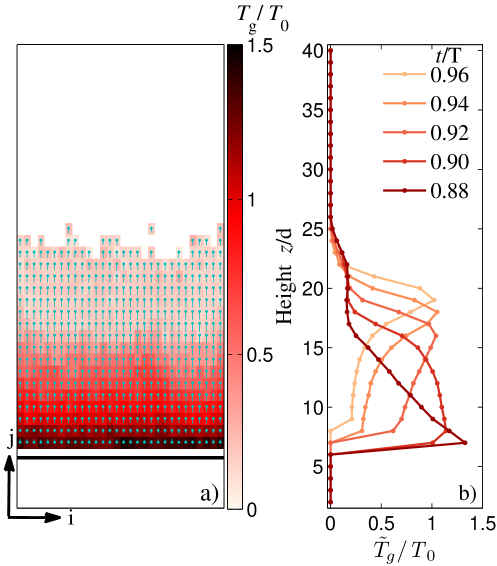
Figure 4 illustrates how wave fronts develop and propagate through a wet granular layer under vertical vibrations. As the free-flying period ends at , the granular layer starts to collide with and collect energy from the vibrating plate. Consequently, a disturbed region with the mean velocity pointing upwards in the direction emerges. The counter-flow between the disturbed and undisturbed regions leads to a granular temperature peak, in which frequent particle-particle collisions occur. To obtain the spatially resolved velocity and temperature field, the space being possibly occupied by the particles is divided into cells in the lab system, where and with ceiling function . To get better statistics, data collected at the same phase of multiple () vibrations cycles in the steady state are averaged to obtain the time-resolved velocity and granular temperature fields. In cell , the granular temperature is calculated with , where corresponds to the velocity of particle , and are indices of the cell, and is obtained through an average over the velocities of all particles inside. Only cells with sufficient number of particles are analyzed. The kinetic energy scale is based on the maximum velocity of the vibrating plate .
As the velocity field in Fig. 4(a) shows, particles in the undisturbed region move collectively downwards with much less horizontal components in comparison to particles in the disturbed region just collided with the container bottom. As shown in Fig. 4(b), the collision results in a temperature gradient in the vertical direction being developed at . Here the averaged granular temperature is obtained with with an average over different column . As time evolves to , the peak broadens while propagating upwards, indicating that intensive momentum exchange takes place throughout the granular layer. As time evolves further, the mobility of the particles in the disturbed region becomes more coherent. Subsequently, the temperature peak sharpens again until it decays while reaching the top of the granular layer. Note that it takes less than of a vibration period for the wave to propagate through the granular layer and redistribute the injected energy.
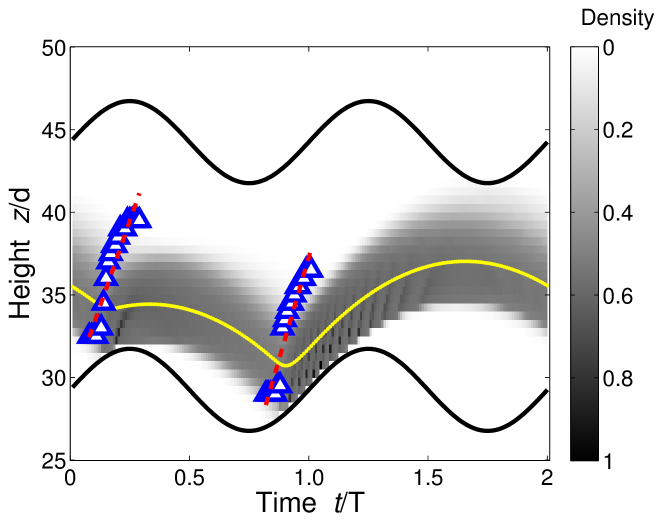
According to previous investigations Melo et al. (1995); Butzhammer et al. (2015), the periodicity of both the dry and the wet granular layer under vertical vibrations can be estimated approximately with a single particle colliding completely inelastically with the container. For the driving condition used here ( Hz, ), the granular layer undergoes a period doubling bifurcation and consequently the CM trajectory shown in Fig. 5 has a period of . In the first vibration cycle, the granular layer detaches immediately after colliding with the container bottom (undergoing a ‘weak’ impact), because the acceleration of the vibrating plate at collision . The granular layer dilutes during the free-flying period until the next collision starts. After the second collision, the granular layer stays together with the container bottom for some time before the next free-flying period starts. Wave propagation is initiated as the granular layer collides with the container bottom and the injection of kinetic energy starts. As indicated by the fitted lines, the wave propagates quickly through the granular layer before the free-flying period starts. For the ‘weak’ impact taking place at , the wave propagates slightly slower ( m/s) than the one ( m/s) emerging after the second impact. The location of the wave front is identified as the location of a developed temperature peak (i.e., ). Because of the wide range of as varies, it is unclear whether the sound speed predicted with existing kinetic theory Savage (1988) assuming constant COR still applies or not. Therefore, no concrete statement on the development of shock wave fronts can be made here.
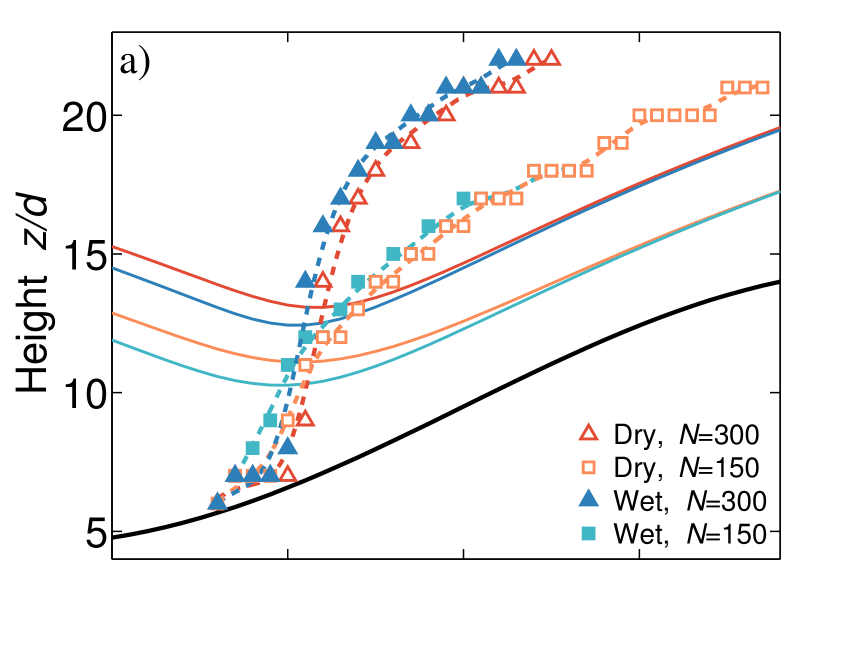
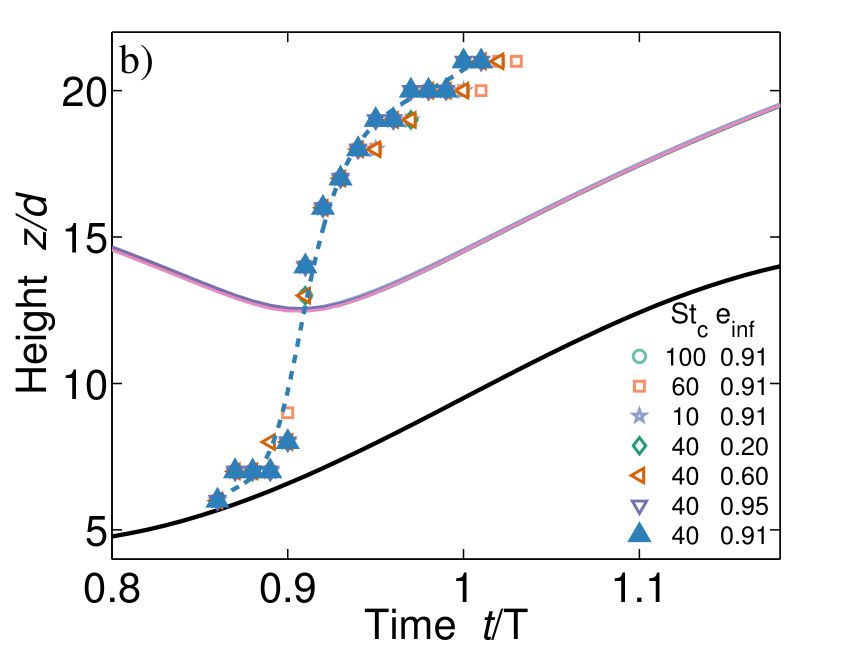
Figure 6(a) shows a comparison of wave front propagation between dry and wet granular layers with different . Qualitatively, the wave front propagates faster as , or the number of layers increases, in agreement with previous investigations Bougie et al. (2002); Huang et al. (2006). This is due to the higher particle density in the disturbed region. On the contrary, the influence of wetting on the wave front propagation is relatively weak. It leads to a slightly earlier start of wave propagation, presumably due to the earlier collision of the granular layer with the container bottom. Taking the lowest point of the corresponding CM trajectory [see Fig. 6(a)] as a measure of the time scale of collision, we have the collision time and for dry and wet particles with , respectively. The delay time between dry and wet granular layer stays the same if we choose the onset of wave front as the order parameter. For both dry and wet granular layers, no granular Leidenfrost effect Eshuis et al. (2007) is observed, presumably due to the limited the range of explored here.
As shown in Fig. 6(b), the development and propagation of wave fronts as well as the CM trajectories for various parameters and Stc overlap with each other pretty well, indicating that a quantitative modification of wet COR does not influence the propagation of the wave fronts. In comparison to Fig. 6(a), it is reasonable to conclude that internal wave propagation is only weakly influenced by wetting, and this influence arises from the distinct difference of as , not the quantitative change induced by the parameters and Stc.
V Momentum transfer
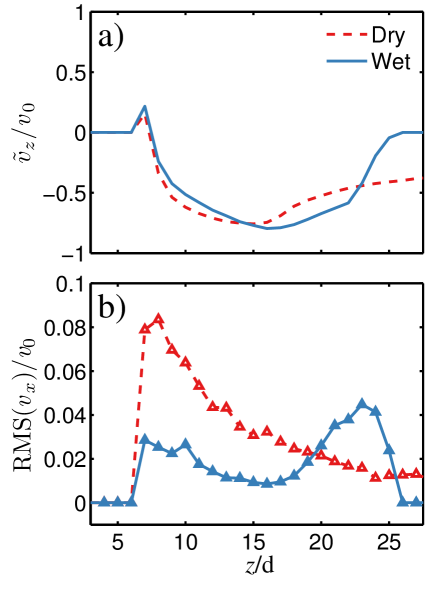
Finally, we come to the question of how the change of COR hinders the formation of standing waves. The above analysis shows that wave propagation plays a minor role as it takes place only shortly after collisions with the container bottom and depends weakly on the change of COR. For the development of standing waves, one precondition is the momentum transfer from the direction of driving to that perpendicular to driving due to frequent collisions of particles between the disturbed and undisturbed regions. From the velocity field shown in Fig. 4(a), the mean vertical (i.e., driving direction) flow field can be obtained with , where is the unit vector in the direction. As shown in Fig. 7(a), the mean vertical velocity changes sign in the counter-flow region described above. At this moment, the vertical velocity profiles for dry and wet particles are comparable with each other. In order to quantify the momentum being transferred to the horizontal direction for surface waves, I calculate the horizontal velocity fluctuations RMS, where is the horizontal component of the velocity field with the unit vector pointing in the direction. The order parameter RMS, which measures the modulation of the velocity field in the direction perpendicular to the driving, is expected to grow as the tendency for the creation of surface waves gets stronger. A comparison of RMS between dry and wet granular layers in Fig. 7(b) clearly indicates the suppression of momentum transfer in the counter-flow region due to wetting. As time evolves, increases as the bottom plate pushes the whole granular layer upwards, while RMS decays correspondingly. This behavior suggests an enhanced collective motion due to driving. This comparison between dry and wet granular layer stays qualitatively the same along with the propagation of the wave front.
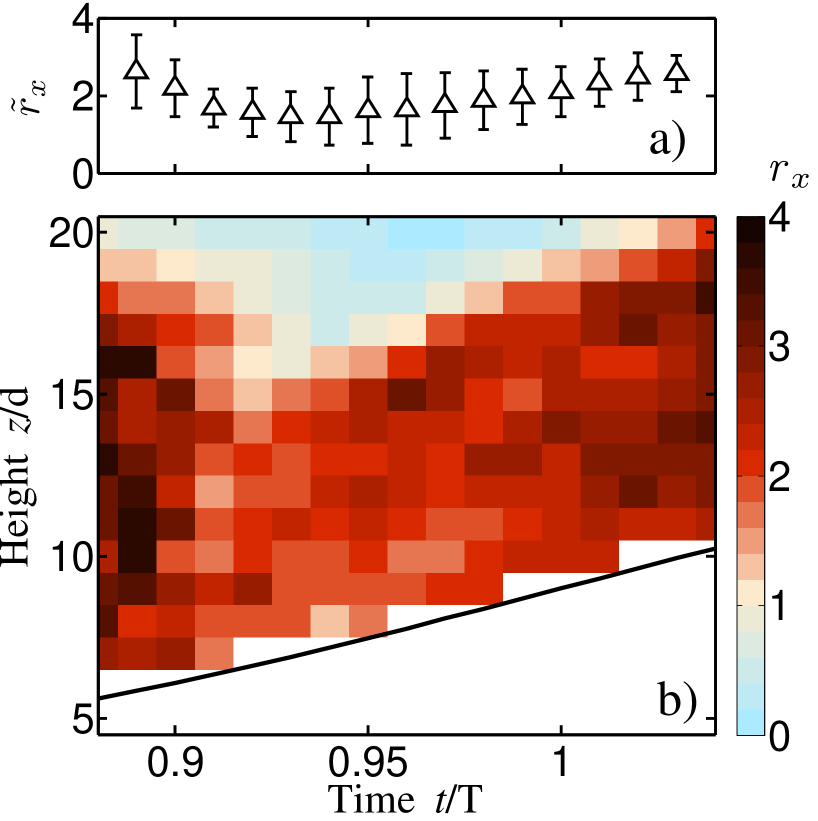
In order to quantify the difference between dry and wet granular layers, a deficiency factor of momentum transfer is defined as , which compares the horizontal velocity fluctuations for dry and that for wet particles. As shown in Fig. 8(a), the mean deficiency factor with an average over various row index stays approximately constant at within the time of internal wave propagation. As indicated by the time-space plot shown in Fig. 8(b), the fact that stays predominately clearly illustrates the deficiency of momentum transfer due to wetting. Qualitatively, the above analysis demonstrates that the suppression of standing waves in vibrofluidized wet granular materials can be attributed to the strong tendency of collective motion along the driving direction and consequently the deficiency in momentum transfer.
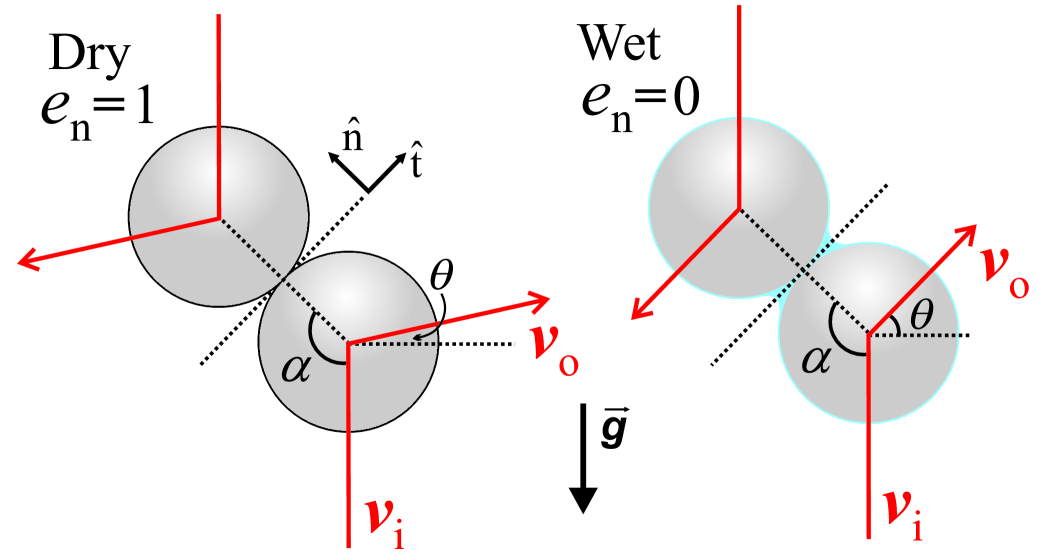
Quantitatively, the mean deficiency factor can be understood from a comparison of momentum transfer in a binary oblique collision. For the sake of simplicity, I ignore the rotational degrees of freedom and consider the extreme case of and for the dry and wet cases (corresponding to the situation of ), respectively. As sketched in Fig. 9, two particles approach each other initially in the vertical direction with . For the dry case, the rebound velocity is symmetric to along the normal direction . Thus, the component of the rebound velocity for the lower particle yields with . For the wet case, we have along the direction. Consequently, the corresponding component of the rebound velocity for the lower particle reads , where and . Therefore, the momentum transfer from the vertical to the horizontal direction for dry particles doubles that for wet ones in this ideal situation, independent of the colliding angle . Since the mean velocity of the two particles stays at for symmetry reasons, , which agrees with the numerical result [see Fig. 8(a)] within the uncertainty. This argument, although idealized, quantitatively captures the deficiency in momentum transfer due to wetting.
VI Conclusion
To summarize, this investigation demonstrates that the collective behavior of vibrofluidized granular materials can be tuned by the velocity dependent COR. Using an event driven algorithm, I show that standing waves in a thin layer of vibrofluidized granular material can be effectively suppressed via a change from dry to wet COR. Internal wave propagation, which accounts for the redistribution of the injected kinetic energy, is found to be weakly influenced by such a tuning. The suppression of standing waves arises from the different efficiency in momentum transfer from the vertical to the horizontal directions between dry and wet granular layers. Such a difference is further quantified with an momentum deficiency factor that compares the modulation of the velocity field in the horizontal direction between dry and wet particles. It is shown that the deficiency of momentum transfer due to wetting stays at about , which can be rationalized with the momentum transfer at the level of individual particles.
In the future, quantitative comparisons to experimental investigations are necessary to further develop and validate the model. Reciprocally, this approach is helpful in exploring the pattern creation mechanisms in wet granular materials from an insider view Huang and Rehberg (2011); Butzhammer et al. (2015); Zippelius and Huang (2017). As granular materials always have a certain size distribution, understanding how the polydispersity of particles influence the wave propagation also deserves further investigations. Moreover, it would also be interesting to explore how the redistribution of energy and momentum influences the convection induced granular capillary effect Fan et al. (2017). Last but not least, this investigation also paves the way of developing hybrid models that combine the advantages of ED and DEM simulations for modeling wet granular dynamics at a large scale.
Acknowledgements.
Helpful discussions with Ingo Rehberg and Simeon Völkel are gratefully acknowledged. This work is partly supported by the Deutsche Forschungsgemeinschaft through Grant No. HU1939/4-1.References
- Jaeger et al. (1996) H. M. Jaeger, S. R. Nagel, and R. P. Behringer, Rev. Mod. Phys. 68, 1259 (1996).
- Duran (2000) J. Duran, Sands, Powders and Grains (An Introduction to the Physics of Granular Materials), 1st ed. (Springer-Verlag, New York, 2000).
- Aranson and Tsimring (2009) I. S. Aranson and L. S. Tsimring, Granular Patterns (Oxford University Press, 2009).
- F. Radjai and Delenne (2017) S. L. F. Radjai, S. Nezamabadi and J. Delenne, eds., Powders and grains 2017: Proceedings of the 8th International Conference on Micromechanics of Granular Media, Vol. 140 (EPJ Web of Conferences, 2017).
- Janssen (1895) H. A. Janssen, Zeitschrift des Vereines deutscher Ingenieure 39, 1045 (1895).
- Blum and Wurm (2008) J. Blum and G. Wurm, Annual Review of Astronomy and Astrophysics 46, 21 (2008).
- Charru et al. (2013) F. Charru, B. Andreotti, and P. Claudin, Annu. Rev. Fluid Mech. 45, 469 (2013).
- Bagnold (2005) R. A. Bagnold, The physics of blown sand and desert dunes (Dover Publications, Mineola, N.Y., 2005).
- Groh et al. (2010) C. Groh, I. Rehberg, and C. A. Kruelle, New J. Phys. 12, 063025 (2010).
- Huang et al. (2012) K. Huang, M. Brinkmann, and S. Herminghaus, Soft Matter 8, 11939 (2012).
- Iveson et al. (2001) S. M. Iveson, J. D. Litster, K. Hapgood, and B. J. Ennis, Powder Technol. 117, 3 (2001).
- Huang et al. (2010) K. Huang, C. Krülle, and I. Rehberg, Z. Angew. Math. Mech. 90, 911 (2010).
- May et al. (2013) C. May, M. Wild, I. Rehberg, and K. Huang, Phys. Rev. E 88, 062201 (2013).
- Goldhirsch (2003) I. Goldhirsch, Annu. Rev. Fluid Mech. 35, 267 (2003).
- Brilliantov and Poeschel (2004) N. Brilliantov and T. Poeschel, Kinetic theory of granular gases (Oxford University Press, Oxford; New York, 2004).
- Jenkins and Savage (1983) J. T. Jenkins and S. B. Savage, J. Fluid Mech. 130, 187 (1983).
- Aoki and Akiyama (1995) K. M. Aoki and T. Akiyama, Phys. Rev. E 52, 3288 (1995).
- Bougie et al. (2002) J. Bougie, S. J. Moon, J. B. Swift, and H. L. Swinney, Phys. Rev. E 66, 051301 (2002).
- Huang et al. (2006) K. Huang, P. Zhang, G. Miao, and R. Wei, Ultrasonics 44, e1487 (2006).
- Goldshtein et al. (1996) A. Goldshtein, M. Shapiro, and C. Gutfinger, Journal of Fluid Mechanics 316, 29 (1996).
- Sano (2011) O. Sano, J. Phys. Soc. Jpn. 80, 034402 (2011).
- (22) K. Huang, G. Miao, P. Zhang, Y. Zhu, and R. Wei, arXiv:cond-mat/0511687 .
- Bougie (2010) J. Bougie, Phys. Rev. E 81, 032301 (2010).
- Almazán et al. (2013) L. Almazán, J. A. Carrillo, C. Salueña, V. Garzó, and T. Pöschel, New J. Phys. 15, 043044 (2013).
- Zippelius and Huang (2017) A. Zippelius and K. Huang, Sci. Rep. 7 (2017).
- Amarouchene and Kellay (2006) Y. Amarouchene and H. Kellay, Physics of Fluids 18, 031707 (2006).
- Boudet and Kellay (2013) J. F. Boudet and H. Kellay, Phys. Rev. E 87, 052202 (2013).
- Klongboonjit and Campbell (2008) S. Klongboonjit and C. S. Campbell, Physics of Fluids 20, 103302 (2008).
- Fortini and Huang (2015) A. Fortini and K. Huang, Phys. Rev. E 91, 032206 (2015).
- Almazán et al. (2015) L. Almazán, D. Serero, C. Salueña, and T. Pöschel, Phys. Rev. E 91, 062214 (2015).
- Huang (2014) K. Huang, Wet granular dynamics: From single particle bouncing to collective motion (2014) habilitation thesis.
- Schwarze et al. (2013) R. Schwarze, A. Gladkyy, F. Uhlig, and S. Luding, Granular Matter 15, 455 (2013).
- Scheel et al. (2008) M. Scheel, R. Seemann, M. Brinkmann, M. Di Michiel, A. Sheppard, B. Breidenbach, and S. Herminghaus, Nat. Mater. 7, 189 (2008).
- Huang et al. (2009a) K. Huang, M. Sohaili, M. Schröter, and S. Herminghaus, Phys. Rev. E 79, 010301 (2009a).
- Fingerle et al. (2008) A. Fingerle, K. Roeller, K. Huang, and S. Herminghaus, New J. Phys. 10, 053020 (2008).
- Huang et al. (2009b) K. Huang, K. Roeller, and S. Herminghaus, Eur. Phys. J. Spec. Top. 179, 25 (2009b).
- Huang (2015) K. Huang, New J. Phys. 17, 083005 (2015).
- Ramming and Huang (2017) P. Ramming and K. Huang, EPJ Web Conf. 140, 08003 (2017).
- Huang and Rehberg (2011) K. Huang and I. Rehberg, Phys. Rev. Lett. 107, 028001 (2011).
- Butzhammer et al. (2015) L. Butzhammer, S. Völkel, I. Rehberg, and K. Huang, Phys. Rev. E 92, 012202 (2015).
- Melo et al. (1994) F. Melo, P. Umbanhowar, and H. L. Swinney, Phys. Rev. Lett. 72, 172 (1994).
- Melo et al. (1995) F. Melo, P. B. Umbanhowar, and H. L. Swinney, Phys. Rev. Lett. 75, 3838 (1995).
- Clément et al. (1996) E. Clément, L. Vanel, J. Rajchenbach, and J. Duran, Phys. Rev. E 53, 2972 (1996).
- Antonyuk et al. (2009) S. Antonyuk, S. Heinrich, N. Deen, and H. Kuipers, Particuology 7, 245 (2009).
- Müller et al. (2011) P. Müller, S. Antonyuk, M. Stasiak, J. Tomas, and S. Heinrich, Granular Matter 13, 455 (2011).
- Gollwitzer et al. (2012) F. Gollwitzer, I. Rehberg, C. A. Kruelle, and K. Huang, Phys. Rev. E 86, 011303 (2012).
- Müller and Huang (2016) T. Müller and K. Huang, Phys. Rev. E 93, 042904 (2016).
- Cundall and Strack (1979) P. A. Cundall and O. D. L. Strack, Géotechnique 29, 47 (1979).
- Zhu et al. (2008) H. P. Zhu, Z. Y. Zhou, R. Y. Yang, and A. B. Yu, Chemical Engineering Science 63, 5728 (2008).
- Rapaport (1980) D. C. Rapaport, Journal of Computational Physics 34, 184 (1980).
- Bizon et al. (1998) C. Bizon, M. D. Shattuck, J. B. Swift, W. D. McCormick, and H. L. Swinney, Phys. Rev. Lett. 80, 57 (1998).
- Luding and McNamara (1998) S. Luding and S. McNamara, Granular Matter 1, 113 (1998).
- Müller and Pöschel (2012) P. Müller and T. Pöschel, Granular Matter 14, 115 (2012).
- Müller and Pöschel (2013) P. Müller and T. Pöschel, Phys. Rev. E 87, 033301 (2013).
- Walton and Braun (1986) O. R. Walton and R. L. Braun, Journal of Rheology (1978-present) 30, 949 (1986).
- Luding (1995) S. Luding, Phys. Rev. E 52, 4442 (1995).
- Ulrich et al. (2009) S. Ulrich, T. Aspelmeier, K. Roeller, A. Fingerle, S. Herminghaus, and A. Zippelius, Phys. Rev. Lett. 102, 148002 (2009).
- Roeller and Herminghaus (2011) K. Roeller and S. Herminghaus, Europhysics Letters 96, 26003 (2011).
- Roy et al. (2017) S. Roy, S. Luding, and T. Weinhart, New J. Phys. 19, 043014 (2017).
- Zhang et al. (2005) P. Zhang, G. Q. Miao, K. Huang, Y. Yun, and R. J. Wei, Chin. Phys. Lett. 22, 1961 (2005).
- Savage (1988) S. B. Savage, Journal of Fluid Mechanics 194, 457 (1988).
- Eshuis et al. (2007) P. Eshuis, K. van der Weele, D. van der Meer, R. Bos, and D. Lohse, Phys. Fluids 19, 123301 (2007).
- Fan et al. (2017) F. Fan, E. J. Parteli, and T. Pöschel, Phys. Rev. Lett. 118, 218001 (2017).