The Hiperwall Visualization Platform for Big Data Research
Abstract
In the era of Big Data, with the increasing use of large-scale data-driven applications, the visualization of very large high-resolution images and extracting useful information (searching for specific targets or rare signal events) from these images can pose challenges to the current video-wall display technologies. At Bellarmine University, we have set up an Advanced Visualization and Computational Lab (AVCL) using a state-of-the-art next generation video-wall technology, called Hiperwall (Highly Interactive Parallelized Display Wall). The 16 feet wide by 4.5 feet high Hiperwall visualization system consists of eight display tiles that are arranged in a 42 tile format and has an effective resolution of 16.5 Megapixels. Using Hiperwall, we can perform interactive visual data analytics of large images by conducting comparative views of multiple large images in Astronomy and multiple data events in experimental High Energy Physics (HEP). Users can display a single large image across all the display tiles, or view many different images simultaneously on multiple display tiles. Hiperwall enables simultaneous visualization of multiple high resolution images and its contents on the entire display wall without loss of clarity. Hiperwall’s middleware also allows researchers in geographically diverse locations to collaborate on large scientific experiments. In this paper we will provide a description of a new generation of display wall setup at Bellarmine University that is based on the Hiperwall technology, which is a robust visualization system for Big Data research.
1 Introduction
Finding new information and patterns in Big Data is the current imperative [16]. Large-scale data driven applications are on the rise, and so is the need to extract useful information from terabyte and petabyte scale data sets (Big Data). Additionally, the resolution of large images and the vast amount of data from large scientific instruments is also increasing which poses visualization issues of very large images that require a larger viewing area to capture the details [8]. So, visualizing multi-dimensional, time-varying data sets is both a challenge to the computational infrastructure and to the current display technologies.
In this paper we have focused on a novel visualization and display technology for displaying large high resolution images from large-scale data sets. A single computer monitor can constrain the way in which we can analyze large volumes of data events. We can view either a low-resolution image that represents the entire extent of the data events and thus risk missing smaller detail, or we can view small portions of the data events in high resolution while losing the full context. In order to understand the complex Big Data analysis environment for extracting new information, we need advance visualization and analytics tools for Big Data environments [2].
With Hiperwall, we can see both the broad view of the data sets and the details concurrently which enables the shared view of complex results. With our Hiperwall visualization system, we can display extremely large images, conduct interactive analysis of large data sets, view multiple images or parameters of large data sets, and conduct a comparative view of many data sets (multiple data events) at once and stream HD videos from remote collaborators (e.g. from CERN) [1][5].
1.1 Visual and data analytics with Hiperwall
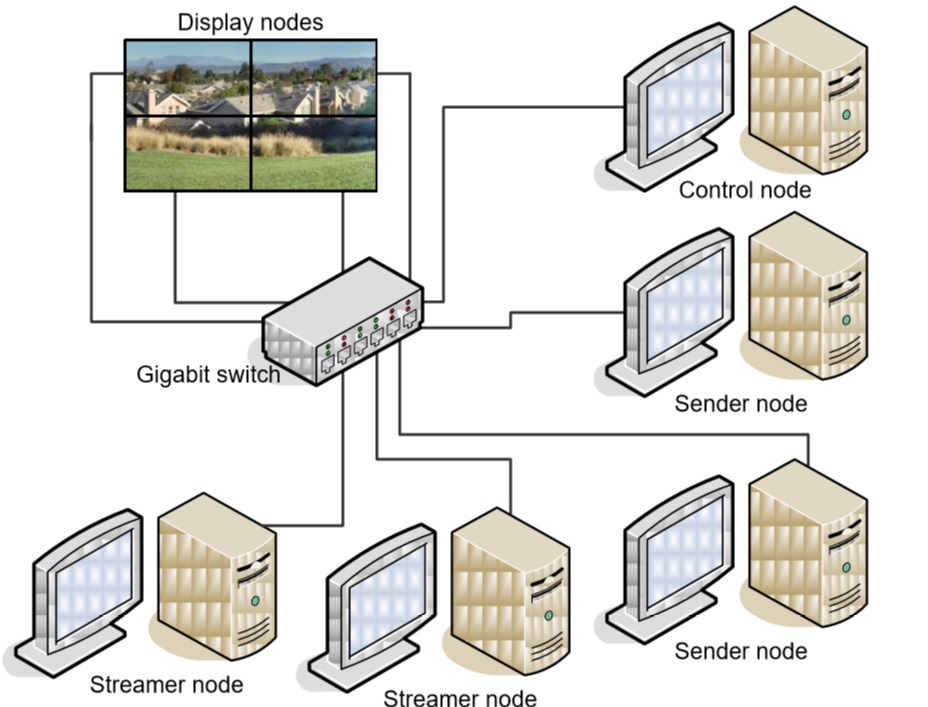
Display walls that show large quantities of information at a single glance have traditionally been the domain of air-traffic control centers, NASA command centers, TV/News stations, and big budget corporations [15]. In recent years, very few such display walls have been installed in research labs at the large research universities. Hiperwall started as a research project funded by a NSF grant at UC Irvine’s California Institute for Telecommunications and Information Technology (Calit2) [4][9]. It was designed to be a collaborative visualization platform capable of displaying information in real time. The Hiperwall software runs as an application operating on standard PCs connected via a standard 1 Gbps network switch. (See Figure 1 for terminology/topology overview of the Hiperwall visualization system).
Hiperwall is a high performance, high resolution visualization system. Hiperwall’s visualization system software architecture applies parallel processing techniques to overcome the performance limitations typically associated with the display of large multiple images on multiple display devices (flat-panel tiles) simultaneously. Hiperwall is a collaborative visualization platform that is designed to visualize enormous data sets and allows viewers to see the details, while retaining the context of the surrounding data. This allows a group of scientists/researchers/students to collaborate and share detailed information. The Hiperwall system allows the user to display a wide variety of high-resolution 2D and 3D images, animations, movies, and time-varying data in real time all at once on multiple display tiles that can be configured according to the needs of the user. Users can project a single image across the entire display area or many different images simultaneously. Hiperwall’s middleware even allows researchers in geographically diverse locations to collaborate on Big Scientific Experiments that generate Big Data.
Members of this research team from Bellarmine University have recently joined the Large Synoptic Survey Telescope (LSST) project and are part of LSST’s Dark Energy Science Collaboration (DESC). Equipped with a 3.2 Gigapixel camera (the world’s largest digital camera), the goal of the LSST project is to conduct a 10-year survey of 37 billion stars and galaxies that will deliver large volumes of images and data sets (astronomical catalogs) that is thousands of times larger than have ever previously been compiled to address some of the most pressing questions about the structure and evolution of the universe, such as understanding the mysterious Dark Energy that is driving the acceleration of the cosmic expansion.
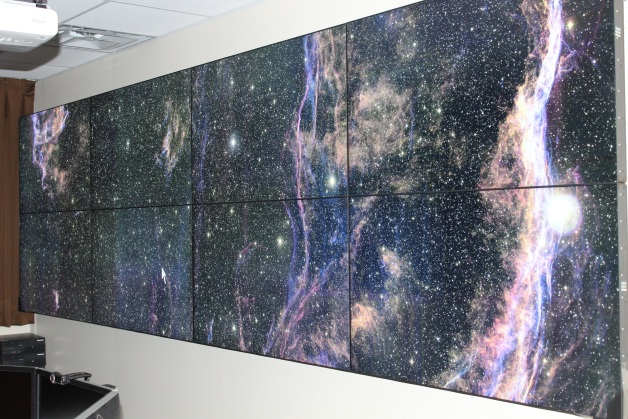
LSST will produce 15 Terabytes of raw data images per night, that’s about 200 Petabytes of imaging data over the ten years of operation, which will be the largest data set in the world [12][10]. Bellarmine’s Hiperwall visualization system will be used for data analytics to study and visualize some of these large LSST images in order to extract useful and specific information from these large high resolution images. Figure 2 shows a portion of a high resolution image of a supernova remmant displayed on the Hiperwall Display Wall.
In the field of experimental High Energy Physics (HEP), the four big HEP experiments (ATLAS, CMS, LHCb, and ALICE) at the LHC (Large Hadron Collider) at CERN in Switzerland are producing colossal volumes of data (Big Data). As of June 2017, these HEP experiments at the LHC have recorded over 200 Petabytes of raw data that are stored permanently at the CERN Data Center (DC) [13].
When proton beams collide head-on at high energies inside the LHC detectors, new subatomic particles are created that decay in complicated ways as they travel through layers of the detector. The collision energy is converted into mass that create these short-lived subatomic particles. Currently, protons collide head-on inside the LHC detectors at an unprecedented rate of 1 billion times per second [13]. Most (99%) of the raw data events are filtered out by the LHC experiments, and the “interesting” data events are stored for further analysis. The filtered LHC data are stored at the CERN Data Center, where the initial data reconstruction is performed [13]. Even after this data reduction, the CERN Data Center (Tier0 Grid site) processes on average about one petabyte of data per day the equivalent of around 210,000 DVDs [3]. In fact, in 2017, even after filtering out 99% of the raw data, around 50 Petabytes of data will be stored [18]. That’s 50 thousand Terabytes of data, the equivalent to nearly 15 million HD movies [18]. This complex data that are stored can be retrieved and accessed by thousands of LHC physicists worldwide for analysis via the WLCG (Worldwide LHC Computing Grid) and the OSG (Open Science Grid) cybeinfrastructure that is based on tiered grid computing technology. On any given day, on average, more than two million grid jobs run on WLCG and OSG for the LHC experiments.
These subatomic particles that decay within the detector, leaves tracks or signatures of their presence that are registered by converting the particles’ paths and energies into electrical signals to create a digital snapshot of the “collision event”. High Energy Physicists have to carefully analyze these collision data events using dedicated algorithms, such as multivariate analysis (MVA) techniques, to filter out the myriad backgrounds in the collision data events and identify new subatomic particles (rare signal events), which could result in a new particle discovery.
2 Hiperwall terminology and hardware components
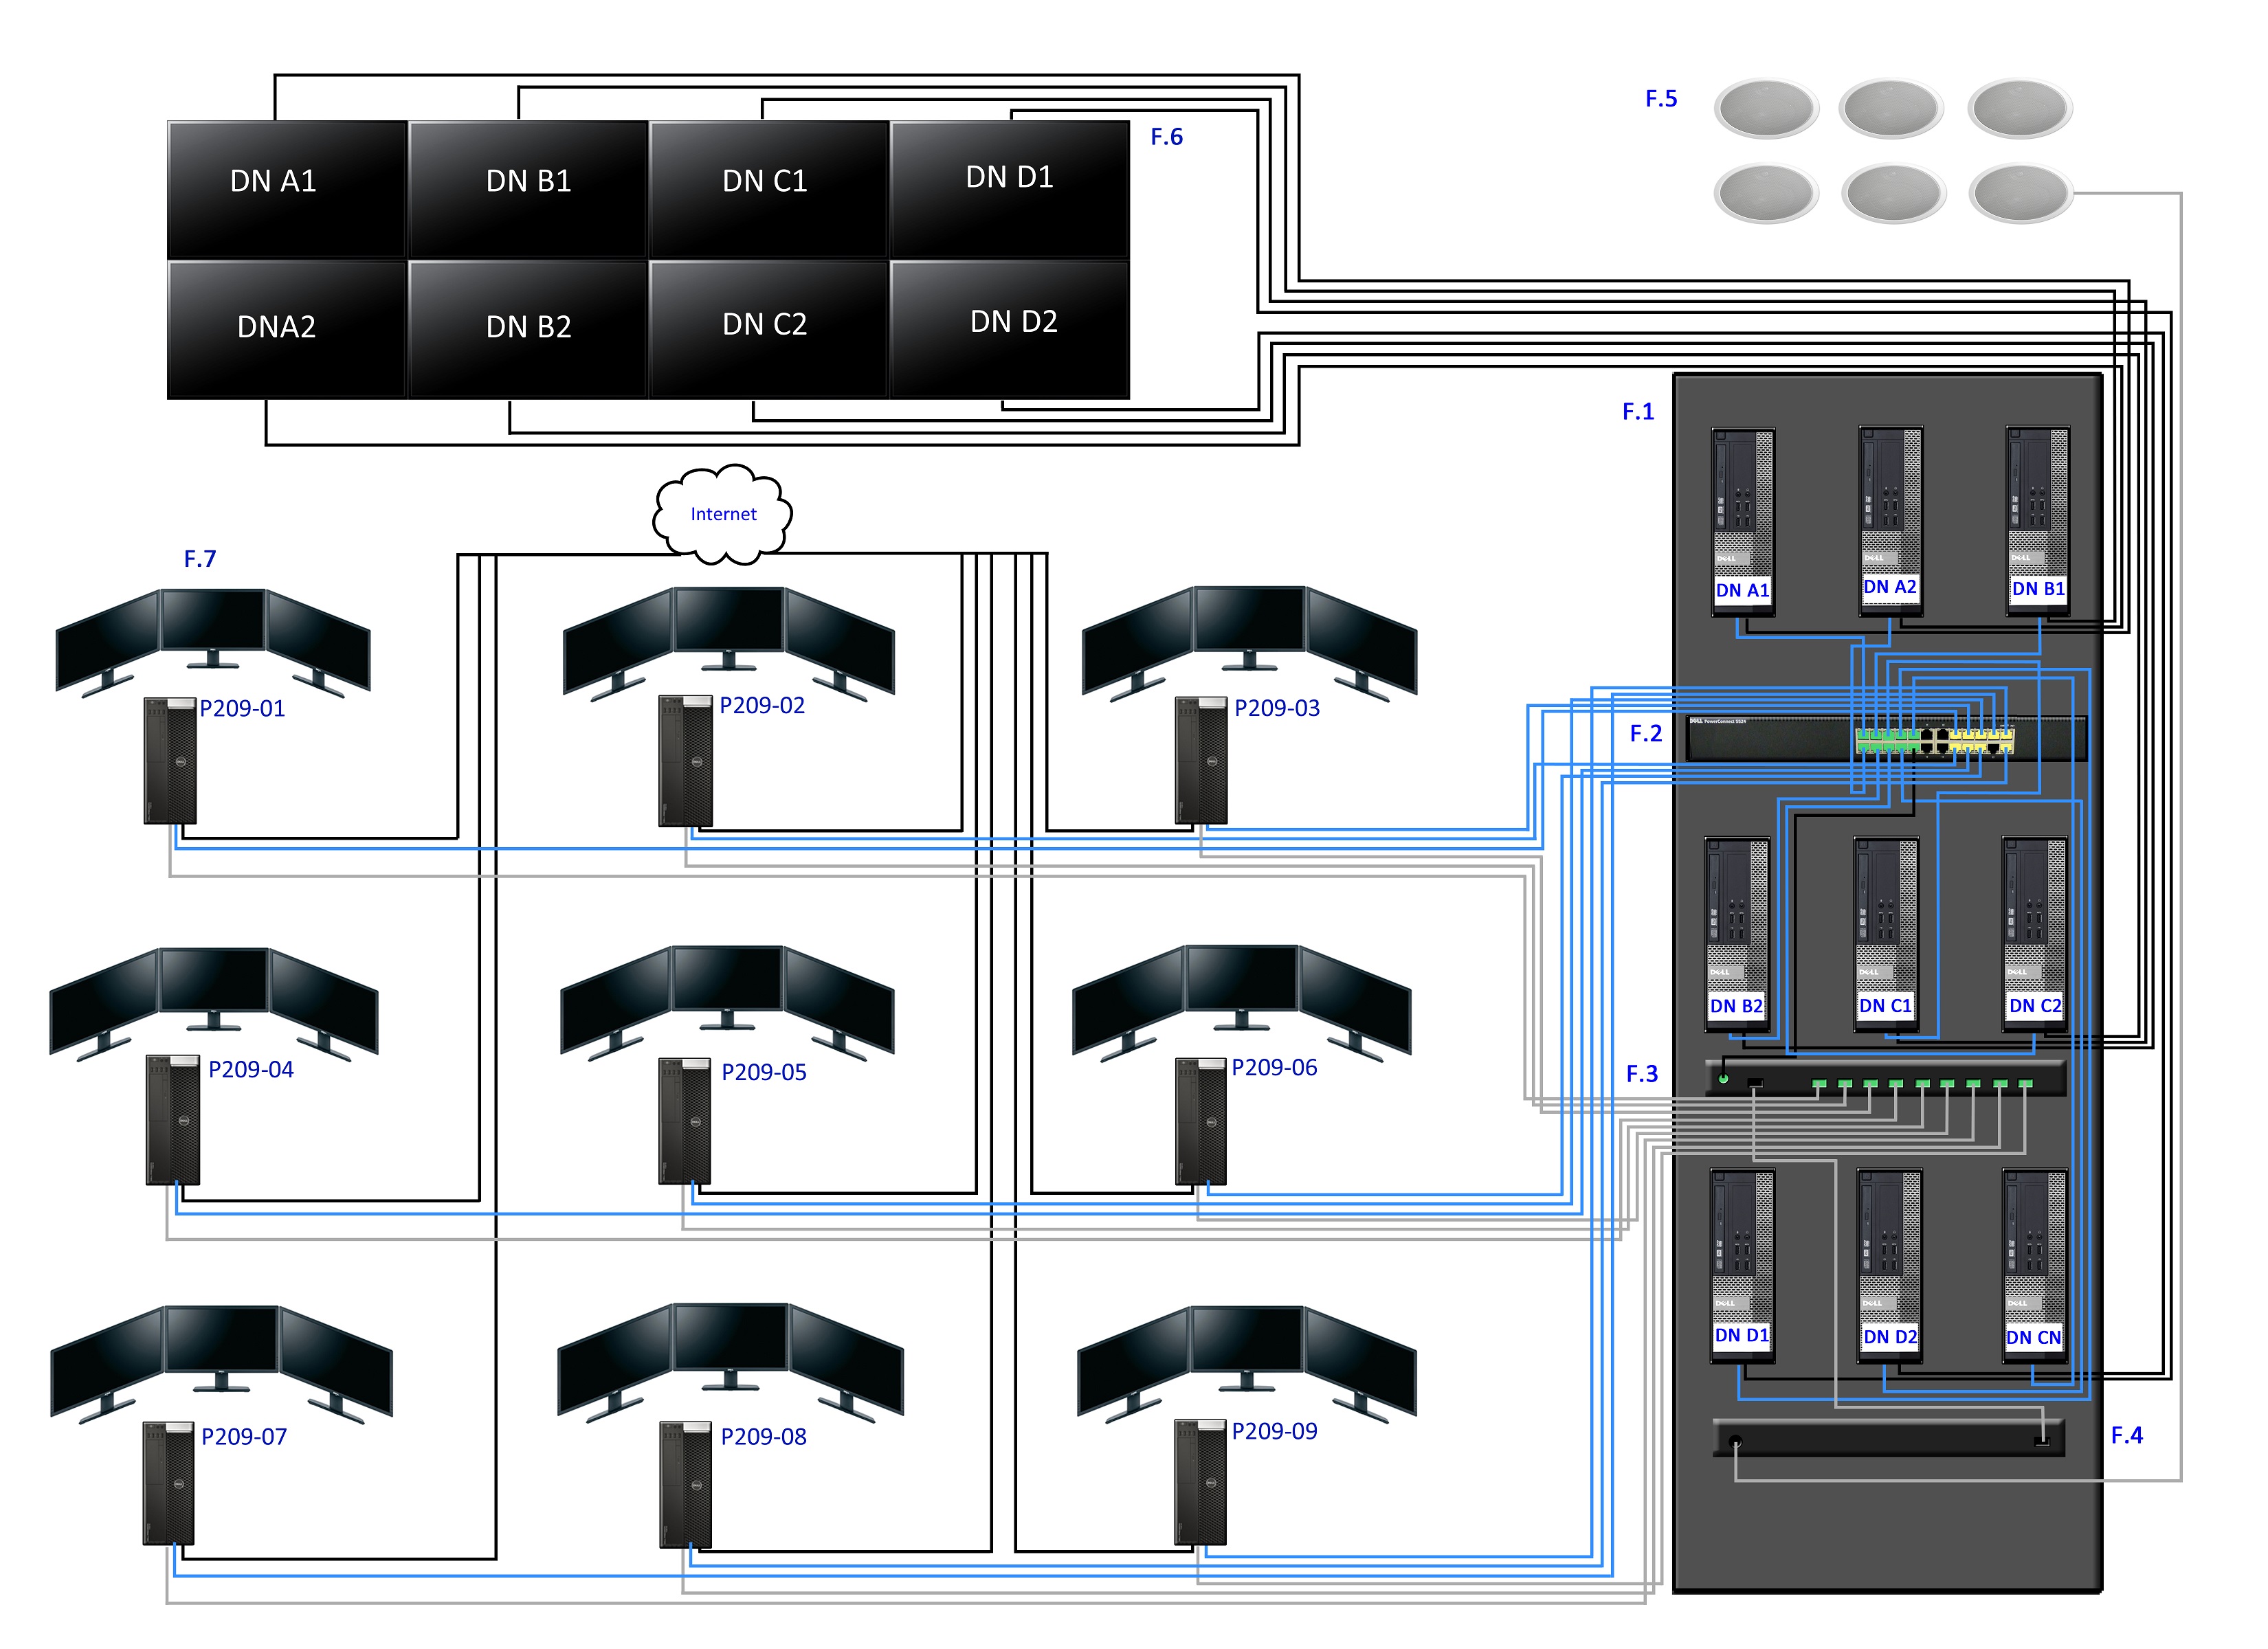
In this section we describe the Hiperwall terminology/topology (as shown in Figure 1), that includes the main Hiperwall hardware components and the schematics of the Hiperwall visualization system, shown in Figure 3. Our Hiperwall display wall is connected to 9 high-end Data Analysis workstations equipped with dual-NVIDIA multi-core graphics technology that provides parallel processing capabilities needed to visualize very large data sets quickly and efficiently. A description of Hiperwall hardware components and specifications are listed in Table 1.
| Figures | Hiperwall Visualization System Hardware Components and Specifications |
|---|---|
| Figure 3.F.1 | Hiperwall Visualization Cluster (1 Control and 8 Display Nodes) A. Rack-Mounted Control and Display Nodes: 9 Dell Optiplex 7010 PCs on a 40U Rack (1 Control Node and 8 Display Nodes) Specs for each node: Gen Intel Core 3.4 GHz i7–3770 Processor; 4 GB 1600 MHz DDR3 RAM; 1 GB RAM AMD RADEON HD 7570 Graphics Card; 500 GB Hard Drive (Total RAM: 9 GB; Total Hard Drive Space of 4.5 TB). Operating System: Windows 7 (64-bit). B. Secondary Control Node (Not Shown in Figure 3): Dell Latitude 10 Tablet. Specs: 1.8 GHz Z2760 Intel Atom processor; 2 GB RAM; 533 MHz Intel Graphics Media Accelerator Graphics Card; 2 GB DDR2 SDRAM RAM; 64 GB Hard Drive. Operating System: Windows 8 Pro (32-bit). |
| Figure 3.F.2 | 1 Gbps 24-port Network Switch: 1U Rack-Mount Dell 1 Gbps 24-Port PowerConnect 2824 Switch. |
| Figure 3.F.3 | Audio Digital Signal Processor: Biamp Nexia-CS-10 mic/line inputs and 6 mic/line outputs. |
| Figure 3.F.4 | Audio Power Amplifier: 2U Rack-Mount TOA 900 Series-II P-912MK2. |
| Figure 3.F.5 | Ceiling Speakers: 6 Ceiling-Mounted Speakers, Atlas Sound FAP62T (Strategy-II series) 6”, 32W. |
| Figure 3.F.6 | Display Wall: 8 commercial-brand 55” Samsung LED (backlit) HDTV (Model UD55C). Average Bezel size = 0.1 inch (2.75 mm). Display Wall Layout: 42; Effective resolution (41920) (21080) = 76802160 (16.5 Megapixels). Display Wall Dimensions: Width = 16 feet (4.9 m) and Height = 4.5 feet (1.4 m); Bezel-to-Bezel = 0.2 inch (5.5 mm). Connection from Control/Display nodes to display wall: HDMI. |
| Figure 3.F.7 | Sender/Streamer Nodes (9 Data Analysis Workstations): 9 Dell T5600 Workstations each connected to three 24” monitors. Specs for each Workstation: Each Node has a Dual-Four Core 3.3 GHz Xeon E5–2643 processor; 64 GB DDR3 RDIMM RAM; 2 GB2 GB RAM NVIDIA Quadro Graphics Cards; two CUDA-768 cores (1536 CUDA cores) per workstation; 4 TB Hard Drive (Total RAM: 576 GB; Total Hard Drive Space: 36 TB). Operating System: Dual-Boot Windows 7 (64 bit) and Scientific Linux 6.4. |
2.1 The control node
The control node (labeled as DN CN in Figure 3) is the brains behind the Hiperwall system. It gives the user the ability to control what, where, how, and when the contents are displayed. The user interface shows a miniature view of the eight Hiperwall display tiles. The interactive Hiperwall drag-and-drop simplicity gives the user the ability to place contents on the display tiles.
2.2 The secondary control node
The secondary control node provides the user the ability to control the Hiperwall system (nodes) remotely from a distant location via a portable device, such as a tablet. The secondary control node is not shown in Figure 3.
2.3 The display node
The 8 display node PCs in the rack (labeled as DN A1 through DN D2) as shown in Figure 3.F.1 are connected to the Hiperwall display tiles (one display node for each display tile). Each display node consists of a display device that is driven by a PC (mini-tower or rack-mount) running the Hiperwall software. The Hiperwall software runs as an application operating on a standard PC connected via a standard 1 Gbps network switch. Hiperwall’s tiled display system software architecture applies parallel processing techniques to overcome the performance limitations typically associated with the display of large multiple images on multiple display devices (flat-panel tiles) at once. A display node software receives content over a 1 Gbps network switch from a sender or a streamer node and displays it on wall tile via a HDMI cable. All display-node computers work in parallel, thus giving flexibility and scalability while also allowing the user to place contents on one or more multiple display tiles all at once.
2.4 The display wall
Each of the 8 display tiles (labeled as DN A1 through DN A2) as shown in Figure 3.F.6 are connected to the corresponding display node PC in the rack. The display wall displays the contents from the user’s Workstation (sender and streamer nodes) onto the display wall (flat-panel tiles) via the control node. Each tile is a high-end commercial-brand 55” (UD55C) Samsung LED (backlit) HDTV with a very narrow bezel size of about 2.75 mm (0.1 inch). Actually, the upper and the left bezel size is 3.7 mm (about 0.15 inch), whereas the bottom and the right bezel is 1.8 mm (about 0.07 inch). Each of the display node PCs is responsible for displaying and and rendering a portion of the overall image that is being shown/displayed on the Hiperwall. Thus, all the PCs work in parallel to render the total image.
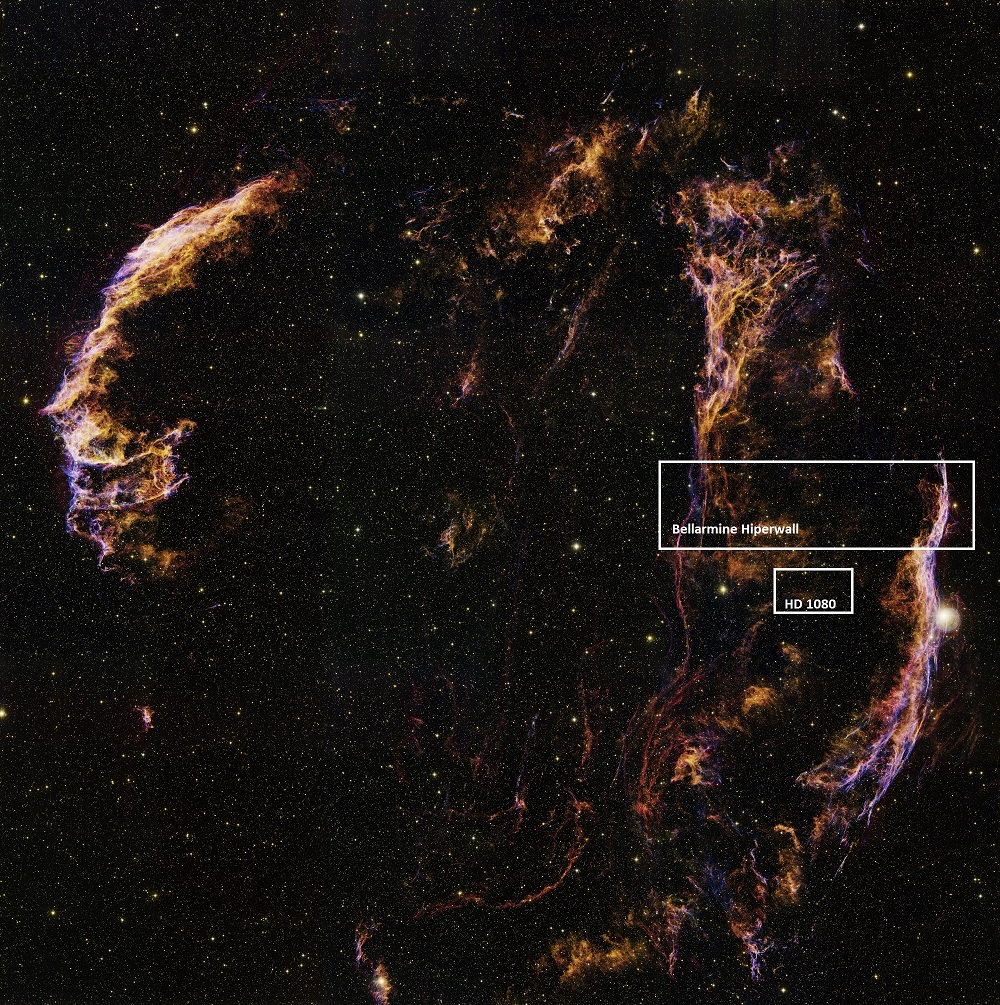
The Hiperwall software runs on each display node and renders images though the control node which transfers the data displayed on Hiperwall display tiles via display nodes. The Hiperwall system provides robust visualization of multiple forms of display and monitoring capabilities simultaneously with a lot of user flexibility. With the Hiperwall visualization system we can display various types of images (1 GB or larger) and contents on the display wall. We can add, resize, scale, rotate, zoom and reposition large images, charts, plots and HD video feeds for visualization, simultaneously. Users can spread one large piece of image or spread a variety of images across the entire display wall. In our setup, the 8 Hiperwall display tiles are arranged in a 42 format. The display wall is 16 ft wide by 4.5 ft high with an effective bezel-to-bezel size of only 0.2 inch (5.5 mm). The effective resolution is 76802160 pixels which is about 16.5 Megapixels. Figure 4 shows an actual 2445724576 pixels (600 Megapixels) large astronomical image of a supernova remnant. In comparison, the total viewing area of our Hiperwall Display Wall and a standard HD 19201080 (2 Megapixels) monitor are shown as white boxes. A single LSST image [17] will be about five times larger than this astronomical image.
2.5 The sender/streamer nodes
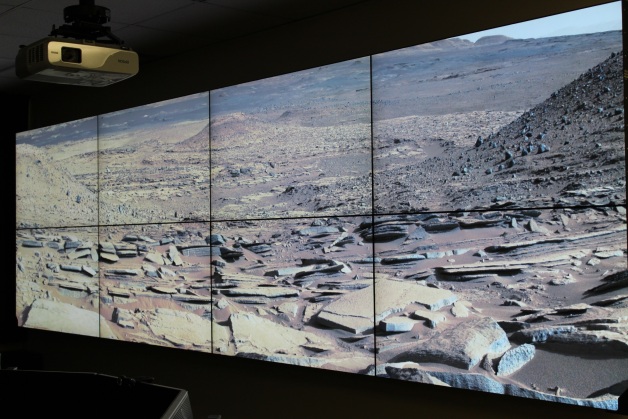
The sender and streamer nodes deliver content to the Hiperwall display tiles via the 1 Gbps network switch. The sender/streamer nodes are high-end workstations. It is called a sender node if it is running the Hiperwall sender software license for displaying still images and animations. A streamer node runs the Hiperwall streamer software license for displaying HD videos. Sender nodes allow users to view the contents of the monitor(s) connected to the users’ workstation. The sender/streamer nodes can run multiple applications of the Hiperwall sender/streamer software. A Java application allows the output of the user’s application to be transported across the network for viewing on the Hiperwall display wall tiles. Users can send the entire screen to the display wall or divide it up into rectangular regions and deliver each region to the Hiperwall as an independent object. Figure 5 shows a high resolution picture of the surface of Mars taken by NASA’s Curiosity rover that was displayed/projected from one of the sender nodes (workstation) onto the Hiperwall Display Wall.
The screen sender software can also run remotely. At Bellarmine, we have 11 sender licenses and 1 streamer license, allowing us to have up to 12 display projections at a time. Streamer software can provide high frame rate feeds to the Hiperwall displays and are used for HD videos and animations. The streamer system can stream up to 60 frames per second (FPS) at a resolution of 1080P or higher. FPS is the frequency (rate) at which an imaging device produces consecutive images. 60 FPS is typically used because high definition televisions (HDTV) are designed around 60 Hz signals as a common base capability. 60 FPS is optimal to the eye and gives a much more realistic sense of motion for what is happening on the screen [11]. A high resolution image or HD video feed can be enlarged and stretched across the entire display wall or multiple arrangements of many images or HD video feeds can be arranged in any size or position across the display tiles and zoomed without loss of clarity.
3 Collaborative research and learning environment
Hiperwall display wall system provides a dynamic and interactive learning experience for students. Hiperwall technology lets teachers, students, and researchers view large amounts of information using PCs via a regular Ethernet connection. Students can also connect from laptops or tablets to view information. Teachers can better engage with students, turning traditional classroom lectures into an interactive, collaborative, and enriching experience. Hiperwall technology allows students, teachers, and researchers to visualize large Terabyte-size data sets with high resolution and to conduct interactive visual analytics of large data sets.
We have written a User’s Manual for the Bellarmine Hiperwall Visualization System with input from undergraduate students who are our primary users. We have also designed and developed a web-portal interface that allow users to select specific display-tile arrangements for visualization at the click of a button, based on the what is displayed on the user’s Data Analysis Workstation’s (sender/streamer nodes) triple monitors.
4 Conclusion
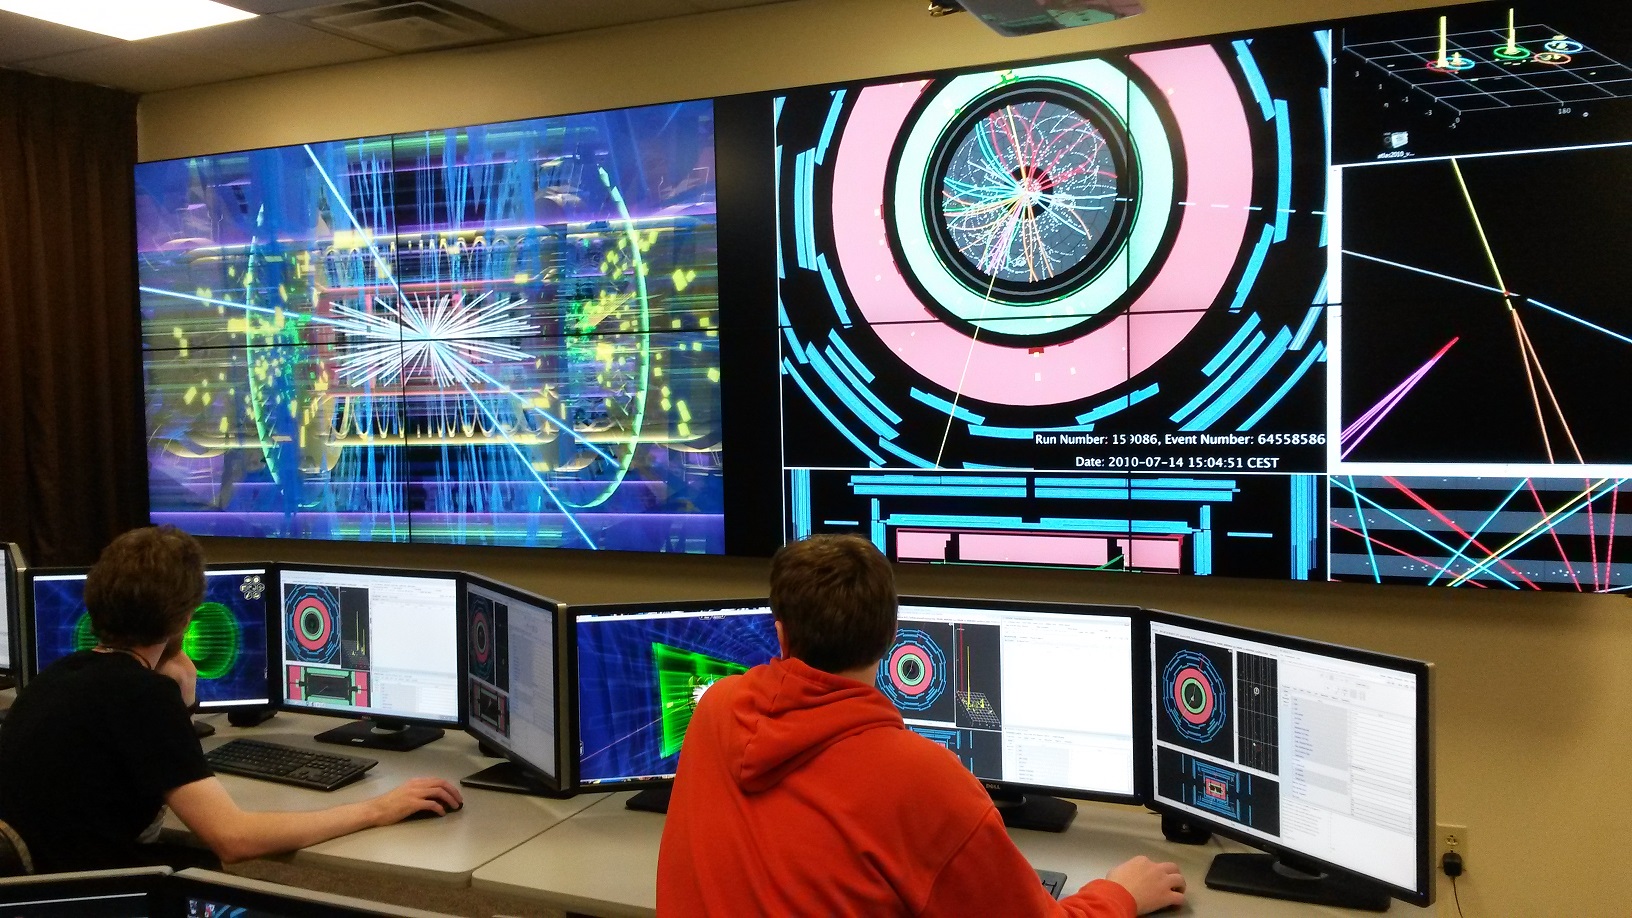
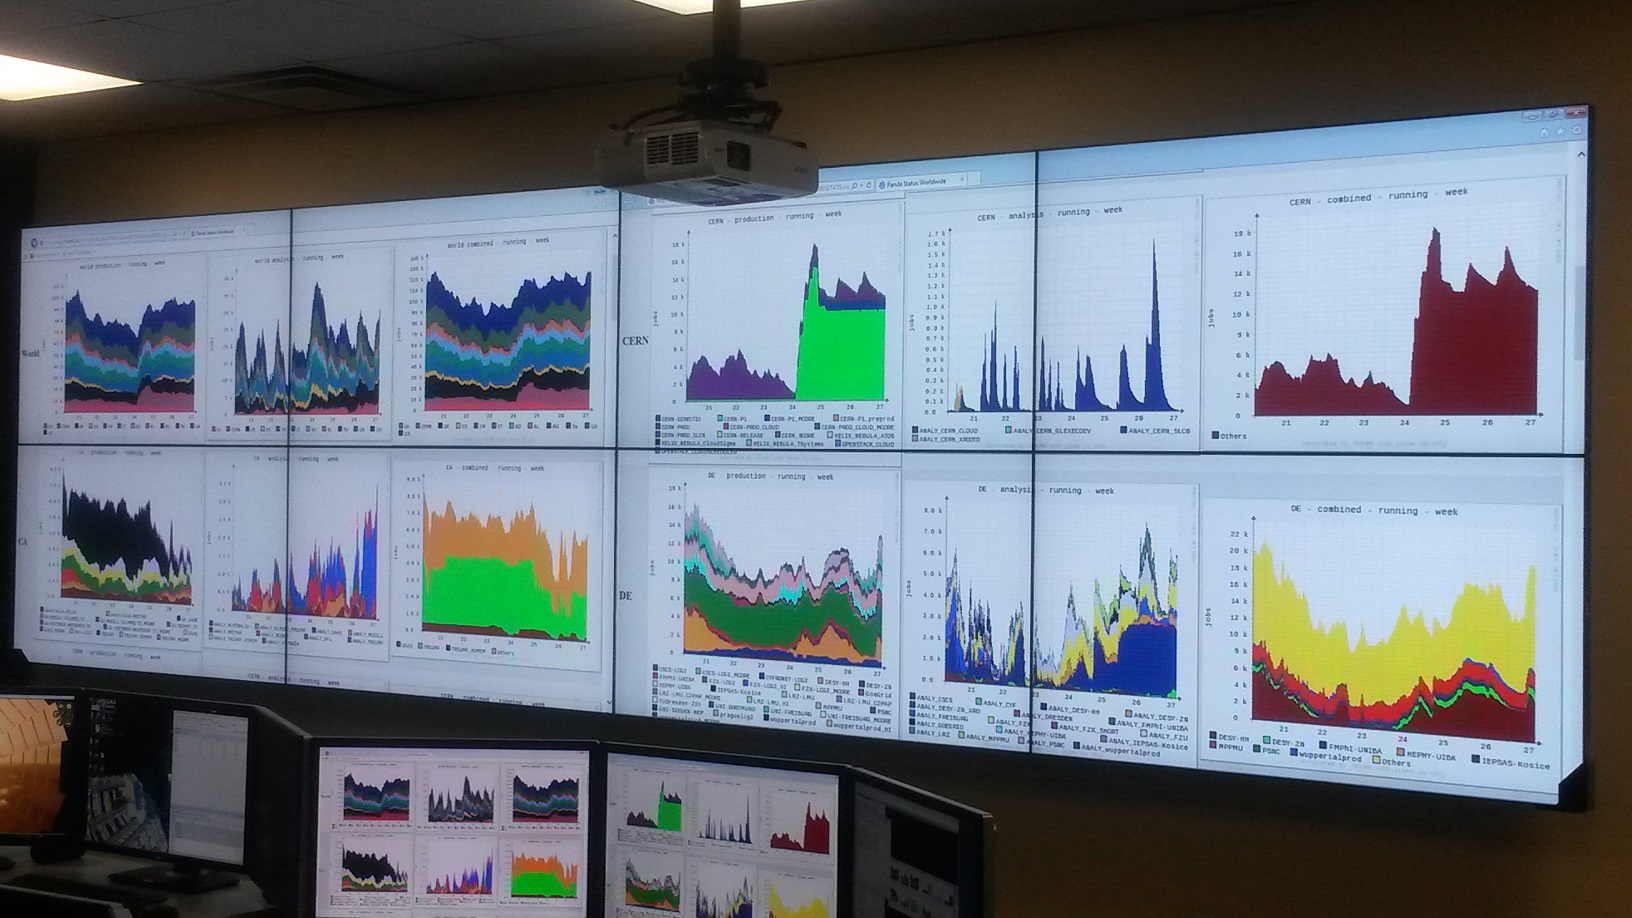
We have described the Hiperwall visualization system setup at Bellarmine University to display large images in Astronomy to enhance the display size and for interactive data analysis for HEP (High Energy Physics) data events from the ATLAS experiment at the LHC (Large Hadron Collider) at CERN. Figure 6 shows students in the AVCL Lab analyzing particle tracks from the High Energy Physics (HEP) proton-proton collision data events. As shown in Figure 7, we have also used the Hiperwall Display Wall for visual analytics to monitor grid jobs. We broke new ground by being the first undergraduate institution in the US (and the only institution in Kentucky) to implement the Hiperwall technology in the field of High Energy Physics.
The Hiperwall technology has an architectural advantage since Hiperwall runs on standard PCs connected to standard Ethernet network, thus eliminating the need for specialized switches and servers. Each display node renders its own portion of the display, thus eliminating the bottlenecks associated with central servers that make Hiperwall a robust visualization system. The key breakthrough of the Hiperwall system is the distributed software architecture that overcomes performance limitations typically associated with the display of numerous large contents on multiple display tiles. This paper suggests a cost-effective solution for visualizing high resolution large-scale data-driven images and applications with a broad view using the Hiperwall visualization system based on the setup at Bellarmine University’s Advanced Visualization and Computational Lab (AVCL)111It must be noted that purpose of the Hiperwall is not about increasing resolutions. Once the original image has been created the resolution can not be changed. The Hiperwall can increase image size by adding pixels by interpolation methods, but the original information is not increased. Therefore, the purpose of the Hiperwall is to be able to show detail while showing more area. The user gains more visible area of the image without losing detail..
The Hiperwall visualization system is an effective way to display a large image or multiple images on display tiles. We have also used the Hiperwall visualization system successfully for conducting workshops on virtual Physics Labs as well as interactive workshops on Python in a classroom setting. So we have demonstrated that the Hiperwall visualization system can also be used as a collaborative and interactive learning environment in classrooms. Hiperwall visualization system is also useful for collaborative research work with other institutes by allowing researchers, teachers, students to visualize and analyze the data with high resolution and to conduct interactive analysis for large data sets over the internet.
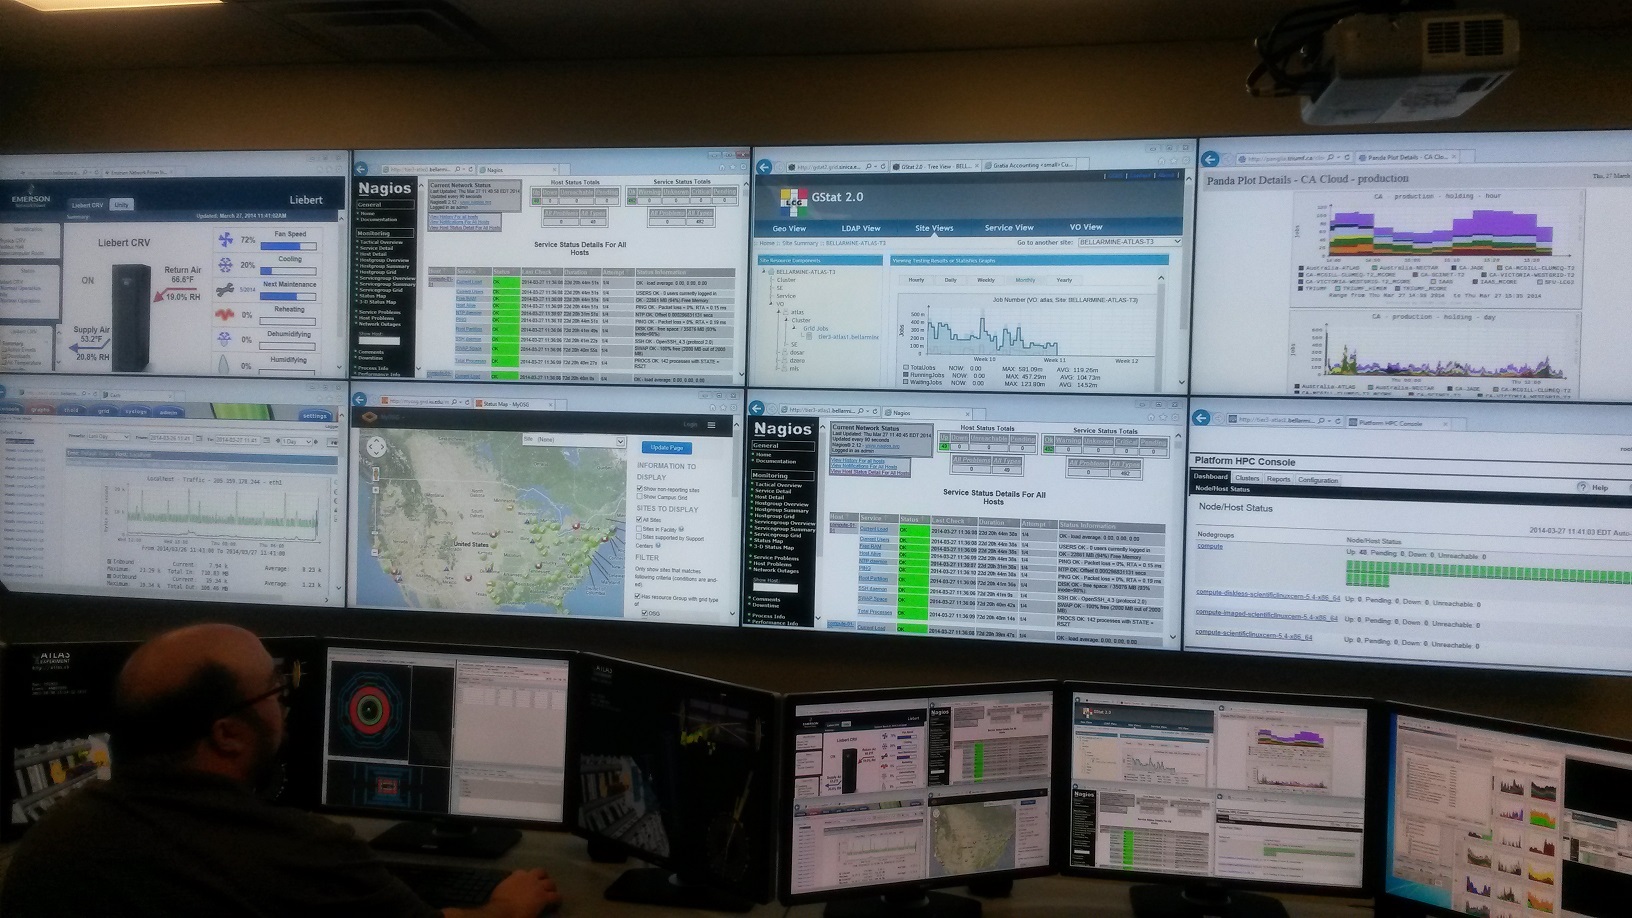
The Hiperwall is an effective visualization system for Big Data applications, telecommunications, and for conducting visualization studies of large-scale images and data events from Big Science experiments in experimental High Energy Physics (HEP), Astrophysics, and Astronomy. Hiperwall Visualization System can also be used as a Operations/Command center for grid sites on OSG (Open Science Grid), like the NASA mission Operations/Command center. At Bellarmine University we have also used the Hiperwall Visualization System as a Tier2 OSG Grid Operations/Command Center, as shown in Figure 8.
Acknowledgements
The authors would like to thank the National Science Foundation (Grant #1229306 and #1154454) and the Henry Luce Foundation (Clare Boothe Luce Program) for supporting this research project.
References
- [1] Christopher Andrews, Alex Endert, Beth Yost, and Chris North. Information visualization on large, high-resolution displays: Issues, challenges, and opportunities. Information Visualization, 10(4):341–355, 2011.
- [2] Robert Ball and Chris North. Effects of tiled high-resolution display on basic visualization and navigation tasks. In CHI’05 extended abstracts on Human factors in computing systems, pages 1196–1199. ACM, 2005.
- [3] CERN Computing. CERN Computing, 2017. [Online].
- [4] Science Coalition. See the big picture, sparking economic growth 2.0- companies created from federally funded university research fueling american innovation and economic growth, 02 2010. [Online].
- [5] Alex Endert, Lauren Bradel, Jessica Zeitz, Christopher Andrews, and Chris North. Designing large high-resolution display workspaces. In Proceedings of the International Working Conference on Advanced Visual Interfaces, pages 58–65. ACM, 2012.
- [6] Charles Hansen, Chris R. Johnson, Valerio Pascucci, and Claudio T. Silvia. Visualization for Data-Intensive Science. Center for Coastal Margin Observation and Prediction, 2011.
- [7] Hiperwall. Hiperwall User’s Guide for software version 4.0, 2015. [Online].
- [8] Han Hu, Yonggang Wen, Tat-Seng Chua, and Xuelong Li. Toward scalable systems for big data analytics: A technology tutorial. IEEE access, 2:652–687, 2014.
- [9] Innovate Tech Ventures LLC. High Tech Startup Directory, 2014. [Online].
- [10] Zeljko Ivezic, JA Tyson, B Abel, E Acosta, R Allsman, Y AlSayyad, SF Anderson, J Andrew, R Angel, G Angeli, et al. LSST: from science drivers to reference design and anticipated data products. arXiv preprint arXiv:0805.2366, 2008.
- [11] Lifewire. How Are Video Frame Rate and Screen Refresh Rate Different, 2017. [Online].
- [12] LSST Dark Energy Science Collaboration et al. Large synoptic survey telescope: dark energy science collaboration. arXiv preprint arXiv:1211.0310, 2012.
- [13] Mélissa Gaillard. Cern data centre passes the 200-petabyte milestone, 07 2017. [Online].
- [14] NASA/JPL-Caltech/MSSS. Strata at base of mount sharp, 10 2015. [Online].
- [15] New ATLAS-New Technology and Science News. Hiperwall software video wall uses normal pcs and monitors, 02 2010. [Online].
- [16] Oracle. The Big Data Imperative-Compressing The Analysis-To-Action Life Cycle, 1 2017. [Online].
- [17] T.A. Rector, Richard Cool, and WIYN/NOAO/AURA/NSF. Modified from image ”giant supernova remnant, cygnus loop”, 2 2017. [Online].
- [18] WLCG. World Wide Computing Grid-, 2017. [Online].