Planck intermediate results. LIV.
The Planck Multi-frequency Catalogue of Non-thermal Sources
This paper presents the Planck Multi-frequency Catalogue of Non-thermal (i.e. synchrotron-dominated) Sources (PCNT) observed between 30 and 857 GHz by the ESA Planck mission. This catalogue was constructed by selecting objects detected in the full mission all-sky temperature maps at 30 and 143 GHz, with a signal-to-noise ratio (S/N) in at least one of the two channels after filtering with a particular Mexican hat wavelet. As a result, 29 400 source candidates were selected. Then, a multi-frequency analysis was performed using the Matrix Filters methodology at the position of these objects, and flux densities and errors were calculated for all of them in the nine Planck channels. This catalogue was built using a different methodology than the one adopted for the Planck Catalogue of Compact Sources (PCCS) and the Second Planck Catalogue of Compact Sources (PCCS2), although the initial detection was done with the same pipeline that was used to produce them. The present catalogue is the first unbiased, full-sky catalogue of synchrotron-dominated sources published at millimetre and submillimetre wavelengths and constitutes a powerful database for statistical studies of non-thermal extragalactic sources, whose emission is dominated by the central active galactic nucleus. Together with the full multi-frequency catalogue, we also define the Bright Planck Multi-frequency Catalogue of Non-thermal Sources (PCNTb), where only those objects with a at both 30 and 143 GHz were selected. In this catalogue 1146 compact sources are detected outside the adopted Planck GAL070 mask; thus, these sources constitute a highly reliable sample of extragalactic radio sources. We also flag the high-significance subsample (PCNThs), a subset of 151 sources that are detected with in all nine Planck channels, 75 of which are found outside the Planck mask adopted here. The remaining 76 sources inside the Galactic mask are very likely Galactic objects.
Key Words.:
catalogs – cosmology: observations – radio continuum: general – submillimeter: general1 Introduction
This paper, one of a series associated with the 2015 release of data from the Planck111Planck (http://www.esa.int/Planck) is a project of the European Space Agency (ESA) with instruments provided by two scientific consortia funded by ESA member states and led by Principal Investigators from France and Italy, telescope reflectors provided through a collaboration between ESA and a scientific consortium led and funded by Denmark, and additional contributions from NASA (USA). mission (Planck Collaboration I 2016), outlines the construction of the first full-sky multi-frequency catalogue of non-thermal, i.e. synchrotron-dominated sources detected in Planck full-mission (Planck Collaboration I 2016) temperature maps. The main purpose of this catalogue is to provide a full-sky sample of extragalactic radio sources (ERSs), of which the majority show a flat () observed spectral emission distribution222Here we follow the convention , with the observed flux density at frequency and the spectral index. up to sub-mm/far-IR wavelengths. It thus extends to higher frequencies than had been achieved with large-area ground-based surveys (NVSS, FIRST, GB6, Parkes, AT20G, etc.), which are currently limited to centimetre wavelengths. Unlike previous Planck catalogues that were constructed on a frequency-by-frequency basis, this is a fully multi-frequency catalogue of point sources obtained through a multi-band filtering technique, which uses data from both the Low Frequency Instrument (LFI, Planck Collaboration VI 2016) and High Frequency Instrument (HFI, Planck Collaboration VIII 2016). In addition to the aforementioned ERSs, this catalogue also includes several thousands of candidate compact sources of Galactic origin.
As extensively discussed in previous papers that studied the ERS populations observed at millimetre wavelengths (e.g. De Zotti et al. 2005, 2010; Tucci et al. 2011; Planck Collaboration XIII 2011; Planck Collaboration XIV 2011; Planck Collaboration XV 2011; Planck Collaboration Int. VII 2013; De Zotti et al. 2015; Planck Collaboration Int. XLV 2016) the majority of these extragalactic sources are usually classified as flat-spectrum radio quasars (FSRQ) and BL Lac objects, collectively called blazars, and only a few of them are classified as inverted spectrum or high-frequency peaker (HFP) radio sources.333It is widely agreed that HFP sources correspond to the early stages of evolution of powerful radio sources, when the radio emitting region grows and expands in the interstellar medium of the host galaxy before becoming an extended radio source (see e.g. O’Dea 1998; De Zotti et al. 2005).
Blazars are a relatively rare class of active galactic nuclei (AGN) characterized by electromagnetic emission over the entire energy spectrum, from the radio band to the most energetic gamma rays (e.g. Giommi et al. 2012a). They are also characterized by highly variable, non-thermal synchrotron emission with relatively high linear polarization at GHz frequencies (Moore & Stockman 1981) in which the beamed component dominates the observed emission (Angel & Stockman 1980). Interestingly, observations of blazars at mm/sub-mm wavelengths often reveal the transition from optically thick to optically thin radio emission in the most compact regions, i.e. they provide information on the maximum self-absorption frequency and thus of the physical dimension, , of the self-absorbed (optically thick) core region (Königl 1981; Tucci et al. 2011). Their spectral energy distribution (SED) is characterized by two broad peaks in : the first peak, attributed to Doppler-boosted synchrotron radiation, occurs at a frequency varying from to Hz (Nieppola et al. 2006); and the second peak, attributed to inverse Compton scattering, occurs at high gamma ray energies, up to around Hz (see e.g. Giommi et al. 2012a). Because of this second emission peak, blazars constitute a numerous class of extragalactic gamma ray sources. About of the firmly identified extragalactic sources, and about of the associated sources (i.e. of sources having a counterpart with a probability of being the real identification) in the Third Fermi Large Area Telescope (LAT) catalogue, are blazars (3LAC). Thus, knowledge of the blazar population is also very relevant in high-energy astrophysics. Furthermore, because of their very broad spectral emission, blazars are expected to contribute a substantial fraction of the extragalactic background and its fluctuations at both millimetre wavelengths and very high energies, i.e. gamma rays. For all these reasons, this new full-sky multi-frequency catalogue of non-thermal synchrotron ERSs – aimed at filling, albeit partially, the gap between samples selected at mid/near-IR wavelengths (e.g. D’Abrusco et al. 2014) and those collected from space observations at very short wavelengths (Compton-EGRET, Fermi-LAT, Swift/BAT, etc.) – will not only allow the identification of new blazars to be included in multi-frequency catalogues (e.g. Massaro et al. 2009, 2015), but will also help future studies of the blazar phenomenon, of the physical processes occurring in the nuclear region of this class of sources, and of their cosmological evolution.
The outline of the paper is as follows. In Sect. 2 we describe the criteria we follow to select radio source candidates at 30 and 143 GHz by using a blind detection on Planck maps filtered with the Mexican hat wavelet. In Sect. 3 we briefly review the multi-frequency detection method we use to construct our catalogue and we give details about the implementation of this technique on the Planck data. The mathematical description of the method is referred to the Appendix A, while the practicalities of the implementation of the multi-frequency detection technique for Planck data are discussed in Appendix B. The catalogue is introduced in Sect. 4. We also define and introduce in Sect. 4 the Bright Planck Multi-frequency Catalogue of Non-thermal Sources (PCNTb) and also the high-significance subsample (PCNThs). The internal Planck and the external validation of the catalogues and a brief description of their statistical properties are discussed in Sect. 5. The released catalogue is described in Sect. 6. Finally, we summarize our main conclusions in Sect. 7.
2 The input Planck sample
Our list of source candidates is the union of those detected with in either the 30- and 143-GHz maps in total intensity made by Planck. The maps used here are the full-mission ones and cover the entire sky (Planck Collaboration I 2016). We employ two frequencies to detect sources because our multi-frequency analysis typically yields lower flux density detection limits for the same S/N than a single frequency approach (see Sect. 3). Thus the completeness is improved, without compromising reliability. This multi-frequency approach allows us to reduce the single-frequency threshold of used for the PCCS2 (Planck Collaboration XXVI 2016), thus allowing additional candidates to enter the catalogue. Our choice of two Planck bands at 30 and 143 GHz was made to combine the power of observations at low radio frequency (where synchrotron emission is typically dominant in ERS spectra), with the low-noise and minimum-foreground 143-GHz Planck band. Note that ERSs still dominate the source counts at 143 GHz, as displayed and discussed, e.g. in figure 25 of the PCCS2 paper (Planck Collaboration XXVI 2016) and also in figure 10 of (Planck Collaboration Int. VII 2013). Had we only selected sources at 30 GHz, we would have taken the risk of losing inverted spectrum sources, whose spectra can be rising well above 30 GHz, as well as high-frequency peakers (HFPs, see for example Snellen et al. 1998), which display a very distinct spectral emission, peaking up to millimetre wavelengths. Given the main purpose of this paper – i.e. the selection of a full-sky sample of non-thermal ERSs – the adopted selection criteria help to ensure that we are not defining a sample/catalogue that is biased in origin against some particular ERS population, detectable in principle by the Planck full-sky surveys.
The pipeline used to produce the two initial lists of source candidates at 30 and 143 GHz with is the same one used to produce the PCCS (Planck Collaboration XXVIII 2014) and PCCS2 (Planck Collaboration XXVI 2016) low frequency catalogues. For convenience, we use Planck maps upgraded to a common resolution parameter (using HEALPix, Górski et al. 2005). One of the characteristics of this pipeline is a two-step analysis, first performing a blind detection in the full-sky map, and, second, repeating the analysis in a non-blind fashion at the positions of the sources detected in the first step. The goal of this multi-step analysis is to reduce the number of spurious detections introduced by the filtering approach in the borders of the cut-out patches, and to measure the flux density of sources and background noise in an optimal way. In practice, in the first step the sky is projected onto a sufficient number of overlapping square flat patches ( . ., pixels in size) such that even after removing the sources detected near the edges of the patch, the full sky was effectively analysed. Second, at the position of the remaining source candidates, a new patch (with the same dimensions) is constructed, redoing the filtering and optimization of the Mexican hat wavelet scale, but this time focusing on the centre of the image, re-assessing the S/N of the source. Sources that in this second step do not meet the criterion are rejected. Since the patches overlap in order to smoothly cover the entire sky (see the details in Planck Collaboration XXVIII 2014; Planck Collaboration XXVI 2016), multiple entries of the same source can be obtained in overlapping regions of two or more sky patches. These multiple entries are removed from the catalogue, keeping only those with the highest S/N in each case.
The Planck 143-GHz channel has much better angular resolution than the 30-GHz channel. Therefore, it can happen that two or more objects in our Planck sample, selected at 143 GHz, are inside the same 30 GHz beam solid angle. We keep such multiple occurrences in our input sample and deal with them in a way that will be described in Sect. 4.1 and the Appendix B.2.
Finally, the main disadvantage of selecting sources at 143 GHz is the possibility of unintentionally selecting Galactic (or extragalactic) cold thermal sources that are bright enough to pass our selection threshold. We will try to quantify the impact of these sources in Sect. 5.4.2.
3 Multi-frequency detection
The vast majority of component-separation methods that are typically used in CMB experiments take advantage of the spectral diversity of the different astrophysical components (synchrotron, thermal dust, the CMB itself, etc.) as a means to disentangle the various signals that arrive at the detectors (see for example leach2008; planck2014-a11; planck2014-a12). However, most of the techniques that are used for the separation of diffuse components are not well suited for the detection of extragalactic compact sources, except for the particular case of galaxy clusters observed through the thermal Sunyaev-Zeldovich (tSZ) effect. Individual galaxies leave their imprint on the microwave sky through an enormous variety of astrophysical mechanisms – from radio active lobes to dust thermal emission – so that, strictly speaking, each individual galaxy has its own unique spectral behaviour, thus making it impossible for methods that rely on spectral diversity alone to solve for each individual spectral signature. New methods, specifically tailored for compact sources, then become necessary. Most of the detection methods for compact-source detection that have been proposed in the literature make use of the scale diversity instead of spectral diversity (that is, they focus on the sizes of the sources rather than on their colours). In most cases, the catalogues of extragalactic sources are extracted from CMB maps separately, one frequency channel at a time. The previously published Planck catalogues (Planck Collaboration VII 2011; Planck Collaboration XXVIII 2014; Planck Collaboration XXVI 2016) follow this single-frequency approach.
Methods that attempt to combine the spectral and scale-diversity principles in order to enhance the detectability of extragalactic compact sources were fist introduced in the literature in the context of the study of the tSZ effect (herr02; herr05; melin06; planck2011-5.1a; planck2013-p05a; planck2013-p05a-addendum; planck2014-a36) an were afterwards generalized to generic compact-source populations (lanz10; lanz13). The matched matrix filters (MTXFs) approach was introduced in Herranz & Sanz (2008) and further explored in Herranz et al. (2009) as a solution to the problem of multi-frequency detection of extragalactic point sources when the frequency dependence of the sources is not known a priori. The MTXFs have already been used inside the Planck Collaboration to validate the LFI part of the PCCS catalogue (Planck Collaboration XXVIII 2014) and we will use them in this paper. The main aspects of MTXF theory can be found in Herranz & Sanz (2008) and Herranz et al. (2009), and are also reviewed in the general context of point source detection in CMB experiments in Herranz & Vielva (2010) and multireview; however, for clarity, we summarize the main mathematical aspects of MTXF theory in Appendix A. The practical details of the implementation of the MTXFs for Planck data are described in Appendix B. In particular, we discuss how we obtain the photometry of the sources in section B.1 of Appendix B.
4 The Planck Multi-frequency Catalogue of Non-thermal Sources
4.1 General description
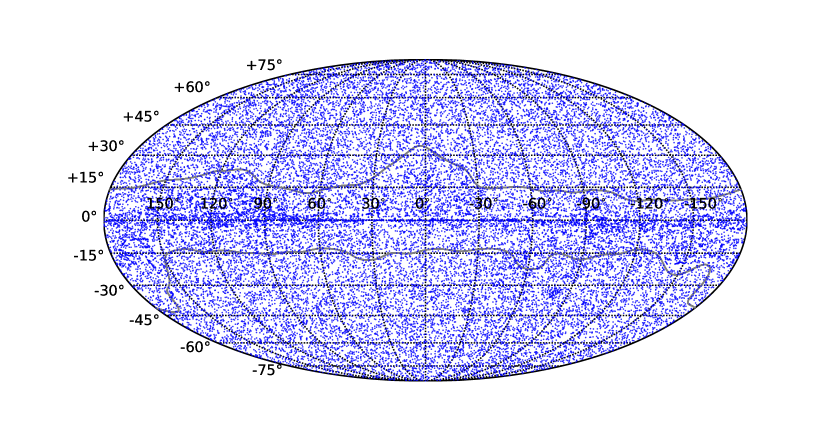
We provide a Planck Multi-frequency Catalogue of Non-thermal Sources (PCNT) containing the 29 400 candidates selected in our input catalogue (as described in Sect. 2); additionally, we flag the Bright Planck Multi-frequency Catalogue of Non-thermal Sources (PCNTb), a subsample comprising 1424 bright compact sources detected with in both the 30- and 143-GHz Planck channels, described in Sect. 4.2. Finally, we flag a high-significance sample of 151 objects that are detected with the MTXF at in all nine Planck frequency channels. We indicate this high-significance subsample with the acronym PCNThs, and we discuss it in Sect. 4.3. Figure 1 shows the Galactic coordinates of the 29 400 candidates in our catalogue. The boundary of the Planck Galactic mask, GAL070,444GAL070 is one of the Planck 2015 Galactic plane masks, with no apodization used for CMB power spectrum estimation. The whole set of masks consists of GAL020, GAL040, GAL060, GAL070, GAL080, GAL090, GAL097, and GAL099, where the numbers represent the percentage of the sky that was left unmasked. These masks can be found online at the Planck Legacy Archive, http://pla.esac.esa.int/pla See the Planck Explanatory Supplement for further description of the 2015 data release (Planck Collaboration ES 2015). is superimposed in grey as a visual help. Apart from an evident overdensity of points around the Galactic plane and several other regions of the sky such as the Magellanic Clouds, the distribution of targets looks very uniform across the sky.
Table 1 indicates the number of detections, that is, sources detected with , at Galactic latitude , in the PCNT, compared to the PCCS2. The cut was set for comparison reasons, because the PCCS2 applies different Galactic masking criteria for the Planck LFI and HFI. The comparison is only meaningful between frequencies 30 to 143 GHz because in the HFI channels the PCCS2 does not always apply a threshold cut (at LFI frequencies, on the other hand, a threshold is always applied). For HFI the situation is more complex; the lower threshold is approximately at 100 and 143 GHz, at 217 GHz, and higher at higher frequencies. For this reason and also because the PCNT is a non-blind catalogue selected at 30 and 143 GHz, Table 1 gives a fair comparison between the two catalogues only up to 143 GHz. The PCNT catalogue presents more detections than the PCCS2 up to 143 GHz. At higher frequencies the PCCS2 has more detections. This is expected because the primary selection of the PCNT catalogue was performed at 30 and 143 GHz and, therefore, we are missing the bulk of thermal-spectrum objects that dominate the source number counts at the higher HFI frequencies.
The gain in number of detections with respect to the PCCS2 is particularly evident at 30, 44 and 70 GHz. This is directly related to the gain in S/N due to the MTXF filtering method, but it is also the result of the de-blending discussed in Sect. B.2. Our primary sample has been constructed by selecting source candidates in two Planck channels with different angular resolution. The FWHM at 143 GHz is , whereas it is at 30 GHz. As noted in Sect. B.2, it is possible that two or more distinct sources detected at 143 GHz, with an angular separation smaller than could be seen as a single bright spot at 30 GHz. However, since the effective angular resolution of our Planck input catalogue is equal to the Planck FWHM at 143 GHz, we are able to separate sources at low radio frequencies that would not be resolved in a single frequency catalogue. It is important to emphasize that single-frequency catalogues (such as the PCCS and PCCS2) cannot resolve sources below the angular resolution limit of each separate channel, whereas the PCNT is able to resolve sources at the 143-GHz angular resolution limit, even for the LFI channels. A more direct comparison between the two catalogues is shown in Table 2, where the number of detections above 1 Jy and with Galactic latitude are listed for the two catalogues. Up to 143 GHz the two catalogues contain essentially the same bright sources (the small discrepancies in the numbers of sources are compatible with the statistical random fluctuations that appear between catalogues with different flux density error levels). For higher frequencies, the comparison is not meaningful because the PCNT is a non-blind catalogue that focuses only on the positions of our 30–143 GHz input sample.
|
| [GHz] PCNT PCCS2 30. 169 151 44. 152 143 70. 105 105 100. 86 82 143. 76 71 217. 83 55 353. 164 82 545. 304 570 857. 1069 2685 |
4.2 The Bright Planck Multi-frequency Catalogue of Non-thermal Sources
The whole PCNT catalogue contains as many entries (29 400) as the input Planck sample described in Sect. 2. Even with the multi-frequency filtering many of these targets are detected with a low S/N in the LFI channels. We therefore define a Bright Planck Multi-frequency Catalogue of Non-thermal Sources (PCNTb), containing those sources that have at both 30 and 143 GHz simultaneously. This criterion guarantees that the members of the resulting subsample will show strong radio emission. It also favours the selection of flat radio sources. There are 1424 sources in the PCNTb, among which 1146 are located outside the Planck GAL070 Galactic mask. As will be discussed in Sect. 5.3, many of the sources outside the Galactic mask in the PCNTb are identified as bright blazars.
4.3 The high-significance subsample
There are 151 sources in our catalogue that are detected at for all nine Planck frequencies simultaneously. We call this the high-significance subsample (PCNThs). The extragalactic sources are either bright sources with a flat spectrum continuing up to very high frequencies (normally blazars and FSRQs), or local galaxies that show both synchrotron and thermal emission, or sometimes Galactic sources that are bright enough to be detected across the entire Planck frequency range.
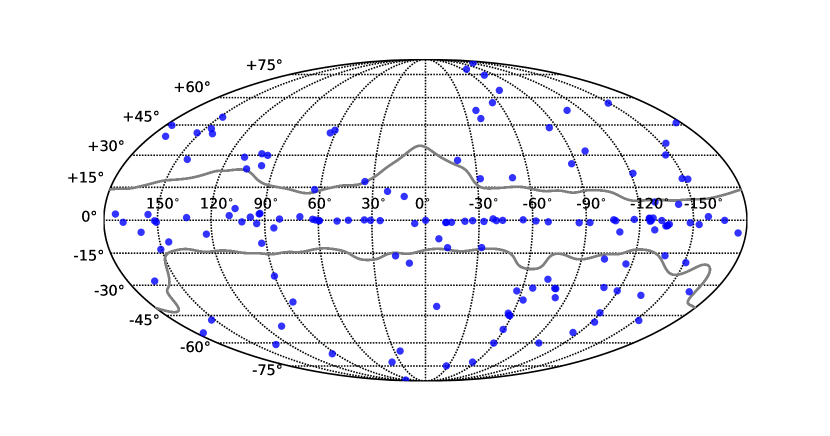
The positions on the sky of the PCNThs sources are shown in Fig. 2. As can be seen from the figure, many PCNThs sources (76 out of 151) lie inside the Planck GAL070 Galactic mask. This was expected, since the criterion of setting a threshold at all frequencies selects the brightest sources on the sky, and most of these ultra-bright sources lie in the Galactic plane.
5 Validation and properties of the catalogues
5.1 Internal Planck validation
In order to validate the flux densities obtained with the MTXF multi-frequency detection technique we have compared the PCNT flux densities with those of the PCCS2 (Planck Collaboration XXVI 2016). The PCCS2 lists four different flux density estimates for each of its sources: the native detection method flux estimation (DETFLUX); aperture photometry (APERFLUX); Gaussian fitting (GAUFLUX); and point-spread function fitting (PSFFLUX). Except for the case of very extended sources, the four estimations tend to show good agreement. Here we choose the DETFLUX flux density estimation as a reference.
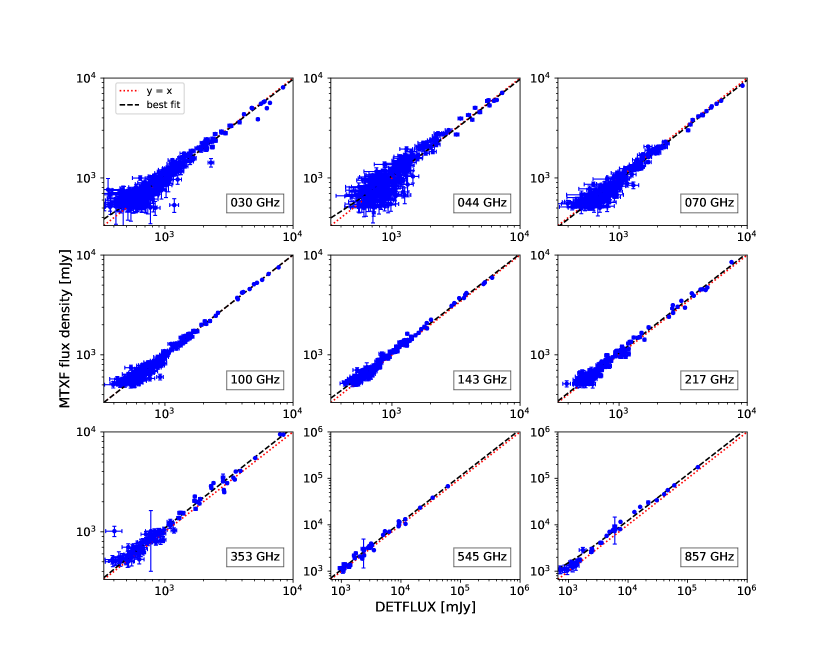
Our input catalogue contains 29 400 sources, many of them not included in the PCCS2. For this validation step we select for each frequency only sources outside the Planck GAL040 Galactic mask. This is a more restrictive mask than the one we use in the rest of this paper (GAL070); the rationale for this choice is that we want to be sure to avoid Galactic sources as much as possible for this comparison. There are two reasons for this. Firstly, Galactic sources will be seen against a brighter background, which could cause errors in the determination of their flux densities; secondly, a significant portion of Galactic objects appear as extended sources, particularly for the HFI channels. As discussed in Sect. B.1, accurate filter photometry requires that the sources are point-like (i.e. smaller than the beam area). Figure 3 shows results of the comparison between MTFX and PCCS2 flux densities for the nine Planck channels. In order to quantify the degree of agreement between PCNT and PCCS2 flux density estimates, we have performed a linear fit based on the orthogonal distance regression method (Boggs & Rogers 1990), which takes into account uncertainties in both the and axes.555The number of points that satisfy our criteria and are used for the fitting at 30, 44, 70, 100, 143, 217, 353, 545, and 857 GHz are 354, 232, 217, 198, 159, 122, 96, 34, and 36, respectively. The resulting coefficients to the fit are shown in Table 3. For this fit only the sources with were used, except for the cases of 545 and 857 GHz, where the Galactic contamination is stronger. For these two channels, we have just considered sources above 1 Jy.
PCNT and PCCS2 flux densities agree very well for the channels up to 217 GHz. At 353 GHz and above the PCNT tends to overestimate flux densities with respect to PCCS2. There are two possible reasons for this disagreement.
The first reason is background contamination: because the HFI channels are more contaminated by Galactic and extragalactic infrared emission, and since the MTXF approach picks up the maximum of the filtered images around the positions of each target in the input catalogue, flux density estimates can be overestimated in regions with strong contamination. Galactic emission at HFI frequencies, particularly at 545 and 857 GHz, is strong even outside the Galactic mask. For those frequencies, other flux density estimators (such as aperture photometry) can be more robust. Our choice of the restrictive GAL040 mask, which leaves only of the sky unmasked, and the relatively high threshold of 1 Jy we set for the 545- and 857-GHz channels, should largely reduce the effect of this source of overestimation.
The second reason for the disagreement between PCNT PCCS2 flux densities is a fundamental limitation of the multi-frequency filtering technique, discussed in Appendix B. The MTXF technique mixes data from different channels according to Eq. (11). This could lead to intensity leakage between channels, but this is prevented by the orthornomality condition (Eq. 15). The problem is that Eq. (15) works only if the source profiles are well known for all the frequencies about to be filtered. For this paper we have assumed circular Gaussian beams with the Planck nominal FWHM values. This assumption is good enough if: (a) sources are point-like; and (b) the instrumental beams are well described by a circular Gaussian (i.e. the beam is stable across the image, with small sidelobes, and circular symmetry). This assumption is not correct in two relevant cases:
-
•
when beams are significantly non-Gaussian and non-circular, as it is discussed in Appendix B;
-
•
for sources in the high-frequency Planck channels that are extended, which is a problem, since if a source is not strictly point-like, the orthonormality relation (Eq. 15) is not satisfied and there will be some leakage between channels, affecting the MTXF photometry.
In order to check this second point we have repeated the fit but using only sources that are not flagged as extended in PCCS2. Below 217 GHz the effect of excluding extended sources in the fit is negligible. Table 4 shows the fits for 217, 353, 545, and 857 GHz after excluding the sources that are flagged as extended in the PCCS2. If we do not consider the fit errors, the fit is slightly better at 217 GHz, significantly better at 353 GHz, and only marginally better at 545 and 857 GHz, where the effect of Galactic contamination combined with pointing inaccuracies dominates the photometric errors.666A fit at 857 GHz between PCCS2 and PCNT flux densities (using the MTXF flux density estimation at the pixel corresponding to the exact coordinates in the input sample instead of the local maximum around that position) gives fit parameters and mJy. Excluding sources flagged as extended, we get and mJy. Now most of the bias due to random positive background fluctuations is removed, but we underestimate fluxes because the coordinates in the input sample (obtained at 30 and 143 GHz) do not necessarily correspond to the true positions at 857 GHz. Taking into account the errors in the fits, the only channel for which it is important to remove the sources flagged as extended is 353 GHz.
|
|
5.2 External validation
The PCNT contains 29 400 entries, so it is not practical to perform an individual external validation of all the candidates. Instead of following such an approach, we attempt statistical external validation by comparing the number counts of our catalogue with existing models. We also try to validate a subset of interesting bright PCNT sources that are not present in the PCCS2 by looking for matches in existing ground-based observing databases. Additionally, we study the reliability and completeness of the catalogue by comparison to the Combined Radio All-Sky Targeted Eight-GHz Survey catalogue (CRATES, Healey et al. 2007) and we cross-correlate the non-thermal-dominated PCNTb and PCNThs catalogues with a catalogue of known blazars.
5.2.1 Number counts
One simple approach to check the validity of the PCNT catalogue is to estimate its number counts and to compare them with well known models and/or other data. For this purpose we have considered only extragalactic (outside the GAL070 Planck Galactic mask) sources detected at the level in each channel. Another complementary approach is to study the distributions of spectral indices of the populations in the catalogue, as well as their variation with frequency, and to compare these with models and with previous observations.
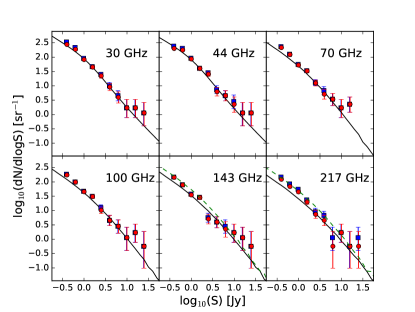
Figure 4 displays the PCNT differential source number counts (blue dots) in the six Planck channels between 30 and 217 GHz. Only sources above the detection threshold and outside the GAL070 Galactic mask are considered. The corresponding numbers of sources – used at each frequency channel – are listed in Table 5 (first row). As a check, we also plot the differential number counts (red dots) calculated by using the same source sample, but selecting only those sources with a low-frequency counterpart in the CRATES (Healey et al. 2007) catalogue (see Section 5.2). Both estimates appear in very good agreement at each Planck frequency channel and in the whole flux density interval here analysed, thus showing that the source selection we adopted misses only a negligible fraction of low-frequency radio sources.
As a comparison, in each panel we plot the differential source number counts predicted by the C2Ex model of Tucci et al. (2011). This was the most successful of their models for predicting number counts at high radio frequencies (i.e. ¿ 100 GHz), given that it consistently explained various and independent data sets (Vieira et al. 2010; Marriage et al. 2011; Planck Collaboration XIII 2011), in the flux density interval Jy. In the case of the 143 and 217 GHz channels, we also plot the number counts predicted by the C2Co model discussed by Tucci et al. (2011).777Moving to lower Planck frequencies, the differences between the models C2Ex and C2Co gets smaller and smaller; in particular, their predictions are very similar at 30 and 44 GHz. For this reason, we did not plot the C2Co model at lower frequencies. This latter model assumed a more compact synchrotron-emission region – in the inner jet of FSRQs – than C2Ex, while keeping the same parameters for BL Lac objects (see Tucci et al. 2011, their Section 4.2). This assumption implies that, in the C2Co model, an almost flat emission spectrum can be maintained up to higher radio frequencies, thus increasing the number of detected sources at high frequencies.
Regarding the counts between 353 and 857 GHz (not shown in the plot), we notice an excess of sources with respect to the model above 300 mJy. Although there are partial reasons for this (for example local galaxies showing both radio and infrared emission), the simplest explanation could be contamination by thermal emission that appears in the same positions of (already fainter) radio sources detected at lower Planck frequencies, or purely thermal sources (either Galactic or extragalactic) that are bright enough to be selected at a frequency as low as 143 GHz in our input sample. We discuss this possibility in Sect. 5.4.2.
5.2.2 Reliability and completeness
To verify the reliability of our catalogue we cross-match our detected sources with the CRATES catalogue (Healey et al. 2007) at 8.4 GHz. However, by construction, the CRATES catalogue misses the steep-spectrum sources. Since we expect to include several sources of this type, we also complement the cross-match (within a 15′ search radius) with the GB6 (Northern hemisphere, Gregory et al. 1996) and PMN (Southern hemisphere, Wright et al. 1994) catalogues, both at GHz. Additionally, we also use other low-frequency catalogues and ground-based observing databases, such as The Australia Telescope 20 GHz (AT20G) survey (Murphy et al. 2010) or the SIMBAD database.888http://simbad.u-strasbg.fr/ Since the PCNT extends to IR frequencies, on occasion we also use higher frequency catalogues such as those constructed using IRAS (Helou & Walker 1988) or the Planck Catalogue of Galactic Cold Clumps (PGCC, Planck Collaboration XXVIII 2016) in order to check if particular candidates with thermal-like emission can be matched to already known sources. However, our main focus in this paper will be the reliability and completeness of the low-frequency, non-thermal part of the catalogue. Due to the double PCNT selection criterion at 30 GHz and 143 GHz, we will study the reliability of the catalogue in consecutive steps, starting from sources detected with separately in each one of the two selection channels and then proceeding to a more restrictive, brighter subsample of sources detected above the level simultaneously at all the non-thermal Planck channels (30, 44, 70, 100, and 143 GHz). Finally, we will discuss the completeness of the catalogue.
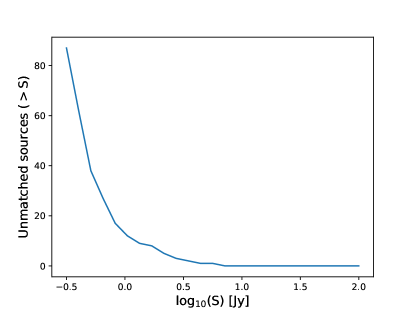
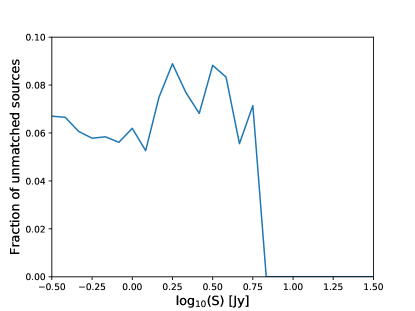
at 30 GHz: At 30 GHz we have 1701 detected sources outside the Galactic mask GAL070 that have . Of these, 1566 have a counterpart in the low-frequency catalogues, implying that at most of the selected sources are spurious. In Fig. 5 we can see the number of unmatched sources as a function of the flux density, while Fig. 6 shows the fraction of unmatched sources as a function of the flux density. As expected, most of the unmatched sources appear near the detection limit because they are mostly caused by artefacts produced by nearby bright sources (they are all flagged as part of a group).
at 143 GHz: The other interesting channel to check the reliability of our catalogue is at 143 GHz, the second channel used to obtain the candidates of the initial sample. At this frequency we have 2047 sources outside the GAL070 Planck Galactic mask and with . There are 1664 sources with counterparts in the lower frequency radio catalogues and 1720 if we also consider IRAS (Helou & Walker 1988) counterparts. Among the 327 sources not matched to these catalogues, only 14 are in the PCNTb and are brighter than 200 mJy at 143 GHz. The rest have low flux densities at 143 GHz. Returning to the 14 relatively bright PCNTb sources that are not matched to GB6 or PMN, nine of them have a counterpart in the CRATES catalogue. Among the remaining five objects, four have cross-identification with the BZCAT5 catalogue of blazars (Massaro et al. 2015); they were also observed by AT20G, with flux densities at 20 GHz that are consistent with our 30 GHz photometry within factors of 0.9–1.2. The last PCNTb object in this list is 33.7 arcseconds away from blazar candidate WISE J140610.82070702.4 (D’Abrusco et al. 2014), whose flux density at 20 GHz measured by AT20G is also compatible with the PCNT 30-GHz flux density. Of the remaining unmatched sources that are not in the PCNTb, 16 are brighter than 200 mJy at 143 GHz. However, eight of these have counterparts in the PGCC (Planck Collaboration XXVIII 2016), so probably they are associated with regions of Galactic emission. Of the remaining eight objects, four are detected only at 143 GHz or at 143 GHz and one other channel and, therefore, it is reasonable to consider them spurious detections. The remaining objects are of uncertain nature, but all of them (except for one) have flux densities below mJy at 143 GHz; they are also probably spurious detections. The last one, PCNT ID 4888, has a measured flux density of 482.4 mJy at 143 GHz and is detected above the level between 70 and 353 GHz in the PCNT.
between 30 and 143 GHz: The PCNT contains 1012 sources detected above the level, simultaneously at 30, 44, 70, 100, and 143 GHz. Among these 1012 sources, 19 do not have a counterpart in PCCS2 in any of the aforementioned frequency bands. All of these 19 sources have counterparts within a 15′ search radius either in the GB6 or the PMN catalogues. In order to further confirm that these detections are real ERSs with good photometric measurements in the PCNT, we looked for matches in existing ground-based observing databases, which have data reaching to frequencies closer to the lower bands of the Planck-LFI than the GB6 and the PMN. We excluded sources close to the Galactic plane () to avoid contamination by Galactic emission. This left us with 18 of 19 sources.
The AT20G Survey covers the sky south of declination . We found 10 matches, each within 6′′ to 93′′ of the PCNT position, and one within 125′′. The 20-GHz flux densities were taken between 2004 and 2008, the observing dates depending on the declination band. Thus none of the observations exactly overlap with the Planck observations, which took place between 12 August 2009 and 23 October 2013. The AT20G 20-GHz flux densities agree with the PCNT 30-GHz flux densities within a factor of 0.6 to 2.7 (average ratio 1.06). This is in good agreement with what is expected for possibly variable sources when observations are taken at two different centimetre-domain frequency bands and at two different observing epochs several years apart (Hovatta et al. 2007; Nieppola et al. 2007).
For sources with a declination higher than , we checked the Owens Valley Radio Observatory (OVRO, Richards et al. 2011) 40-m telescope database (Richards et al. 2014).999http://www.astro.caltech.edu/ovroblazars/ Starting in 2008, they regularly monitored 1800 blazars at 15 GHz. We found four matches within 86′′ or less of our new PCNT source positions; one of them was also in our AT20G source identification list. All of these sources showed at least some 15-GHz variability during the Planck mission. For all of these four sources the 30-GHz PCNT flux densities are within a factor of 2 or less of their 15-GHz long-term average flux densities, thus, considering their variable behaviour, the flux densities are of comparable amplitudes.
Visual inspection at 30 and 143 GHz of the Planck maps around the three remaining candidates (that are not matched either to AT20G or OVRO sources) suggests the presence of moderate point-like, positive temperature fluctuations at the positions of three of the targets (ID numbers , , and ), but does not reveal any obvious structure around the remaining target (ID ). These four sources, however, all have counterparts at 5 GHz in the GB6 or the PMN, and their PCNT flux densities at 30 GHz are compatible with those of their low-frequency counterparts, strongly suggesting that these objects are real flat spectrum radio sources.
Completeness: From the source number counts (see Sect. 5.2.1) we can also derive a rough estimate of the completeness limit of the catalogue. This lies at around 300 mJy up to 70 GHz, decreasing to about 150 mJy out to 217 GHz. At higher frequencies it continuously increases, with 250, 500 and 1000 mJy limits for 353, 545, and 857 GHz, respectively.
5.3 Cross-identification of PCNTb sources with the BZCAT5 catalogue of blazars
As noted in Sects. 2 and 4, the criteria we set for the creation of our input catalogue favours the selection of non-thermal compact sources. This is particularly true for the PCNTb and the PCNThs, which should by construction contain many bright flat-spectrum sources. In order to check this, we have cross-correlated both sub-catalogues with an external catalogue of known blazars. 913 out of the 1424 sources of the PCNTb have counterparts within (the Planck FWHM at 143 GHz) in the BZCAT5 catalogue of blazars (Massaro et al. 2015). Most of them, 832, are outside the Planck GAL070 Galactic mask. The BZCAT5 provides flux density estimation at 143 GHz from the PCCS catalogue (Planck Collaboration XXVIII 2014) for 472 of the 913 blazars with counterpart in the PCNTb. Remarkably, thanks to our multi-frequency MTXF photometry, the PCNTb can provide flux density estimations at 143 GHz and the corresponding photometric errors for the other 441 blazars in the list.
Among the 151 sources in the PCNThs, 72 have a counterpart within a radius of 7′ in the BZCAT5 catalogue. 60 of these objects are outside the Planck GAL070 Galactic mask, and 49 of these have flux densities at 143 GHz listed in the BZCAT5. Thanks to our multi-frequency MTXF photometry, we can provide the flux densities at 143 GHz for the remaining 11 BZCAT5 objects.
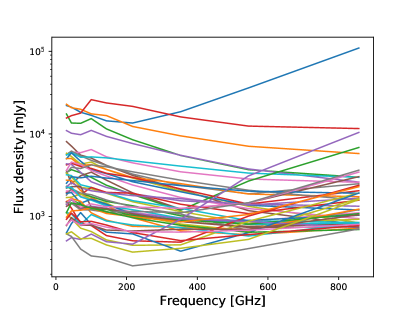
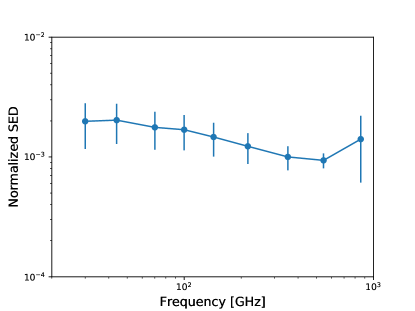
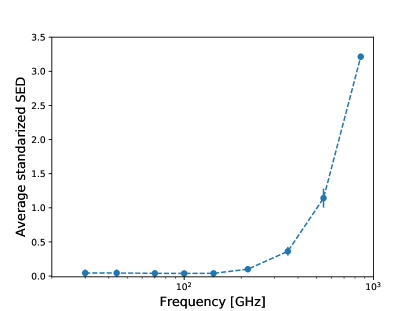
Figure 7 shows the PCNT SEDs of the 49 sources of our high-significance subsample that have flux densities at 143 GHz listed in the BZCAT5.101010The BZCAT5 catalogue provides flux density information at 143 GHz for only of its sources. Not surprisingly, almost all these blazar SEDs are essentially flat in the whole frequency range analysed here. Figure 8 shows the average normalized SED of the same 49 sources. This SED is essentially flat, with an excess at 857 GHz that is partially due to contamination from Galactic emission and, very occasionally, to random associations with nearby galaxies. There are at least two sources whose SEDs rise sharply at high frequency. The first one is the brightest object in the plot, which is only 1′ away from the NASA/IPAC Extragalactic Database (NED111111The NASA/IPAC Extragalactic Database (NED) is operated by the Jet Propulsion Laboratory, California Institute of Technology, under contract with the National Aeronautics and Space Administration.) coordinates of the galaxy Centaurus A. The host galaxy of Cen A has a dust lane, responsible for powerful FIR emission. The Cen A Herschel flux densities at 500 and 350 m are roughly 35 and 100 Jy (as obtained by visual inspection of the right panel of figure 3 in Parkin et al. 2012), to be compared to our flux densities of 36 and 110 Jy at 545 and 857 GHz, respectively. Regarding the second object,121212The BZCAT5 redshift for this source is whose flux density at 857 GHz rises to become the third highest in the plot (light purple line in Fig. 7), it is located 5′.4 away from nearby galaxy NGC 6503 (, Epinat et al. 2008). This random association could explain the observed flux excess at high frequencies for this object.
Many of the SEDs in Fig. 7 show a small but noticeable bump around 100 GHz. A possible explanation for this excess could be the signature of CO contamination, which presents its strongest transition line () at 115 GHz, very close to this frequency channel. This possible CO excess could also have an extragalactic origin, since the redshifted transition should be observable in the Planck 100-GHz band for sources with , and this criterion is met by 19 out of the 49 sources plotted in Fig. 7. However, the CO emission from blazars is generally considered to be negligible. We have tested this by exploiting the fact that there is a tight, almost linear, relationship between the CO and the total IR luminosity due to dust emission (e.g. Greve et al. 2014). Therefore is possible to estimate the total IR luminosity of a source from its observed excess at 100 GHz, assuming that such excess is purely due to CO emission, and to compare to direct observations, where available. When IR observations are not available, it still possible to compute the star formation rate (SFR) from the IR emission derived from the CO excess, using the calibration of Kennicutt & Evans (2012), and check if the derived S/N is plausible. This kind of comparison is only approximate, but can give us an idea of whether the observed excess could be due to extragalactic CO emission. Only in the case of Cen A is the IR luminosity from the CO consistent with such direct measurements. In two other cases, PCNT ID 721 and ID 1257, the derived SFRs are plausible (500–600); however, there is no indication that either of these sources have any significant star formation (and low- blazars do not generally show significant SFRs). The CO excesses of all the other sources would correspond to IR luminosities orders of magnitude higher than observed, or to SFRs far above the Eddington limit (). We conclude that, with only a few exceptions (most notably Cen A), the CO emission from blazars in our sample is unimportant.
A second possibility is that the observed excess is caused by Galactic CO emission, visible at high Galactic latitudes (cf. Planck Collaboration XVIII 2014, figures 3, 4, and 5, and the corresponding discussion in section 5 of that paper). If that were the case, the 100-GHz excess would also be visible in other PCNT sources at similar Galactic latitudes and not in the BZCAT5. While it is true that the excess is visible for some of the PCNT sources not in the BZCAT5, there is no noticeable bump in the averaged SED of the whole PCNT (restricting the sample to sources above the detection level at 143 GHz). Therefore, while we cannot rule out the possibility of Galactic CO emission as the origin of the observed excesses at 100 GHz for some of the sources of the catalogue, there is no evidence that this effect is relevant for the majority of sources in the PCNT. Finally, a third possibility is that the 100-GHz bump is a manifestation of the natural variation in blazar SEDs at low and intermediate frequencies. Blazar spectra are the combination of emission from different components of the jets. Perhaps the excesses and deficits seen in Fig. 7 are simply a manifestation of these different components, and have no further relevance. It is also possible that the observed excesses at 100 GHz in Fig. 7 are due to a combination of the three possibilities above.
5.4 Statistical properties of the catalogues
The main goals of this paper are to introduce the PCNT, PCNTb, and PCNThs catalogues, to explain how they were obtained using Planck data, and to make them available to the community. Table 5 summarizes some of the results of our investigations into cross-matching the PCNT to external catalogues of radio sources, blazars, and Galactic cold cores, discussed in the previous sections for sources outside the GAL070 mask.131313The total number of PCNT sources outside the GAL070 Galactic mask is 18 647. The table gives an approximate idea of the number of sources detected by Planck not covered in lower frequency surveys,141414As seen in the previous sections, this number is not equivalent to an assessment of the reliability of the catalogue. See Sect. 5.2.2 for a full discussion of reliability. of the level of contamination by Galactic objects for the different Planck channels, and of the fraction of bright PCNT sources previously identified as blazars. A full statistical study of the catalogue is out of the scope of this work; however, to illustrate the potential of the catalogues we outline here their main statistical properties and the science that can be derived from them.
|
5.4.1 Spectral indices and colour-colour plots
The distribution of spectral indices in the PCNT is shown in Fig. 9. We have estimated the spectral indices only for those sources detected above the level in each pair of frequencies. We distinguish between (mostly) Galactic sources inside the Planck GAL70 Galactic mask and (probably) extragalactic sources outside the mask. For the extragalactic sources, we again recover the high-frequency synchrotron steepening above 70 GHz anticipated by González-Nuevo et al. (2008) using WMAP-detected sources and confirmed in a series of papers (Planck Collaboration XIII 2011; Planck Collaboration Int. VII 2013; Planck Collaboration XXVIII 2014; Planck Collaboration XXVI 2016; Massardi et al. 2011, 2016). As already found in the analysis of the Planck Early Release Compact Source Catalogue (Planck Collaboration VII 2011) and confirmed later with the PCCS and the PCCS2 (Planck Collaboration XXVIII 2014; Planck Collaboration XXVI 2016), extragalactic sources with thermal emission begin to appear only at 217 GHz and above, a much higher frequency than expected before the launch of the Planck mission.
From these analyses, we can conclude that the PCNT catalogue is an excellent resource for studying the statistical properties of the non-thermal source population and the changes in their emission properties with frequency at all the Planck channels (a frequency range poorly observed in the past). The possibility to observe the emission of the same source across such a wide frequency range allows us to apply additional selection criteria in order to identify important types of source. For example, selecting sources with flat spectrum behaviour at relatively high frequency (143 and 217 GHz) will mainly provide us with a blazar-AGN subsample, as was seen in Sect. 5.3.

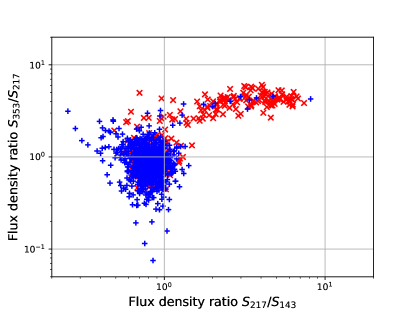
Fig. 10 shows the colour-colour plot at the common frequency 217 GHz for the sources in the PCNTb. This figure is analogous to the top panel of figure 26 in (Planck Collaboration XXVI 2016). The red crosses show the 278 PCNTb sources inside the Planck GAL070 mask, whereas the blue pluses show the 1146 PCNTb sources outside the same mask. We can see the non-thermal and thermal source populations of the PCNTb. Sources inside the Planck GAL070 mask tend to have a thermal spectrum, whereas the sources outside the same mask are mainly non-thermal. The non-thermal population is much more numerous than the thermal population, thanks to our selection criteria at 30 and 143 GHz. This indicates that the PCNTb is a good multi-frequency catalogue of bright non-thermal sources.
At frequencies higher than 353 GHz, we can see a different behaviour between the whole PCNT sample and the PCNThs. In the case of the PCNT, most of the sources show clear thermal emission, which probably indicates some kind of Galactic thermal contamination or the classical Eddington bias. However, this thermal emission dominates only in roughly half of the PCNThs, and only for the 857-GHz channel. Taking into account that these sources are visible in all the Planck channels, the best interpretation in this particular case is that they are bright local galaxies, where we are able to observe both the radio and thermal emission. Within a search radius of and outside the GAL070 mask, there are 23 identifications151515Out of 75 PCNThs sources outside the GAL070 mask. of PCNThs sources with IRAS compact sources (Helou & Walker 1988; Beichman et al. 1988).161616Among them are several well known local galaxies, such as Cen A, M82, M87, and the Sculptor Galaxy.
5.4.2 Galactic and thermal sources in the catalogues
Fig. 9 shows, using different colours, sources outside and inside the Planck GAL070 mask. This allows us to roughly distinguish between Galactic and extragalactic-dominated subsamples of the corresponding catalogues. In this section we briefly discuss the properties of the sources inside the GAL070 mask and quantify the impact of cold thermal sources that were unintentionally selected in our input sample.
The Galactic sources of the PCNT, as seen in Fig. 9, behave similarly to the extragalactic ones below 143 GHz, where sources emitting thermally first appear. This early appearance of thermal emission is probably due to the fact that most of the Galactic sources are much brighter than the extragalactic ones. Galactic sources that have a smooth transition between non-thermal- and thermal-dominated channels are probably mostly planetary nebulae (see Planck Collaboration Int. XVIII 2015) or supernova remnants (see Planck Collaboration Int. XXXI 2016). Furthermore, Galactic sources showing a variation in their spectral behaviour around 100 GHz can be potential candidates for studying CO line emission. This suggests that the spectral index plot can be used as a stand-alone tool to distinguish Galactic sources in the catalogue. In addition, but less easily interpretable from the physical point of view, further selection criteria can be devised based on a principal component analysis (PCA) of the SEDs (see for example Sect. 5.4.3).
As mentioned in Sect. 2, the use of the 143-GHz band as one of the selection channels for our input Planck sample carries the risk of including bright thermal sources in the PCNT. In some cases, these are extragalactic sources that show both non-thermal synchrotron spectrum at low frequencies and thermal emission at high frequencies; in some other cases, they can be purely thermal sources that are bright enough to be detected above our selection threshold at 143 GHz. In order to quantify the impact of thermal emission in the high-frequency channels of the PCNT, we have looked for sources detected at at 143 GHz that have no counterpart in the CRATES catalogue (Healey et al. 2007) within a search radius of 32.′3 (the Planck FWHM at 30 GHz). In order to focus on sources that are likely to be of extragalactic origin, we restrict our search to sources outside the Planck GAL070 Galactic mask and that are not in the PGCC (Planck Collaboration XXVIII 2016). There are 494 sources in the PCNT that satisfy these criteria. Taking these, we use a very simple spectral index criterion in order to identify sources with potential thermal-like emission, namely those sources with spectral index between frequencies 143 and 217 GHz . 56 out of these 494 sources () have thermal spectra according to the criterion. This suggests that the degree of contamination of thermal sources in the whole PCNT at high Galactic latitudes should be relatively small. However, the situation changes significantly if we focus on the brightest sources at 857 GHz. If we repeat the analysis, but consider only sources with flux density above 1 Jy at 857 GHz, we find that almost half of the sources (47 out of 97 that have Jy and at 143 GHz, are outside the GAL070 mask and are not matched to CRATES) sources are thermal-like according to the criterion. This implies that the contamination from thermal sources is much more relevant in the bright source part of the 857 counts, and that it cannot be neglected even for regions outside the Galactic plane. To a lesser extent, the same applies to the 545- and 353-GHz Planck channels. Source number count plots (not included in this paper for the sake of brevity) at the high-frequency Planck channels ( GHz) show a clear excess of sources above 1 Jy with respect to the Tucci et al. (2011) model of radio source number counts.
5.4.3 Principal component analysis
Colour-colour diagrams and fits to certain spectral laws (a modified blackbody, for example, or a power law with a given spectral index) are useful tools for source classification. However, the complexity and arbitrariness of the classification rules can grow very quickly when the number of channels (or colours) is large. In that case, statistical procedures such as principal component analysis (PCA, see for example Jolliffe 2002) can help to identify trends and correlations, to reduce the dimensionality of the data and to ease the burden of automatic classification of sources in a catalogue.
PCA is mathematically defined as an orthogonal linear transformation that transforms the data to a new coordinate system, such that the greatest variance through some projection of the data comes to lie on the first coordinate (called the first principal component), the second greatest variance on the second coordinate, and so on. In our case, the data for each source are the standardized (that is, mean subtracted and normalized to unit variance) flux densities from 30 to 857 GHz, and the intuitive meaning of the principal components is that of ‘generalized colours’ that identify the main spectral trends. Operationally, finding the principal components is equivalent to solving the eigen-problem for the covariance matrix of the data (in our case, the covariance matrix is a matrix computed by cross-correlating the 29 400 spectral energy distributions we have in the PCNT). If is the matrix of standardized (normalized) flux densities of the catalogue, the principal components are given by
| (1) |
where is a matrix whose columns are the eigenvectors of . We perform PCA on the standardized (normalized) flux densities from 30 to 857 GHz for all the 29 400 targets in the input catalogue. In the standardization pre-processing step, the SED of each source is renormalized to unit variance. This is because we are interested in the shapes of the SEDs, not in their individual amplitudes. After this pre-processing standardization we calculate the covariance matrix of the samples and obtain the principal components through the eigenvectors of the covariance matrix. We find that the two first components account for of the sample variance. Adding a third principal component we account for of the sample variance. This means that most of the spectral information contained in the nine frequencies of the catalogue can be coded in just two or three numbers.
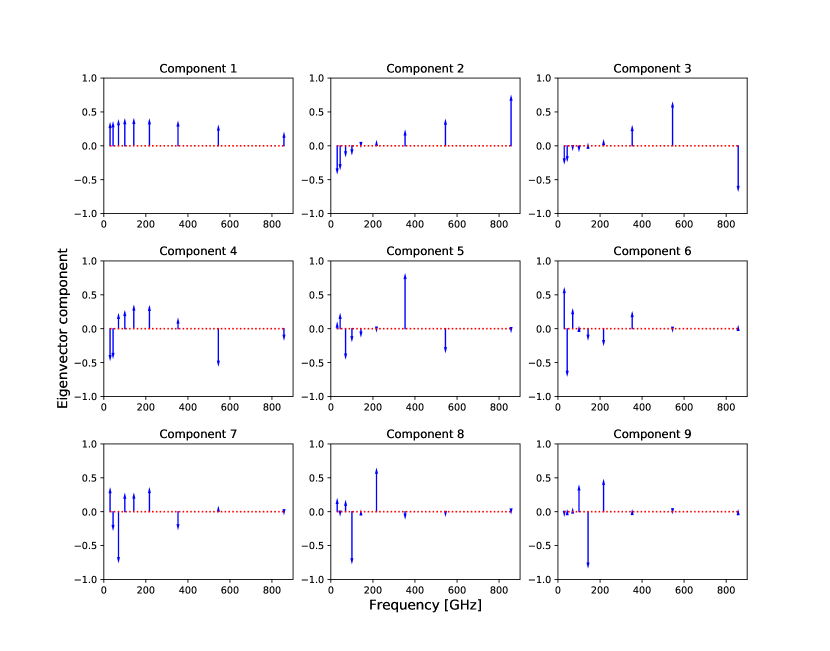
It is not always easy to find an intuitive interpretation for these generalized colours. Fig. 11 shows the components, as a function of frequency, of the nine eigenvectors calculated from the PCNT. The two first components, which as we have just mentioned account for of the spectral information content, could be interpreted as more or less a flat spectrum with some preponderance of radio emission (which was to be expected, considering our selection criterion at 30 and 143 GHz), plus a component that peaks towards the high frequencies (probably thermal dust contamination). The third vector suggests some kind of bump around 545 GHz, which may be associated with a Galactic cold dust component with K (or warmer sources at ). The rest of the components are much more difficult to interpret, but carry much less information about the spectral behaviour of the catalogue.
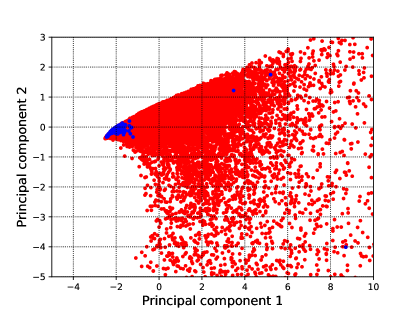
The utility of the PCA analysis can be seen in Fig. 12, which shows the distribution of the two first principal components for the whole catalogue (red dots). We can now look for particular subsets of sources and see whether they lie in a restricted region of the diagram or not.
As an example, we have selected a group of bright Galactic sources by looking for coincidences between our catalogue and the PGCC (Planck Collaboration XXVIII 2016). Galactic cold clumps are expected to have purely thermal spectra. There are 3150 matches within a search radius between our catalogue and the PGCC. If we also restrict ourselves to bright sources that are detected with at 353, 545, and 857 GHz in our catalogue, we keep 1882 objects out of 29 400. The sources selected in this way are shown as blue dots in Fig. 12, where they appear strongly clustered in a thin, elongated structure, centred around in the principle component plane. This suggest that it should be possible to identify sources with strong thermal emission just by applying an automated classification algorithm in the space of the first few principal components.
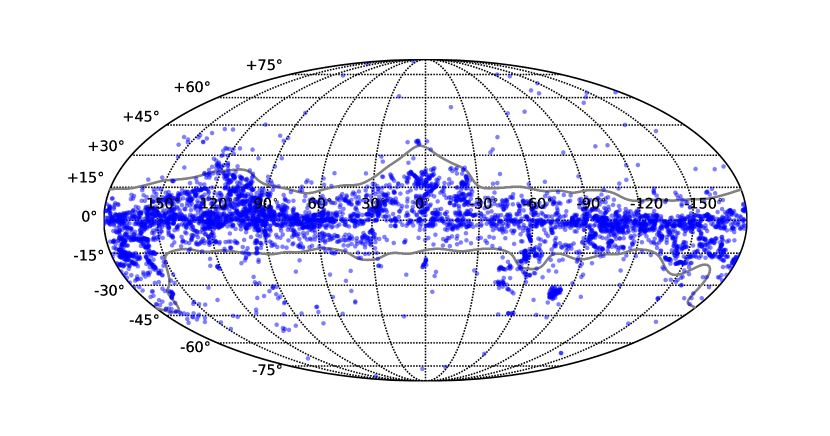
The -nearest neighbours algorithm (-NN, Benedetti 1977; Altman 1992) is a non-parametric pattern recognition and classification method that provides an intuitive way to classify a -dimensional sample of objects into two or more categories, starting from a training subsample such as the one we have described above. An object is classified by a majority vote of its neighbours, with the object being assigned to the class most common among its nearest neighbours ( is a positive integer, typically small, and must be an odd number in order to avoid the possibility of having a tie in the vote). We have applied the -NN method, with , to the whole catalogue, restricting the analysis to only the two first principal components.171717We have tried also other values, and the results do not change significantly. According to the -NN classificator, there are 4829 objects that should be classified in the same category of thermal-like sources. Fig. 13 shows the distribution on the sky of these sources; for comparison, the Planck Galactic mask is outlined in grey. As we can see, the automatically selected sources lie around the Galactic plane and the Magellanic Clouds. Fig. 14 shows the average, standardized spectral energy distribution of the selected sources, where we can see an almost purely thermal spectrum with a minor contribution from synchrotron (or maybe free-free) emission in the lower frequencies. This result is in agreement with the physical interpretation we have given above for the two first principal components.
These basic examples should help to demonstrate the potential and the power of the PCA approach. Just by looking at two principal components, instead of using a complicated set of colour-based rules (as in the standard approach), we are able to identify – and, thus, exclude – sources showing a characteristic thermal dust spectrum. The same approach could be also easily applied to the first three principal components instead of only the first two. In general, this technique could be used to flag sources that have extreme spectral behaviour before performing the statistical analysis of the catalogue of sources of greatest interest for the purposes of each specific investigation (e.g. non-thermal ERSs, in this case).
6 The catalogue: access, content and usage
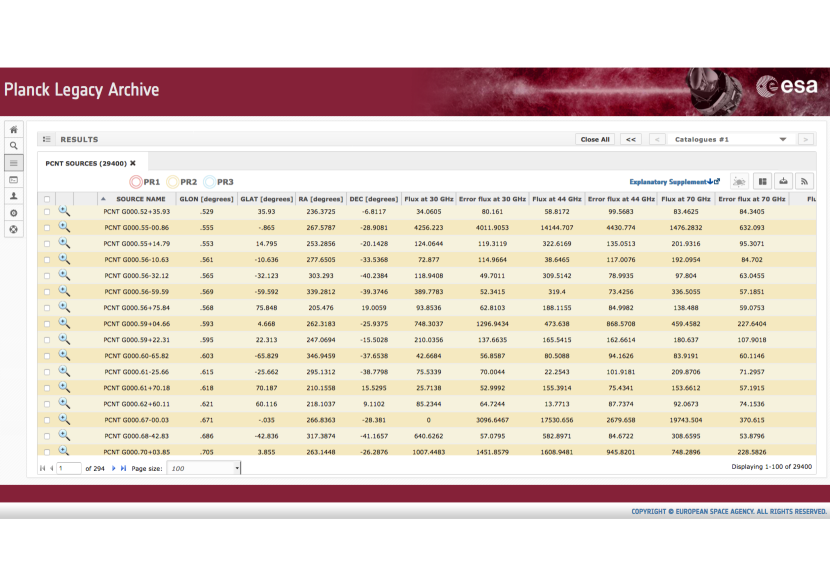
The PCNT catalogue is available from the Planck Legacy Archive.181818http://pla.esac.esa.int/pla The name of the catalogue file in the Planck Legacy Archive is COM_PCCS_PCNT_R2.00.fits. Fig. 15 shows a screenshot of the Planck Legacy Archive web interface to the PCNT. The PCNT contains the coordinates, flux densities, flux density errors, and MTXF S/N for 29 400 sources. Here we summarize the catalogue contents.
-
•
Source identification: MAME (e.g. PCNT).
-
•
Position: GLON and GLAT contain the Galactic coordinates, and RA and DEC give the same information in equatorial coordinates (J2000).
-
•
Flux density: the estimates of flux density for the nine Planck frequencies (Err_Flux_xxx), in mJy, and their associated uncertainties (Err_Flux_xxx). The string xxx contains the frequency value.
-
•
MTXF signal-to-noise ratio for the nine frequencies: SNR_xxxGHz_MTXF.
To facilitate the usage and scientific exploitation of the catalogue, the PCNT provides in addition seven different flag columns:
-
•
PCNTb, indicating sources belonging to the PCNTb;
-
•
PCNThs, indicating sources belonging to the PCNThs;
-
•
Group_Flag, indicating sources that are found inside a 30-GHz beam area as indicated in Sect. B.2;
-
•
Matched_to_PGCC, indicating sources that are matched, within a 5′ radius, to PGCC sources;
-
•
Matched_to_CRATES, indicating sources that are matched, within a 32.′3 radius, to CRATES sources;
-
•
Matched_to_BZCAT5, indicating sources that are matched, within a 7′ radius, to the BZCAT5 catalogue of blazars;
-
•
from_030_input, indicating sources that appear only at 30 GHz in the input catalogue (see Sect. 2 for further details).
It should be noted that there is no column that contains the coordinate uncertainties for each source. The errors in position are inherited from the same Mexican hat wavelet technique used for the construction of the PCCS2 and therefore can be computed using the same procedure as described in Planck Collaboration XXVI (2016).
Additional information about the catalogue content and format can be found in the FITS file headers.
7 Conclusions
The Planck Multi-frequency Catalogue of Non-thermal (i.e. synchrotron-dominated) Sources observed between 30 and 857 GHz by the the ESA Planck satellite mission has been produced using the full mission data. This is the first fully multi-frequency Planck catalogue of compact sources that covers all nine of the Planck frequency bands.
We constructed our catalogue starting from a set of candidates that are blindly detected with Mexican hat filtering on the Planck full-sky maps at 30 and 143 GHz. From this input sample we selected those source candidates with signal-to-noise ratio . The number of source candidates in this Planck input sample is 29 400. We then ran a multi-frequency filtering (the Matrix Multi-filters) on the nine Planck frequency channels. The resulting all-sky PCNT catalogue lists the positions, flux densities, and flux density uncertainties of 29 400 compact sources at all nine Planck frequencies. The PCNT flux densities agree with previous Planck observations in the PCCS2 (Planck Collaboration XXVI 2016), but our catalogue goes deeper in flux density limits from 30 to 143 GHz (down to around 100–300 mJy). Moreover, the PCNT is a band-filled multi-frequency catalogue over the whole Planck frequency range. Therefore, it is ideal for studying SEDs between 30 and 857 GHz for thousands of compact sources and investigating the statistics of their properties. An indication of the reliability of this multi-frequency catalogue for statistical studies is given by the preliminary number counts calculated with sources in the PCNT and detected outside the Galactic GAL070 mask; these are in very good agreement with the number counts predicted by the C2Ex cosmological evolution model of ERSs described in Tucci et al. (2011).
Although the selection criteria chosen for our Planck input catalogue tends to favour the selection of non-thermal, i.e. synchrotron-dominated, sources, the PCNT also selects many bright dusty compact sources, the majority of them of Galactic origin. In order to provide a purer set of non-thermal sources, we also define a subsample of the PCNT whose components are detected with at both 30 and 143 GHz. This Bright Planck Multi-frequency Catalogue of Non-thermal Sources (PCNTb) contains 1424 sources, of which 1146 are found to lie outside the Planck GAL070 Galactic mask. Remarkably, 913 out of the 1424 sources of the PCNTb have counterparts within 7′ (the Planck FWHM at 143 GHz) in the BZCAT5 catalogue of blazars (Massaro et al. 2015). Of these matches, 832 lie outside the Planck GAL070 Galactic mask. Thus, the PCNTb contains not only flat-spectrum ERSs (mainly classified as blazars), but also a minority of Galactic sources, with spectra dominated by thermal dust emission.
Finally, we also flag the high-significance subsample (PCNThs), a subset of 151 sources that are detected with in all nine Planck channels. The PCNThs contains high S/N SEDs between 30 and 857 GHz for 72 known blazars (Massaro et al. 2015), 60 of which lie outside the Planck GAL070 Galactic mask.
We release for the scientific community the full PCNT and the bright subsample PCNTb catalogues, and also the PCNThs, with the corresponding sources flagged in the PCNTb. We also include in the catalogues nine columns containing the results of a principal component analysis of the SEDs in our catalogue. We suggest that the principal component analysis will prove useful for developing automated source classification criteria and, as an example, we show that sources with a characteristic thermal spectrum, easily identified by using only a simple classifier based on the two first principal components.
Acknowledgements.
The Planck Collaboration acknowledges the support of: ESA; CNES, and CNRS/INSU-IN2P3-INP (France); ASI, CNR, and INAF (Italy); NASA and DoE (USA); STFC and UKSA (UK); CSIC, MINECO, JA, and RES (Spain); Tekes, AoF, and CSC (Finland); DLR and MPG (Germany); CSA (Canada); DTU Space (Denmark); SER/SSO (Switzerland); RCN (Norway); SFI (Ireland); FCT/MCTES (Portugal); and ERC and PRACE (EU). A description of the Planck Collaboration and a list of its members, indicating which technical or scientific activities they have been involved in, can be found at http://www.cosmos.esa.int/web/planck/planck-collaboration. This research has made use of data from the OVRO 40-m monitoring program, which is supported in part by NASA grants NNX08AW31G, NNX11A043G, and NNX14AQ89G and NSF grants AST-0808050 and AST-1109911. We also thank the Spanish MINECO for partial financial support under project AYA2015-64508-P and funding from the European Union’s Horizon 2020 research and innovation programme (COMPET-05-2015) under grant agreement number 687312 (RADIOFOREGROUNDS). This work was supported in part by the ESAC Science Faculty award ESAC-362/2015. This research has made use of the NASA/IPAC Extragalactic Database (NED), which is operated by the Jet Propulsion Laboratory, California Institute of Technology, under contract with the National Aeronautics and Space Administration.References
- Acero et al. (2015) Acero, F., Ackermann, M., Ajello, M., et al., Fermi Large Area Telescope Third Source Catalog. 2015, ApJS, 218, 23, 1501.02003
- Altman (1992) Altman, N. S., An Introduction to Kernel and Nearest-Neighbor Nonparametric Regression. 1992, The American Statistician, 46, 175
- Angel & Stockman (1980) Angel, J. R. P. & Stockman, H. S., Optical and infrared polarization of active extragalactic objects. 1980, ARA&A, 18, 321
- Barreiro et al. (2003) Barreiro, R. B., Sanz, J. L., Herranz, D., & Martínez-González, E., Comparing filters for the detection of point sources. 2003, MNRAS, 342, 119, astro-ph/0302245
- Beichman et al. (1988) Beichman, C. A., Neugebauer, G., Habing, H. J., Clegg, P. E., & Chester, T. J., eds. 1988, Infrared astronomical satellite (IRAS) catalogs and atlases. Volume 1: Explanatory supplement, Vol. 1
- Benedetti (1977) Benedetti, J. K., On the nonparametric estimation of regression functions. 1977, Journal of the Royal Statistical Society. Series B. Methodological, 39, 248
- Boggs & Rogers (1990) Boggs, P. T. & Rogers, J. E. 1990, in Statistical analysis of measurement error models and applications (Arcata, CA, 1989) (Providence, Rhode Island: Amer. Math. Soc., Providence, RI), 183–194
- D’Abrusco et al. (2014) D’Abrusco, R., Massaro, F., Paggi, A., et al., The WISE Blazar-like Radio-loud Sources: An All-sky Catalog of Candidate -ray Blazars. 2014, ApJS, 215, 14, 1410.0029
- De Zotti et al. (2015) De Zotti, G., Castex, G., González-Nuevo, J., et al., Extragalactic sources in Cosmic Microwave Background maps. 2015, J. Cosmology Astropart. Phys., 6, 018, 1501.02170
- De Zotti et al. (2010) De Zotti, G., Massardi, M., Negrello, M., & Wall, J., Radio and millimeter continuum surveys and their astrophysical implications. 2010, A&A Rev., 18, 1, 0908.1896
- De Zotti et al. (2005) De Zotti, G., Ricci, R., Mesa, D., et al., Predictions for high-frequency radio surveys of extragalactic sources. 2005, A&A, 431, 893, astro-ph/0410709
- Epinat et al. (2008) Epinat, B., Amram, P., Marcelin, M., et al., GHASP: an H kinematic survey of spiral and irregular galaxies - VI. New H data cubes for 108 galaxies. 2008, MNRAS, 388, 500, 0805.0976
- Giommi et al. (2012a) Giommi, P., Polenta, G., Lähteenmäki, A., et al., Simultaneous Planck, Swift, and Fermi observations of X-ray and -ray selected blazars. 2012a, A&A, 541, A160, 1108.1114
- Giommi et al. (2012b) Giommi, P., Polenta, G., Lähteenmäki, A., et al., Simultaneous Planck, Swift, and Fermi observations of X-ray and -ray selected blazars. 2012b, A&A, 541, A160, 1108.1114
- González-Nuevo et al. (2006) González-Nuevo, J., Argüeso, F., Lopez-Caniego, M., et al., The Mexican hat wavelet family: application to point-source detection in cosmic microwave background maps. 2006, MNRAS, 369, 1603
- González-Nuevo et al. (2008) González-Nuevo, J., Massardi, M., Argüeso, F., et al., Statistical properties of extragalactic sources in the New Extragalactic WMAP Point Source (NEWPS) catalogue. 2008, MNRAS, 384, 711, 0711.2631
- Górski et al. (2005) Górski, K. M., Hivon, E., Banday, A. J., et al., HEALPix: A Framework for High-Resolution Discretization and Fast Analysis of Data Distributed on the Sphere. 2005, ApJ, 622, 759, astro-ph/0409513
- Gregory et al. (1996) Gregory, P. C., Scott, W. K., Douglas, K., & Condon, J. J., The GB6 Catalog of Radio Sources. 1996, Astrophys. J. Suppl., 103, 427
- Greve et al. (2014) Greve, T. R., Leonidaki, I., Xilouris, E. M., et al., Star Formation Relations and CO Spectral Line Energy Distributions across the J-ladder and Redshift. 2014, ApJ, 794, 142, 1407.4400
- Healey et al. (2007) Healey, S. E., Romani, R. W., Taylor, G. B., et al., CRATES: An All-Sky Survey of Flat-Spectrum Radio Sources. 2007, ApJS, 171, 61, astro-ph/0702346
- Helou & Walker (1988) Helou, G. & Walker, D. W., eds. 1988, Infrared astronomical satellite (IRAS) catalogs and atlases. Volume 7: The small scale structure catalog, Vol. 7, 1–265
- Herranz et al. (2009) Herranz, D., López-Caniego, M., Sanz, J. L., & González-Nuevo, J., ”A novel multifrequency technique for the detection of point sources in cosmic microwave background maps”. 2009, MNRAS, 394, 510
- Herranz & Sanz (2008) Herranz, D. & Sanz, J. L., ”Matrix Filters for the Detection of Extragalactic Point Sources in Cosmic Microwave Background Images”. 2008, IEEE Journal of Selected Topics in Signal Processing, 2, 727
- Herranz & Vielva (2010) Herranz, D. & Vielva, P., Cosmic Microwave Background Images. 2010, Signal Processing Magazine, IEEE, 27
- Hovatta et al. (2007) Hovatta, T., Tornikoski, M., Lainela, M., et al., Statistical analyses of long-term variability of AGN at high radio frequencies. 2007, A&A, 469, 899, 0705.3293
- Jolliffe (2002) Jolliffe, I. T. 2002, Principal Component Analysis (Springer Science & Business Media)
- Kennicutt & Evans (2012) Kennicutt, R. C. & Evans, N. J., Star Formation in the Milky Way and Nearby Galaxies. 2012, ARA&A, 50, 531, 1204.3552
- Knuth (2006) Knuth, K. H., Optimal Data-Based Binning for Histograms. 2006, ArXiv Physics e-prints, physics/0605197
- Königl (1981) Königl, A., Relativistic jets as X-ray and gamma-ray sources. 1981, ApJ, 243, 700
- López-Caniego et al. (2007) López-Caniego, M., González-Nuevo, J., Herranz, D., et al., Nonblind Catalog of Extragalactic Point Sources from the Wilkinson Microwave Anisotropy Probe (WMAP) First 3 Year Survey Data. 2007, ApJS, 170, 108, astro-ph/0701473
- López-Caniego et al. (2009) López-Caniego, M., Massardi, M., González-Nuevo, J., et al., Polarization of the WMAP Point Sources. 2009, ApJ, 705, 868, 0909.4311
- López-Caniego & Vielva (2012) López-Caniego, M. & Vielva, P., Biparametric adaptive filter: detection of compact sources in complex microwave backgrounds. 2012, MNRAS, 421, 2139
- Marriage et al. (2011) Marriage, T. A., Baptiste Juin, J., Lin, Y.-T., et al., The Atacama Cosmology Telescope: Extragalactic Sources at 148 GHz in the 2008 Survey. 2011, ApJ, 731, 100, 1007.5256
- Massardi et al. (2016) Massardi, M., Bonaldi, A., Bonavera, L., et al., The Planck-ATCA Co-eval Observations project: analysis of radio source properties between 5 and 217 GHz. 2016, MNRAS, 455, 3249, 1511.02605
- Massardi et al. (2011) Massardi, M., Bonaldi, A., Bonavera, L., et al., The Planck-ATCA Co-eval Observations project: the bright sample. 2011, MNRAS, 415, 1597, 1101.0225
- Massaro et al. (2009) Massaro, E., Giommi, P., Leto, C., et al., Roma-BZCAT: a multifrequency catalogue of blazars. 2009, A&A, 495, 691, 0810.2206
- Massaro et al. (2015) Massaro, E., Maselli, A., Leto, C., et al., The 5th edition of the Roma-BZCAT. A short presentation. 2015, Ap&SS, 357, 75, 1502.07755
- Moore & Stockman (1981) Moore, R. L. & Stockman, H. S., The class of highly polarized quasars - Observations and description. 1981, ApJ, 243, 60
- Murphy et al. (2010) Murphy, T., Sadler, E. M., Ekers, R. D., et al., The Australia Telescope 20 GHz Survey: the source catalogue. 2010, MNRAS, 402, 2403, 0911.0002
- Nieppola et al. (2007) Nieppola, E., Tornikoski, M., Lähteenmäki, A., et al., 37 GHz Observations of a Large Sample of BL Lacertae Objects. 2007, AJ, 133, 1947, 0705.0887
- Nieppola et al. (2006) Nieppola, E., Tornikoski, M., & Valtaoja, E., Spectral energy distributions of a large sample of BL Lacertae objects. 2006, A&A, 445, 441, astro-ph/0509045
- O’Dea (1998) O’Dea, C. P., The Compact Steep-Spectrum and Gigahertz Peaked-Spectrum Radio Sources. 1998, PASP, 110, 493
- Parkin et al. (2012) Parkin, T. J., Wilson, C. D., Foyle, K., et al., The gas-to-dust mass ratio of Centaurus A as seen by Herschel*. 2012, Monthly Notices of the Royal Astronomical Society, 422, 2291
- Planck Collaboration ES (2015) Planck Collaboration ES. 2015, The Explanatory Supplement to the Planck 2015 results, http://wiki.cosmos.esa.int/planckpla2015 (ESA)
- Planck Collaboration VII (2011) Planck Collaboration VII, Planck early results. VII. The Early Release Compact Source Catalogue. 2011, A&A, 536, A7, 1101.2041
- Planck Collaboration XIII (2011) Planck Collaboration XIII, Planck early results. XIII. Statistical properties of extragalactic radio sources in the Planck Early Release Compact Source Catalogue. 2011, A&A, 536, A13, 1101.2044
- Planck Collaboration XIV (2011) Planck Collaboration XIV, Planck early results. XIV. ERCSC validation and extreme radio sources. 2011, A&A, 536, A14, 1101.1721
- Planck Collaboration XV (2011) Planck Collaboration XV, Planck early results. XV. Spectral energy distributions and radio continuum spectra of northern extragalactic radio sources. 2011, A&A, 536, A15, 1101.2047
- Planck Collaboration XVIII (2014) Planck Collaboration XVIII, Planck 2013 results. XVIII. The gravitational lensing-infrared background correlation. 2014, A&A, 571, A18, 1303.5078
- Planck Collaboration XXVIII (2014) Planck Collaboration XXVIII, Planck 2013 results. XXVIII. The Planck Catalogue of Compact Sources. 2014, A&A, 571, A28, 1303.5088
- Planck Collaboration I (2016) Planck Collaboration I, Planck 2015 results. I. Overview of products and results. 2016, A&A, 594, A1, 1502.01582
- Planck Collaboration IV (2016) Planck Collaboration IV, Planck 2015 results. IV. LFI beams and window functions. 2016, A&A, 594, A4, 1502.01584
- Planck Collaboration VI (2016) Planck Collaboration VI, Planck 2015 results. VI. LFI maps. 2016, A&A, 594, A6, 1502.01585
- Planck Collaboration VII (2016) Planck Collaboration VII, Planck 2015 results. VII. High Frequency Instrument data processing: Time-ordered information and beam processing. 2016, A&A, 594, A7, 1502.01586
- Planck Collaboration VIII (2016) Planck Collaboration VIII, Planck 2015 results. VIII. High Frequency Instrument data processing: Calibration and maps. 2016, A&A, 594, A8, 1502.01587
- Planck Collaboration XXVI (2016) Planck Collaboration XXVI, Planck 2015 results. XXVI. The Second Planck Catalogue of Compact Sources. 2016, A&A, 594, A26, 1507.02058
- Planck Collaboration XXVIII (2016) Planck Collaboration XXVIII, Planck 2015 results. XXVIII. The Planck Catalogue of Galactic Cold Clumps. 2016, A&A, 594, A28, 1502.01599
- Planck Collaboration Int. VII (2013) Planck Collaboration Int. VII, Planck intermediate results. VII. Statistical properties of infrared and radio extragalactic sources from the Planck Early Release Compact Source Catalogue at frequencies between 100 and 857 GHz. 2013, A&A, 550, A133, 1207.4706
- Planck Collaboration Int. XVIII (2015) Planck Collaboration Int. XVIII, Planck intermediate results. XVIII. The millimetre and submillimetre emission from planetary nebulae. 2015, A&A, 573, A6, 1403.4723
- Planck Collaboration Int. XXXI (2016) Planck Collaboration Int. XXXI, Planck intermediate results. XXXI. Microwave survey of Galactic supernova remnants. 2016, A&A, 586, A134, 1409.5746
- Planck Collaboration Int. XLV (2016) Planck Collaboration Int. XLV, Planck intermediate results. XLV. Radio spectra of northern extragalactic radio sources. 2016, A&A, 596, A106, 1606.05120
- Richards et al. (2014) Richards, J. L., Hovatta, T., Max-Moerbeck, W., et al., Connecting radio variability to the characteristics of gamma-ray blazars. 2014, MNRAS, 438, 3058, 1312.3634
- Richards et al. (2011) Richards, J. L., Max-Moerbeck, W., Pavlidou, V., et al., Blazars in the Fermi Era: The OVRO 40 m Telescope Monitoring Program. 2011, ApJS, 194, 29, 1011.3111
- Snellen et al. (1998) Snellen, I., Schilizzi, R., Bremer, M., Miley, G., & De Bruyn, G. 1998, in Observational Cosmology: With the New Radio Surveys Proceedings of a Workshop held in a Puerto de la Cruz, Tenerife, Canary Islands, Spain, 13–15 January 1997, ed. M. N. Bremer, N. Jackson, & I. Pérez-Fournon (Dordrecht: Springer Netherlands), 241–246
- Tucci et al. (2011) Tucci, M., Toffolatti, L., de Zotti, G., & Martínez-González, E., High-frequency predictions for number counts and spectral properties of extragalactic radio sources. New evidence of a break at mm wavelengths in spectra of bright blazar sources. 2011, A&A, 533, A57, 1103.5707
- Turin (1960) Turin, G. L., An introduction to matched filters. 1960, Information Theory, IRE Transactions on, 6, 311
- Vieira et al. (2010) Vieira, J. D., Crawford, T. M., Switzer, E. R., et al., Extragalactic Millimeter-wave Sources in South Pole Telescope Survey Data: Source Counts, Catalog, and Statistics for an 87 Square-degree Field. 2010, ApJ, 719, 763, 0912.2338
- Wright et al. (1994) Wright, A. E., Griffith, M. R., Burke, B. F., & Ekers, R. D., The Parkes-MIT-NRAO (PMN) surveys. 2: Source catalog for the southern survey (delta greater than -87.5 deg and less than -37 deg). 1994, ApJS, 91, 111
Appendix A Theory of the matched multi-filters
A.1 Multi-frequency detection
Let us consider the problem of detecting and estimating the flux density of a source that is located at a given point of the sky defined by the position vector .191919For the sake of clarity, throughout this paper we use a notation according to which bold italic symbols will denote vectors on the sphere (in either the spatial or Fourier domains), whereas plain boldface symbols will denote vectors and matrices in the electromagnetic frequency domain. Let the source be measured over positions at different frequency channels with different angular beam responses . For convenience, let us normalize the angular responses so that , . Then the flux density of the source at a given position and channel can be written as
| (2) |
where is the unknown amplitude of the source in the th channel. We assume no prior knowledge about the values of , but we consider that the profiles are sufficiently well characterized by the instrument’s optics and the telescope’s observing strategy. Now let the source be embedded in a mixture of CMB, Galactic and extragalactic foregrounds, and instrumental noise. We will refer to this mixture as the generalized noise. Let us model this generalized noise as a random process whose second-order statistics are either known a priori or can be directly estimated from the data:202020If the sources are not very numerous or extremely bright, a good approximation of the power spectrum of the generalized noise is given just by the cross-power spectrum of the images. Note, however, that since the ingredients of the mixture of CMB and foregrounds depend on the position on the sky, the generalized noise must be computed locally rather than globally.
| (3) |
where is the cross-power spectrum matrix of the generalized noise, is a vector in Fourier space212121It is convenient, both theoretically and computationally, to define the filters in Fourier space, and so the vector can be interpreted as a wavevector for Fourier analysis. We do not use the standard notation in order to avoid confusion with the index in Eq. (2) and later. Since we are working with flat-sky patches, we can use with the planar Fourier transform instead of spherical harmonics. However, this is not essential for the discussion here, and all the formulae in this paper can be easily adapted to the spherical domain. and the asterisk denotes complex conjugation. When the generalized noise is added to the source signal, the observed data becomes
| (4) |
for . A useful quantity to consider is the peak S/N of the source in channel , defined as
| (5) |
where is the rms of the generalized noise in the th channel. A typical way to enhance the detectability of a source in an individual channel is to spatially filter the data with a suitable filter , so that the rms of the filtered generalized noise, , is conveniently reduced and the peak signal-to-noise ratio of the source is maximized (e.g. Barreiro et al. 2003, and references therein). The gain of the filter is defined as the ratio
| (6) |
In this equation, is the amplitude of the source in the th channel after filtering. It is always possible to normalize the filter in such a way that the amplitude of the sources is not altered, and then the gain reduces to
| (7) |
The optimal linear filter regarding the gain, for an individual channel, is the well known matched filter (see for example Turin 1960). The members of the Mexican hat wavelet family achieve in practice almost as good results as matched filters and have been thoroughly used in CMB analysis, for example in the construction of the PCCS2 (González-Nuevo et al. 2006; López-Caniego et al. 2007, 2009; Herranz & Vielva 2010; Planck Collaboration VII 2011; Planck Collaboration XXVIII 2014; Planck Collaboration XXVI 2016). More recently, the biparametric adaptive filter (BAF, López-Caniego & Vielva 2012) was proposed, which reaches virtually the same gains as the matched filter, while allowing a simpler and faster implementation.
Multi-frequency detection aims to further improve the gain by taking advantage either of the distinctive frequency dependence of the individual sources, or the statistical properties of the generalized noise, or both. But knowledge about the frequency dependence of most sources is scarce. For synchrotron-dominated SEDs it is typical to approximate the spectral behaviour by a power law
| (8) |
where is some fiducial frequency of reference and is the spectral index of the source. Using this kind of parametrization, a multi-frequency detection technique was applied to WMAP data in lanz13. However, the parametrization (8) is valid only for certain frequency and flux density intervals. Even if most of the radio sources exhibit synchrotron power-law SEDs in the low-frequency regime, variations from one particular source to another are large enough to make it impossible to describe all of them with a single frequency law. Moreover, these sources show a rich complexity of behaviour, at intermediate and higher frequencies. Therefore we choose to use a multi-frequency detection method that does not make any a priori assumption about the frequency dependence of the sources, relying only on the multi-frequency statistical properties of the generalized noise to maximize the probability of detection of any kind of point source embedded in it.
A.2 Matched multi-filters
The matched matrix filters (MTXFs) approach was introduced in Herranz & Sanz (2008) and further explored in Herranz et al. (2009) as a solution to the problem of multi-frequency detection of extragalactic point sources when the frequency dependence of the sources is not known a priori. The MTXFs have already been used inside the Planck Collaboration to validate the LFI part of the PCCS catalogue (Planck Collaboration XXVIII 2014) and we will use them in this paper. So let us summarize the main aspects of MTXF theory.
Let be a set of linear filters, and for the data images let us define the filtered images
| (9) | |||||
The quantity in equation (9) is, therefore, the sum of a set of linear filterings of the data described in (4) by the filters . The rms of the filtered data can be calculated as the square root of the variance
| (10) |
In Herranz & Sanz (2008) it was shown that the set of filters that minimize the variance for all , without changing the values of the individual amplitudes of the sources (independently of what kind of frequency dependence they have) is given by the matrix equation
| (11) |
where
| (12) |
are matrices for any value of and where
| (13) |
This set of filters assumes a structure that is best expressed in the form of a matrix equation, hence the name matched matrix filters. For different channels, the matrix equation gives a set of linear filters that operate over the channels to produce filtered images, one for each channel, where the gain factor of point sources is maximized.
It is straightforward to show that when the filters (11) are applied to a set of images, at the position of a given compact source the filtered images take values , with
| (14) |
that is, the filters are unbiased estimators of the flux density of the source in every one of the channels. This is guaranteed by the algebraic structure of the filters, that is such that the following orthonormality condition is satisfied:
| (15) |
This relation guarantees that the flux density of a point source in the th channel does not leak into the th filtered image. On the other hand, if there is some degree of statistical correlation between the generalized noise in the th and th channels, the terms in Eq. (A.2) contribute to decreasing the filtered rms to a level that is lower than the one achieved by single-frequency matched filters. As shown in Herranz & Sanz (2008) and Herranz et al. (2009), it can be shown that for the filters (11) the variance (10) is minimized, i.e. the MTXFs are not only unbiased but also achieve statistical maximum efficiency among the class of linear filters when the SED of the sources is not known a priori. In other words, the matrix filters remove noise not only by filtering in the scale domain, but also by cleaning out medium- and large-scale structures that are present in neighbouring channels, while leaving unaltered the flux densities of sources. In the particular case where
| (16) |
i.e. where the noise is totally uncorrelated among channels, it can be seen that the elements of the matrix of filters default to
| (17) |
In that case the matrix of filters becomes a diagonal matrix whose non-zero elements are the complex conjugates of the matched filters that correspond to each channel. In the case of circularly symmetric source profiles and statistically homogeneous and isotropic noise, the filters are real-valued and the whole process is equivalent to filtering each channel independently with the corresponding single-frequency matched filter.
Appendix B Practical considerations of the implementation of the matched multi-filters for the PCNT
In Herranz et al. (2009) the MTXFs were applied to realistic pre-launch simulations of the Planck-LFI + 100-GHz channels. The work served as a testbed for the capabilities of the MTXF approach and provided several practical lessons about the implementation of the technique.
The first of these lessons can be derived analytically from Eqs. (11) to (15). When the generalized noise is uncorrelated among channels the matrix of filters defaults to a diagonal matrix whose non-zero elements are the complex conjugates of the matched filters that correspond to each channel. In the case of circularly symmetric source profiles and statistically homogeneous and isotropic noise, the filters are real-valued and the whole process is equivalent to filtering each channel independently with the appropiate matched filter.
The second lesson learnt from Herranz et al. (2009) is that when the MTXF are applied to a set of frequency channels ordered by increasing (or decreasing) frequency, , the gains tend to be higher for the intermediate channels, and smaller for the peripheral channels. For the channels that are at the limits of the interval ( and ), the gain tends to reach values similar to those obtained by single frequency matched filters. There is no obvious theoretical reason for this to happen, but intuitively it seems logical that the noise reduction works better when there is information about the correlated noise at frequencies on either side (which of course was the same driving reason for Planck to have frequency coverage on both sides of the CMB channels).
The third lesson is related to equations (16) and (17). For the MTXFs to improve the gain factors with respect to the single-frequency matched filter, it is necessary to have some degree of correlation between the generalized noise in different channels. Correlation between generalized noise appears due to the presence of common physical processes on the sky: for example, synchrotron emission at 30 GHz correlates with synchrotron emission at 44 GHz. This implies that it makes little sense to mix together in the analysis frequency channels that are too far apart in the electromagnetic spectrum. The matrix tends to have a band structure whose elements decrease rapidly away from the diagonal. If we add too many channels to the MTXF we gain little in terms of noise reduction, but we gain in computational complexity and potentially harmful numerical effects. It is convenient to find a compromise for the number of channels to consider simultaneously: too few channels means we lose gain power, but too many channels can lead to computational and numerical problems. We have found that channels is a good compromise for the case of Planck.
A fourth practical consideration pertains to the implicit and explicit assumptions of the filtering technique. The two basic statistical assumptions at the core of the MTXF technique are: (a) that the generalized noise (CMB + diffuse Galactic and extragalactic foregrounds + instrumental noise) is described by a random process sufficiently well described by its second-order statistics as in Eq. (3); and (b) that the sources are point-like and the beam point spread functions at all the observing frequencies are well known, so that the orthonormality condition (Eq. 15) is satisfied. The first assumption is typical of most detection/estimation methods used in CMB astronomy and it is usually met at least in regions of the sky where Galactic emission is not too strong. In the following we will assume that the generalized noise is sufficiently well-behaved, but it should be noted as a caveat that the performance of the filters, particularly regarding the accuracy of their photometric estimation, can degrade in the vicinity of bright regions, especially in and around the Galactic plane.
Regarding the characterization of the sources as point-like compact objects, problems can arise in two cases: (a) when sources are extended; and (b) when the angular beam responses are not well characterized. In both cases the orthonormality condition (Eq. 15) is not met and signal can leak from one frequency channel to others, thus affecting the quality of the photometry of individual sources.222222 The orthonormality condition is crucial here. The MTXF method is combining images, mixing them and producing new filtered images, each one corresponding to one of the original channels. For each of the output channels we wish to detect and to estimate the flux density of the sources corresponding to that channel, and only that channel We do not wish, for example, to look at a 70-GHz source and get its flux density mixed with (for example) its flux density at 143 GHz. The way to guarantee that this is not happening is to satisfy Eq. (15): if this condition is met, we can be sure that the MTXF procedure is cleaning contamination without mixing the flux densities of the sources with their flux densities at neighbouring frequencies. Let us for the moment focus on the second case. Planck beams are reasonably well approximated by circularly symmetric two-dimensional Gaussians with effective beam widths, as described in Planck Collaboration I (2016), Planck Collaboration IV (2016) and Planck Collaboration VII (2016), except for one frequency, the LFI 44-GHz channel. The LFI 44-GHz optical layout is composed of three pairs of beams (LFI24 to LFI26), two of them with effective and a third with effective (see Planck Collaboration IV 2016). Moreover, the individual ellipticities of these beams do not compensate each other perfectly, leading to a non-circular total beam. The beam heterogeneity of the 44-GHz channel makes it difficult to combine it with other channels in the MTXF scheme. For this reason, in this paper the 44-GHz channel is treated separately from the other channels, as described below.
Taking these considerations into account, for this work we have run the MTXF on sets of four channels (30–100 GHz, 44–143 GHz, 70–217 GHz, 100–353 GHz, 143–545 GHz, and 217–857 GHz). Except for the obvious cases of 30 and 857 GHz, we accept flux densities for the final catalogue only for frequencies that are intermediate. That is, the 100-GHz flux density could only come from the 44–143-GHz or 70–217-GHz runs. Every time a channel is intermediate to two or more runs of the MTXF (for example, 143 GHz is intermediate for the runs 70–217 GHz and 100–353 GHz), we choose for the final catalogue the case with a higher average S/N. Exception is made for the 44-GHz channel, whose non-circular, non-Gaussian effective beam puts into question the orthonormality condition (Eq. 15). For the 44-GHz channel we have thus opted to adopt the following rule.
-
•
The photometry at 44 GHz is obtained from the 30–100-GHz run of the MTXF, as described above. Due to the non-ideality of the 44-GHz beam the flux density estimates for this channel will be less accurate than for the rest of the Planck mission. In particular, for this case we observe that the 44-GHz MTFX flux densities are underestimated with respect to previous Planck catalogues.
-
•
The 44-GHz MTXF flux densities must be corrected for this effect. We have used the PCCS2 sources as calibrators to obtain an average correction (only for the 44-GHz channel). The PCCS2 flux densities have been extensively checked and calibrated by the Planck team (Planck Collaboration XXVI 2016) and thus we trust PCCS2 flux densities to be reliable calibrators, particularly taking into account that we are using the same sky images. The correction factor is obtained by calculating the average ratio between the 44-GHz PCCS2 and the 44 GHz MTXF flux densities for sources with 44-GHz PCCS2 flux densities mJy. The resulting factor is 1.36. We use this average ratio as a multiplicative calibration factor to obtain the final 44-GHz MTXF flux densities.
-
•
In order to avoid contamination from the non-Gaussian sources at 44 GHz leaking into the neighbour channels at 30 and 70 GHz, we have performed a separate run of the filters using only the 30-, 70-, 100-, and 143-GHz bands. Flux densities at 30 and 70 GHz come from this particular run.
For the rest of the channels (from 100 to 857 GHz) we follow the more general rule described above.
B.1 MTXF photometry
By construction, MTXFs are normalized in such a way that the value of the filtered images at the position of a given source in a given frequency channel is an unbiased estimator of the source amplitude in that channel, , as defined in Eq. (2), and in the same physical units as the input maps. Therefore the MTXF photometry, equivalent to the DETFLUX column in the PCCS and the PCCS2 (see a description of the various methods used for Planck photometry in Planck Collaboration XXVIII 2014; Planck Collaboration XXVI 2016), is obtained by just taking the value of the central pixel of the source and transforming it to flux density units (namely mJy).
While the extraction of the flux densities is straightforward, the true positions of the sources are not perfectly known. Since the input catalogue is constructed from a blind search on maps that are affected by foreground contamination and instrumental noise, there will be an unavoidable positional uncertainty, especially for the faintest sources. In order to deal with this uncertainty, we give as an estimation of the value of the local maximum of the filtered image inside a circle of radius equal to the FWHM at frequency centred at the coordinates of each target in the input catalogue. This gives us a better chance of catching the true position of the sources; however, on the other hand it makes MTXF photometry more sensitive to positive fluctuations of the background, which could lead to overestimates in the photometry. We will discuss this problem in more detail in Sect. 5.1.
As an estimate of the photometric error, we provide the rms of the filtered generalized noise, , calculated in a circular ring with inner radius of twice the FWHM (for frequency ) and outer radius of 5 times the FWHM, centred at the coordinates of the target.
Other photometric estimators, such as aperture photometry, can be useful for certain purposes, but cannot be directly applied to images filtered with the MTXF. This is because the output MTXF filtered images are zero-mean and the profiles of the filtered sources depend non-trivially on the statistics of the local foregrounds, which vary strongly across the sky. Additionally, application of any further filter (including aperture photometry) to optimally filtered maps results in a degradation of the S/N. Aperture photometry must therefore be calculated on the non-filtered images, where the S/N enhancement of the MTXF has not been gained. For this reason and although aperture photometry can be more robust than MTXF photometry for the case of extended sources, we do not provide APERFLUX values for this catalogue.
B.2 Blending effects
Since the Planck input catalogue is selected at two channels (30 and 143 GHz), it is possible that two or more targets selected at the channel with better angular resolution (143 GHz in this case) lie inside the same 30-GHz beam. In order to quantify the rate of occurrence of this kind of coincidence in our catalogue, we have performed an internal matching of the positions of the Planck input catalogue using a search radius of 32.′293 (the Planck Reduced Instrument Model FWHM at 30 GHz; Planck Collaboration ES 2015). We find 5130 groups (affecting a total of 9125 sources with at 30 GHz) within that search radius, most of them containing two sources, but some of them with as many as 35 closely clustered positions. The extreme cases are located around the Galactic plane and the Magellanic Clouds. To a lesser extent, the same effect applies to the intermediate 44-, 70-, and 100-GHz channels. When this occurs, the Planck multi-frequency catalogue of non-thermal sources will contain different entries for low-frequency sources that would be otherwise identified as single objects. In principle, each one of these entries will show a flux density that could be contaminated by overlap with the other targets in the vicinity convolved by the Planck beam at the corresponding observation frequency. Fortunately, we obtain the photometry of PCNT sources after filtering with the MTXF method. By construction, MTXFs tend to have a deconvolving effect on point sources at lower frequencies, at least in regard to photometric estimations.
In order to check the effect of source blending on MTXF photometry we have performed 1000 bootstrap simulations, injecting sources in regions devoid of bright sources in the Planck maps. The distribution of flux densities of the simulated sources follows the distribution of the PCNT catalogue. For each simulated source, we have simulated a companion source at a random angular distance (the FWHM values at 143 and 30 GHz, respectively), also following the PCNT flux density distribution. Then we have filtered the maps and have compared the filter photometry with the input value. We find that for sources with flux density mJy the average contamination is only 3 % in the worst channel case (30 GHz). In individual cases, the contamination can be large if the source under consideration has an ultra-bright companion, but due to the fast decline of the number counts at high flux densities these cases are rare. Therefore, we conclude that the contamination by source blending effects in the PCNT is small, and it should have little impact on the statistical properties of the catalogue. Nevertheless, to be on the safe side, we provide a Group_FLAG column in the catalogue, which takes the boolean value True for those sources that belong to groups, in the sense defined above. We recommend caution when using 30-GHz flux densities around and below the 500-mJy threshold for sources with Group_FLAG=True, especially if there is a much brighter (tens of janskys) source in the same group.