Current address]
Resonant torsion magnetometry in anisotropic quantum materials
Abstract
Unusual behavior of quantum materials commonly arises from their effective low-dimensional physics, which reflects the underlying anisotropy in the spin and charge degrees of freedom. Torque magnetometry is a highly sensitive technique to directly quantify the anisotropy in quantum materials, such as the layered high-Tc superconductors, anisotropic quantum spin-liquids, and the surface states of topological insulators. Here we introduce the magnetotropic coefficient , the second derivative of the free energy F with respect to the angle between the sample and the applied magnetic field, and report a simple and effective method to experimentally detect it. A sub-g crystallite is placed at the tip of a commercially available atomic force microscopy cantilever, and we show that can be quantitatively inferred from a shift in the resonant frequency under magnetic field. While related to the magnetic torque , takes the role of torque susceptibility, and thus provides distinct insights into anisotropic materials akin to the difference between magnetization and magnetic susceptibility. The thermodynamic coefficient is discontinuous at second-order phase transitions and subject to Ehrenfest relations with the specific heat and magnetic susceptibility. We apply this simple yet quantitative method on the exemplary cases of the Weyl-semimetal NbP and the spin-liquid candidate RuCl3, yet it is broadly applicable in quantum materials research.
pacs:
…Correlated quantum materials governed by strong electronic interactions commonly host a variety of competing and coexisting electronic phases, such as the copper- and iron-based high-Tc superconductors where charge ordering, high-temperature superconductivity and magnetism occur in close proximity Armitage et al. (2010). Mapping the associated phase diagram is a critical first step to understanding their physics. These phases are commonly characterized by anisotropic behavior that reflects the microscopic anisotropy in the spin and charge degrees of freedom. Prominent examples include anisotropy in the magnetic susceptibility of the cuprates Wang et al. (2005); Li et al. (2010); Sato et al. (2017), the identification of hidden-order phases in URu2Si2 and SmB6 Okazaki et al. (2011); Xiang et al. (2017) and the electronic nematicity of the iron-based superconductors Sprau et al. (2017); Fernandes et al. (2014).
While anisotropy is at the heart of quantum materials, its experimental signatures can be very subtle. An established and highly sensitive technique to probe small anisotropies in correlated metals and exotic magnets is torque magnetometry. When a sample with an anisotropic magnetization is placed in an external magnetic field , it experiences a torque . This torque can be measured with high accuracy by mounting a crystal onto a cantilever Rossel et al. (1996); Brugger et al. (1999); Ohmichi and Osada (2002); McCollam et al. (2011); Arnold et al. (2018); Heitmann (2010).
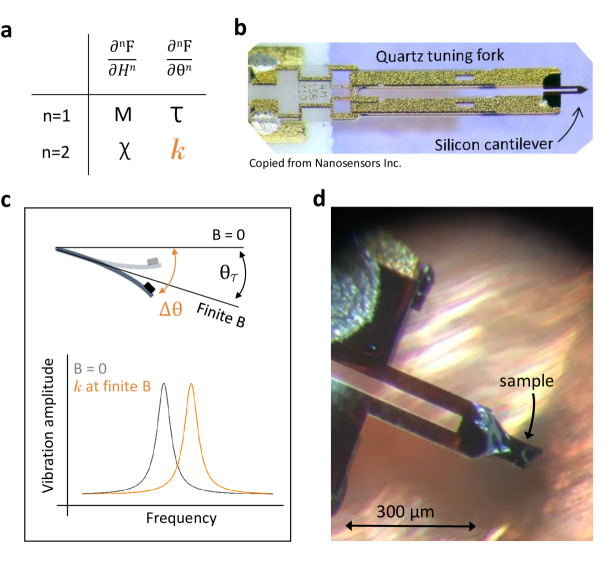
Both the magnetic torque and the magnetization are first derivatives of the free energy , and thus these thermodynamic parameters provide sensitive and essential information at phase transitions (Figure 1a). However, often the second derivatives of the free energy, such as the heat capacity , the magnetic susceptibility and the elastic moduli provide more fundamental insights into a material. They can be directly related to physical properties, such as the density of states, and are the essential quantities to formulate a microscopic theory. Unlike first derivatives, they exhibit discontinuities at second-order phase thansitions and their magnitudes can be related to one another through the Ehrenfest relations Callen (1985).
Here, we develop the theoretical framework of the magnetotropic coefficient as a second-order derivative. Related to the magnetic torque, the thermodynamic coefficient of torque susceptibility is directly linked to the magnetic anisotropy. We furthermore show a simple and effective technique for its direct measurement, “resonant torsion magnetometry”. In this approach, the sample is mounted onto a commercially-available self-resonating cantilever, and subjected to a magnetic field. While the magnetic torque itself bends the cantilever into a new static equilibrium, the magnetotropic coefficient induces an effective spring constant of the oscillator, which manifests itself into a frequency shift (Figure 1c). This approach to detect the magnetotropic coefficient is related to, yet distinct from, previous successful applications of resonant methods to detect the magnetic torque, such as “torque differential magnetometry” on nanometer-sized samples Banerjee et al. (2010); Bleszynski-Jayich et al. (2009); Jang et al. (2011); Kamra et al. (2015, 2014); Lee et al. (2012); Stipe et al. (2001). We demonstrate sensitivity of our probe and highlight its thermodynamic character on two exemplary quantum materials, one with charge- and the other with spin-dominated anisotropy. We measure quantum oscillations in the Weyl semimetal NbP Klotz et al. (2016); Shekhar et al. (2015) and the antiferromagnetic phase boundary of the spin-liquid candidate RuCl3 Baek et al. (2017); Banerjee et al. (017, 2016); Cao et al. (2016); Johnson et al. (2015); Kubota et al. (2015); Majumder et al. (2015).
To elucidate the physical distinction between the magnetic torque and the magnetotropic coefficient and to describe the measurement, we briefly review the energetics of the resonating sample. In the harmonic approximation, the energy of a cantilever with effective stiffness , moment of inertia (see methods) and an attached sample can be written as
| (1) |
The first two terms describe the kinetic and potential energies of the bare cantilever and together determine the base oscillation frequency, . We parameterize the motion of the lever as it vibrates by an angle at the tip of the lever where the sample is mounted (Figure 1c). The last two terms in Eq. 1 describe the anisotropic energy of the measured sample in the applied magnetic field. Both the torque and the magnetotropic coefficient appear as coefficients in a Taylor expansion of the free energy , and they manifest themselves in distinct physical responses of the sample. The torque shifts the equilibrium angle about which the lever oscillates to (Figure 1c). The magnetotropic coefficient encodes the curvature of the free energy with respect to the rotation angle, and appears as a shift in the oscillation frequency, . For small frequency shifts, this can be expanded as
| (2) |
Therefore can be directly determined by a simple measurement of the resonance frequency of the cantilever.
To illustrate the different behaviors of and , we turn to the simple case of the linear response regime. Here, the magnetization is proportional to the magnetic field strength , and the free energy is . Accordingly, the angle dependences of the torque and the magnetotropic coefficient strongly differ.
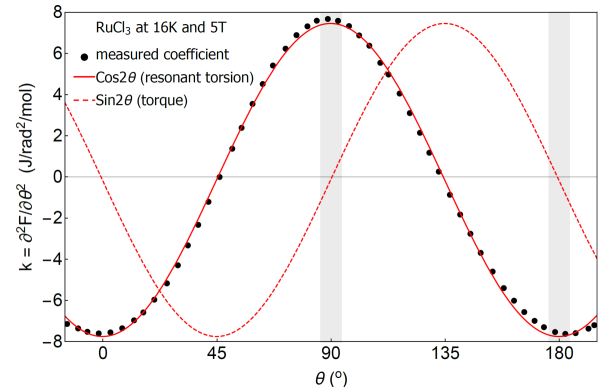
Indeed, the angle dependence expected for the magnetotropic coefficient instead of the magnetic torque is observed in a resonant torsion measurement of RuCl3 at low fields within the linear regime (Figure 2). The signal of resonant torsion is thus maximal for fields along the axes of symmetry, a disadvantageous field orientation for conventional torque measurements. Along these important symmetry directions, the magnetic torque is small and subject to an undesirable torque interaction effect – where small changes in lead to large changes in the magnetic torque. We note that only in the linear regime is the shift in frequency simply related to the average deflection angle. In general anisotropic quantum materials and in fields exceeding the linear response, the former is not caused by the latter and the two are independent characteristics of the magnetic anisotropy of the material.
Unlike many sensitive magnetic measurement methods, resonant torsion does not require large specialized laboratory instrumentation. Self-resonating oscillatory force sensors for scanning probe microscopy are commercially available at high quality, such as the Akiyama Probe (A-Probe) used in these experiments Akiyama et al. (2010). The A-probe is made of two separate resonators: a silicon U-shaped cantilever (310 m long and 3.7 m thick) and a quartz tuning fork (2.4 mm long and 100 m thick) (Figure 1b) Akiyama et al. (2010). The lowest vibration mode of the coupled cantilever system is roughly 50 kHz and produces an out-of-plane motion at the tip of the cantilever. The frequency of this mode is highly sensitive to any external influence, which is the basis of resonant torsion microscopy.

The resonance frequency as a function of temperature and magnetic field can be conveniently tracked by a phase-locked loop (see methods). In order to demonstrate the sensitivity of the technique, we measure quantum oscillations in the Weyl semimetal NbP Klotz et al. (2016); Shekhar et al. (2015) up to 3 T (Figure 3). This semimetal is non-magnetic, and its entire magnetic response at low fields is due to the weak Landau diamagnetism of the conduction electrons. With the magnetic field applied along the crystallographic c-axis, where the magnetic torque is zero, we can resolve quantum oscillations in fields well below 1 T. The quantum oscillation frequencies for this field orientation agree with those reported in the literature Klotz et al. (2016); Shekhar et al. (2015). With a characteristic response bandwidth of 1 Hz, the smallest detectable frequency shift is , where is the effective bending stiffness of the lever (see methods). With = 180 nJ/rad2, the smallest detectable magnetotropic coefficient is = J/rad2, equivalent to at 1 T. This can be used to estimate the required mass of a metallic crystallite to be investigated by resonant torsion magnetometry. Even in only weakly anisotropic metals (1 anisotropy), which would contribute 0.01 per formula unit, only 1012 formula units are needed to resolve a signal at the demonstrated sensitivity. For a 3 angstrom unit cell size, this corresponds to a 3 cubic m sample size or a sample weight of 0.1 ng for a sample density of 5 g/cm3. Resonant torsion magnetometry is thus ideally suited to investigate challenging materials where only the smallest particles exist in single crystal form.
In addition to the high sensitivity, the magnetotropic coefficient can provide valuable insight into the thermodynamics of a system via the Ehrenfest relation. can be more formally defined as a member of a matrix of second derviatives of the free energy when temperature , volume , magnetic field strength , and magnetic field orientation are independent variables. The relation of to other thermodynamic coefficients is directly apparent from the behavior of the thermodynamic potential in the , and variables
| (3) |
In polar coordinates, and denote absolute values.
We can derive the Ehrenfest relation that relates a discontinuous jump in the resonant torsion to other thermodynamic coefficients. If we assume that is the boundary of a second-order phase transition induced by the magnetic field angle measured at a fixed volume and magnetic field , then continuity of all first derivatives () across such a boundary, and , requires that discontinuous jumps in the three thermodynamic coefficients , , and are all related to each other:
| (4) |
Here and are short segments along the phase boundary in the phase plane, such that The Ehrenfest relation connecting the jump in the magnetotropic coefficient and the jump in the heat capacity is
| (5) |
where the derivative is to be taken along the phase boundary at fixed magnetic field. Similarly, Ehrenfest relations between the jumps in , , and give and , where the derivatives in the two relations must be taken along the phase boundary at fixed temperature and at a fixed field orientation, respectively.
In order to demonstrate these thermodynamic relations, we refer again to RuCl3, an effective spin-1/2 quantum magnet that orders antiferromagnetically at = 7 K Cao et al. (2016). Below this temperature, long-range order can be suppressed with a magnetic field of 8 T for fields applied within the honeycomb planes Kubota et al. (2015); Majumder et al. (2015), with recent evidence suggesting a spin liquid state at higher magnetic fields Baek et al. (2017); Banerjee et al. (017).
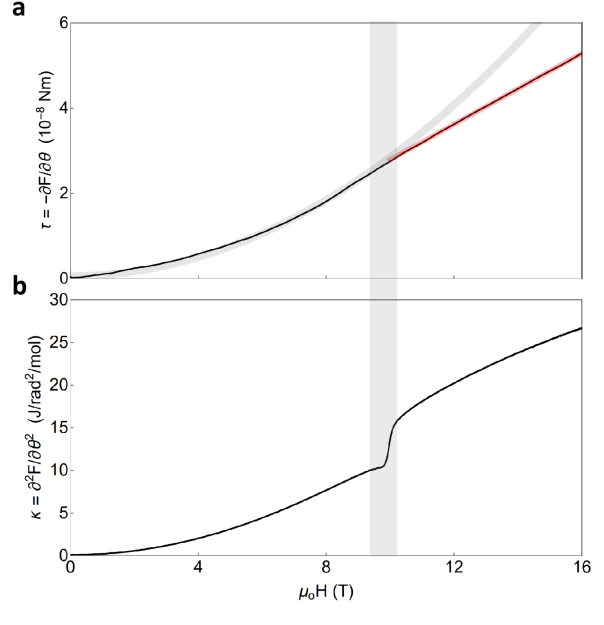
We measure RuCl3 at T = 1.3 K – well within the antiferromagnetically ordered state Johnson et al. (2015); Majumder et al. (2015) – to observe the evolution of the magnetic torque and the resonant torsion as we cross the second-order phase boundary with increasing magnetic field (Figure 4). With small fields at an angle 10∘ away from the honeycomb planes, both and respond quadratically to the applied magnetic field. For this field orientation, we observe the suppression of long-range order at 9 T. Across the phase boundary, shows a break in slope crossing over to linear behavior at higher magnetic fields, whereas experiences a discontinuous jump. Akin to the advantages of techniques sensing the magnetic susceptibility compared to magnetization, detecting offers a more appropriate means for identifying magnetic phase transitions.
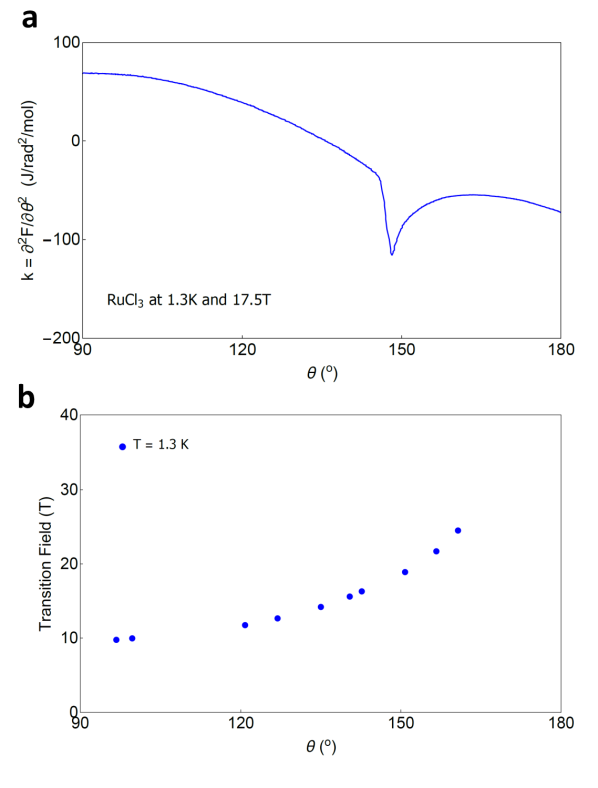
The experimentally observed jump 6 J/rad2/mol in this configuration (Figure 4b) can be directly compared to heat capacity measurements under magnetic field. can be estimated from the angle dependence of the resonant torsion of RuCl3 at fixed temperature and magnetic field. One such scan at T = 1.3 K and H = 17.5 T (Figure 5a) shows a pronounced anomaly at the phase boundary of the long-range ordered state. Entry the ordered state is marked by a jump at the phase boundary, as required by Equation 5. Such measurements at various fixed magnetic fields allow to map out the phase boundary of the antiferromagnetically ordered state (Figure 5b). The derivative at T = 1.3 K, H = 10 T, and = 102∘ can be estimated as T/rad and K/T. The heat capacity jump at the antiferromagnetic transition at T = 1.3 K has been reported as 1.7 mJ/mol/K2 Kubota et al. (2015). Thus the right hand side of Eq. 5 gives approximately 8 J/rad2/mol, in agreement with the size of the measured jump of 6 J/rad2/mol found above. This quantitative agreement is remarkable, especially given the uncertainties of the derivatives due to the complex shape of the phase boundary.
Resonant torsion magnetometry is a highly sensitive, quantitative and simple method to probe the magnetic anisotropy of the smallest crystallites of quantum matter. The magnetotropic coefficient provides valuable information about anisotropic materials, complementing the magnetic torque. First, direct measurement of clearly signals second-order phase transitions by discontinuous jumps that can be related to anomalies in other thermodynamic measurements. Resonant torsion magnetometry thus serves as an alternative tool for measuring magnetic phase transitions in environments that are challenging for other thermodynamic techniques. Second, measurements of this coefficient allows direct access to the magnetic anisotropy when magnetic field is aligned the principal magnetic axes – a blindspot for conventional torque magnetometry. Finally, the ability to measure shifts in the resonant frequency of lever vibrations much more precisely than the amplitude of lever deflections results in better than part per 100 million sensitivity and the opportunity to measure sub-nanogram sized samples. In the area of materials discovery, microscopic crystallites commonly occur and resonant torsion magnetometry provides a new route to conveniently determine the anisotropy of new quantum materials.
I Acknowledgments
The authors would like to thank the electronics workshop at the Max Planck Institute for Chemical Physics of Solids, particularly Dominic Hibsch, Wolfgang Geyer, and Torsten Breitenborn. We also thank Terunobu Akiyama for helpful discussions. Synthesis and characterization of the NbP single crystals was performed at Los Alamos National Laboratory under the auspices of the US Department of Energy, Office of Basic Energy Sciences, Division of Materials Sciences and Engineering. The portion of this work completed at the National High Magnetic Field Laboratory is supported through the National Science Foundation Cooperative Agreement numbers DMR-1157490 and DMR-1644779, The United States Department of Energy, and the State of Florida. M.D.B. acknowledges studentship funding from EPSRC under grant no. EP/I007002/1. RDM acknowledges support from LANL LDRD-DR 20160085 topology and strong correlations.
References
- Armitage et al. (2010) N. P. Armitage, P. Fournier, and R. L. Greene, Reviews of Modern Physics (2010), 10.1103/revmodphys.82.2421.
- Wang et al. (2005) Y. Wang, L. Li, M. J. Naughton, G. D. Gu, S. Uchida, and N. P. Ong, Phys. Rev. Lett. (2005).
- Li et al. (2010) L. Li, Y. Wang, S. Komiya, S. Ono, Y. Ando, G. D. Gu, and N. P. Ong, Phys Rev B (2010).
- Sato et al. (2017) Y. Sato, S. Kasahara, H. Murayama, Y. Kasahara, E.-G. Moon, T. Nishizaki, T. Loew, J. Porras, B. Keimer, T. Shibauchi, and Y. Matsuda, Nat. Phys. (2017), 10.1038/nphys4205.
- Okazaki et al. (2011) R. Okazaki, T. Shibauchi, H. J. Shi, H. Y., T. D. Matsuda, E. Yamamoto, Y. Onuki, H. Ikeda, and Y. Matsuda, Science (2011), 10.1126/science.1197358.
- Xiang et al. (2017) Z. Xiang, B. Lawson, T. Asaba, C. Tinsman, L. Chen, C. Shang, X. H. Chen, and L. Li, Phys. Rev. X (2017), 10.1103/physrevx.7.031054.
- Sprau et al. (2017) P. Sprau, A. Kostin, A. Kreisel, A. Boehmer, V. Taufour, P. Canfield, S. Mukherjee, P. Hirschfeld, B. Andersen, and S. J. Davis, Science (2017).
- Fernandes et al. (2014) R. Fernandes, A. Chubukov, and J. Schmalian, Nature Physics (2014).
- Rossel et al. (1996) C. Rossel, B. P., Z. D., J. Hofer, W. M., and H. Keller, J. Appl. Phys. (1996), 10.1063/1.362550.
- Brugger et al. (1999) J. Brugger, M. Despont, C. Rossel, H. Rothuizen, P. Vettiger, and M. Willemin, Sensors and Actuators (1999), 10.1016/s0924-4247(98)00240-4.
- Ohmichi and Osada (2002) E. Ohmichi and T. Osada, Rev. Sci. Instrum. (2002), 10.1063/1.1491999.
- McCollam et al. (2011) A. McCollam, P. G. van Rhee, J. Rook, E. Kampert, U. Zeitler, and J. C. Maan, Rev Sci Instrum (2011), 10.1063/1.3595676.
- Arnold et al. (2018) F. Arnold, N. Naumann, T. Lühmann, A. P. Mackenzie, and E. Hassinger, Review of Scientific Instruments (2018), 10.1063/1.5011655.
- Heitmann (2010) D. Heitmann, ed., Quantum Materials (Springer, 2010).
- Callen (1985) H. B. Callen, Thermodynamics and an introduction to thermostatics (John Wiley & Sons, 1985).
- Banerjee et al. (2010) P. Banerjee, F. Wolny, D. V. Pelekhov, M. R. Herman, K. C. Fong, U. Weissker, T. Muehl, Y. Obukhov, A. Leonhardt, B. Buechner, and P. C. Hammel, Appl Phys Lett (2010), 10.1063/1.3440951.
- Bleszynski-Jayich et al. (2009) A. C. Bleszynski-Jayich, W. E. Shanks, B. Peaudecerf, E. Ginossar, F. von Oppen, L. Glazman, and J. G. E. Harris, Science (2009), 10.1126/science.1178139.
- Jang et al. (2011) J. Jang, D. G. Ferguson, V. Vakaryuk, R. Budakian, S. B. Chung, P. M. Goldbart, and Y. Maeno, Science (2011), 10.1126/science.1193839.
- Kamra et al. (2015) A. Kamra, S. von Hoesslin, N. Roschewsky, J. Lotze, M. Schreier, R. Gross, S. T. Goennenwein, and H. Huebl, The European Physical Journal B (2015).
- Kamra et al. (2014) A. Kamra, M. Schreier, H. Huebl, and S. T. B. Goennenwein, Phys Rev B (2014), 10.1103/physrevb.89.184406.
- Lee et al. (2012) S. Lee, E. W. Moore, S. A. Hickman, J. G. Longenecker, and J. A. Marohn, J Appl Phys (2012).
- Stipe et al. (2001) B. C. Stipe, H. J. Mamin, T. D. Stowe, T. W. Kenny, and D. Rugar, Phys Rev Lett (2001), 10.1103/physrevlett.86.2874.
- Klotz et al. (2016) J. Klotz, S.-C. Wu, C. Shekhar, Y. Sun, M. Schmidt, M. Nicklas, M. Baenitz, M. Uhlarz, J. Wosnitza, C. Felser, and B. Yan, Phys. Rev. B (2016), 10.1103/physrevb.93.121105.
- Shekhar et al. (2015) C. Shekhar, A. K. Nayak, Y. Sun, M. Schmidt, M. Nicklas, I. Leermakers, U. Zeitler, Y. Skourski, J. Wosnitza, Z. Liu, Y. Chen, W. Schnelle, H. Borrmann, Y. Grin, C. Felser, and B. Yan, Nat. Phys. (2015), 10.1038/NPHYS3372.
- Baek et al. (2017) S.-H. Baek, S.-H. Do, K.-Y. Choi, Y. S. Kwon, A. U. B. Wolter, S. Nishimoto, J. van den Brink, and B. Buechner, Phys. Rev. Lett. (2017), https://doi.org/10.1103/PhysRevLett.119.037201.
- Banerjee et al. ( 017) A. Banerjee, J. Yan, J. Knolle, C. A. Bridges, M. B. Stone, M. D. Lumsden, D. G. Mandrus, D. A. Tennant, R. Moessner, and S. E. Nagler, Science (2-017).
- Banerjee et al. (2016) A. Banerjee, C. A. Bridges, J.-Q. Yan, A. A. Aczel, L. Li, M. B. Stone, G. E. Granroth, M. D. Lumsden, Y. Yiu, J. Knolle, S. Bhattacharjee, D. Kovrizhin, R. Moessner, D. A. Tennant, D. G. Mandrus, and S. E. Nagler, Nature Materials (2016), 10.1038/nmat4604.
- Cao et al. (2016) H. B. Cao, A. Banerjee, J. Q. Yan, C. A. Bridges, M. D. Lumsden, D. G. Mandrus, D. A. Tennant, B. C. Chakoumakos, and S. E. Nagler, Phys. Rev. B (2016).
- Johnson et al. (2015) R. D. Johnson, S. C. Williams, A. A. Haghighirad, J. Singleton, V. Zapf, P. Manuel, I. I. Mazin, Y. Li, H. O. Jeschke, R. Valenti, and R. Coldea, Phys. Rev. B (2015), 10.1103/physrevb.92.235119.
- Kubota et al. (2015) Y. Kubota, H. Tanaka, T. Ono, Y. Narumi, and K. Kindo, Phys. Rev. B (2015), 10.1103/physrevb.91.094422.
- Majumder et al. (2015) M. Majumder, M. Schmidt, H. Rosner, A. A. Tsirlin, H. Yasuoka, and M. Baenitz, Phys. Rev. B (2015), 10.1103/PhysRevB.91.180401.
- Akiyama et al. (2010) T. Akiyama, N. F. de Rooij, U. Staufer, M. Detterbeck, D. Braendlin, S. Walmeier, and M. Scheidiger, Rev. Sci. Instrum. (2010), 10.1063/1.3455219.
- Kageshima et al. (2002) M. Kageshima, H. Jensenius, M. Dienwiebel, Y. Nakayama, H. Tokumoto, S. P. Jarvis, and T. H. Oosterkamp, Appl Surf Sci (2002).
- Shekhter et al. (2013) A. Shekhter, B. J. Ramshaw, R. Liang, W. N. Hardy, D. A. Bonn, F. Balakirev, R. D. McDonald, J. B. Betts, S. C. Riggs, and A. Migliori, Nature (2013), 10.1038/nature12165.
- Ramshaw et al. (2015) B. J. Ramshaw, A. Shekhter, R. D. McDonald, J. B. Betts, J. N. Mitchell, P. H. Tobash, C. H. Mielke, E. D. Bauer, and A. Migliori, Proc Natl Acad Sci U S A (2015), 10.1073/pnas.1421174112.
- Landau and Lifshitz (1959) L. D. Landau and E. M. Lifshitz, Theory of Elasticity (Pergamon Press, 1959).
II Methods
Our measurements were done in a 16 T superconducting magnet and a 35 T resistive Bitter magnet. Approximately 10 mbar of exchange gas was maintained in the sample chamber during these measurements. Under these conditions, we found that an optimal drive voltage of 10 mV provides good sensitivity without causing the lever to ring. Frequency scans with an output voltage as high as 50 mV show no shift in the observed resonant frequency of the cantilever, confirming that the lever responds linearly to the deflection.
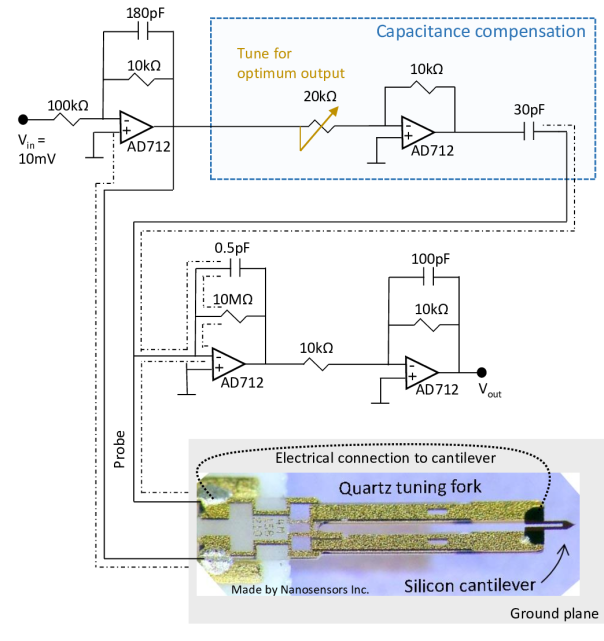
The experimental setup requires a method for tracking the frequency of the mechanical resonance of the cantilever as a function of temperature and magnetic field. The motion of the cantilever couples to the tuning fork, which has two contacts used to measure the electrical resonance of the parallel LC circuit. The pickup signal is lockin-detected at the drive frequency. Due to the internal capacitance of the tuning fork and cabling, the voltage induced on the pickup contact is non-zero and has a finite phase with respect to the drive signal, even when the vibration amplitude is negligible away from the resonance. The finite background impedance, which also changes as a function of temperature, may inhibit the magnitude of the sharp phase change expected on resonance. A large phase change across the resonance is required for successful tracking with the phase-locked loop (PLL). To correct for the background phase, we incorporate a capacitance compensation circuit based on the one recommended by Nanosensors Inc. (Figure 6) Akiyama et al. (2010); Kageshima et al. (2002).
In order to precisely measure the small piezoelectric current due to the mechanical motion of the cantilever at resonance, the parasitic capacitance between the gold contacts on the tuning fork must be compensated in the circuit. Our experimental setup is shown in Figure 6. Here, the output from the capacitance compensation line is inverted and summed with the measured response of the cantilever at resonance to detect the piezoelectric current due to the lever motion. At zero magnetic field, the background capacitance is nulled with the potentiometer in order to obtain a large 180∘ phase shift on resonance. To reduce noise, the braided shield of a low-capacitance twisted pair directly connects the positive input of the current-voltage converter to a ground plane directly below the vibrating lever (Figure 6). The signal is then amplified to follow the resonant frequency with the PLL as it changes with magnetic field. We used the (PLL/PID) option of the Zurich Instruments mid-frequency lock-in (MFLI) amplifier with analog to digital to analog conversion. As a function of temperature, large changes in the background impedance (due to thermal contraction of the wiring, the inductance in electrical components, etc.) are observed. Thus, we use a custom program to adaptively follow the resonance, which maintains that the in-phase and quadrature components of the frequency scan around the resonance are centered at zero Shekhter et al. (2013); Ramshaw et al. (2015).
denotes an bending stiffness of the lever. The actual shape of the cantilever can be described in the thin-plate approximation Landau and Lifshitz (1959) by , where is the displacement of the lever at a distance from the point of attachment. In the thin-plate approximation, the shape of can be determined from the energy functional , where is the cross-sectional area of the lever, is the moment of inertia of the cross section of the lever, is the length and is the density. This form of energy allows a straightforward derivation of the boundary conditions for a cantilever of non-uniform crossection. With this, is defined as the rotation angle at the tip of the lever . Thus, and in Eq. 1 must be found from the detailed solution for the shape of the resonance mode. Not only do and depend on the shape of the lever, both have different values when different resonant modes are considered in Eq. 1. For example, the effective bending stiffness for the lowest oscillating mode (without nodes) of a uniform cross-section cantilever is . The effective moment of inertia for the same mode is .