Large and realistic models of Amorphous Silicon
Abstract
Amorphous silicon (a-Si) models are analyzed for structural, electronic and vibrational characteristics. Several models of various sizes have been computationally fabricated for this analysis. It is shown that a recently developed structural modeling algorithm known as force-enhanced atomic refinement (FEAR) provides results in agreement with experimental neutron and x-ray diffraction data while producing a total energy below conventional schemes. We also show that a large model ( atoms) and a complete basis is necessary to properly describe vibrational and thermal properties. We compute the density for a-Si, and compare with experimental results.
pacs:
Valid PACS appear hereI INTRODUCTION
Amorphous silicon (a-Si) and its hydrogenated counterpart (a-Si:H) continue to play an important role in technological applications, such as thin-film transistors, active-matrix displays, image-sensor arrays, multi-junction solar cells, multilayer color detectors, thin-film position detectors, etc. Street (2000) While a number of traditional methods, based on Monte Carlo and molecular-dynamics simulations, were developed in the past decades by directly employing classical or quantum-mechanical force fields – from the event-based Wooten-Winer-Weaire (WWW) Djordjevic et al. (1995); Wooten et al. (1985) bond-switching algorithm and the activation-relaxation technique (ART) Barkema and Mousseau (1996); Mousseau and Barkema (2000) to the conventional melt-quench (MQ) molecular-dynamics simulations Drabold (2009); Tersoff (1988); Marks (2000); Car and Parrinello (1988); Drabold et al. (1990); Cooper et al. (2000) – none of the methods utilize prior knowledge or experimental information in the simulation of atomistic models of complex materials. It is now widely accepted that dynamical methods perform rather poorly to generate high-quality (i.e., defect-free) continuous-random-network (CRN) models of amorphous silicon by producing too many coordination defects (e.g., 3- and 5-fold coordinated atoms) in the networks. While the WWW algorithm and the ART can satisfactorily address this problem by producing 100% defect-free CRN models of a-Si, a direct generalization of the WWW algorithm for multicomponent systems is highly nontrivial in the absence of sufficient information on the bonding environment of the atoms. Likewise, the ART requires a detailed knowledge of the local minima and the saddle points on a given potential-energy surface in order to determine suitable low-lying minima that correspond to defect-free CRN models of amorphous silicon. On the other hand, the availability of high-precision experimental data from diffraction, infrared (IR), and nuclear magnetic resonance (NMR) measurements provide unique opportunities to develop methods, based on information paradigm, where one can directly incorporate experimental data in simulation methodologies. The reverse Monte Carlo (RMC) method McGreevy and Pusztai (1988); McGreevy (2001); Keen and McGreevy (1990); Biswas et al. (2004) is an archetypal example of this approach, where one attempts to determine the structure of complex disordered/amorphous solids by inverting experimental diffraction data. Despite its simplicity and elegance, the method produces unphysical structures using diffraction data only. While inclusion of appropriate geometrical/structural constraints can ameliorate the problem, the generation of high-quality models of a-Si, using constrained RMC simulations, has been proved to be a rather difficult optimization problem and satisfactory RMC models of a-Si have not been reported in the literature to our knowledge. The difficulty associated with the inversion of diffraction data using RMC simulations has led to the development of a number of hybrid approaches in the past decade.Opletal et al. (2017); Cliffe et al. (2017) Hybrid approaches retain the spirit of the RMC philosophy as far as the use of experimental data in simulations is concerned but go beyond RMC by using an extended penalty function, which involves total energy and forces from appropriate classical/quantum-mechanical force fields, in addition to few structural or geometrical constraints. The experimentally constrained molecular relaxation Biswas et al. (2007, 2005) (ECMR), the first-principle assisted structural solutions Meredig and Wolverton (2012) (FPASS), and the recently developed force-enhanced atomic relaxation Pandey et al. (2016a, 2015, b); Bhattarai et al. (2017) (FEAR) are a few examples of hybrid approaches, which have successfully incorporated experimental information in atomistic simulations to determine structures consistent with both theory and experiments. Recently, the FEAR has been applied successfully to simulate amorphous carbon (a-C). Bhattarai et al. (2017) This is particularly notable as the latter can exist in a variety of complex carbon bonding environment, which makes it very difficult to produce a-C from ab initio molecular-dynamics simulations due to the lack of glassy behavior and the WWW bond-switching algorithm in the absence of prior knowledge of the bonding states of C atoms in a-C (e.g., the ratio of - versus -bonded C atoms with a varying mass density). In this paper, we show that the information-based FEAR approach can be employed effectively to large-scale simulations of a-Si consisting of 1000 atoms. The resulting models have been found to exhibit superior structural, electronic, and vibrational properties of a-Si as far as the existing RMC and ab initio MD models are concerned in the literature.
The rest of paper is as follows. In section II, we discuss the computational methodology associated with the generation of CRN models using the FEAR method. This is followed by the validating properties of FEAR models with particular emphasis on the structural, electronic, vibrational, and thermal properties in section III. Section IV presents the conclusions of our work.
| Model | Å | Å | Å | n | 3-fold | 4-fold | 5-fold | |
|---|---|---|---|---|---|---|---|---|
| 216MQ | 16.28 | 2.36 | 3.81 | 4.083 | 0.93 | 87.03 | 11.57 | 0.000 |
| 216FEAR | 16.28 | 2.36 | 3.81 | 4.028 | 1.39 | 94.44 | 4.17 | -0.002 |
| 512FEAR | 21.71 | 2.35 | 3.82 | 4.008 | 1.17 | 95.90 | 2.73 | -0.044 |
| 1024FEAR | 27.35 | 2.36 | 3.79 | 4.018 | 2.34 | 94.53 | 3.13 | -0.035 |
| 4096WWW | 43.42 | 2.36 | 3.78 | 4.004 | 0.05 | 99.46 | 0.49 | — |
| 10000WWW | 57.32 | 2.31 | 3.69 | 4.014 | 0.04 | 98.60 | 1.30 | — |
II Methodology and Models
For this study, three model sizes (216, 512 and 1024 atoms) were implemented with FEAR and compared with experimental data. Several algorithms and codes were utilized for the preparation of the models; namely, FEARPandey et al. (2016a, 2015, b), RMCProfileTucker et al. (2007), SIESTASoler et al. (2002) and VASP.Kresse and Furthmuller (1996); Hacene et al. (2012); Hutchinson and Widom (2012)
A random starting structure was constructed for each of the models and was refined by fitting to the experimental pair correlation functions and/or the static structure factor by employing RMCProfile. The refined structure is relaxed using conjugate gradient (CG) in SIESTA. The relaxed-refined structure is then refined by RMCProfile. This cyclic process is repeated until convergence is achieved. For completeness the converged structure is then fully relaxed by VASP (plane wave LDA).
The partial refinement steps in RMCProfile were carried out with a minimum distance between atoms of 2.10 and maximum move distance of 0.15 – 0.35 . The partial relaxation steps utilized SIESTA with a single- basis set, Harris functional at constant volume, exchange-correlation functional with local-density approximation (LDA), periodic boundary conditions and a single relaxation step. The final relaxation step employed VASP with a plane-wave basis set, plane-wave cutoff of eV, energy difference criteria of . The fully relaxed calculations were performed for . For all the FEAR models, we have used structure factor data from Laaziri et.al.Laaziri et al. (1999) for RMC refinement.
The three FEAR models and 216 MQ model have a number density of about 0.05005 atom/, which is associated with atomic density of 2.33 (for details Table I). The 216 MQ model was fabricated by taking a set of random coordinates and equilibrating these coordinates at 3000K for 6ps, followed by cooling from 3000K to 300K within 9 ps, then equilibration at 300K for 4.5 ps, and a full relaxation at 300K. The MQ calculations were performed with a step size of 1.5 fs.
We have also considered two large (4096 atom and 10,000 atom) WWWDjordjevic et al. (1995); Wooten et al. (1985) models in our comparison. These two WWW models were relaxed using SIESTA with a single- basis set, LDA at constant volume utilizing Harris functional.111We minimized our 4096 WWW model to a have forces less than and for the 10,000 WWW model after CG steps, RMS force of was obtained.
III RESULTS AND DISCUSSION
III.1 Structural Properties
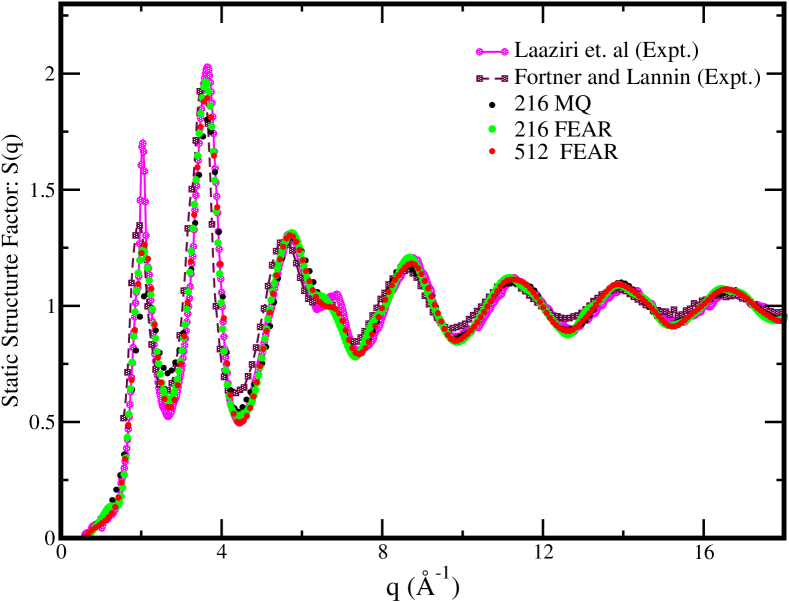
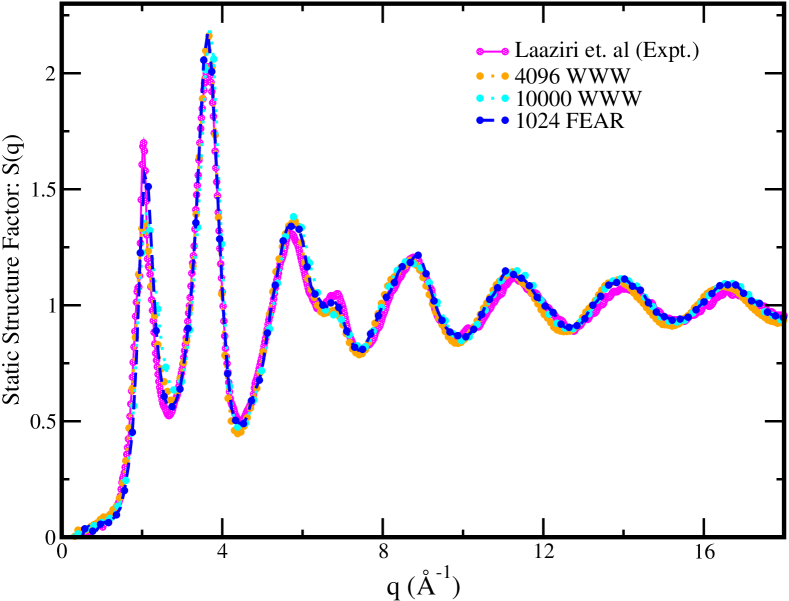
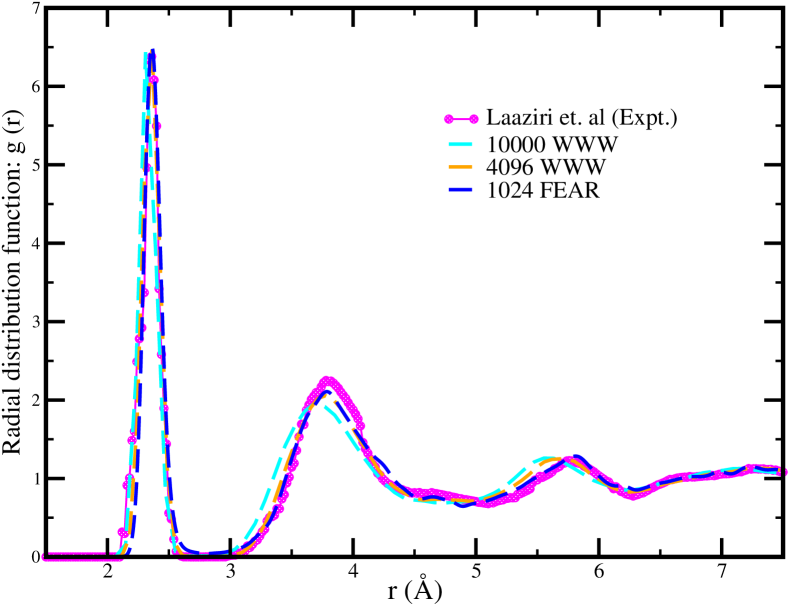
A comparison of structure factors for the six models 216 MQ, 216 FEAR, 512 FEAR, 1024 FEAR, 4096 WWW and 10,000 WWW models with respect to experimentLaaziri et al. (1999); Fortner and Lannin (1989) is shown in Fig. 1. From, Fig. 1(left panel) we can clearly observe that these models of up to 512 atoms is insufficient to resolve the first peak occurring at low q. In contrast, the 1024 FEAR model does well even in comparison to much larger models as seen in Fig. 1(right panel). This is also indicated in the real space information (Fig. 2), where we observe that 10000 WWW model is slightly shifted as compared to the experimentLaaziri et al. (1999) for the first and second neighbors peak. We report the details of our simulation and important observables in Table I.
From Table I, we observe that there are some defects in our models. These structural defects arise due to a small fraction () of over co-ordinated and under co-ordinated atoms. This explains the fact that all of our models have coordination value slightly above perfect four-fold coordination. Experimentally, it is also observed that a-Si does not posses a perfect four fold coordination.Laaziri et al. (1999); Fortner and Lannin (1989) Our final models obtained after relaxation attain energies (eV/atom) equal or less than models obtained from MQ.
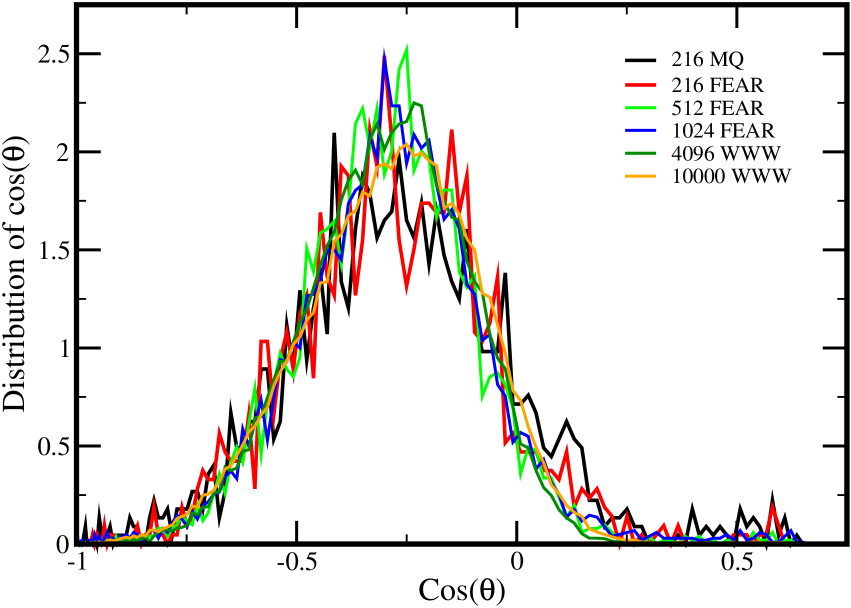
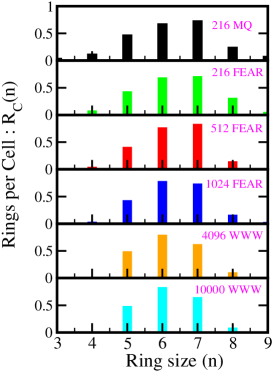
We further show our plots of bond-angle distribution in Fig. 2 (right panel) to attest accuracy of FEAR models. As seen in Fig. 2 the peak of the bond angle is close to the value of tetrahedral angle 109.47o. Similarly, from ring statistics (Fig.3) we observe that these a-Si networks mostly prefer a ring size of 5,6,7. Small rings (mostly 3-membered rings) are responsible for a unrealistic peak seen in unconstrained RMCPandey et al. (2016a) at an angle around . Opletal et. al. have proposed use of a constraint for removal of these highly constrained 3 membered rings in several of their works.Opletal et al. (2017, 2002) FEAR method which incorporates accurate ab initio interaction enables us to remove these high energy structures without satisfying an extra criterion.
III.2 Electronic Properties
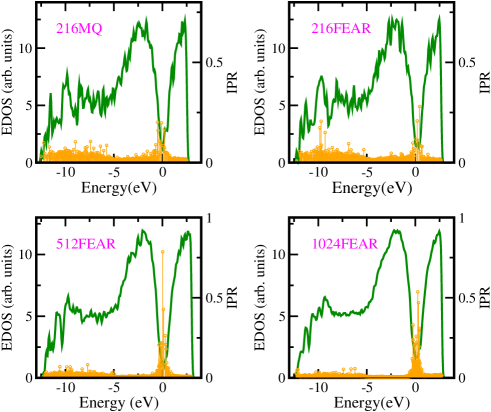
Electronic properties such as electronic density of states (EDOS) reveal crucial information regarding accuracy of models. In particular, Prasai et. al. and othersPrasai et al. (2016); Los and Kühne (2013) have used electronic information to aid in modeling amorphous system. Conversely, EDOS obtained for our models validate accuracy of our models. We have shown our plot of four models in Fig. 4. We have also studied the localization of electronic states by plotting inverse participation ratio (IPR) in conjunction with EDOS. We observe both plots with same qualitative resemblance with few localized states appearing near the Fermi energy (). These localized states arise due to the defects in the model (3-fold and 5-fold atoms).
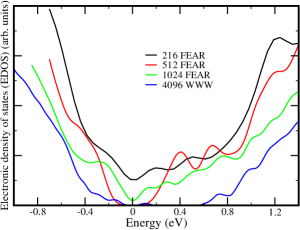
We compare our large model of 4096 atoms along with our FEAR models. Due to the gigantic size of this model, we have used Harris Functional and single- basis set to evaluate the electronic density of states of these models. To our knowledge this is first time reporting of an ab initio based EDOS of a-Si models this big. Drabold et. al. have previously carried out an extensive research regarding the exponential tail (valance and conduction) observed in amorphous silicon.Pan et al. (2008a); Drabold et al. (2011); Pan et al. (2008b) We report our result of EDOS for these models in Fig. 5. We observe that a 216 atom model gives us a very crude representation of these tails (valance and conduction). Meanwhile, FEAR models 512 and 1024 compare well with the large WWW models. Fedders et. alFedders et al. (1998) have revealed that the valance tail prefers short bonds while the conduction tail prefers long bonds.
III.3 Vibrational Density of States
III.3.1 Vibrational Properties
Vibrational density of states (VDOS) provides key information about the local bonding environments in amorphous solids. It is an important calculation to verify credibility of a model.Lopinski et al. (1996) Meanwhile, it is equally challenging to get a good comparison of vibrational properties between theoretical and experimental results. A lot of factors like: model size, completeness of basis set, etc. can affect vibrational properties. We have performed ionic-relaxation on our models to attain a local minimum with forces on each atom less than ( 0.01 eV/atom) while simultaneously relaxing lattice vectors to zero pressure. This results in slightly different number density and a non-orthogonal cell but as shown in our earlier work,Bhattarai and Drabold (2017) it is crucial to have coordinates well relaxed before evaluating vibrational properties of the models.
We have computed vibrational properties for our four models(216 MQ, 216 FEAR, 512 FEAR and 1024 FEAR) using the dynamical matrix. We displaced each atom in 6-directions(,,) with a small displacement of ( 0.015 ). After, each of these small displacement an ab initio force calculation was carried out to obtain force constant matrix (see details Bhattarai and Drabold (2016)). The VDOS for amorphous systems with N number of atoms is defined as,
| (1) |
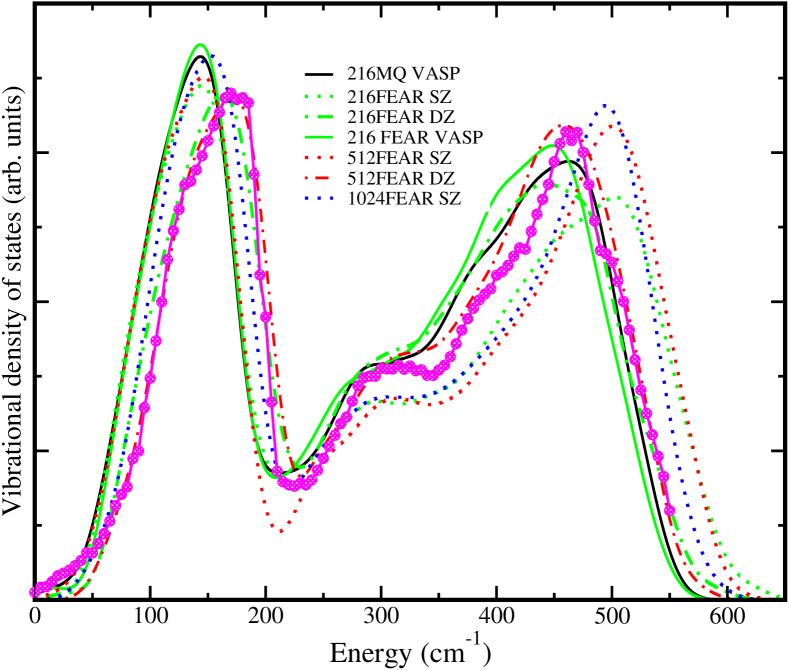
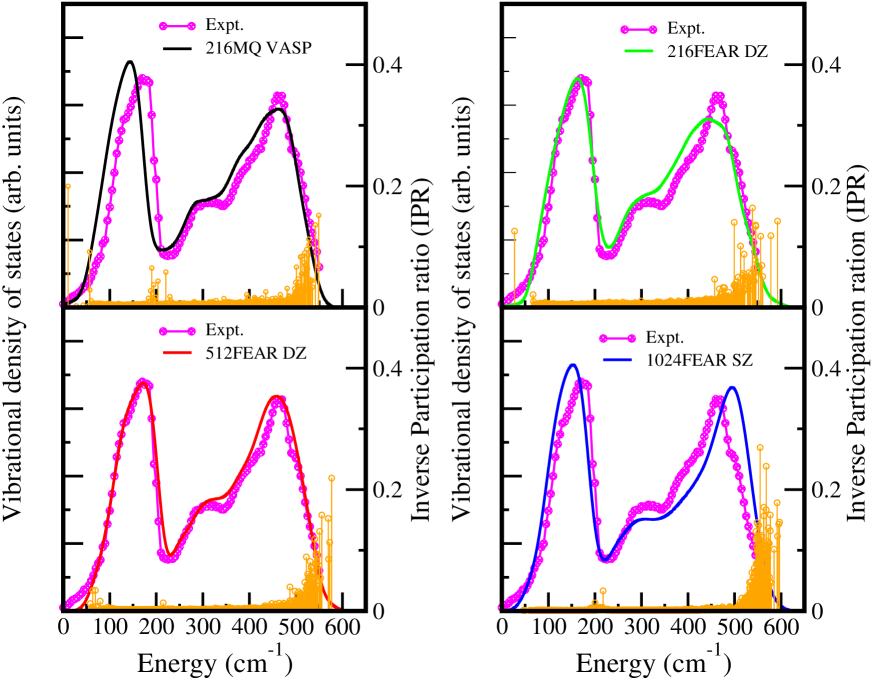
We have computed the VDOS for our models using the method of Gaussian broadening with a standard deviation of meV or 15.0 . The first three zero frequency modes are due to supercell translations, and have been neglected during our calculations of VDOS and vibrational IPR. We report the VDOS for our different models in Fig. 6.
As seen in Fig. 6, there is a slight horizontal shift in VDOS depending upon system size and completeness of basis set. VDOS calculated with minimal basis set (single-, SZ) in SIESTA has a qualitative agreement with the experimental result, while slight shift is observed at both low and high energies w.r.t the experiment. This result is refined by using a more complete basis-set (double-, DZ), which gives us a better agreement of our models with the experiment. We have computed VDOS using DZ for two of our models (FEAR 216 and FEAR 512). The VDOS obtained for FEAR 512 is strikingly similar to the experiment (Fig.6, right panel). This switch from minimal basis to double basis impacts computation time needed for these calculations and with our resources in hand we simply could not perform a DZ calculations for our FEAR 1024 atom system.
Thus, we can infer completeness of basis-set affects these low energy excitation of atoms in amorphous silicon. The most remarkable feature is the improvement at high frequencies. Based on our zero pressure (double-, DZ) calculation, it’s agreement with experimental VDOS and specific heat (Fig. 7), we predict new density for a-Si. Our predicted results are tabulated in Table. II and our results for the zero pressure (double-, DZ) calculation is close to the experimentally predicted density for a-Si(2.28 ).Custer et al. (1994)
| Models | Volume() | N() | |
|---|---|---|---|
| 216 FEAR(SZ) | 4643.77 | 0.046514 | 2.16 |
| 512 FEAR(SZ) | 10997.33 | 0.046557 | 2.17 |
| 1024 FEAR(SZ) | 21755.17 | 0.047067 | 2.19 |
| 216 FEAR (DZ) | 4510.57 | 0.047887 | 2.23 |
| 512 FEAR(DZ) | 10652.76 | 0.048062 | 2.24 |
| 1024 FEAR(DZ) | 21213.92 | 0.048270 | 2.25 |
Structural disorder in amorphous solids leads to localized modes and these localized modes can be evaluated by defining a quantity, the inverse participation ratio (IPR). Similar to electronic IPR, we can evaluate vibrational IPR using the obtained normalized displacement vectors. The IPR can be readily evaluated with the obtained normalized displacement vectors (), for the vibrations can be defined as (for mode),
| (2) |
The inverse participation ratio value of a localized mode is and for an extended mode is almost equal to zero. We have plotted IPR of our four models in Fig.6 (right panel). The vibrations at low energies are mostly extended modes, these represent mostly bending type while vibrations at higher energies are dominated by stretching type of modes.Bhattarai and Drabold (2016, 2017)
III.3.2 Specific Heat in the harmonic approximation
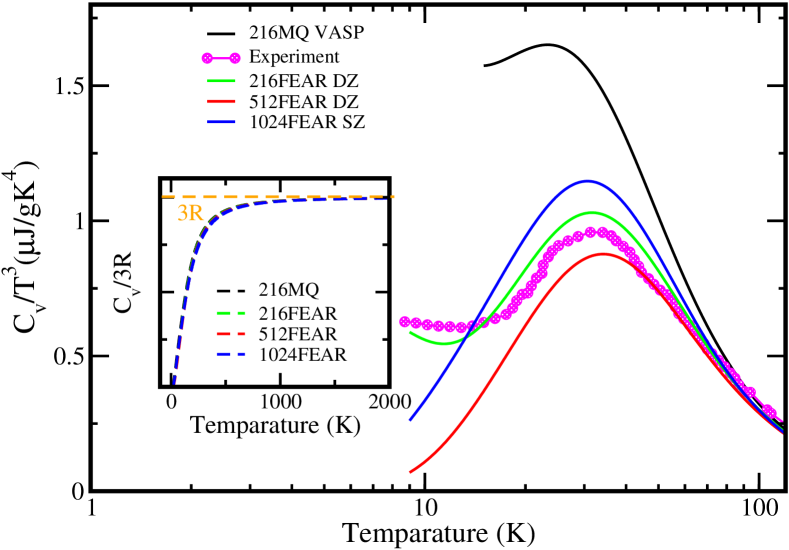
We evaluate the specific heat in the harmonic approximation using information of vibrational density of states obtained for our models. We compute the specific heat from the relationMaradudin et al. (1963)
| (3) |
Here, the is normalized to unityBhattarai and Drabold (2017); Nakhmanson and Drabold (2000). Our plot for specific heat is shown in Fig. 7. We have a qualitative agreement with the experiment for our four models while the peak around () is largely affected by the quality of VDOS obtained. Our three models FEAR-216(DZ), FEAR-512(DZ) and FEAR-1024(SZ) improves the previously agreement of different models with the experiment.Zink et al. (2006)
We infer from our calculation of VDOS and specific heat that a bigger size model together with a bigger basis set gives us a better understanding of these low energy excitations. This further outlines the importance of our method FEAR, with the resources available to us it is not possible to fabricate melt-quench models of size 512 and 1024 atoms.
IV Conclusions
This paper presents an investigation pertaining to the complex amorphous material (a-Si), which was evaluated with respect to its structural, electronic and vibrational properties. Various model types, MQ and FEAR, were constructed of different sizes for this investigation. Our results reveal that the recently developed FEAR method provides an accurate outcome, which correlates quite well with experimental data, even for relatively large structures sizes (512 and 1024). To our knowledge our VDOS result depicts the most clear picture of low energies excitations for a-Si. We also predict new density of amorphous silicon based on ab initio minimum, our prediction is remarkably close to the experimentally found density.
V Acknowledgment
The authors are thankful to the NSF under grant numbers DMR 1506836, DMR 1507118 and DMR 1507670.
We would like to thank Dr. Anup Pandey for helpful conversations. We also are thankful for the financial support from
Condensed Matter and Surface Science (CMSS) at Ohio University.
Lastly, we acknowledge computing time provided by the Ohio Supercomputer Center for this research. We also thank NVIDIA Corporation for donating a Tesla K40 GPU which was used in some of these computations.
References
- Street (2000) R. A. Street, ed., in Technology and Applications of Amorphous Silicon, Vol. 37 (Springer-Verlag Berlin Heidelberg, Singapore, 2000).
- Djordjevic et al. (1995) B. Djordjevic, M. Thorpe, and F. Wooten, Phys.Rev.B 52, 5685 (1995).
- Wooten et al. (1985) F. Wooten, K. Winer, and D. Weaire, Phys.Rev.Lett. 54, 1392 (1985).
- Barkema and Mousseau (1996) G. T. Barkema and N. Mousseau, Phys. Rev. Lett. 77, 4358 (1996).
- Mousseau and Barkema (2000) N. Mousseau and G. T. Barkema, Phys. Rev. B 61, 1898 (2000).
- Drabold (2009) D. A. Drabold, Eur.Phys.J. B 68, 1 (2009).
- Tersoff (1988) J. Tersoff, Phys. Rev. Lett. 61, 2879 (1988).
- Marks (2000) N. A. Marks, Phys.Rev.B 63, 035401 (2000).
- Car and Parrinello (1988) R. Car and M. Parrinello, Phys. Rev. Lett. 60, 204 (1988).
- Drabold et al. (1990) D. A. Drabold, P. A. Fedders, O. F. Sankey, and J. D. Dow, Phys. Rev. B 42, 5135 (1990).
- Cooper et al. (2000) N. Cooper, C. Goringe, and D. McKenzie, Computational Materials Science 17, 1 (2000).
- McGreevy and Pusztai (1988) R. L. McGreevy and L. Pusztai, Mol. Simul. 1, 359 (1988).
- McGreevy (2001) R. L. McGreevy, Journal of Physics: Condensed Matter 13, R877 (2001).
- Keen and McGreevy (1990) D. Keen and R. L. McGreevy, Nature 344, 423 (1990).
- Biswas et al. (2004) P. Biswas, R. Atta-Fynn, and D. A. Drabold, Phys. Rev. B 69, 195207 (2004).
- Opletal et al. (2017) G. Opletal, T. C. Petersen, A. S. Barnard, and S. P. Russo, J. Comput. Chem. 38, 1547 (2017).
- Cliffe et al. (2017) M. J. Cliffe, A. P. Bartok, R. N. Kerber, C. P. Grey, G. Csanyi, and A. L. Goodwin, Phys.Rev.B 95, 224108(1 (2017).
- Biswas et al. (2007) P. Biswas, R. Atta-Fynn, and D. A. Drabold, Phys. Rev. B 76, 125210 (2007).
- Biswas et al. (2005) P. Biswas, D. N. Tafen, and D. A. Drabold, Phys. Rev. B 71, 054204 (2005).
- Meredig and Wolverton (2012) B. Meredig and C. Wolverton, Nature Materials 12, 123 EP (2012).
- Pandey et al. (2016a) A. Pandey, P. Biswas, and D. A. Drabold, Scientific Reports 6, 33731 (2016a).
- Pandey et al. (2015) A. Pandey, P. Biswas, and D. A. Drabold, Phys.Rev.B 92, 155205 (2015).
- Pandey et al. (2016b) A. Pandey, P. Biswas, B. Bhattarai, and D. A. Drabold, Phys.Rev.B 94, 235208 (2016b).
- Bhattarai et al. (2017) B. Bhattarai, A. Pandey, and D. A. Drabold, arXiv:1712.01437 (2017).
- Laaziri et al. (1999) K. Laaziri, S. Kycia, S. Roorda, M. Chicoine, J. L. Robertson, J. Wang, and S. C. Moss, Phys. Rev. Lett. 82, 3460 (1999).
- Fortner and Lannin (1989) J. Fortner and J. S. Lannin, Phys. Rev. B 39, 5527 (1989).
- Tucker et al. (2007) M. G. Tucker, D. A. Keen, M. T. Dove, A. L. Goodwin, and Q. Hui, J. Phys.: Condens. Matter 19, 335218 (2007).
- Soler et al. (2002) J. M. Soler, E. Artacho, J. D. Gale, A. García, J. Junquera, P. Ordejon, and D. Sanchez-Portal, Journal of Physics: Condensed Matter 14, 2745 (2002).
- Kresse and Furthmuller (1996) G. Kresse and J. Furthmuller, Phys.Rev.B 54, 11169 (1996).
- Hacene et al. (2012) M. Hacene, A. Anciaux-Sedrakian, X. Rozanska, D. Klahr, T. Guignon, and P. Fleurat-Lessard, Journal of Computational Chemistry 33, 2581 (2012).
- Hutchinson and Widom (2012) M. Hutchinson and M. Widom, Computer Physics Communications 183, 1422 (2012).
- Note (1) We minimized our 4096 WWW model to a have forces less than and for the 10,000 WWW model after CG steps, RMS force of was obtained.
- Opletal et al. (2002) G. Opletal, T. Petersen, B. Omalley, I. Snook, D. G. Mcculloch, N. A. Marks, and I. Yarovsky, Mol. Sim. 28, 927 (2002).
- King (1967) S. King, Nature 213, 1112 (1967).
- Roux and Petkov (2010) S. Roux and V. Petkov, J. Appl. Cryst. 43, 181 (2010).
- Prasai et al. (2016) K. Prasai, P. Biswas, and D. A. Drabold, Phys. Status Solidi A 213, 1653 (2016).
- Los and Kühne (2013) J. H. Los and T. D. Kühne, Phys. Rev. B 87, 214202 (2013).
- Pan et al. (2008a) Y. Pan, F. Inam, M. Zhang, and D. A. Drabold, Phys. Rev. Lett. 100, 206403 (2008a).
- Drabold et al. (2011) D. A. Drabold, Y. Li, B. Cai, and M. Zhang, Phys. Rev. B 83, 045201 (2011).
- Pan et al. (2008b) Y. Pan, M. Zhang, and D. Drabold, Journal of Non-Crystalline Solids 354, 3480 (2008b).
- Fedders et al. (1998) P. A. Fedders, D. A. Drabold, and S. Nakhmanson, Phys. Rev. B 58, 15624 (1998).
- Kamitakahara et al. (1987) W. A. Kamitakahara, C. M. Soukoulis, H. R. Shanks, U. Buchenau, and G. S. Grest, Phys. Rev. B 36, 6539 (1987).
- Lopinski et al. (1996) G. P. Lopinski, V. I. Merkulov, and J. S. Lanin, Appl. Phys. Lett. 69, 3348 (1996).
- Bhattarai and Drabold (2017) B. Bhattarai and D. A. Drabold, Carbon 115, 532 (2017).
- Bhattarai and Drabold (2016) B. Bhattarai and D. A. Drabold, Journal of Non-Crystalline Solids 439, 6 (2016).
- Custer et al. (1994) J. S. Custer, M. O. Thompson, D. C. Jacobson, J. M. Poate, S. Roorda, W. C. Sinke, and F. Spaepen, Applied Physics Letters 64, 437 (1994).
- Zink et al. (2006) B. L. Zink, R. Pietri, and F. Hellman, Phys. Rev. Lett. 96, 055902 (2006).
- Maradudin et al. (1963) A. Maradudin, E. Montroll, and G. H. Weiss, “Theory of lattice dyanmics in the harmonic approximation,” in Theory of Lattice Dyanmics in the Harmonic Approximation (Academic Press, Newyork, 1963) p. 123.
- Nakhmanson and Drabold (2000) S. M. Nakhmanson and D. A. Drabold, Phys. Rev. B 61, 5376 (2000).