Algorithmic Collusion in Cournot Duopoly Market: Evidence from Experimental Economics
Nan Zhou1,2, Li Zhang2, Shijian Li2∗, Zhijian Wang1∗
1Experimental Social Science Laboratory,
2College of Computer Science and Technology,
Zhejiang University, Hangzhou, 310058, China
Abstract
Algorithmic collusion is an emerging concept. Whether algorithmic collusion is a creditable threat remains as an argument. In this paper, we propose an algorithm which can extort its human rival to collude in a Cournot duopoly competing market. In experiments, we show that, the algorithm can successfully extort its human rival and gets higher profit in long-run, meanwhile the human rival will fully collude with the algorithm. As a result, the social welfare declines rapidly and stably. Both in theory and in experiment, our work confirms that, algorithmic collusion can be a creditable threat. In application, we hope, the models of the algorithm design as well as the experiment environment illustrated in this work, can be an incubator or a test bed for researchers and policymakers to handle the emerging algorithmic collusion.
Keywords:
algorithmic collusion
Cournot duopoly model
experimental economics
game theory
collusion algorithm design
iterated prisoner’s dilemma
antitrust
mechanism design
Signature of this work
- 1.
-
2.
There is rare laboratory experiment on algorithm-human collusion, although human-human collusion experiments has 50 years’ history. [3]
-
3.
Cournot duopoly market, which is a basic model for antitrust study, is employed.
-
4.
A simple linear algorithm is developed to enforce human to collude in the market. (See Equation 4)
-
5.
Algorithmic collusion is, to the best our knowledge, firstly observed in our experiment.
-
6.
As the theoretical expectation, our algorithm can extort its human rival, at the same time, can facilitate the collusion in significant (See Table 3). Algorithmic collusion is driven by the human rival unilaterally optimizing his/her own payoff, so is inevitable.
-
7.
Provide an exemplificative experimental framework to understand algorithmic collusion, which can be an incubator for antitrust regulation design.
1 Introduction
1.1 Argument on the creditability of algorithmic collusion threat
Algorithmic collusion is an emerging concept in current artificial intelligence age (see Chapter 4 in [1], and [2] [4]) which was firstly raised by Ezrachi and Stucke in 2015 [5]. Today markets are substantially determined by algorithmic traders. Algorithm-driven market agents, however, poses a new and formidable challenge to existing antitrust laws [1]. If the practice hasn’t yet become fully visible for policymakers and regulators, the Topkins, Tord and Eturas cases suggests that it soon might. Scholars and policymakers have begun to focus on these potential algorithm threat, in which algorithmic collusion is a typical threat [1]. In Topkins-like crimes, the collusion is explicit collusion, because the seller had otherwise demonstrated a will to collude with other parties and then coded the algorithm to carry out the agreement. These collusion were not established automatically by algorithms, so Topkins-like algorithm wasn’t a real threat.
The real potential threat is the algorithm, which can facilitate collusion tacitly with its business rivals and they together damage the benefit of the whole market and society. On the threat, the antitrust communities are now split into two groups. Some of them argue that it is a actual and a credible threat [1, 6, 7, 8]. Yet, others argue that the possibility is only theoretical conjecture or something like scientific fictions [9, 10, 11, 12], or it is non-credible threat. In economics science, the argument can be simplified as a scientific question: When involving market competitions, whether algorithmic agents can really facilitate tacit collusion?
1.2 No experimental evidences to settle the argument
Facing such questions we turn to seek scientific evidences from laboratory economic experiments. Theoretically, there are many strategies that can be used to facilitate collusion [2]. For more than 50 years, economists have been doing experiments on the tacit collusion in human-human laboratory markets [3][16] [17][18]. But in algorithm-human competing markets, rare collusion confirmed empirically. In order to investigate the collusion, experimental economics has served as a test-bed for the market dynamics analysis, and as a incubator for market policymaking [13][14][15]. So, evidences from controlled laboratory experiments are expected.
To assessing the collusion, Cournot market model is a benchmark [19][20]. Meanwhile, duopoly is the simplest case in oligopoly market. This model has been extensively studied on the economic behavior of industrial organization [21]. As the first step to study the algorithm-human collusion, we focus on the Cournot duopoly model. In this model, no algorithm-human collusion has been found till now in experiment. And, in this paper, we hope to provide an experimental evidence of the tacit collusion. We hope to see the evolutionary processes of the tacit collusion behaviors, the rising of the price, and the declines of the social warfare. With these experiment observations, we hope to illustrate how an algorithmic collusion could be a creditable threat — This is the aim of this investigation.
1.3 Key literature background
To this aim, our research question can be specified as — how to design an explicit algorithm, which can practically enforce a human rival to collude in laboratory experiment. Our research is inspired by two literature, one is experimental [22] and another is theoretical [23], both of which base on the zero-determinant (ZD) strategy theory in iterated prisoner’s dilemma (IPD) [24]. The ZD strategies are a new class of memory-one, probabilistic and conditional response strategies that are able to unilaterally set the expected payoff of its opponent in the IPD irrespective of the opponent’s strategy (coercive strategies). ZD strategist simplify its opponent decision making — from strategy interaction problem to a optimal problem. According to ZD theory, in an algorithm-human interaction IPD game, if the algorithm applying ZD strategy, its rational human rival has to cooperate fully. The ZD theory is not only a theoretical imagine, it has been supported in long-run laboratory IPD experiments, in which the human rivals were enforce to cooperate [22]. In basic microeconomics theory, a Cournot duopoly market game is equivalent to a IPD game by extending the IPD strategy space to continuous action space. In continuous action space game, the theoretical results [23] has shown the existence of extortion strategy. So, we can expect to demonstrate an algorithm, which can extort its human rival to collude in an algorithmic-human experiment.
1.4 Our method and result
We investigate the algorithmic collusion threat by two steps — First, we proposed an algorithm, which can enforce its human rival to collude; Second, we verified the efficiency of the algorithm in laboratory algorithm-human experiments. In the empirical data, we see the dynamic (evolutionary) process of the collusion and the constantly decline of the social welfare. With the data, we confirm that, the algorithmic collusion is creditable threat. Our contributions are mainly three folds. (1) We approach an extortion algorithm in duopoly competition, and illustrate how to design such algorithm explicitly. (2) We analyzed the efficiency of the extortion algorithm in experiments, and showed the algorithm can cause great welfare loss in duopoly competition. (3) More import, our experiment methods can be applied by antitrust regulators to investigate such algorithmic collusion. A legal (or ethical) dilemma caused by the algorithmic collusion is discussed at the last.
2 Model and Experiment Design
2.1 Cournot duopoly model and collusion
Cournot duopoly model is a basic economic model for business competitions [21]. In this model there are only two agents (firms) to make a same product, and the competition is on quantity. The competition is to make decisions how many production they offer at the same time. If both firms collude with the other, they can reduce product supply to a quantity (denoted as ) to make their profit biggest. The Nash equilibrium quantity (denoted as ) in this model is a situation in which firms interact with each other and choose their best strategy given the strategies that the other have chosen. If the agents maximum the quantity, the price will be lowest and social welfare will be maximized, and Walrasian Equilibrium point (denoted as ) will reach.
In Cournot duopoly market, in dynamics view, the competition is lasting along time. The strategy and the outcome is keeping changing along time. In each iteration, each player chooses a quantity in a finite interval . Price is a decreasing function of the aggregate quantity , and player ’s profit, , in that iteration is
| (1) |
including the constant marginal cost , as well as an exogenous additive constant that captures benefits from other activities net of fixed cost [25]. Collusion, as a concept in economics and in legal, can be defined with this model [21][25].
In this study case, no loss generality, as an example and the comparability, we apply the exactly same parameters setting as the previous human-human Cournot duopoly experiments [25]. The parameters are specified as
| (2) |
in which () is the low (up) bound of the available quantity (strategy) of the competitors. In a duopoly market with these specified parameter, in one round of competition, if both players choose a quantity of 3 ( = 3), their profits are 40, respectively, which implies the price in market is 20 ( = 20). At this condition, neither of the players can benefit by unilaterally deviating this quantity. This state is the Nash equilibrium. However, if both players choose a quantity of 0.1 ( = 0.1), they will reach joint profit maximum (JPM) state and get 69 profit respectively. In JPM state, the price in market is 600 ( = 600), much higher than Nash equilibrium price ( = 20), which would harm consumer benefit and social welfare. So, in economists and market regulators view [1], the JPM state is the state of collusion.
2.2 Linear extortion to collusion algorithm
To study the algorithmic collusion, we need to design algorithm first. Considering the equivalent of Cournot duopoly model and iterated prisoner’s dilemma (IPD) game, our algorithm design is inspired by IPD. A class of IPD strategy is described by the outcomes of the previous round, namely memory one strategy. Memory one strategy states that, in a long rounds time (e.g., day, hour, minute) series , the strategy at round depends only on the latest previous round (). In a (X, Y) two player game, at , the player Y can use the information set at time to decide its own strategy at as
| (3) |
We suggest an algorithm, namely Linear Extortion to Collusion Algorithm (LECA). We set the algorithm Y’s normalized payoff linearly depending on its human rival X’s normalized payoff as
| (4) |
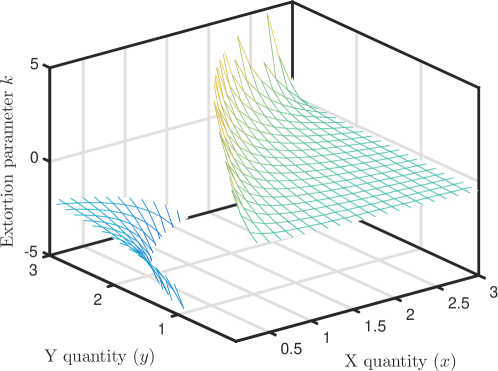
in which is a constant, is the quantity of the algorithm Y at , is the quantity of the human rival X at , and is the profile at Nash equilibrium. When , the expected profile of the algorithm Y is to earn more profile than its rival X, and Y can be called as extorter. is called as the extortion parameter, which can be unilaterally determined by the algorithm agent Y. For a given , in general, for any given (the quantity of the human rival X at ), mathematically, there could exist a solution for (the quantity of the algorithm Y), as shown in Figure 1.
So, if there is a stationary strategy solution () for , then is determined. X can unilaterally optimize its own payoff by solving following equation,
| (5) |
In general format of the supply-demand function shown in Equation (1), Y’s quantity strategy () can be numerical solved referring to Equation (4). As a result, the stationary solution of X’s quantity strategy, , can be obtained. The procedure for the algorithm for stationary solution is illustrated in Supplementary Information J. Till now, we have the stationary strategy solution.
However, we need to think of the game as being played over a number of time periods (denoted as -rounds), making it dynamic. Suppose X taking a step period loop sequence, e.g.,
the related strategy sequence of Y should be
As the strategy sequence of Y is determined on the X sequence, so the outcome is defined. For the human rival, the average payoff of the -step period loop (denoted as ) can be expressed as
| (6) |
in which is the Y’s strategy (at ) in response to X’s strategy (at ).
We need to constrain the value to make sure smaller than the payoff when X stop at , the stationary solution of X’s quantity strategy. So, mathematical question turns to evaluate whether the maximum of in space is larger than the stationary solution . This requires that, for any , the solution for the equation,
| (7) |
is an empty set. That is to require, in the space , there is no vector to fulfill the Equation (7), except . Once this requirement is fulfilled, with general hypothesis of rationality, the collusion is inevitable. In another words, this is the sufficient condition for algorithmic collusion. In current condition, we do not know the general solution for arbitrary . In this study, we consider only the first two order, that is condition. The procedure is illustrated in Supplementary Information K.
2.3 An application example
In this study case, by solving Equation (4) with the specification of Equation (2), Y’s strategy at () response to the X’s strategy at is determined, as
| (8) |
in which . The optimal strategy (production quantity) of X, by Equation (8) and Equation (1) with the specification of Equation (2), can be expressed as
| (9) |
in which . It is visible that, when , the optimized unique solution of the human rival X is ; meanwhile, the price is , and production quantity of Y is . The explicit formula and figures are shown in Supplementary Information A. In condition, the solution go back to quantity pair , i.e. the JMP state, in which profile pair , the traditional collusion.
This algorithm can go further. For example, setting , the solution of production pair will be , in which profile pair , an extortion collusion. In our experiment, we set and the theoretical extortion collusion pairs are and . So, referring to Nash equilibrium, the surplus value pair, for human and algorithm respectively, is (25.203, 32.666). This is unfair but the most profitable for the human rival. So the collusion will still be established by the algorithm — This is the theoretical prediction, which will be test in our experiment.
As mentioned above, to consider the dynamics processes is necessary. Referring to Equation (6), in the first order dynamics =2 consideration,
in which and . So, for any given , if there exists to satisfy Equation (7), such is not valid. Analysis result shows that, the valid extorter parameter value is
| (11) |
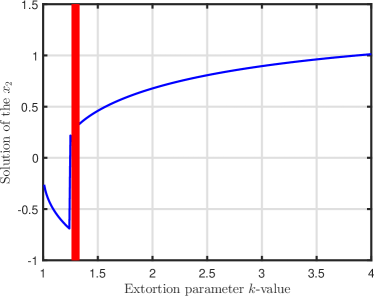
The human rival could benefit from deviation, if . As a numerical example, assume , a strategy which can be used to resist our algorithm, the human rival may take the jumping strategy {0.1, 0.9, 0.1, 0.9…} (with profile 59.9146) instead of the strategy {0.1, 0.1, 0.1, 0.1…} (with profile 54.3383). So, is not fit. The deviation strategy for = 2 condition can be calculated analytically (explicate results are shown in Supplementary Information B), and figural results are shown in Figure 2.
2.4 Experiment System
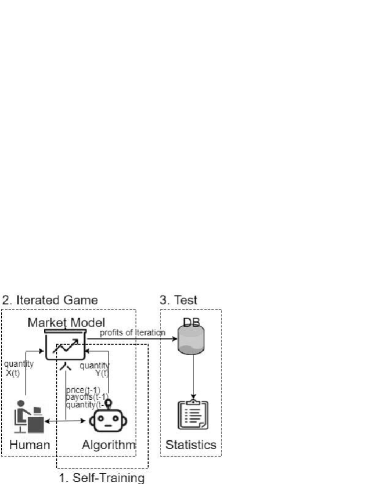
For evaluating the performance of LECA, we designed an experiment system. The whole system consists three phases shown in Figure 3. Phase-1 Self-Training: The Self-Training is to calculate some parameters in LECA (already calculated in First order dynamics solution section). Phase-2 Iterated Game: The Iterated Game is providing a procedure which every human subjects faced with the LECA implemented by a computer for many iterations in the fixed experiments settings. In each iteration, LECA and human subjects can select a quantity of products they want to produce, then the Market Model calculates the human subject’s and LECA’s profits and feedback to human subject and LECA. At the same time, the server save the information into database. After checking their strategy and profit, LECA and its human subject will decide their strategy (quantity) of the next iteration. Phase-3 Test: Test is analyzing the behavior of human subjects to evaluate the efficiency of algorithm (see Result section).
To make experiment simple, LECA algorithm is stored in referee (server), the quantity LECA produce is calculated by referee. In our experiment, the interval of quantity is [0.1, 3] for the algorithm and [0.1, 6] for its human rival, and the extortion parameter is . More details of the technology detail, as well as the difference of the experimental protocols comparing with [25], are shown in Supplementary Information C.
In an iterated game, a human subject will face the user interface (UI) shown in Figure 4. There are two panels. The left panel shows the information about the last ten iterations of the game, including 6 items: the number of the round (iteration) in the experiment, human subject’s quantity, LECA’s quantity, human subject’s profit, LECA’s profit and human subject’s total profit, respectively. The right panel is the decision making panel. In each round, human subject can make decision by submitting the quantity. When submission done, the server reply information of the 6 items, and a new round starts again.

2.5 Experiment Procedure
The data we used here come from our laboratory experiments which were conducted at Experimental Social Science Laboratory of Zhejiang University, on 25 December 2017 and 16 to 18 January 2018. A total of 40 undergraduate and graduate students from various disciplines were recruited to participate in the experiment with each of them only participating once. In total, we collected 24000 observations of individual decision making, consisting of choices of human subjects and LECA algorithm implemented by computer programs. Each experiment lasted for 1 hour. During the experiment, the player earned scores according to Experiment Environment section and their choices. After the experiment, the sum of scores were converted to cash according to an exchange rate and paid to the subjects, the converted function is:
(unit in Yuan RMB)
Here, Yuan RMB is average profit that human subjects earn, 30 Yuan RMB is baseline, 1.2 is a rate, and 5 Yuan RMB is show-up fee. —- In the 600 rounds If the two players fall into Nash equilibrium, both of our algorithm and the human rival gain 24000 points; If the human stays in the smallest value (low bound) of the state space () , the human will earn 39660 points total. The average earning is about 40 Yuan RMB.
Before the formal experiment, every human subjects will be allocated a computer. They were then assigned an instruction manual and a pen, and they played the game in an small isolated room with a computer. No oral instructions were given, except that the organizer told the subjects (1) not to refresh the web page to avoid potential technologic problem (the experiment user interface is a web page), and (2) the type error in the one page printed Experiment Instruction (The Experiment Introduction for the student subjects is attached in Supplementary Information D). They made decisions by dragging the slider on the screen and clicking submitting button. The software for the experiment was designed by the authors. No communication was allowed. The human subjects were told that they would play a game with a fixed computer program for 600 rounds. The algorithm code is attached in Supplementary Information E.
3 Result
Algorithm-human collusion is observed in our experiment. We see the supplement constantly decreases, while the human rivals accept the extortion. We see the degree of collusion constantly increases, while the social warfare constantly decreases. Comparing with existing human-human experiment, the algorithm-human collusion can be more harmful to society. All these observations indicate that, not theoretical conjectures or scientific fictions, the algorithmic collusion is a creditable threat.
3.1 Human rivals collude with the algorithm
Collusion, in a Cournot duopoly market, can be identified by the constantly declining of the total supplement (quantity). Figure 5, reporting the median of the quantity of the 40 human rivals of our algorithm, shows clearly that in first 300 iterations of Cournot game, the human subjects reduce quantity to reach almost fully collusive level (0.1), then keep their quantity at the collusive level. This result indicates that after about 300 iterations of learning, the human subjects realized they will get biggest profits when they select a quantity of 0.1 (collusive level). For more details on the evolution of the individual behaviors, see Supplementary Information M.
To make things more clear, Table 1 shows the average, standard deviation and median number of quantity and profit 40 human subjects’ performance in iteration 1 - 600, iteration 1 - 300 and iteration 301 - 600. Table 1 shows that, at the beginning (iteration 1 to iteration 300), the average and median of human subjects’ quantity is much more larger than the later iterations (iteration 301 to 600). That means, with the increase of round, human subjects reduce quantity of product to cooperate with LECA. In the mean time, the profits human subjects earn raise apparently.

| iteration | quantity | profit | ||||
|---|---|---|---|---|---|---|
| average | stdev | median | average | stdev | median | |
| 1-600 | 1.182 | 1.216 | 0.664 | 57.168 | 9.453 | 61.768 |
| 1-300 | 1.442 | 1.265 | 1.044 | 55.034 | 9.575 | 58.771 |
| 301-600 | 0.923 | 1.251 | 0.265 | 59.302 | 9.923 | 64.478 |
-
There were 40 samples (student subjects) participated the experiment. Each subject has competed with the algorithm for 600 iterations. The procedure to reach the results shown in this table as following: At first, calculate each sample’s average quantity and average profit of 600 iterations, first 300 iterations and last 300 iterations. Then, calculate the average, standard deviation (stdev) and median of those samples. Take median quantity for example, is the median number of 40 samples’ average quantity in iteration to iteration . is the median number of 40 samples’ average quantity in iteration to iteration . is the median number of 40 samples’ average quantity in iteration to iteration .
3.2 Algorithm extorts its human rival and earn higher profile
Now we show LECA should get more profit than its human rival in the algorithm-human collusion. Table 2 show the statistical comparison results about the profits of LECA, human subjects and Nash Equilibrium. The statistical analysis methods are interpreted in Supplementary Information L.
| Hypothesis | Algorithm | Human | Algorithm | Nash | Human | Nash |
|---|---|---|---|---|---|---|
| Iteration | rs | tt | rs | tt | rs | tt |
| 1-600 | 0.0177 | 9.77 | 6.97 | 1.34 | 4.76 | 4.39 |
| 1-300 | 0.142 | 7.24 | 6.97 | 1.25 | 6.97 | 3.11 |
| 301-600 | 1.71 | 5.77 | 4.45 | 1.18 | 5.04 | 5.31 |
-
* Algorithm here is our Linear Extortion to Collusion Algorithm (LECA). Human here is the human rivals of LECA in our experiment. Nash indicates the theoretical profile (40) when both duopoly employ Nash equilibrium at per iteration. represents rank-sum: returns the -value of a two-sided Wilcoxon rank sum test. represents -: returns the -value of testing the null hypothesis that the pairwise difference between data vectors has a equal mean. Procedure to report the values here is: At first, calculate the profile of Algorithm and Human of all 40 samples, respectively. Then, calculate statistical results of the profile comparison with the null hypothesis that (1) Algorithm Human, (2) Algorithm Nash and (3) Human Nash, respectively.
Theoretically, we can easily find that LECA’s profit is more than its rival when rival’s quantity stay unchanged. In this experiment, the result is significant even though human subject’s quantity changes. From Table 2, we can come to a conclusion that the profit they get is
because -value of the ranksum and t-test is very small and closes near to 0. Interestingly, in the table, iteration 1 to 300, the -value of ranksum and t-test is much more bigger than iteration 1 to 600 and iteration 300 to 600. In iteration 1 to 300, there still exist human subjects who want to compete with LECA to gain more profits. However, after finding that is impossible, more and more human subjects begin to cooperate with LECA even though they are extorted by LECA. This result confirms that Human subjects cooperate with LECA.
3.3 Degree of collusion
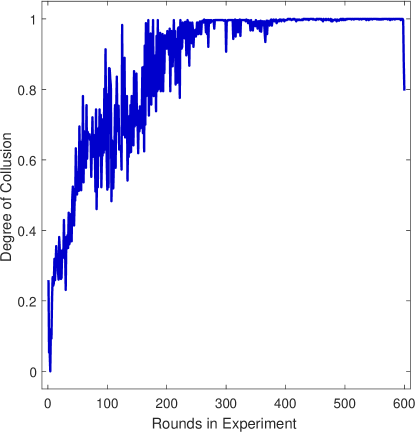
Degree of collusion is a standard measurement for the anti-competition behavior. This measurement can be expressed as a percentage of the distance between the Nash and the Pareto (collusion) outcomes [26]. In our Algorithm-Human duopoly market, the evolution of the degree of collusion is shown in Figure (6). It is clear that, in our Algorithm-Human duopoly market, the degree of collusion rises to nearly 100% in 300-400 rounds.
3.4 Deadweight loss
Deadweight loss is a loss of economic efficiency that can occur when equilibrium for a good or a service is not achieved. In our study case, the deadweight loss (or social welfare lose), at time , can be formulated as , in which (the sum of the quantities of the algorithm and of its human rival ), (sum of the up bound of the quantities of the algorithm (3) and of it human rival (6)), (the constant marginal cost in Equation (2)) and (the price function, see Equation (2)). In our study case, the theoretical expectation of the deadweight loss is = 363.0447 (367.5665278 For more details, see Supplementary Information F). The red line in Figure (7) illustrates the deadweight loss along time.
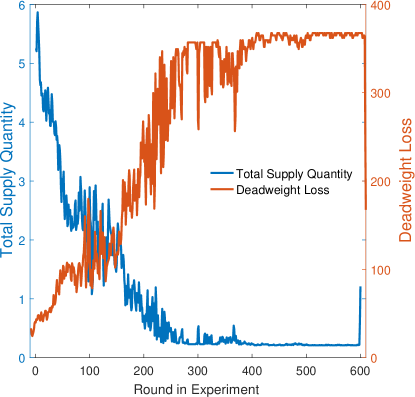
From Figure 7, the quantity of both oligarchies drop down quickly, so, in the Cournot duopoly market, the supplement drop quickly, which leads the increasing of deadweight loss, and is a threat to social welfare.
3.5 Algorithm-human vs. human-human collusion
As we apply the exactly same parameters as the previous human-human Cournot duopoly experiments [25], it is meaningful to compare our results with theirs. The median quantities, prices, and profits of human subject in human-human competition is shown in the right panel of Table 3 (data comes from the Table 2, duopoly condition, Page 193 in [25]). As the results from our experiment, the median quantities, prices, and profits of the algorithm, as well as its human rival, are shown in the left panel of Table 3.
| Algorithm | Human | Human | |||||||
| iteration | Quantity | Profit | Quantity | Profit | Price | iteration | Quantity | Profit | Price |
| 1-50 | 2.14 | 49.79 | 2.01 | 47.28 | 28.57 | 1-50 | 4.54 | 23.74 | 13.98 |
| 1-200 | 1.22 | 62.51 | 1.10 | 57.54 | 53.21 | 1-400 | 3.17 | 35.45 | 18.43 |
| 201-400 | 0.14 | 67.56 | 0.12 | 61.16 | 436.36 | 401-800 | 0.57 | 63.11 | 90.01 |
| 401-600 | ∗0.11 | ∗70.30 | ∗0.10 | ∗64.81 | 558.14 | 801-1200 | ∗0.28 | ∗68.53 | 107.36 |
| 551-600 | 0.11 | 70.30 | 0.10 | 64.81 | 558.14 | 1151-1200 | 0.40 | 68.51 | 91.30 |
| Theoretical | Algorithm | Human | |||||||
| Expectation∗ | 0.1093 | 72.662 | 0.10 | 65.203 | 573.34 | 0.1 | 69 | 600 |
-
∗ In our experiment, the quantities are displayed in two decimal places in the user interface (see Figure 4). And then the profiles are calculated referring the displayed quantities. So, in the experiment data, the expectations for the algorithm the quantity equals to 0.11 and the profile equals to 71.75; Meanwhile the expectations for the human rival, the quantity equals to 0.1 and the profile equals to 66.14. The experiment data is provided in the publisher web site, and its interpretation is provided in Supplementary Information G.
In Table 3, a significant point is that, in the later phase in our experiment (400-600 rounds), the collusion form. At this condition, the algorithm gain higher profile (70.30) than both of the theoretical collusion profile (69.00) and the experimental human-human collusion profile (68.53). Meanwhile, its human rival gain less (64.80). In our algorithm-human experiment, the time to establish collusion (about 400 rounds) is less than human-human collusion (about 800 rounds) experiment. By the comparison, two potential results could be:
-
1.
Algorithm can facilitate the collusion more quickly.
-
2.
There exists incentive for a firm to implicate such algorithm in market.
More details results of the comparisons, especially the individual behaviors of human subject in the experiments, will be shown in Supplementary Information H.
4 Discussion
The question — the risk that algorithms may work as a facilitating factor for collusion — is deeply concerned [1]. In this paper, we have proposed an algorithm which automatically extort its rational rival to collude, meanwhile gets higher profile in the collusion. In laboratory experiments of the algorithm-human Cournot duopoly competitions, the algorithmic collusion is demonstrated. We see the supplement constantly decreases, the degree of collusion constantly increases, while the social warfare constantly decreases. All these observations indicate that, not theoretical conjectures or scientific fictions, the algorithmic collusion is a creditable threat. To the best of our knowledge, this is the first empirical observation to confirm that algorithms can work as a facilitating factor for collusion.
4.1 On algorithm for algorithm-human collusion
How to design an algorithm, which can facilitate collusion by extortion, is demonstrated explicitly. The proposed algorithm (shown in Equation 4) is design to enforce its human rival to unilaterally optimizing the payoff, so the algorithmic collusion is a result of rationality and is inevitable. In this view, the algorithm design likes the mechanism design, by which the collusion is determined by the algorithm. The algorithms, which can enforce its rational rival to collude, could be abundant, from imitation [25] to generously persuade (e.g., [24][22]). We have only used memory one strategy, as shown in Equation 3. Deeper memory strategy is naturally an opinion for further algorithm design. Considering the equivalent of Cournot duopoly model and IPD game, the algorithms in IPD game competing [27][24][23] can be adapted to study the algorithmic collusion further.
The limitation of our algorithm is obvious. In our study case, the extortion parameter is limited (see Equation 11) because the human rival could exists dynamic process to deviate the collision stationary equilibrium to gain more benefit. The theorem of the autocratic strategies [23] provides only static solution rather than dynamic, but there could exist switching strategy (dynamic behavior) to against the algorithm. In fact we have noticed that, when in higher order dynamic process, e,g, in Equation 7 when = 3, there exists dynamic solution for human rival to deviate the collusion, even at =1 condition. For more details, see Supplementary Information I. Equation 7 provides only the necessary condition, and the sufficient condition is not known.
The competition between oligopoly and governor seems inevitable too — The oligopoly owner will face how to develop a harder to detect, more effective, more stable and persistent [6] algorithm for business success. Meanwhile the regulation (governor) will face how to detect such antitrust algorithm to protect human wellbeing.
4.2 On experiment of algorithm-human collusion
The experimental evidence of algorithm facilitating collusion between human-algorithm is firstly reported. Collusion in oligopoly game is standard part in the application of game theory, especially in industry organization theory [21]. Cournot duopoly market, as the dual of Bertrand duopoly market, is the most basic model for study collusion. Most related experiments are summarized in the survey [30] and the recent long-run experiment [25]. The collusion was not observed in short-run experiments (e.g., [17]), but can be observed in long-run [25]. On this point, we set our experiment times to be long run 600 rounds repeated. Most previous experiment aimed at human-human interaction, ours is to study algorithm-human collusion. To our knowledge, the collusion between algorithm-human in Cournot duopoly market is firstly reported here. [30] [25].
Although we can see the collusion (evolutionary) processes in our experiment, but the mechanism of the human behaviors is not clear. Further questions include (1) whether the time spent would be shorter or longer in other experimental protocol. (2) whether or how the collusion can be established when a market includes more participates [29][28], or (3) when the algorithm and human competitors are mixed, or (4) when the information environment differs, or (5) when the frequency of strategy changing is limited. It is not surprises that, all old issues need to revisit when algorithms involve [1].
4.3 On dilemma of algorithm-human collusion
The legitimacy of our algorithmic collusion becomes a challenge to current legal system. There are two approaches, economics and legal, to consider whether a supra-competitive price strategies is right or wrong. Economists usually distinguish between two forms of collusion, explicit and tacit, by the interaction behaviors. Explicit collusion is forbidden. But tacit may be allowed, because, the supra-competitive price strategies may be the normal outcome of rational economic behaviour of each firm on the market [1]. In our experiments, different from Topkins-like algorithm cases, there is not any communication or agreement between the competitors. So the collusion is not explicit, and is not definitive wrong.
Contrary to the economic approach, which considers collusion a market outcome, the legal approach focuses on the means used by competitors to achieve such a collusive outcome [1]. The mean of the algorithm approached, shown explicitly in Equation (4) in this paper, appears normal. Its mean can be explained as the willing to gain -times (in our experiments, =1.296) more profile than its competitor (the human rival). Meanwhile, as a rational economic behaviour, the human is obliged to collude with the algorithm for the maximizing its own profile. So, not only its human rival, referring to current legal consideration, the algorithm is right. As both are right, as their aggregate behavior, our algorithmic collusion is right?
So, the dilemma is that, the algorithm can enforce the supra-competitive price strategies and the social human wellbeing is harmed, but current legal seems to say such algorithm is right. Recent has seen the establishment in the regulations on algorithms, requirements includes transparency and accountability [31], as well as ethics IEEE P7000x [32]. We wish our work can promote the developments on related fields.
4.4 Implications of our study
Our study has a number of implications:
-
•
(1) To settle down the argument on whether the threat of algorithmic is creditable. Most notably, we have provided the first evidence in which algorithmic collusion automatically arises — by extorting its human rival, an algorithm can efficiently facilitate the tacit collusion.
-
•
(2) To provide an incubator for antitrust legal research. Pioneered by Charles Plott and his colleagues, in past decades, laboratory experiment has become an incubator and a test-bed for political economics science, e.g., industrial organization [13]. As pointed out by Ezrachi and Stucke [33], the agency would then test what factors (e.g., information, or number of participation, or frequency of strategy changing, or noise) added to (or removed from) the incubator would make tacit collusion likelier and more durable. Our work has provided an explicitly example for algorithm-driven tacit collusion. We hope basing on the algorithm design (e.g., Equation 4) and the experiment framework (Figure 4), algorithmic collusion can be investigated more practically.
-
•
(3) For algorithmic engineers in business area, our study has provided an example to design collusion strategy for business robot. However, we hope the engineers, by Figure 7, can understand the potential harmfulness of algorithmic collusion on social welfare, as well as the human wellbeing. And then, engineers would consciously obey the AI industry ethical standards, e.g., IEEE P7000 series [32].
References
- [1] Capobianco, A., Gonzaga, P. & Nyeso, A. Algorithms and collusion - background note by the secretariat. Meeting of the Competition Committee on 21-23 June 2017. Organisation for Economic Co-operation and Development. (2017).
- [2] Varian, H. Artificial intelligence, economics, and industrial organization. Economics of Artificial Intelligence University of Chicago Press (2018).
- [3] Engel, C. Tacit collusion: The neglected experimental evidence. Journal of Empirical Legal Studies 12, 537–577 (2015).
- [4] Capobianco, A. & Nyeso, A. Challenges for competition law enforcement and policy in the digital economy. Journal of European Competition Law & Practice 9, 19–27 (2018).
- [5] Ezrachi, A. & Stucke, M. Artificial intelligence & collusion: When computers inhibit competition. Social Science Electronic Publishing (2015).
- [6] Ballard, D. & Naik, A. Algorithms, artificial intelligence, and joint conduct. Antitrust Chronicle 2, 29 (2017).
- [7] Gal, M. S. Algorithmic-facilitated coordination: market and legal solutions. Antitrust Chronicle 2, 27 (2017).
- [8] Ezrachi, A. & Stucke, M. E. Virtual Competition: The Promise and Perils of the Algorithm-Driven Economy (Harvard University Press, 2016).
- [9] Deng, A. When machines learn to collude: Lessons from a recent research study on artificial intelligence. Social Science Electronic Publishing (2017).
- [10] Petit, N. Antitrust and artificial intelligence: A research agenda. Journal of European Competition Law & Practice 8, 361 (2017).
- [11] Mehra, S. K. Robo-seller prosecutions and antitrust’s error-cost framework. Antitrust Chronicle 2, 37 (2017).
- [12] Ittoo, A. & Petit, N. Algorithmic pricing agents and tacit collusion: A technological perspective. Social Science Electronic Publishing (2017).
- [13] Plott, C. R. Industrial organization theory and experimental economics. Journal of Economic Literature 20, 1485–1527 (1982).
- [14] Li, J. & Plott, C. R. Tacit collusion in auctions and conditions for its facilitation and prevention: Equilibrium selection in laboratory experimental markets. Economic Inquiry 47, 425–448 (2009).
- [15] Plott, C. R. Public choice and the development of modern laboratory experimental methods in economics and political science. Constitutional Political Economy 25, 331–353 (2014).
- [16] Friedman, J. W. Individual behavior in oligopolistic markets: An experimental study. Yale Economic Essays 3, 358–417 (1963).
- [17] Cox, J. C. & Walker, M. Learning to play cournot duopoly strategies. Journal of Economic Behavior & Organization 36, 141–161 (1998).
- [18] Deck, C. A. & Wilson, B. J. Interactions of automated pricing algorithms: an experimental investigation. In ACM Conference on Electronic Commerce, 77–85 (2000).
- [19] Vives, X. Cournot and the oligopoly problem. European Economic Review 33, 503–514 (1989).
- [20] Mehra, S. K. Antitrust and the robo-seller: Competition in the time of algorithms. Minnesota Law Review 100, 1323–1689 (2016).
- [21] Tirole, J. The theory of industrial organization. Mit Press Books 1, 226–227 (1988).
- [22] Wang, Z., Zhou, Y., Lien, J. W., Zheng, J. & Xu, B. Extortion can outperform generosity in the iterated prisoner’s dilemma. Nature Communications 7, 11125 (2016).
- [23] Mcavoy, A. & Hauert, C. Autocratic strategies for iterated games with arbitrary action spaces. Proceedings of the National Academy of Sciences of the United States of America 113, 3573 (2016).
- [24] Press, W. H. & Dyson, F. J. Iterated prisoners dilemma contains strategies that dominate any evolutionary opponent. Proceedings of the National Academy of Sciences of the United States of America PNAS 109, 10409–10413 (2012).
- [25] Friedman, D., Huck, S., Oprea, R. & Weidenholzer, S. From imitation to collusion: Long-run learning in a low-information environment. Journal of Economic Theory 155, 185–205 (2015).
- [26] Engel, C. How much collusion? a meta-analysis of oligopoly experiments. Journal of Competition Law & Economics 3, 491–549 (2007).
- [27] Axelrod, R. Evolution of cooperation. Scientific American 23, 347–360 (1984).
- [28] Selten, R. A simple model of imperfect competition, where 4 are few and 6 are many. 141–201 (1973).
- [29] Ivaldi, M., Jullien, B., Rey, P., Seabright, P. & Tirole, J. The economics of tacit collusion. IDEI Working Papers 152, 217–239 (2003).
- [30] Potters, J. & Suetens, S. Oligopoly experiments in the current millennium. Journal of Economic Surveys 27, 439–460 (2013).
- [31] USACM. Statement on algorithmic transparency and accountability. In Association for Computing Machinery, US Public Policy Council, Washington, DC, 178–185 (2017).
- [32] Chatila, R., Firth-Butterflied, K., Havens, J. C. & Karachalios, K. The ieee global initiative for ethical considerations in artificial intelligence and autonomous systems [standards]. IEEE Robotics & Automation Magazine 24, 110–110 (2017).
- [33] Ezrachi, A. & Stucke, M. E. Two artificial neural networks meet in an online hub and change the future (of competition, market dynamics and society). Oxford Legal Studies Research Papers (2017).