Cyclic variations with twice the accretion disk precession period in the old nova V603 Aquilae
Albert Bruch
Laboratório Nacional de Astrofísica, Rua Estados Unidos, 154,
CEP 37504-364, Itajubá - MG, Brazil
Lewis M. Cook
American Association of Variable Star Observers, 1739 Helix Ct.
Concord, CA 94518, USA
(Published in: New Astronomy, Vol. 63, p. 1 – 5 (2018))
Abstract
A dense series of long and high time resolution light curves of the old nova V603 Aql, covering 22 nights (19 of which are consecutive), are analyzed in order to identify and characterize variations on the time scale of hours and days. The well known 3.5 hour modulation, observed many times in the past and considered to be due to a long lasting, albeit not entirely stable superhump, is recovered at a period of days and an amplitude of . Most interesting, however, is the detection of highly significant brightness variations with an amplitude of and a period of 5.85 days which is to a very high precision equal to twice the beat period between the orbital and the superhump period. The latter is generally interpreted as the precession period of an eccentric accretion disk. The origin of these long term variations remains unknown.
Keywords: Stars: novae, cataclysmic variables – Stars: individual: V603 Aql
1 Introduction
Among all known classical novae V603 Aql has the highest apparent magnitude in quiescence. As such, it is very well studied and the amount of literature on the object is vast. V603 Aql erupted in 1918 and reached quiescence in 1937 (Strope et al. 2010). From then on it exhibited a slight secular fading to a mean quiescent magnitude of 118 in recent years (Johnson et al. 2014).
The orbital period was first determined spectroscopically by Kraft (1964), later refined by Drechsel et al. (1982) and more recently by Arenas et al. (2000). Peters & Thorstensen (2006) were able to combine their own radial velocity measurements with results from previous studies to derive long term ephemeries, establishing the orbital period to be 0.13820103 days (3 19 057). Arenas et al. (2000) measured component masses of and and an orbital inclination of .
V603 Aql exhibits a puzzling multitude of photometric periods none of which is identical to the orbital period. Haefner & Metz (1985) observed polarimetric variations with a period of 2 48 and suggested an intermediate polar model. However, Cropper (1986) did not detect polarization in V603 Aql. Drechsel et al. (1983) found variations of the x-ray flux which they considered to be compatible with the orbital period. But this interpretation is not unique. Haefner & Metz (1985) showed that these variations are also compatible with their polarimetric period. It is even compatible with a 61 photometric period observed by Udalski & Schwarzenberg-Czerny (1989). Schwarzenberg-Czerny et al. (1992) also found pulsations in the UV continuum radiation with a period very close to the latter. Bruch (1991) could not confirm the 61 period but found instead indications for a period close to 15. All these periods remain unconfirmed, and the credentials for V603 Aql as an intermediate polar remain doubtful111see Koji Mukai’s Intermediate Polars Home page (https://asd.gsfc.nasa.gov/Koji.Mukai/iphoe/iphome.html).
The only consistent modulation present in the light curve of V603 Aql has a slightly variable period close to 35, about 6% longer than the orbital period. It has first been detected by Haefner (1981) and was then confirmed by many authors (Udalski & Schwarzenberg-Czerny 1989, Bruch 1991, Patterson & Richman 1991, Patterson et al. 1993, Hollander et al. 1993). Additionally, Patterson et al. (1997) observed a modulation with a period being about 3% less than orbital period. Today, the longer of these variations is interpreted as a positive (because its period is longer than ) superhump in V603 Aql, while the shorter one is considered to be an occasionally visible negative (period shorter than ) superhump.
Superhumps222Unless explicitely stated otherwise, the term “superhump” is used subsequently to indicate a positive superhump. are routinely observed in superoutbursts of SU UMa type dwarf novae. They are explained by tidal stresses in an accretion disk which has become elliptical as a result of a 3:1 resonance between the rotation period of matter in the outer accretion disk and the orbital period of the secondary star in a cataclysmic variable (CV). The superhump period is slightly longer than the orbital period because of apsidal precession of the elliptic disk. The superhump, orbital and precession periods are related to each other by . Instead, negative superhumps are explained as variations of the brightness of a warped accretion disk with a retrograde precession of the nodal line.
Although most common in short period dwarf novae in superoutburst, superhumps are also seen in an increasing number of longer period CVs, independent of outbursts; mostly in old novae or novalike variables where they can persist over long periods of time. V603 Aql is one of them. Others include TT Ari (Belova et al. 2013 and references therein; Smak 2013), KR Aur (Kozhevnikov 2007), AT Cnc (Nogami et al. 1999, Kozhevnikov 2004), TV Col (Retter et al. 2003), V751 Cyg (Patterson et al. 2001, Papadaki et al. 2009), V795 Her (Patterson & Skillman 1994, Papadaki et al. 2006), and V378 Peg (Kozhevnikov 2012). This list is not meant to be exhaustive!
Here, we take advantage of a particular long and densely sampled series of light curves of V603 Aql in order to study the superhump modulations as well as variations on the time scale of days with the purpose to identify possible brightness changes on the disk precession period such as has been claimed to be present in some CVs (see Table 4 of Yang et al. 2017). In Sect. 2, we present these observation. Variations on the superhump and on longer time scales are analysed in Sect. 3 and then discussed in Sect. 4. A short summary of the results concludes this paper in Sect. 5.
2 Observations
The present study is based on light curves observed by one of us (LC) during 22 nights between 2003, June 21, and July 18. A gap of seven nights separates 19 light curves taken in subsequent nights from a shorter set of 3 light curves, also taken in subsequent nights. All observations were obtained using the 73cm prime focus reflector at Concord observatory which is part of the Center of Backyard Astrophysics network333cbastro.org. Integrations lasted 15, using a commercial CCD camera (Genesis 16). Including overheads this resulted in a time resolution of 35. With very few exceptions the individual light curves extend over 5 – 6 hours or more. To our knowledge this is the densest and most homogeneous set of light curves of V603 Aql ever studied.
No filters were employed during the observations. Bruch (2018) found that his unfiltered CCD photometry was approximately equivalent to observations in the band. He used detectors which are more sensitive in the blue than the one used here (KAF 1602E). Thus, the effective wavelength of the present light curves is probably somewhere between and . Noting that there is only a small magnitudes difference between and in V603 Aql (we measured an average in unpublished multicolour light curves) no significant uncertainties is introduced assuming that the data refer to the band.
All exposures were processed (dark subtracted, flat fielded) using commercial software. Magnitudes were calculated by referring to the band magnitude of the comparison star UCAC4 453-082428. Time was transformed into barycentric Julian Date on the Barycentric Dynamical Time (TDB) scale using the online tool provided by Eastman et al. (2010). For subsequent data analysis the MIRA software system Bruch (1993) was employed. A journal of observation is given in Table 1.
Table 1: Journal of observations
| Date | Start | Duration | No. of |
|---|---|---|---|
| (2003) | (UT) | (min) | integrations |
| Jun 21 | 7:39 | 151 | 248 |
| Jun 22 | 5:13 | 357 | 585 |
| Jun 23 | 5:49 | 319 | 532 |
| Jun 24 | 5:53 | 312 | 442 |
| Jun 25 | 5:32 | 324 | 508 |
| Jun 26 | 5:05 | 380 | 477 |
| Jun 27 | 4:47 | 397 | 643 |
| Jun 28 | 5:01 | 382 | 598 |
| Jun 29 | 4:46 | 396 | 541 |
| Jun 30 | 5:46 | 332 | 487 |
| Jul 01 | 4:37 | 392 | 640 |
| Jul 02 | 5:08 | 358 | 572 |
| Jul 03 | 5:00 | 362 | 593 |
| Jul 04 | 4:44 | 367 | 582 |
| Jul 05 | 8:18 | 85 | 139 |
| Jul 06 | 4:47 | 378 | 623 |
| Jul 07 | 4:51 | 370 | 602 |
| Jul 08 | 4:56 | 361 | 615 |
| Jul 09 | 5:01 | 352 | 586 |
| Jul 16 | 4:59 | 338 | 575 |
| Jul 17 | 4:35 | 355 | 612 |
| Jul 18 | 4:33 | 352 | 621 |
All light curves are available at the AAVSO International Database444https://www.aavso.org.
3 Superhumps and long term variations
As an example Fig. 1 (top) shows the light curve observed on 2003, July 1. It is dominated by flickering activity typical for cataclysmic variables, but also exhibits a clear modulation on the time scale of hours. In the lower frame of the figure the combined light curves of the 22 nights during which V603 Aql was observed is shown. Variations occurring during the individual nights are, of course, not resolved on this scale, but a clear and apparently periodic modulation repeating on the time scale of several days is obvious, as indicated by the average nightly magnitudes (light blue dots).
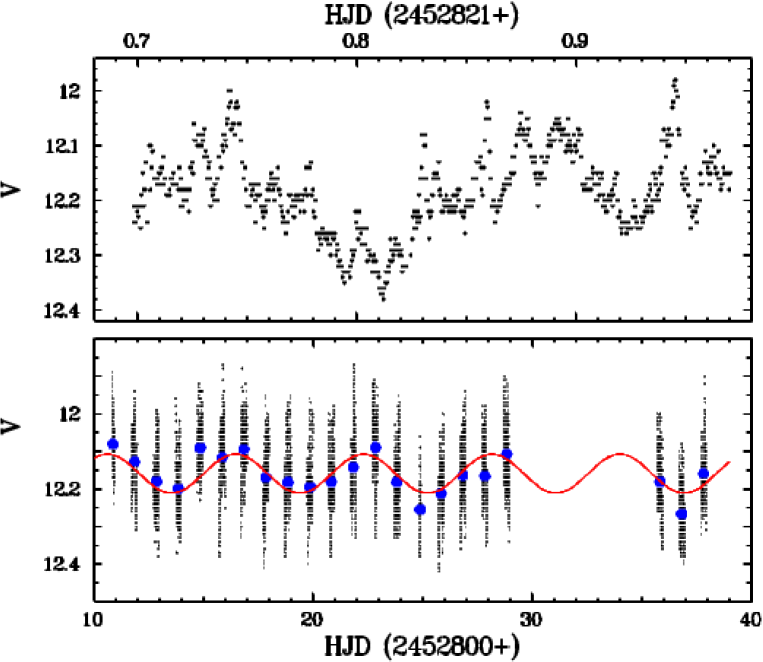
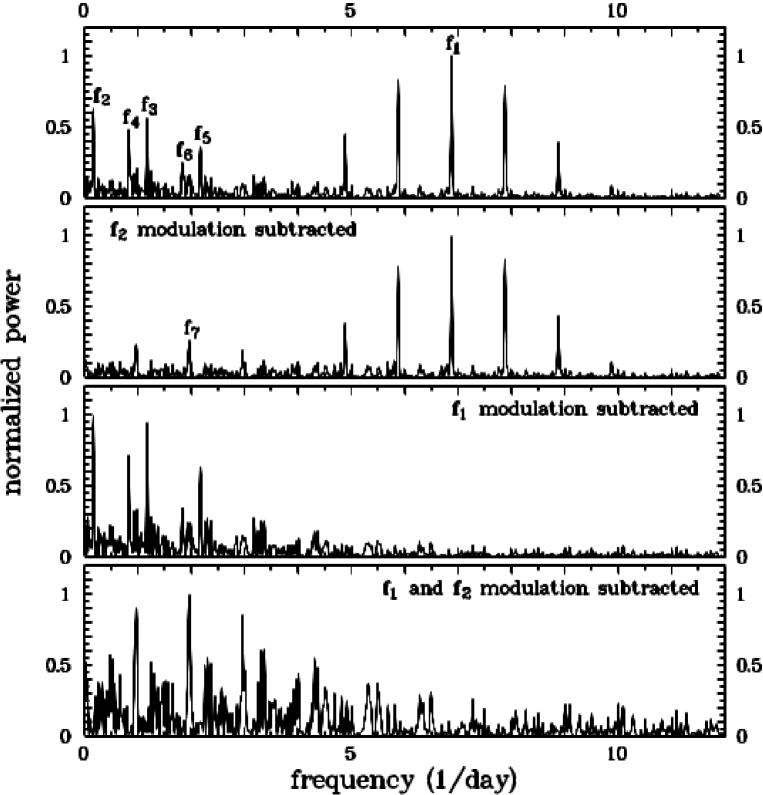
Fig. 2 (top) shows the Lomb-Scargle periodogram (Lomb 1976, Scargle 1982, hereafter referred to as power spectrum), normalized to the highest peak, of the combined light curves. The plot is restricted to frequencies 12 cycles per day. No significant signals were detected at higher frequencies. The power spectrum is dominated by a maximum labelled in the figure. Disregarding the symmetrical pattern of peaks at both sides of , which are obvious 1/day aliases caused by the data sampling, we identify several other peaks labelled … (in decreasing order of their height) in the power spectrum which appear to be significant. The frequencies of the maxima of Gaussians fit to these peaks are summarized in Table 2 together with their corresponding periods …. Here, the error is conservatively defined as the width of the best fit Gaussians.
Table 2: Significant frequencies and periods identified in the power spectrum of the combined light curves of V603 Aql
| No. | (1/day) | (days) |
|---|---|---|
| 1 | ||
| 2 | ||
| 3 | ||
| 4 | ||
| 5 | ||
| 6 | ||
| 7 |
The period days can evidently be identified with the period of the superhump in V603 Aql (the 35 modulation). It is very close to that measured in previous observations by Haefner (1981) (0.144854 days), Udalski & Schwarzenberg-Czerny (1989) (0.14567 days), Bruch (1991) (0.14468 days) and Patterson & Richman (1991) (0.14548 days). The latter authors also comment on seasonal variations of the period. The long term instability of the period was confirmed by Patterson et al. (1993) who reported the period to drift from 0.14602 days to 0.14663 days over the cause of about four months in 1991.
In order to verify, if the period over the time base of the current observation is stable, power spectra of the first and second half of the entire data set (eliminating the last three nights, separated by a 7 night gap from the other light curves) were calculated. The resulting periods differ by 19, well within the formal error. Next, sections of three subsequent nights (with a two night overlap between adjacent sections) were investigated. No systematic drift of the period was found. Thus, we conclude that over the time base of the present light curve the 35 period of V603 Aql remained stable within the achievable accuracy.
The power spectrum also exhibits some peaks at low frequencies. To our knowledge, this frequency range has not been investigated in detail before. The strongest peak in this frequency range, , corresponds to a period of days. This modulation is readily seen in the combined light curve. The red curve in the lower frame of Fig. 1 represents a least squares sine fit with the period fixed to . The nature of these variations will be discussed below.
In order to further investigate the properties of the various observed frequencies in the combined light curve, we first pre-whitened the data set by subtracting the modulation (i.e., subtracting the sine curve in the lower frame of Fig. 1). The power spectrum of the result is shown in the second frame of Fig. 2. The frequencies – completely vanished, indicating that – are not independent from . In fact, they can all be explained as being caused by the window function which due to the data sampling has a strong peak are . Within the error limits, , , , and .
However, apart from and its alias pattern the power spectrum now reveals another system of fainter peaks. The strongest of these has a frequency of per day (included in Table 2). The others are 1/day aliases. These peaks are also present in the original data set (before pre-whitening) but dwarfed by stronger signals at neighbouring frequencies. A first suspicion they they are somehow caused by the seven day gap close to the end of the combined light curve cannot be confirmed because they persist (and even become stronger) when the last three nights are removed from the data set. The ratio and is thus exactly equal to a half-integer value. This suggests that these frequencies are related to overtones of each other. On the other hand, the close proximity of to half a day indicates that this variation may be a data sampling effect. But note that, considering the error limits, the difference between and 0.5 days is rather large ()555, if instead of the civil day the sidereal day is regarded. Systematic measurement errors such as, e.g., an imperfect extinction correction should be correlated with sidereal time, not civil time..
In a second approach we prewhitened the combined light curves by first fitting a sine curve with the period fixed to and then subtracting the fit. The power spectrum of the resulting data is shown in the third frame of Fig. 2. As expected, frequencies – remain while and its aliases vanish. The complete absence of any residual signal at means that the waveform of the modulation is very close to a simple sinusoid.
Finally, the bottom frame of Fig. 2 contains the power spectrum after removing both, the and modulations. The peak and its aliases remain, while all other previously identified signals disappear. The power spectrum of a light curve from which also the signal has been removed does not contain any more signals which might confidently indicate coherent brightness variations.
Light curves folded on (after removing the modulation) and (after removing the modulation) are shown in the left and right frames, respectively, of Fig. 3. The zero point of phase was arbitrarily chosen to be HJD 2452800. The amplitude of the best fit sine curve to the superhump modulation () is . Thus, the full range of the modulation is twice this value. This is somewhat more than the range of 008 measured by Patterson et al. (1993). The sine fit to the modulation has an amplitude of .
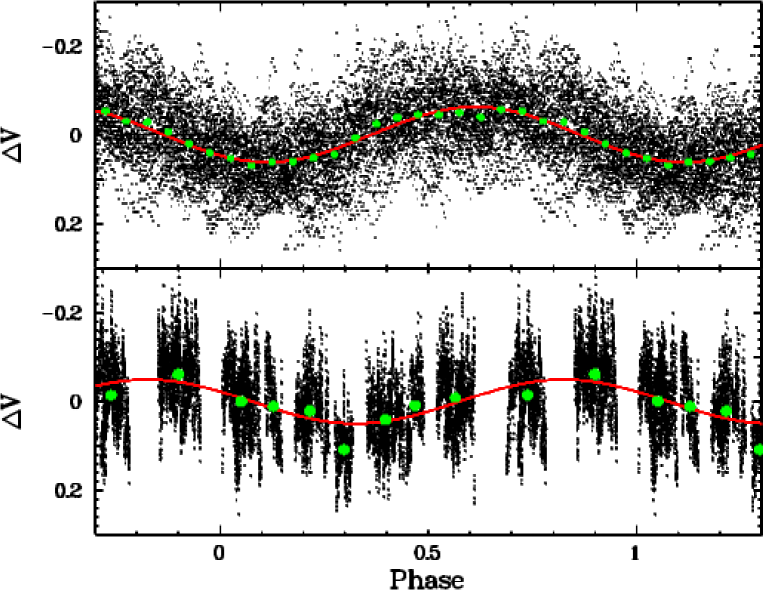
In order to investigate if the superhump modulation depends on the phase of the variations the light curves folded on based on only the nights when on average V603 Aql was brighter and fainter, respectively, than the mean magnitude over the entire observing run were compared to each other. No differences in the waveform were detected. The same result was achieved when selecting light curves on the rising and falling branches, respectively, of the sine curve in the lower frame of Fig. 1. Thus, shape and amplitude of the 35 signal appear to be independent from .
4 Discussion
Observations of superhumps in V603 Aql are not unprecedented (see Sect. 1). But what about the modulation? A simple comparison between the orbital frequency , the superhump frequency and the frequency shows that the latter is not independent from the others. With the orbital period as measured by Peters & Thorstensen (2006) . This is equal to within 0.5 times the formal error. The difference between the orbital and the superhump periods in CVs is well understood as being due to the precession of an eccentric accretion disk and the precession period is given as (see Sect. 1) . Thus, can be identified as twice the precession period.
Variations in CVs with positive or negative superhumps occuring on the precession period are not numerous but they have been observed before. Yang et al. (2017) compiled a list of systems which were reported to exhibit such modulations. We will concentrate here on positive superhumps, because only these are the topic of this study and the mechanisms for light modulations on the nodal precession period of warped accretions disk may be quite different from those due to apsidal precession of eccentric disks.
In several of the systems enumerated by Yang et al. (2017) evidence for variations with is only marginal or circumstantial, leaving as the most convincing cases AH Men, MV Lyr, TT Ari and the very object investigated here, namely V603 Aql.
In 1993-94 Patterson (1995) observed variations on the beat period between orbital and superhump periods in AH Men. Their waveform, however, is rather complicated. It exhibits three distinct maxima and is thus quite different from the waveform seen in the right panel of Fig. 3.
First indications of variations on in MV Lyr were reported by Borisov (1992). While these may be only marginal, confirming observations by Skillman et al. (1995) lend more credibility to their reality. A high cadence light curve of MV Lyr spanning hundreds of days with only small interruptions has been observed by the Kepler satellite (Scaringi et al. 2012, Dobrotka et al. 2015). It might be worthwhile to search these data for similar variations. This, however, is beyond the scope of the present study.
Using spectroscopy, Stanishev et al. (2001) found that the asymmetry of the H emission line of TT Ari is modulated with the precession period. This may be explained by the distorted velocity field in a precessing, eccentric accretion disk which produces emission lines whose asymmetry is modulated with the precession period; an idea first introduced by Hessman et al. (1992).
Finally, Suleimanov et al. (2004) found variations in V603 Aql on the disk precession period in 2001 and 2002. While this is based on a restricted data set of only four nightly light curves in 2001 and five in 2002, which by themselves would not justify a claim for cyclic modulations (see their Fig. 7), the fact that they can be represented by a sinusoid with a period independently determined as the beat period of the orbital and an observed superhump period gives some confidence in the reality their finding.
Compared to all previous claims of variations in CVs on the precession period of an eccentric accretion disk, the evidence presented here for a brightness modulation of V603 Aql not on , but on , is much stronger. The observations of long light curves taken in 22 night, 19 of which are consecutive, permit to determine with high accuracy and confidence the period of superhumps as well as that of modulations on time scales of days. The latter being quite precisely equal to twice the beat period between the superhump period and the well known orbital period, together with the well established understanding for superhumps to arise in a precessing eccentric disk, cannot leave any doubt about the connexion between and .
However, the immediately following question concerns the origin of the variations. Why does V603 Aql vary on twice the precession period? Superhumps occur in eclipsing CVs just as in CVs with a small orbital inclination. Therefore, the light variations cannot be due to geometrical effects. It is rather thought that they are caused by the extra tidal stresses in the outer, asymmetric disk when its elongated part extends towards the secondary. But it is then not clear why the system brightness should be modulated with the precession period, not to speak with twice that period, in particular in a system such as V603 Aql where the disk is seen amost face-on (Arenas et al. 2000).
Few ideas have been brought forward to explain variations in CV with , and to our knowledge none of them is related to brightness modulations. Apart from the already mentioned possibility that the changing view of the velocity field in an eccentric disk may cause variations in the observed shape of spectral lines (Hessman et al. 1992), only Patterson et al. (2002) provide a clue, interpreting variations in the eclipse depth of WZ Sge on the time scale of days as an effect of disk precession in this high inclination system.
Having thus no explanation for the observed variability we are forced to leave the solution of this mystery to future studies and as a challenge for a theoretical interpretation.
5 Summary
We presented 22 long (mostly 5 hours) and high time resolution (35 sec) light curves of the old nova V603 Aql, 19 of which were taken in consecutive nights. This is the longest continuous data train (only interruped during daytime) of this star ever observed. It is thus not only well suited to study intra-night variations occuring on the time scale of hours (such as the well known 35 hour superhump variations), but in particular to investigate variations on time scales of several days.
These favourable data properties permitted to detect an unexpected feature in V603 Aql, hitherto unobserved in any cataclysmic variable. The system exhibits a clear cyclic brightness modulation with a period equal to quite high a degree to twice the beat period between the orbit and the superhumps. The latter is routinely interpreted in superhumping CVs as the period of the apsidal precession of an eccentric accretion disk.
While indications of varability on the disk precession period have been observed in a couple of CVs in the past, they have never been nearly as clear as the variation found in this study on twice that period. It is not obvious why the brightness of a system should be correlated with the disk precession period. Geometric effect can probably be ruled out to explain this phenomenon, considering that the orbital inclination of V603 Aql () is quite low. And then, why should the brightness be modulated on twice the precession period? As yet, we cannot answer this question.
References
-
Arenas, J., Catalán, M.S., Augusteijn, T., & Retter, A. 2000, MNRAS, 311, 135
-
Belova, A.I., Suleimanov, V.F., Bikmaev, I.F., et al. 2013, Astron. Letters, 39, 111
-
Borisov, G.V. 1992, A&A, 261, 154
-
Bruch, A. 1991, Acta Astron., 41, 101
-
Bruch, A. 1993, A Reference Guide (Astron. Inst. Univ. Münster
-
Bruch, A. 2018, New Astron., 58, 53
-
Cropper,M. 1986, MNRAS, 222, 225
-
Dobrotka, A., Mineshige, S., Ness, J.-U. 2015, MNRAS, 447, 316
-
Drechsel, H., Rahe, J., Seward, F.D., & Wargau, W. 1983, A&A, 126, 357
-
Drechsel, H., Rahe, J., Wargau, W., & Krautter, J. 1982, Mitt. Astron. Ges., 57, 301
-
Eastman, J., Siverd, R., & Gaudi, B.S. 2010, PASP, 122, 935
-
Haefner, R. 1981, IBVS, 2045
-
Haefner, R., & Metz, K. 1985, A&A, 145, 311
-
Hessman, F.V., Mantel, K.-H., Barwig, H., & Schoembs, R. 1992, A&A, 263, 147
-
Hollander, A., Kraakman, H., & van Paradijs, J. 1993, A&AS, 101, 87
-
Johnson, C.B., Schaefer, B.E., Kroll, P., & Henden, A.A. 2014, ApJ, 780, L25
-
Kozhevnikov, V.P. 2004, A&A, 419, 1035
-
Kozhevnikov, V.P. 2007, MNRAS, 378, 955
-
Kozhevnikov, V.P. 2012, New Astron., 17, 38
-
Kraft, R.P. 1964, ApJ 139, 457
-
Lomb, N.R. 1976, Ap&SS, 39, 447
-
Nogami, D., Masuda, S., Kato, T., & Hirata, R. 1999, PASJ, 51,115
-
Papadaki, C., Boffin, H.M.J., Stanishev, V., et al. 2009, J. Astron. Data, 15, 1
-
Papadaki, C., Boffin, H.M.J., Sterken C., et al. 2006, A&A, 456, 599
-
Patterson, J. 1981, ApJ Suppl., 45,517
-
Patterson, J. 1995, PASP, 107, 657
-
Patterson, J., Kemp, J., Shambrook, A., et al. 1997, PASP, 109, 1100
-
Patterson, J., & Richman, H., 1991, PASP, 103, 735
-
Patterson, J., & Skillman, D.R. 1994, PASP, 106, 1141
-
Patterson, J., Thomas, G., Skillman, D.R., & Diaz, M., 1993, ApJS, 83, 235
-
Patterson, J., Thorstensen J.R., Fried, R., et al. 2001, PASP, 113, 72
-
Peters, C.S., & Thorstensen, J. 2006, PASP, 118, 687
-
Retter, A., Hellier, C., Augusteijn, T., et al. 2003, MNRAS, 340, 679
-
Scargle, J.D. 1982, ApJ, 263, 853
-
Scaringi S., Körding, E., Uttley, P., et al. 2012, MNRAS, 427, 3396
-
Schwarzenberg-Czerny, A., Udalski, A., & Monier, R. 1992, ApJ, 401, L19
-
Skillman, D.R., Patterson, J., Thorstensen, J.R. 1995, PASP, 107, 545
-
Smak, J. 2013, Acta Astron., 17, 453
-
Stanishev, V., Kraicheva, Z., & Genkov, V. 2001, A&A, 379, 185
-
Strope, R.J, Schaefer, B.E., & Henden, A.A. 2010, AJ, 140, 134
-
Suleimanov, V., Bikmaev, I., Belyakov, K., et al. 2004, Astron. Lett., 30, 615
-
Udalski, A., & Schwarzenberg-Czerny, A. 1989, Acta Astron.,39, 125
-
Yang, M.T.-C., Chou, Y., Ngeowm C.-C., et al. 2017, PASP, 129,4202