Tapir: Automation Support of Exploratory Testing Using Model Reconstruction of the System Under Test
Abstract
For a considerable number of software projects, the creation of effective test cases is hindered by design documentation that is either lacking, incomplete or obsolete. The exploratory testing approach can serve as a sound method in such situations. However, the efficiency of this testing approach strongly depends on the method, the documentation of explored parts of a system, the organization and distribution of work among individual testers on a team, and the minimization of potential (very probable) duplicities in performed tests. In this paper, we present a framework for replacing and automating a portion of these tasks. A screen-flow-based model of the tested system is incrementally reconstructed during the exploratory testing process by tracking testers’ activities. With additional metadata, the model serves for an automated navigation process for a tester. Compared with the exploratory testing approach, which is manually performed in two case studies, the proposed framework allows the testers to explore a greater extent of the tested system and enables greater detection of the defects present in the system. The results show that the time efficiency of the testing process improved with framework support. This efficiency can be increased by team-based navigational strategies that are implemented within the proposed framework, which is documented by another case study presented in this paper.
Index Terms:
Model-Based Testing, Web Applications Testing, Functional Testing, System Under Test Model, Generation of Test Cases from Model, Model ReengineeringI Introduction
The contemporary software development market is characterized by the increasing complexity of implemented systems, a decrease in the time to market, and a demand for real-time operation of these systems on various mobile devices [1]. An adequate software system is needed to solve the quality-related problems that arise from this situation. Model-Based Testing (MBT) is a suitable method for generating efficient test cases [2]. For a considerable ratio of the cases, the direct applicability of the method is hindered by the limited availability and consistency of the test basis, which is used to create the model.
To overcome these limitations, we explore possible crossover between common MBT techniques and the exploratory testing approach. Exploratory testing is defined as the simultaneous testing, learning, documentation of the System Under Test (SUT) and creation of the test cases [3]. The exploratory testing approach is a logical choice for testing systems for which a suitable test basis is not available. Even when the test basis is available, and the test cases are created, they can be either obsolete or inconsistent and structured at an excessively high level [4]. Thus, testers employ the exploratory testing technique as a solution for overcoming these obstacles.
The key factors for the efficiency of exploratory testing are consistent documentation of the explored path and exercised test cases [5, 3]. This systematic documentation has the following features:
-
1.
prevents the duplication of (informal) test scenarios that are executed by various testers, which prevents a waste of resources;
-
2.
leads to an exploration of the parts of the SUT that have not been previously explored and tested;
-
3.
improves the efficiency and accuracy of the defect reporting process; and
-
4.
improves the transparency and documentation of the testing process, which is necessary for reporting and making managerial decisions related to a project.
Regarding the weaknesses of the exploratory testing, several issues have been observed in previous reports. Particularly, the low level of structuring of the testing process and a certain ad hoc factor can prevent efficient management of the exploratory testing process. These issues may cause problems with the prioritization of the tests, the selection of suitable tests in the actual state of the testing process and the repetition of the exercised tests [3, 6].
Particular SUT exploration strategies are considered important in the exploratory testing process [7]. To efficiently conduct an exploration strategy, the exercised tests must be manually recorded and documented, which can generate additional overhead for the testing team. This overhead can outweigh the benefits gained by a more efficient SUT exploration strategy. Thus, an automation of the tasks related to the documentation of the exercised tests is an option worth exploring.
Teamwork can have a significant role in exploratory testing. The team organization increases the efficiency of the exploratory testing technique in terms of identified defects [5], and it may also prevent repetitive tests and test data combinations. However, these possibilities have only been explored in a manual version of the exploratory testing process [5].
These issues represent our motivation for exploring the possibilities of supporting exploratory testing by a suitable machine support method.
This paper summarizes a concept of such a machine support. The paper focuses on SUT exploration strategies and the generation of high-level test cases from the SUT model. The model is reengineered during the exploratory testing activities. The paper presents the Test Analysis SUT Process Information Reengineering (Tapir) framework, which guides exploratory testers during their exploration of a SUT. The first objective of the framework is to enable the testing team members to explore the SUT more systematically and efficiently than the manual approach. The second objective of the framework is to automatically document the explored parts of the SUT and create high-level test cases, which guide the testers in the SUT. In this process, the framework continuously builds a SUT model front-end UI. This model is enriched by numerous elements that enhance the testing process.
This paper is organized as follows. Section II presents the principle of the Tapir framework and introduces the SUT model and its real-time construction process. Section III explains the process of guiding the exploratory tester in the SUT based on this model. Section IV describes the setup of the performed case studies. Section V presents the results of these case studies. Section VI discusses the presented results. Section VII discusses threats to the validity of the results, and Section VIII presents related studies. Finally, Section IX provides the concluding remarks of the paper.
II Real-time Construction of the SUT Model
This section summarizes the functionality of the Tapir framework and the underlying SUT model.
II-A Principles of the Tapir Framework
The aim of the Tapir framework is to improve the efficiency of exploratory testing by automating the activities related to the following:
-
1.
records of previous test actions in the SUT,
-
2.
decisions regarding the parts of the SUT that will be explored in the subsequent test steps, and
-
3.
organization of work for a group of exploratory testers.
The framework tracks a tester’s activity in the browser and incrementally builds the SUT model based on its User Interface (UI). Based on this model, which can be extended by the tester’s inputs, navigational test cases are generated. The explored paths in the SUT are recorded for the individual exploratory testers. The navigational test cases help the testers explore the SUT more efficiently and systematically, especially when considering the teamwork of a more extensive testing group (typically larger than five testers).
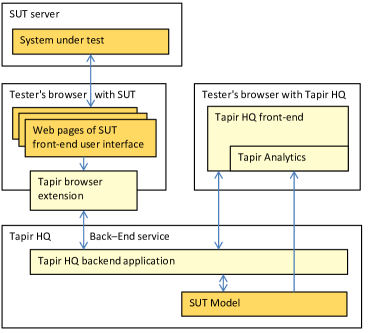
Technically, the Tapir framework consists of three principle parts.
-
1.
Tapir Browser Extension: this extension tracks a tester’s activity in the SUT and sends the required information to the Tapir HQ component, and it also highlights the UI elements of the SUT in a selected mode (i.e., the elements already analyzed by the Tapir framework or elements suggested for exploration in the tester’s next step). The extension also analyzes the SUT pages during the building of the SUT model. Currently, implemented for the Chrome browser.
-
2.
Tapir HQ: this part is implemented as a standalone web application that guides the tester through the SUT, provides navigational test cases, and enables a Test Lead to prioritize the pages and links and enter suggested Equivalence Classes (ECs) for the SUT inputs and related functionality. This part constructs and maintains the SUT model. Tapir HQ runs in a separate browser window or tab, thus serving as a test management tool that displays the test cases for the SUT.
-
3.
Tapir Analytics: this component enables the visualization of the current state of the SUT model and a particular state of SUT exploration. This part is also implemented as a module of Tapir HQ that shares the SUT model with the Tapir HQ application.
The overall system architecture is depicted in Figure 1.
The Tapir framework defines two principal user roles.
-
1.
Tester: a team member who is guided by the Tapir framework to explore the parts of the SUT that have not been previously explored. For each of the testers, a set of navigational strategies and a test data strategy can be set by the Test Lead. The navigational strategy determines a sequence of the SUT functions to be explored during the tests, which is suggested to the tester by the navigational test cases. The test data strategy determines the test data to enter on the SUT forms and similar inputs during the tests. The test data are also suggested to the testers by the navigational test cases.
-
2.
Test Lead: senior team member who explores the SUT before asking the testers to perform detailed tests. In addition to the tester’s functionalities, the Test Lead has the following principal functionalities.
-
(a)
Prioritization of the pages, links, and UI action elements of the SUT. During the first exploration, the Test Lead can determine the priority of the particular screens and related elements. This priority is saved as a part of the SUT model and subsequently employed in the navigational strategies (refer to Section III-B).
-
(b)
Definition of suitable input test data. During the first exploration, the Test Lead can define ECs for the individual input fields that are detected on a particular page. The ECs are saved to the SUT model and subsequently employed in the process when generating navigational test cases. After the ECs are defined for all inputs of the form on the particular page, the Test Lead can let the Tapir framework generate the test data combinations using an external Combinational Interaction Testing (CIT) module. This module generates a smaller number of efficient test data combinations based on a set of inputs on the page and the ECs defined for these inputs. In this process, a Particle Swarm Test Generator (PSTG) algorithm [8] is applied. Additional details are provided in Section IV-A.
-
(a)
The Test Lead can dynamically change the navigational and test data strategy of particular testers during the testing to reflect the current state and priorities in the testing process. These strategies are explained in Sections III-B and III-C. The role of the Test Lead is not mandatory in the process. The Tapir framework can be employed by a team of exploratory testers without defining this role. In this case, functions related to prioritization and test data definitions are not available to the team. The framework administrator sets navigational strategies for team members.
II-B SUT Model
For the purpose of systematic navigation by exploratory testers in the SUT, we evolved the following model during our work and experiments with the Tapir framework. denotes all exploratory testers who are testing the SUT. The set includes testers . A tester can be given the role of Test Lead. The SUT is defined as a tuple , where is a set of SUT pages, is a set of input elements displayed to the user on the web pages of the SUT user interface, is a set of action elements (typically <form> element submits), and is a set of link elements displayed to the user.
A Web Page is a tuple , where is a set of input elements, is a set of action elements and is a set of link elements located on page . A Web Page can contain action elements that can perform actions with more than one form displayed on the page. In our notation, contains a set of input elements that are connected to the action elements .
On the SUT page , an input element is a data entry field (text field, drop-down item, checkbox or another type of input element defined by the HTML for the forms). An action element triggers the submission of the form, invokes data processing in the SUT and transition to the next page . The action elements are HTML buttons or elements invoking submit event on the page. The link elements are HTML links, or elements that invoke a transition to the next page . Typically, the SUT header or footer menu is captured by the link elements.
Then, denotes the particular data range that can be entered in an input element . The can be either an interval or a set of discrete values (items of a list of values for instance). Then, contains these ranges for the input elements of .
is a set of action transition rules , where is a SUT web page that is displayed to a user as a result of exercising the action element with particular input data entered in the input elements .
is a set of action transition rules , where is a SUT web page that is displayed to the user as a result of exercising a link element .
Web Pages that are accessible from Web Page by the defined transition rules and are denoted as .
is a set of UI master pages. The Master Page models repetitive components of the SUT user interface, such as a page header with a menu or a page footer with a set of links. The definition of the Master Page is the same as the definition of a Web Page, and the Master Pages can be nested (refer to the Web Page definition). is a set of Master Pages of page , and this set can be empty. Additionally, represents the home page (defined page, from which the exploratory testers start exploring the SUT) and represents the standard error page displayed during fatal system malfunctions (e.g., the exception page in J2EE applications).
The model of the Web Page and related concepts are depicted in Figure 2. The blocks with a white background depict parts of the model that are automatically reengineered by the Tapir framework during the exploratory testing process. Of these parts, the elements specifically related to the interaction of the tester with the SUT are depicted by the blocks with a dotted background. The blocks with a blue-gray background depict metadata entered by the Test Lead during the exploratory testing process.
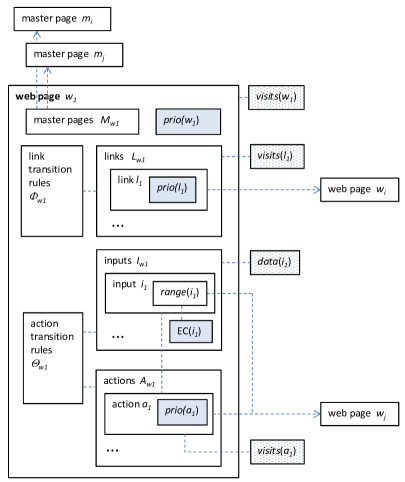
As explained in Section II-A, the model is continuously built during the exploratory testing process. The team of testers contribute to this process, and denotes the SUT pages explored by the whole team while denotes SUT pages explored by the tester . By analogy, () denotes the SUT link (action) elements explored by the whole team and () denotes link (action) elements explored by the tester .
By principle, a link or action element can be exercised additional times during the test exploration process because a page can be repeatedly visited. To capture this fact, , and denotes the number of visits of page , link element and action element by tester , respectively. Additionally, , and denote the number of visits of the page , link element and action element by all testers in the testing team , respectively.
For each input element , the Test Lead can define a set of ECs , which determine the input test data that shall be entered by the exploratory testers during the tests. When these ECs are not defined, is empty. For each , if is an interval, then is a sub-interval of ; and if is a set of discrete values, then .
ECs can be dynamically defined during the exploratory testing process, and certain classes can be removed from the model while other classes can be added to the model, with for each .
In addition, () denotes a set of test data values that are entered to input element by tester (by all testers in testing team ) during the testing process.
A set of test data combinations that are entered by tester for the input elements connected to the action element is denoted as . A set of test data combinations that are entered by all testers in testing team in the input elements connected to the action element is denoted as .
The Test Lead can also set a priority for selected elements of the SUT model. This priority is denoted as , , where five is the highest priority. denotes particular web page , link element , or action element .
The presented model is inspired by a web application model proposed by Deutsch et al. [9]. In our SUT model, significant changes have been made. We kept and modified the definitions of SUT and its web page . In the main tuple that defines the SUT model, we removed the database and states, and then we distinguish the system inputs as input , action and link elements. In the definition of the SUT web page , we distinguish the action and link elements. Consequently, we defined the transitions to the following page according to the action transition rule sets and . The home page is taken from the original model. We also applied a concept of the error page ; however, we define it differently.
The remaining elements of the model (master pages, team of testers, visits of particular SUT pages and their elements, ECs, test data combinations and element priorities) are completely different and were defined by new elements, and they capture specific features of the exploratory testing problem.
III Generation of Navigational Test Cases from the Model
As previously explained, the Tapir framework generates high-level navigational test cases that are aimed at guiding a group of exploratory testers through the SUT. The primary purpose of these test cases is to guide the tester in the SUT. The test cases are dynamically created from the SUT model during the exploratory testing process.
III-A Structure of the Navigational Test Case
The navigational test cases are dynamically constructed from the SUT model for an individual tester during the exploratory testing process. The navigational test case is constructed for the actual page visited in the SUT and helps the tester determine the next step in the exploratory testing process. The structure of the navigational test case is described as follows.
-
1.
Actual page visited in the SUT.
-
2.
(list of all link elements that lead to other SUT pages that are accessible from the actual page). In this list, the following information is given:
-
(a)
(links elements that lead to other SUT pages that are accessible from the actual page previously visited by the particular tester ),
-
(b)
for each ,
-
(c)
(links elements that lead to other SUT pages that are accessible from the actual page previously visited by all testers in team ),
-
(d)
for each , and
-
(e)
and for each . Link leads from the actual page to the page .
-
(a)
-
3.
(list of all action elements that lead to other SUT pages that are accessible from the actual page). In this list, the following information is given:
-
(a)
(action elements that lead to other SUT pages that are accessible from the actual page previously visited by the particular tester ),
-
(b)
for each ,
-
(c)
(action elements that lead to other SUT pages that are accessible from the actual page previously visited by all testers in the team ),
-
(d)
for each , and
-
(e)
for each .
-
(a)
-
4.
Five elements are suggested for exploration in subsequent test steps for each of the navigational strategies assigned to tester by the Test Lead. These elements are sorted by their ranking, which is calculated by the respective navigational strategies. This ranking gives the tester the flexibility to choose an alternative element if he considers the suggested option to be unsuitable. Because a particular tester can have additional navigational strategies available, these suggestions are displayed for each of the assigned navigational strategies in a separate list, and the tester can choose the optimal strategy according to his personal testing strategy within the navigational strategies set by the Test Lead. The elements that are suggested for exploration are described as follows:
-
(a)
The link and page suggested for exploration in the next test step, or
-
(b)
The action element suggested for exploration in the next test step.
-
(a)
-
5.
For each , if :
-
(a)
,
-
(b)
,
-
(c)
for each :
-
i.
is suggested based on the test data strategy (refer to section III-C) set by the Test Lead, and based on this suggestion, tester can select a particular data value from to enter it into the input element for the actual test;
-
ii.
(all test data previously entered by the particular tester to the input element ); and
-
iii.
(all test data previously entered by all testers in the testing team to the input element ).
-
i.
-
(a)
-
6.
Previous test data combinations entered in , which resulted in the error page (e.g., a J2EE exception page ) or a standardized error message (typically, a PHP parsing error message or application specific error message formatted in a unified standard manner) that can be recognized by the Tapir framework.
-
7.
Notes for testers, which can be entered by the Test Lead onto page , all link elements from and all action elements . The Test Lead can enter these notes as simple textfields (the notes are not defined in the model in Section II-B).
III-B Navigational Strategies
To create navigational test cases during the exploratory testing process, several navigational strategies can be employed. These strategies are specified in Table I. A navigational strategy determines a principal method that can be applied by a tester to explore the SUT. Most of the navigational strategies can be adjusted using a particular ranking function as specified in Table II. The navigational strategies address the guided exploration of new SUT functions for all testers individually or as a collaborative work by the testing team. The same process is enhanced by navigation driven by priorities of the SUT pages, links and action elements or by regression testing for a defined historical period. This latter strategy is also applicable to retests of defect fixes after a new SUT release.
The navigational strategy determines the SUT user interface elements that are suggested for the SUT page in the navigational test case (refer III-A). The input of this process is the application context (tester and related metadata) and actual state of the SUT model that has been specified in sub-section II-B. By the rules specified in Table I and the ranking functions specified in Table II, a list of and , which are sorted by these rules and functions, is created.
| Navigational strategy | Rules for element suggestion for page and tester . Element can be link element or action element . | Ranking functions (see Table II) used | Use case |
|---|---|---|---|
| RANK_NEW | satisfying the following conditions: (1) , AND (2) ( has the highest ElementTypeRank() OR a page to which leads has the highest PageComplexityRank()), AND (3) are preferred to | ElementTypeRank PageComplexityRank | Exploration of new SUT functions |
| RANK_NEW_TEAM | As RANK_NEW, (1) modified to: has the minimal value among all and . | ElementTypeRank PageComplexityRank | Exploration of new SUT functions |
| RT_TIME | satisfying the following conditions: (1) , AND (2) time elapsed from the last exploration of by tester > constant, AND (3) are preferred to | - | (1) Retesting of defect fixes, (2) Regression testing |
| PRIO_NEW | satisfying the following conditions: (1) , AND (2) has the maximal value among all and , AND (3) if is a link element , page has the highest PriorityAndComplexityRank(), AND (4) are preferred to | PriorityAndComplexityRank | Exploration of new SUT functions by priorities set by the Test Lead |
| PRIO_NEW_TEAM | As RANK_NEW, (1) modified to: has the minimal value among all and . | PriorityAndComplexityRank | Exploration of new SUT functions by priorities set by the Test Lead |
The ranking function ElementTypeRank is used for both link elements and action elements . The PageComplexityRank is only used for link elements . In the case of action elements, we are not able to determine the exact SUT page after the process triggered by the action element because test data that have been entered can have a role in determining the page that will be displayed in the next step (refer to the SUT model in sub-section II-B).
| Rank | Definition |
|---|---|
| ElementTypeRank() | IF is link THEN ElementTypeRank() = 1 IF is action element THEN ElementTypeRank() = 2 |
| PageComplexityRank() | PageComplexityRank() = ((( + +) , , |
| PriorityAndComplexityRank() | PriorityAndComplexityRank() = (((( +) + +) , , |
In the ElementTypeRank, action elements are preferred to link elements because action elements can be expected to contain additional business logic and data operations of the SUT to be explored in the tests (typically, submitting the data by forms on SUT pages).
In the PageComplexityRank ranking function, the constants , , and determine how strongly the individual page action elements, input elements and link elements are preferred for determining the page . These elements are suggested for exploration in the tester’s next step via the use of a link element that leads to . An increase of a particular constant will cause the pages with a higher number of particular elements to be preferred. These constants can be dynamically set by the Test Lead during the exploration testing process.
The constants and can be set in the range of 1 to 512. The constant can be set in the range of 0 to 512. The default value of these constants is 256. Without any change, the pages with a higher number of forms, a higher number of input fields, a higher number of action elements, and a higher number of link elements are considered more complex for the testing purposes, and they are suggested for initial exploration.
In the PriorityAndComplexityRank, the priorities of the SUT pages set by the Test Lead have the strongest role in the determination of the suggested next page for exploration. The constant determines the extent of the role of this prioritization. Then, the decision is influenced by the number of input fields, the number of action elements, and the number of link elements. The constants , and have the same meaning and function as in the PageComplexityRank. The constant can be set in the range of 0 to 512 and its default value is 256. In Tapir HQ component, the Test Lead is provided with a guideline for setting the constants , , and and the influence of a particular setting.
III-C Test Data Strategies
During the construction of the navigational test cases, test data are suggested for the input elements connected to the action elements of the particular page. For this suggestion, (1) test data previously entered by the testers ( and for each ) and (2) ECs defined by the Test Lead ( for each ) are employed.
For this process, the test data strategies described in Table III are available. These test data strategies are specifically designed for different cases in the testing process, such as retesting defect fixes, testing regressions or exploring new test data combinations.
| Test data strategy | Description | Use case |
|---|---|---|
| DATA_REPEAT_LAST | For each , suggest the value of used in the last test made by tester on page . If , no suggestion is made. | (1) Retesting of defect fixes, (2) Regression testing |
| DATA_REPEAT_RANDOM | Suggest a randomly selected test data combination from . If , no suggestion is made. | Regression testing |
| DATA_REPEAT_RANDOM_TEAM | Suggest a randomly selected test data combination from . If , no suggestion is made. | Regression testing |
| DATA_NEW_RANDOM | For each : if , suggest a , such that for any if , suggest a value , such that | Exploration of new test data combinations |
| DATA_NEW_RANDOM_TEAM | For each : if , suggest a , such that for any if , suggest a value , such that | Exploration of new test data combinations |
| DATA_NEW_GENERATED | The Tapir engine suggests combination, which was not used previously by individual tester . Combination of test data is taken from a pipeline of test data combinations created by a Combination Interaction Testing (CIT) module, connected to the framework by the defined interface (details follow in section IV-A). | Exploration of new test data combinations |
| DATA_NEW_GENERATED_TEAM | As DATA_NEW_GENERATED_TEAM, modified to: combination, which was not used previously by any tester of the testing team | Exploration of new test data combinations |
Similar to the case of the navigational strategies, the test data strategies for independent exploration of the SUT by individual testers or team collaboration are available, and they are marked by the postfix “_TEAM” in the name of the test data strategy.
The test data strategy DATA_NEW_RANDOM_TEAM aims to minimize the particular duplicated test data variants entered by multiple testers either by chance or by an improper work organization during the exploration of new test data variants. Another case is intended for testing defect fixes or regression testing, where DATA_REPEAT_LAST, DATA_REPEAT_RANDOM and DATA_REPEAT_RANDOM_TEAM strategies are available to reduce a tester’s overhead by remembering the last entered test data. The team strategy DATA_REPEAT_RANDOM_TEAM can improve the efficiency of the process by minimizing particular duplicated test data variants entered by multiple testers during regression testing.
The ECs entered by the Test Lead during his pioneering exploration of the SUT prevent the input of test data that belong to one EC, which exercises the same SUT behavior according to the SUT specification.
The possibility of connecting the Tapir framework to a CIT module (DATA_NEW_GENERATED and DATA_NEW_GENERATED_TEAM strategies) makes the process more controlled and systematic. Only the efficient set of test data combinations are used by the testers to exercise the SUT functions.
IV Setup of the Case Studies
To evaluate the proposed framework, compare its efficiency with the manually performed exploratory testing process, and assess the proposed navigational strategies, we conducted three case studies. These case studies primarily focus on the process efficiency of the exploration of new SUT functions, and their objective is to answer the following research questions.
RQ1: In which aspects the efficiency of the exploratory testing process is increased by the Tapir framework when compared with its manual performance? What is this difference?
RQ2: Are there any aspects for which the Tapir framework decreases the efficiency of the exploratory testing process compared with its manual execution?
RQ3: Which of the proposed navigational strategies and ranking functions designed for exploration of new parts of the SUT are the most efficient strategies and functions?
RQ4: How the previous tester’s experience influences defects found in the exploratory testing process supported by the Tapir framework when compared with its manual performance?
Details of the case studies are presented in the following subsections.
IV-A Tapir Architecture and Implementation
As mentioned in Section II-A, the Tapir framework consists of three principal parts: Tapir Browser Extension, Tapir HQ component, and Tapir Analytics module. A tester interacts with the SUT in a browser window with an installed extension. In the second window, the tester interacts with a Tapir HQ front-end application, which serves as a test management tool. Here, suggestions for the navigational test cases are presented to the tester. The Analytics module can be accessed by the testers, Test Leads, and administrator as a separate application and enables the visualization of the state of the SUT model.
In this section, we provide additional implementation details of the functionality of these framework modules.
The Tapir Browser Extension The Tapir Browser Extension is implemented as a web browser plugin. The extension analyzes the current page, intercepts the internal browser events (e.g., page was loaded or redirected, user navigated back, or authentication is required), and it registers event handlers for all links and buttons on the page. All events relevant to the Tapir framework functionality are intercepted and tracked. The browser extension has a functionality to highlight SUT page elements in a mode selected by the Test Lead (elements already analyzed by the Tapir framework or elements suggested for exploration in the tester’s next step). Currently, the browser extension is developed for the Chrome browser to cover the highest market share. The extension is implemented in JavaScript. Currently, we are working on a Firefox version of the browser extension, which can be simplified by browser extension portability 111https://developer.mozilla.org/en-US/Add-ons/WebExtensions/ Porting_a_Google_Chrome_extension.
The Tapir HQ represents the core of the framework functionality. This module receives the events from the browser extensions, constructs the model, constructs the navigational test cases, and presents them to the tester. Tapir HQ is a client application that is implemented as a JavaScript single page application using the ReactJS framework. The server back-end is implemented in .Net C#. When a tester starts testing the SUT, a socket is opened between the Tapir HQ back-end service and Tapir HQ front-end application in the browser to synchronize the data in real time. For this communication, the SocketIO library is employed. Tapir HQ also contains an open interface to a CIT module to import preferred test data combinations (when test data strategies DATA_NEW_GENERATED and DATA_NEW_GENERATED_TEAM are employed; refer to Table III). The interface is based on uploading CSV files of a defined structure or a defined JSON format. The test data combinations are determined for the input elements connected to the action elements of the particular page. For the action element , the inputs to the CIT module are and for each . The output from the CIT module is a set of test data combinations. The data combination is a set of values to be entered in . The test data combinations are stored in a pipeline and suggested to the testers to be entered in during the tests. In cases in which is not defined by the Test Lead, a random value from is employed. In this case, the test data combinations are marked by a special flag. For the generation of the test data combinations, PSTG (Particle Swarm Test Generator) algorithm [8] is applied. The process of generating test data combinations can be run by the Test Lead or system administrator for when for . are defined. If previous test data combinations are available, they are overridden by the new set.
To store the SUT model, the MongoDB NoSQL database is employed. The document-oriented NoSQL database was selected because of its efficiency for JSON document processing. Documents can be directly stored in this database. The database with the SUT model is shared by both the Tapir HQ module and Tapir Analytics module. The Tapir HQ back-end service exposes the API to access the database by the individual modules. In the current version of the framework, user authorization is implemented via Google authentication, which is supported by the Chrome browser.
The Tapir Analytics module enables users to visualize the current state of the SUT model. The visualization is in the form of a textual representation or a directed graph and a particular state of SUT exploration. This part is implemented as a module of Tapir HQ that shares the SUT model with the Tapir HQ application. The framework administrator grants access rights to this module. This part is implemented in .Net C#. Visualization of the SUT model is implemented in the ReactJS framework.
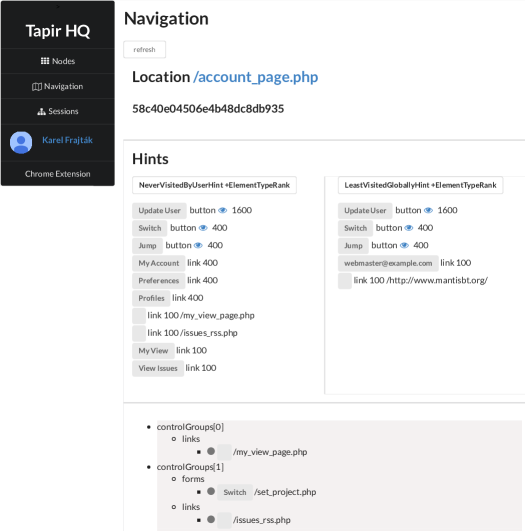
Figure 3 depicts a tester’s navigation support in the SUT via Tapir HQ. The system displays suggested actions to be explored (sorted by ranking functions) by several navigational strategies available to the user. Regarding the format of this article, the view is simplified: test data suggestions and other details are not visible in this sample.
In Figure 4, a corresponding screenshot from the SUT is presented. The Tapir Browser Extension highlights the elements to be explored in the next step and displays the value of the ranking function for these elements.
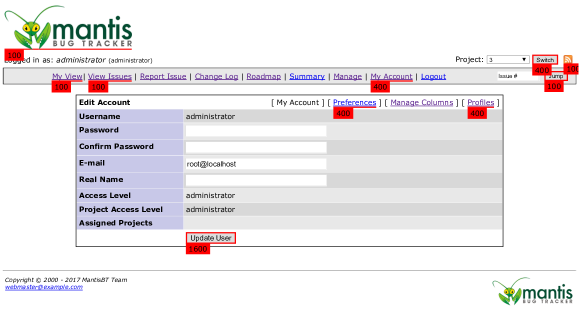
Figure 5 depicts a sample of the Test Lead’s administration of particular SUT page. Prioritization of the SUT pages and elements can be performed in this function.
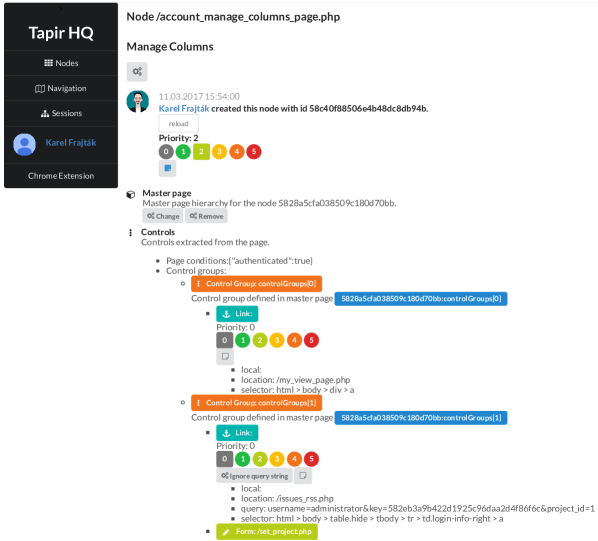
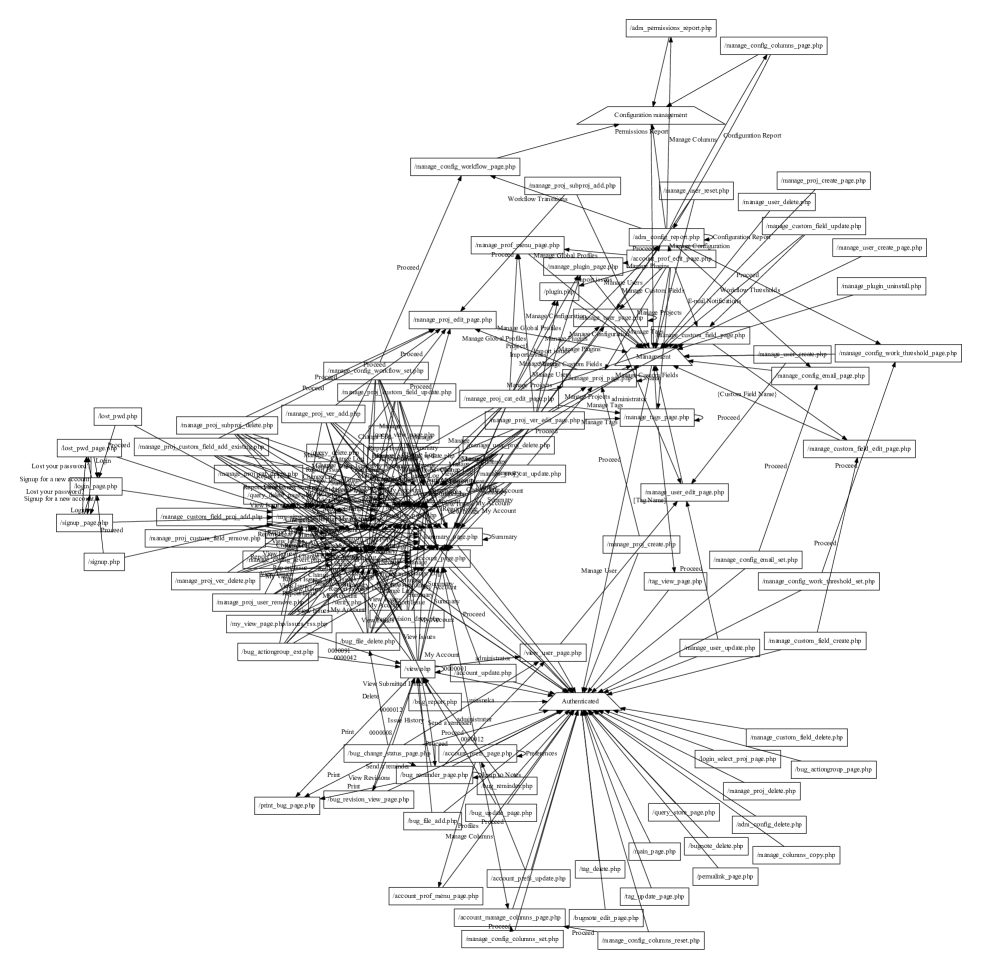
Figure 6 depicts a sample from the Analytics module, which consists of the visualization of SUT pages and possible transitions between the pages. Because the graph is usually extensive, it can be arranged by several layouts to obtain additional user comfort. In the sample, compact visualization is depicted.
IV-B Systems Under Test with Injected Defects
In Case Studies 1 and 2, we employed an open-source MantisBT222https://www.mantisbt.org/ issue tracker as a SUT for the experiments. The MantisBT is written in PHP and uses a relational database. We modified the source code of the SUT by inserting 19 artificial defects. We accompanied the defective code lines by a logging mechanism for reporting each activation of the defective line code. The details of the injected defects are illustrated in Table IV.
| Injected defect ID | Type | SUT function |
|---|---|---|
| synt_1 | Syntax error | Plugin installation function broken |
| synt_2 | Syntax error | Plugin uninstallation function broken |
| synt_3 | Syntax error | Import issues from XML function broken |
| synt_4 | Syntax error | Adding empty set of users to a project causes system defect of the SUT |
| synt_5 | Syntax error | Setting configuration option with empty value causes system defect of the SUT |
| synt_6 | Syntax error | Config option of float type cannot be created |
| synt_7 | Syntax error | Config option with complex type cannot be created |
| mc_1 | Missing code | Export to CSV is not implemented |
| mc_2 | Missing code | The action “set sticky” in search issues screen is not implemented |
| mc_3 | Missing code | Printing of the issue details is not implemented |
| mc_4 | Missing code | User cannot be deleted |
| mc_5 | Missing code | Bug note cannot be deleted |
| cc_1 | Change in condition | Issue configuration option value cannot be set in database |
| cc_2 | Change in condition | Issue configuration option value in not loaded properly from database |
| cc_3 | Change in condition | Tag with the name ”Tapir” (predefined in the SUT) cannot be deleted |
| var_1 | Wrong set of variable | Language in user preferences is always ”English” and cannot be changed |
| var_2 | Wrong set of variable | User defined columns in issue list cannot be copied between projects |
| var_3 | Wrong set of variable | When adding new bug note, its status cannot be ”private” |
| var_4 | Wrong set of variable | Bug note view status cannot be changed |
In Case Study 3, we used the healthcare information system Pluto that was developed in a recent software project333http://www.lekis.cz/Stranky/Reseni.aspx. The Pluto system is employed by hospital departments for a complete supply workflow of pharmaceutical products and medical equipment. The system is one part of a complex hospital information system. The front-end of the Pluto system is created using HTML, CSS and the JavaScript framework Knockout. The back-end of the system is developed in C# and runs on the .NET platform. In this case, we obtained a history of real defects that were detected and fixed in the software from December 2015 to September 2017. As a SUT for the experiments, we used a code baseline of the system from August 2015. We analyzed 118 defects that were reported from December 2015 to September 2017. During the bug fixing and maintenance phase of the SUT, 72 of the defects were found to be caused by the regression as a result of implemented change requests and other bug fixes. During the initial analysis, we excluded these defects; thus, the final number of defects in the experiment was 48.
We obtained information about the presence of the defects in the SUT code. We accompanied the SUT with a .NET Aspect-based logging mechanism to log the flows calls of the SUT methods during the tests. Using this mechanism, we were able to determine and analyze the defects in the code that were activated by the exercised tests. We automated this analysis by a set of scripts that compare the data of the SUT model recorded by the Tapir framework with these defect activation logs.
IV-C Setup of Case Studies
In Case Study 1, we compared the exploratory testing process that was manually performed by individual testers with the exploratory testing process supported by the Tapir framework presented in this paper. The aim of this case study is to answer research questions RQ1 and RQ2. In this case study, we employed the following method.
A group of 54 testers performed exploratory testing in the SUT. The MantisBT issue tracker and inserted artificial defects are employed (refer to Table IV). Each of the testers were allowed to individually act, and they were instructed to perform an exploratory smoke test and explore the maximal extent of the SUT. Exit criteria were left for an individual tester’s consideration.
To evaluate the results of this case study, we applied data that were available in the SUT model created by the Tapir framework during the exploratory testing process (for details, refer to Section V-A). A subjective report by individual testers was not used in the evaluation. The testers were divided into two groups.
-
1.
A group of 23 testers manually performed the exploratory testing process. The activity of these testers was recorded by the Tapir framework tracking extension and Tapir HQ Back-End service. The Tapir HQ Front-End application was not available to this group. Thus, navigational support was not provided to its members.
-
2.
A group of 31 testers disjunctive to the previous group performed the exploratory testing process with support provided by the Tapir framework. This group employed the RANK_NEW navigational strategy. Within this strategy, half of this group is randomly selected to use PageComplexityRank and the other half of the group is selected to use ElementTypeRank. Although DATA_NEW_RANDOM was employed as the test data strategy, the Team Lead did not define any ECs. The testers in this group were explicitly instructed to not use the test data suggestions made by the framework, and their task was to determine which test data to actively enter. The purpose of this task was to equalize the conditions of both groups (the group that manually performs the exploratory testing has no support regarding the test data). No priorities were set for the SUT pages and its elements. The Test Lead did not change any setup during the experiments. The values of the , and constants were set to the default value 256.
The participants were differing in praxis in software testing from 0.5 to 4 years. The participants were randomly distributed in the groups. In this case study, we have not employed the team variants of the provided navigational strategies (RANK_NEW_TEAM). In an objective experiment, equivalent team support must be provided for cases in which exploratory testing is manually performed. We have attempted to perform this initial experiment, and an equivalent simulation of the Tapir framework functionality by a human team leader was difficult to achieve. Thus, we evaluate the team versions of the navigational strategies in Case Study 2.
In Case Study 2, we focused on answering the research question RQ3.With an independent group of testers, we compared the proposed navigational strategies that primarily focused on exploring new SUT functions. In this study, a group of 48 testers performed exploratory testing in the MantisBT issue tracker with inserted artificial defects (refer to Table IV). All testers used the support of the Tapir framework. The testers were instructed to explore the maximal extent of the SUT. This group was split into four subgroups as specified in Table V.
| Group ID | Number of participants | Navigational strategy | Ranking function | Test data strategy |
|---|---|---|---|---|
| 1 | 13 | RANK_NEW_TEAM | ElementTypeRank | DATA_NEW_RANDOM_TEAM |
| 2 | 11 | RANK_NEW | ElementTypeRank | DATA_NEW_RANDOM |
| 3 | 12 | RANK_NEW_TEAM | PageComplexityRank | DATA_NEW_RANDOM_TEAM |
| 4 | 12 | RANK_NEW | PageComplexityRank | DATA_NEW_RANDOM |
The participants were differing in praxis in software testing from 0.5 to 4 years. The participants were randomly distributed in the groups. In this case study, ECs were not defined by the Team Lead. In addition, the testers in this group were explicitly instructed to ignore the test data suggestions made by the framework, and their task was to determine which test data to actively enter. No priorities were set for the SUT pages and its elements. The Test Lead did not change any of the setup parameters during the experiment. The values of the , and constants were set to the default value 256.
Regarding the strategies that employ prioritization of the page elements and pages (particularly, PRIO_NEW and PRIO_NEW_TEAM), this concept adds extra opportunities to improve the efficiency of the exploratory testing process. A comparable alternative for the proposed navigational strategies is not available at this developmental stage of the Tapir framework. When equivalent prioritization is performed in the manual exploratory testing process, we expect the same increase in testing process efficiency. For these reasons, we have decided to exclude the evaluation of the navigational strategies PRIO_NEW and PRIO_NEW_TEAM from the described case study.
Regarding the test data strategies, each of the individual strategies is practically designed for different use cases (refer to Table III). A comparison can be performed between the strategies designed for an individual tester’s guidance and the strategies designed for team exploratory testing, e.g., DATA_NEW_RANDOM versus DATA_NEW_RANDOM_TEAM. Because the presented case study primarily focuses on the efficiency of process exploration for the new SUT functions, a comparison of the strategies DATA_NEW_RANDOM and DATA_NEW_RANDOM_TEAM was included in Case Study 2.
In Case Study 3, we compared the exploratory testing process that was manually performed by individual testers with the exploratory testing process supported by the Tapir framework. In this case study, another SUT with real software defects was employed (refer to SectionIV-B). This case study aims to answer research questions RQ1, RQ2 and RQ4. The organization of the experiment is described as follows.
A group of 20 testers performed exploratory testing in the Pluto system, with each tester acting individually. The instructions to perform an exploratory smoke test and explore the maximal extent of the SUT were the same instructions provided in Case Study 1. Exit criteria were left for an individual tester’s consideration.
A group of ten testers performed the manual exploratory testing process, and their activities were recorded by the Tapir framework. Navigational support of the Tapir HQ was not provided to these testers. Another group of ten testers employed the Tapir framework support. RANK_NEW was used as a navigational strategy. In this group, one randomly selected half of the testers used PageComplexityRank, whereas the other half of the testers used ElementTypeRank. Regarding the testing data, we selected the same setup as in Case Study 1 to ensure that the conditions of both groups were as equal as possible. Although DATA_NEW_RANDOM was utilized, ECs were not defined by the Test Lead, and the testers were instructed to define their individual testing data (test data suggestions of the Tapir framework were not employed). Element priorities were not applied, and the values of the , and constants were set to the default value 256. For objectivity reasons, no team variant of a navigational strategy was utilized (this experiment was the subject of Case Study 2). Experience of the testers varied from 0.5 years to 3 years. We mixed both groups to have the average experience of the testers in each of the groups 1.5.
Regarding the experimental groups, we ensured that all participants had received the equivalent initial training regarding the following software testing techniques: (1) principle of exploratory testing, (2) identification of boundary values, (3) equivalence partitioning, (4) testing data combinations to input in the SUT (condition, decision and condition/decision coverage, pairwise testing and basics of constraint interaction testing) and (5) techniques to explore a SUT workflow (process cycle test).
To evaluate the case studies, we used a set of metrics that are based on the SUT model and activated defects in the SUT code. This set of metrics is defined in Table VI.
| Metric definition | Explanation | Unit |
|---|---|---|
| Number of participants | - | |
| pages = | Total number of explored pages, pages can repeat | - |
| u_pages = | Total number of explored unique pages | - |
| r_pages = | Ratio of explored unique pages | % |
| links = | Total number of link elements explored, elements can repeat | - |
| u_links = | Total number of explored unique link elements | - |
| r_links = | Ratio of explored unique link elements | % |
| actions = | Total number of action elements explored, elements can repeat | - |
| u_actions = | Total number of explored unique action elements | - |
| r_actions = | Ratio of explored unique action elements | % |
| time_page = | Average time spent on page | seconds |
| time_u_page = | Average time spent on unique page | seconds |
| time_link = | Average time spent on link element | seconds |
| time_u_link = | Average time spent on unique link element | seconds |
| time_action = | Average time spent on action element | seconds |
| time_u_action = | Average time spent on unique action element | seconds |
| defects | Average activated defects logged, activated defects can repeat | - |
| u_defects | Average unique activated defects logged | - |
| time_defect | Average time to activate one defect, activated defects can repeat | seconds |
| time_u_defect | Average time to activate one unique defect | seconds |
In the definitions, represents the total time spent by exploratory testing activity, and it was averaged for all testers in the group and given in seconds. The average time spent on a page is measured using the Tapir framework logging mechanism. The average time to activate a defect (time_defect) is calculated as the average total time spent by the exploratory testing process divided by the number of activated defects. When a defect is activated, it occurs during the exploratory testing process. Thus, a tester can notice and report this defect.
V Case Study Results
In this section, we present and discuss the results of the performed case studies.
V-A The Results of Case Study 1
Table VII summarizes the comparison between the manual exploratory testing approach and the Tapir framework. The results are based on the data that we were able to automatically collect from the recorded SUT model. In this comparison, the average of the results from the navigational strategy RANK_NEW and ranking functions ElementTypeRank and PageComplexityRank are provided for the Tapir framework. DATA_NEW_RANDOM was utilized as the test data strategy. is presented as a percentage, where represents the value measured in the case of the Tapir framework, and denotes the value measured in the case of the manual approach. In Table VII, we use the metrics previously defined in Table VI. In the statistics, we excluded excessive lengthy steps (tester spent more than 15 minutes on a particular page) caused by leaving the session open and not testing. In the case of the manual exploratory testing, these excluded steps represented 1.19% of the total recorded steps; and in the case of Tapir framework support, this ratio was 0.72%.
| Metric | Manual approach | Tapir framework used | |
|---|---|---|---|
| 23 | 31 | - | |
| pages | 151.8 | 197.9 | 23.3% |
| u_pages | 22.2 | 37.7 | 41.0% |
| r_pages | 14.6% | 19.0% | 23.1% |
| links | 64.7 | 113.2 | 42.9% |
| u_links | 21.4 | 44.0 | 51.3% |
| r_links | 33.1% | 38.9% | 14.8% |
| actions | 24.5 | 59.0 | 58.5% |
| u_actions | 9.6 | 28.3 | 66.2% |
| r_actions | 39.1% | 47.9% | 18.5% |
| time_page | 21.5 | 20.1 | -6.6% |
| time_u_page | 146.7 | 105.7 | -38.7% |
| time_link | 50.4 | 35.2 | -43.2% |
| time_u_link | 152.3 | 90.6 | -68.1% |
| time_action | 133.1 | 67.5 | -97.3% |
| time_u_action | 340.7 | 140.8 | -141.9% |
| defects | 11.1 | 16.6 | 32.8% |
| u_defects | 4.6 | 6.6 | 31.1% |
| time_defect | 292.8 | 240.5 | -21.7% |
| time_u_defect | 713.8 | 601.3 | -18.7% |
To measure the activated defects, we accompanied the defective code lines by a logging mechanism and reported each activation of the defective line code.
Of the 19 inserted artificial defects, three defects, synt_6, synt_7 and mc_2, were not activated by any of the testers in the group supported by the Tapir framework, which yields a 15.8% ratio. In the case of the manually performed exploratory testing, the defect mc_2 was activated by one tester from the group.
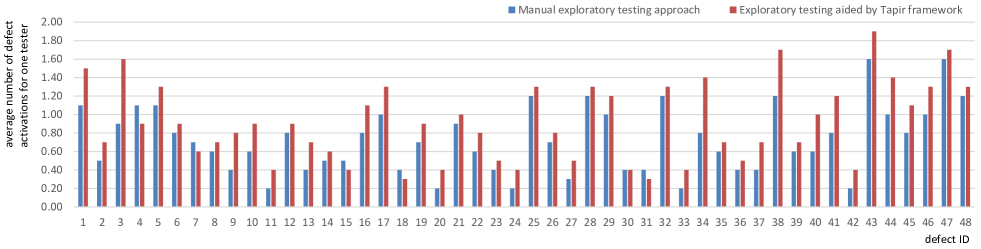
A comparison was performed between the manual exploratory testing approach and the exploratory testing approach supported by the Tapir framework to determine the efficiency of the potential to detect injected artificial defects in the SUT, and it is depicted in Figure 7. For particular injected defects, an average value for the number of times one tester activated the defect is presented. Value 1 indicates that all the testers in the group have activated the defect once. For example, value 0.5 indicates that 50% of the testers in the group have activated the defect once. The injected artificial defects are introduced in Table IV.
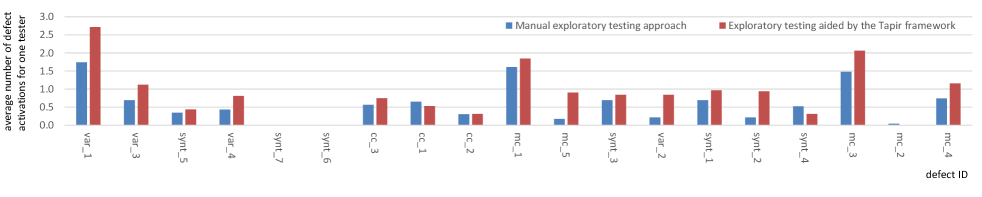
Figure 8 provides details on the average time spent on a SUT page by testers using the manual exploratory testing approach and testers using the Tapir framework support.
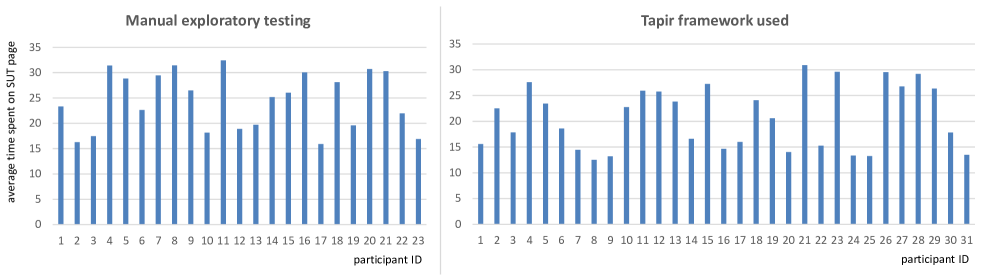
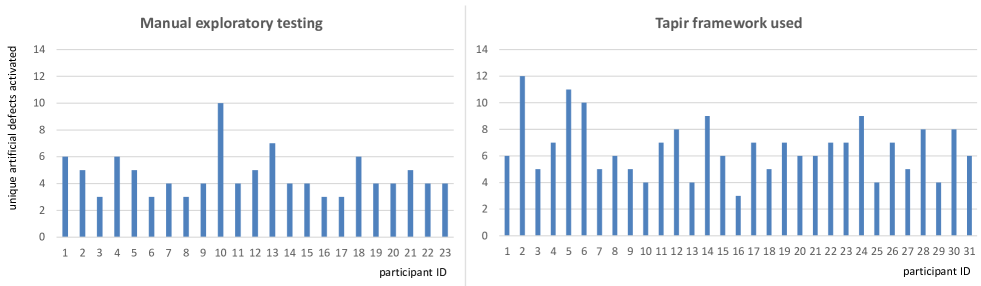
Figure 9 provides details on another comparison of the unique inserted defects that were activated during the activity of individual testers in both groups.
V-B The Results of Case Study 2
Table VIII presents a comparison of different Tapir framework navigational strategies (refer to Table I) based on the data that were automatically collected from the SUT model. In Table VIII, we use the metrics that were previously defined in Table VI. In this case study, we excluded steps longer than 15 minutes and assumed that such length was caused by leaving the session open and not testing.
In Group 1, the excluded steps represented 0.54%, 0.87%, 0.49% and 0.76% of the total recorded steps in Groups 2, 3, and 4, respectively.
| Metric | Group 1 | Group 2 | Group 3 | Group 4 |
|---|---|---|---|---|
| Navigational strategy | RANK_NEW_ TEAM | RANK_NEW | RANK_NEW _TEAM | RANK_NEW |
| Ranking function | ElementTypeRank | ElementTypeRank | PageComplexityRank | PageComplexityRank |
| Test data strategy | DATA_NEW_ RANDOM_TEAM | DATA_NEW_ RANDOM | DATA_NEW_ RANDOM_TEAM | DATA_NEW_ RANDOM |
| 13 | 11 | 12 | 12 | |
| pages | 224.0 | 211.7 | 233.6 | 206.2 |
| u_pages | 47.1 | 39.0 | 51.4 | 42.2 |
| r_pages | 21.0% | 18.4% | 22.0% | 20.5% |
| links | 131.8 | 104.2 | 142.5 | 118.0 |
| u_links | 54.4 | 37.9 | 58.1 | 41.1 |
| r_links | 41.3% | 36.4% | 40.8% | 34.8% |
| actions | 69.3 | 57.5 | 75.1 | 62.7 |
| u_actions | 34.8 | 24.6 | 38.3 | 29.6 |
| r_actions | 50.2% | 42.8% | 51.0% | 47.2% |
| time_page | 17.8 | 19.1 | 19.0 | 21.4 |
| time_u_page | 84.6 | 103.6 | 86.3 | 104.7 |
| time_link | 30.2 | 38.8 | 31.1 | 37.4 |
| time_u_link | 73.2 | 106.6 | 76.3 | 107.5 |
| time_action | 57.5 | 70.3 | 59.0 | 70.4 |
| time_u_action | 114.5 | 164.3 | 115.8 | 149.2 |
| defects | 19.7 | 16.8 | 20.3 | 17.3 |
| u_defects | 8.6 | 6.9 | 9.1 | 7.4 |
| time_defect | 202.2 | 240.6 | 218.4 | 255.3 |
| time_u_defect | 463.3 | 585.8 | 487.2 | 596.9 |
The relative differences between the results of the Case Study 2 groups are presented in Table V-B.
Relative differences between results of Case Study 2 groups Relative difference formula ( stands for a metric from Table VIII) Metric / Comment RANK_NEW vs. RANK_NEW_TEAM for ElementTypeRank RANK_NEW vs. RANK_NEW_TEAM for PageComplexityRank ElementTypeRank vs. PageComplexityRank for RANK_NEW ElementTypeRank vs. PageComplexityRank for RANK_NEW_TEAM pages 5.5% 11.7% 2.6% -4.1% u_pages 17.2% 17.9% -8.2% -8.4% r_pages 12.4% 7.0% -11.1% -4.4% links 20.9% 17.2% -13.2% -7.5% u_links 30.3% 29.3% -8.4% -6.4% r_links 11.9% 14.6% 4.2% 1.2% actions 17.0% 16.5% -9.0% -7.7% u_actions 29.3% 22.7% -20.3% -9.1% r_actions 14.8% 7.4% -10.3% -1.5% time_page -7.4% -12.9% -12.2% -6.3% time_u_page -22.5% -21.3% -1.0% -1.9% time_link -28.3% -20.3% 3.5% -2.8% time_u_link -45.6% -40.8% -0.8% -4.0% time_action -22.3% -19.3% -0.2% -2.6% time_u_action -43.5% -28.9% 9.2% -1.1% defects 14.7% 14.8% -3.0% -3.0% u_defects 19.8% 18.7% -7.2% -5.5% time_defect -19.0% -16.9% -6.1% -7.4% time_u_defect -26.5% -22.5% -1.9% -4.9%
V-C The Results of Case Study 3
Table IX presents a comparison of the manual exploratory testing approach with the Tapir framework for the experiment with the Pluto system. Compared with Case Study 1, the real defects were present in the SUT code in this case study (refer to Section IV-B). In the Tapir framework, the RANK_NEW navigational strategy with ranking functions ElementTypeRank and PageComplexityRank were employed. DATA_NEW_RANDOM was utilized as the test data strategy.
The data collection method was the same as the data collection method in Case Study 1, including the meaning of in Table IX. To evaluate the experiment, the metrics defined in Table VI are employed. In the statistics, we excluded test steps longer than 15 minutes on a particular page. We considered the possibility that the session was opened but testing was not performed. In the case of the manual exploratory testing, these excluded steps represented 1.26% of the total recorded steps, and in the case of Tapir framework support, this ratio was 0.64%.
| Metric | Manual approach | Tapir framework used | |
|---|---|---|---|
| 10 | 10 | - | |
| pages | 98.6 | 122.5 | 19.5% |
| u_pages | 24.3 | 33.1 | 26.6% |
| r_pages | 24.6% | 27.0% | 8.8% |
| links | 39.3 | 61.5 | 36.1% |
| u_links | 16.1 | 26.9 | 40.1% |
| r_links | 41.0% | 43.7% | 6.3% |
| actions | 13.6 | 25.5 | 46.7% |
| u_actions | 8.2 | 17.7 | 53.7% |
| r_actions | 60.3% | 69.4% | 13.1% |
| time_page | 23.9 | 22.3 | -7.4% |
| time_u_page | 97.1 | 82.5 | -17.8% |
| time_link | 60.1 | 44.4 | -35.3% |
| time_u_link | 146.6 | 101.5 | -44.5% |
| time_action | 173.5 | 107.0 | -62.1% |
| time_u_action | 287.8 | 154.2 | -86.6% |
| defects | 34.8 | 44.1 | 21.1% |
| u_defects | 22,2 | 28.7 | 22.6% |
| time_defect | 67,8 | 61.9 | -9.6% |
| time_u_defect | 106.3 | 95.1 | -11.8% |
To measure the activated defects, we logged the flow calls of the SUT method during the tests by the added logging mechanism. Then, we automatically compared these logs with the recorded SUT model to determine which defects were activated during certain test steps. In this case study, all defects were activated by both groups. The average number of defects activated by both groups are depicted in Figure 10.
In this figure, we depict the average number of times one tester activated the defect (e.g., the value 0.5 indicates that 50% of the testers in the group has activated the defect once, and the value 2 indicates that all testers in the group activated the defect twice).
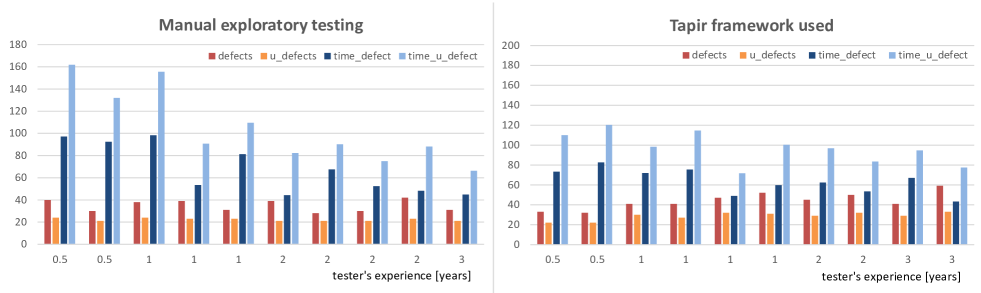
In Figure 11 we present defect activation data related to the experience of the testers. In the graphs, individual groups of columns present the data for individual testers. On the x-axis, the praxis of the tester in years is captured. In the graph, we present defects, u_defects, time_defect and time_u_defect values.
VI Discussion
To evaluate Case Studies 1 and 3, we analyze the data in Table VII and IX. In the case of the MantisBT system, which is the subject of Case Study 1 (Table VII), we note that using the Tapir framework causes the testers to explore larger extents of the SUT compared with the manually performed exploratory testing. This effect can be observed for the total and unique SUT pages (values pages and u_pages), where Tapir support leads the testers to explore 23.3% more pages and 41% additional unique SUT pages. For the total link elements and unique link elements (links and u_links, respectively) and the total and unique action elements of the pages (actions and u_actions, respectively), the differences in the values are even higher.
For the Pluto system, which is the subject of Case Study 3 (Table IX), the Tapir framework support increased the value pages by 19.5% and the value u_pages by 26.6% as measured by the relative difference . The number of the total and unique link and action elements (values links, u_links, actions and u_actions) is higher. This case study confirmed the trend observed in Case Study 1.
However, individual times spent by the exploratory testing process differ; thus, the efficiency of the exploratory testing process aided by the framework must be examined in more detail to analyze the proper relationships of the data. Three key indicators are analyzed: (1) the ratio of repetition of the pages and page elements during the testing process, (2) the extent of the SUT explored per time unit, and (3) the defect detection potential.
VI-A Repetition of the Pages and Page Elements
The ratio of the repetition of the pages and ratio of the repetition of the page elements during the testing process (RQ1, RQ2) indicate the extent of possible unnecessary action in the SUT during the exploratory testing process. In the collected data, we express this metric as the ratio of the unique pages or the elements exercised during the tests. We start analyzing the data of Case Study 1 (MantisBT, Table VII). For the Tapir framework, the ratio of unique pages explored in the exploratory testing process (value r_pages) is improved by 4.4% (23.1% in the relative difference ), the ratio of unique link elements (value r_links) is improved by 5.8% (14.8% in the relative difference ), and the ratio of unique action elements (value r_actions) presents the largest improvement of 8.8% (18.8% in the relative difference ). These improvements are significant; however, a more detailed explanation is needed to discuss the relevance of these metrics.
The data indicate that the ratio of unique pages is relatively low. For example, when exploring the SUT in the manual exploratory testing process, each page was repeated an average of 6.83 times to achieve a new page in the SUT. In the case of the Tapir framework support, this number decreases to 5.25 because the visited pages in the SUT are repeated during the testing process. An interesting point is that the links are frequently repeated during the testing process. For the manually performed exploratory testing, participants exercised each link 3.02 times to explore one new unique link transition. In the case of the Tapir framework support, this ratio decreased to 2.57. When imagining navigation in the SUT and repetition of its particular functions with various test data, this finding is consistent with the total picture. The same case is the repetition of action elements, in which each action has been repeated 2.56 times in the case of the manual exploratory testing process and 2.08 times in the case of Tapir support.
In Case Study 3 (Pluto, Table IX) , we observe a similar trend in which the Tapir framework improved the ratio of unique pages that were explored in the exploratory testing process (value r_pages) by 2.4% (8.8% in the relative difference ) and the ratio of unique action elements (value r_links), the improvement was 2.8% (6.3% in relative difference ) in case of Tapir framework support. In case of action elements (value r_actions) by 9.1% (13.1% in relative difference ).
However, we concluded that the efficiency of the Tapir framework or exploratory testing process cannot be evaluated solely based on the ratio of unique elements because exercising the SUT with additional combinations of test data may decrease these numbers and impact the efficiency of the testing process. The use of additional test data combinations (with the SUT elements repaired additional times during the exploration) can lead to the detection of additional defects. This outcome strongly depends on the testing goals and principal types of defects that we want to detect. If the testing goal is a rapid smoke test of the SUT, the ratio of unique pages or page elements can be a suitable indicator of process efficiency. If the testing goal is to detect additional complex structural defects in the SUT, this metric is not a reliable indicator of the testing efficiency. Thus, other indicators must be analyzed and discussed.
VI-B The Extent of the SUT Explored
The extent of the SUT explored per time unit (RQ1, RQ2) indicates total time efficiency when exercising the SUT with exploratory tests. In Case Study 1 (Mantis BT, Table VII), the average time spent on a page (time_page) improves by 6.6% in the case of Tapir support. This finding can be explained by the Tapir handling overhead connected to the exploratory testing process, including the documentation of the path, decision, and documentation of the test data. Because the SUT pages were frequently repeated, the significance of this result is not major. The detailed data in Figure 8 indicate differences among the individual times spent on a page by the testers. This factor is strongly influenced by an individual tester’s attitude and work efficiency.
For the individual time spent on SUT pages, we need to distinguish two factors that contribute to the total testing time: (1) overhead related to the exploratory testing process, which is decreased by the Tapir framework; and (2) time required to analyze the SUT page and identify and report defects. The second part is equivalent in both the manual exploratory testing and aided exploratory testing. In the first factor, the machine support can reduce the time spent on overhead activities. In the provided data, both parts are mixed (because distinguishing these two parts is nearly impossible when collecting data based on monitoring the events in the SUT user front end).
Because we are interested in exploring the SUT functions available on pages, we analyze the amount of time is needed to explore the SUT action element (value time_action) or link (value time_link). In the case of action elements, the time significantly changes by 97.3% in the case of Tapir support. In the case of links, the difference is also significant (43.2%). The differences are even more striking in the case of unique pages (value time_u_page, difference 38.7% in favor of the Tapir framework), unique action elements (value time_u_action, difference 141.9%), and unique link elements (value time_u_link, difference 68.1%).
In Case Study 3 (Pluto system, Table IX), the Tapir framework improved the time spent on a page (time_page) by 7.4%. However, an analysis of the data related to the link and action elements (functions available on SUT pages) provides more relevant results. With the framework support, the value time_action increased by 62.1% and the value time_link increased by 35.3%. Similar to Case Study 1, this improvement is greater in the case of unique action elements (value time_u_action, difference 86.6%) and unique link elements (value time_u_link, difference 44.5%).
From the presented figures, we can conclude that the Tapir framework leads to a more efficient exploration of the SUT functions in relation to the time spent testing. However, this optimism can diminish when we discuss the possible various goals of the testing process. For a rapid smoke or exploratory lightweight testing of the SUT, when the primary mission statement is to explore the new SUT parts rapidly and efficiently, Tapir can provide promising support. For more thorough testing, the validity of these metrics shall be revised as more thorough tests and more extensive variants of test data are employed. Thus, the results for this part will be analyzed based on the efficiency of the defect detection potential.
VI-C Defect Detection
Defect detection potential (RQ1, RQ2) is an alternative to the defect detection rate. In this metric, we determine whether the artificial defect has been activated in the code (which was ensured by the Tapir framework logging mechanism). When a tester activates a defect, he is capable of subsequently identifying and reporting the defect. In Case Study 1 (Mantis BT, Table VII), we examine the influence of the Tapir framework on the defect detection potential in the case of inserted artificial defects.
In the case of Tapir framework support, testers activated a total of 32.8% more defects when we considered all activated defects, including repeating defects (a tester exercised the same functionality with an inserted defect more frequently) and 31.1% more defects when we only considered unique defects. Of the 19 inserted defects, an average of 4.6 unique defects were detected in the manual execution of exploratory testing, whereas 6.6 unique defects were detected with Tapir support. This amount is approximately one-third of all inserted defects, and this result is attributed to the difficult characteristics of the inserted artificial defects.
The group that uses the Tapir support exercised the SUT longer than the group that does not use the Tapir support; therefore, we are interested in determining the time needed to activate a defect. With Tapir support, the average time to activate a defect (regardless of whether the activated defects repeat) was reduced by 21.7%, whereas for unique defects, the time was reduced by 18.7%.
The statistics by individual inserted defects are presented in Figure 7, and the details on the efficiency of individual participants are provided in Figure 9. We observe differences among individual testers concerning their efficiency. When analyzing the data, we do not observe a direct correlation between time spent on a page and the number of defects that were detected by individual testers in both groups.
One of the defects, mc_2, was activated by one tester from the group that only performed the manual testing and by none of the testers from the group using the Tapir framework support. This situation deserves an analysis. The defect mc_2 can be activated via the issue list form by the following sequence: (1) set a combo box value to determine which operation has to be performed with a selected list of issues to the “set/unset sticky” value, (2) select additional new issues in the list (the defect is only activated for issues in “new” state), and (3) submit the form by the “ok” button. In the combo box that determines whether an operation has to be performed with a selected list of issues, fourteen different operations need to be tested. Thus, the exploration sequence needed to detect the defect that was not directly captured in the SUT model by a link or action element. The sequence was a combination of particular data values entered in the form (input elements) and an action element. Because of the design of the navigational strategies and ranking functions in the current version of the Tapir framework, this defect has “escaped” the exploration path of the testers. Conversely, one of the manual testers has attempted the particular combination needed to activate this defect.
In Case Study 3 (Pluto, Table IX), in which real defects occur in the SUT code, improvements were achieved when the Tapir framework was utilized by the testers in the experimental group. With the framework support, a total of 21.1% additional defects were activated by testers. This value shows the possible repetitive activation of the same defect during the exploratory testing process. When only considering the unique defects, the Tapir framework caused the testers to activate 22.6% additional defects. Because the group that uses the Tapir framework has spent a longer testing time, we analyzed the time needed to activate a defect. The Tapir support improved the average time to activate one defect by 9.6% (time_defect). When we only consider unique defect activation, this improvement is 11.8% (time_u_defect).
In this case study, the defect density was higher; thus, less time is needed to activate one defect (time_defect) and one unique defect (time_u_defect). Improvements gained by the Tapir framework are slightly lower than the improvements gained in Case Study 1; however, improvements have also been achieved in the case of the Pluto system.
VI-D Evaluation of Individual Strategies
In Case Study 2, we compared the efficiency of individual strategies provided by the framework (RQ3). In our analysis of the data, we refer to Table V-B. We start with a comparison of the individual testing strategy RANK_NEW with the team strategy RANK_NEW_TEAM (columns and ). The results differ by ranking function (ElementTypeRank vs. PageComplexityRank); however, general trends are observed in the data. The team navigational strategy RANK_NEW_TEAM increased the ratio of unique explored pages (r_pages) by 12.4% for ElementTypeRank and by 7.0% for PageComplexityRank. In the case of the ratio of unique link elements (r_links), the improvement is 11.9% for ElementTypeRank and 14.6% for PageComplexityRank. A similar trend is observed for unique action elements (r_actions), where the improvement is 14.8% for ElementTypeRank and 7.4% for PageComplexityRank, which is employed as a ranking function.
The statistics related to the time efficiency of the testing process provide more relevant data. The strategy RANK_NEW_TEAM performs well. The average time spent on a unique page (time_u_page) decreased by 22.5% for ElementTypeRank and 21.3% for PageComplexityRank. The average time spent on a unique link element (time_u_link) decreased by 45.6% for ElementTypeRank and 40.8% for PageComplexityRank. The average time spent on a unique action element (time_u_action) decreased by 43.5% for ElementTypeRank and 28.9% for PageComplexityRank. These numbers indicate the favorability of the team strategy.
Regarding the average unique activated defects that were logged, RANK_NEW_TEAM increases the result by 19.8% for ElementTypeRank and 18.7% for PageComplexityRank. The average time to detect one unique defect decreases by 26.5% in the case of ElementTypeRank and by 22.5% in the case of PageComplexityRank. These results correspond to the explored extent of the SUT functions, which is higher in the case of the RANK_NEW_TEAM navigational strategy.
From these relative differences, ElementTypeRank performs better; and in the case of the team version of the navigational strategy, greater improvements are observed. This conclusion is not accurate; thus, to assess the efficiency of ElementTypeRank and PageComplexityRank, we need to independently analyze the data.
PageComplexityRank leads to the exploration of a slightly larger extent of the SUT (Table V-B). The ratio of unique pages explored is 11.1% higher for the RANK_NEW navigational strategy and 4.4% higher for the RANK_NEW_TEAM navigational strategy. The ratio of unique forms explored is 10.3% higher for the RANK_NEW navigational strategy.
Regarding the average times spent on a SUT page, link and action elements, the only significant difference is the average time spent on a page (time_page), which is improved by 12.2% for the ElementTypeRank in the case of the RANK_NEW navigational strategy and by 6.3% in the case of RANK_NEW_TEAM navigational strategy. PageComplexityRank leads to the exploration of more complex pages, which requires additional processing time and more time spent on an SUT page. Because the more complex pages usually aggregate more unexplored links and action elements, the extent of the explored SUT parts is higher than the case of ElementTypeRank as previously discussed.
PageComplexityRank enables the exploration of more action elements than ElementTypeRank (Table VIII, value u_actions) because of the combination of the navigational strategy algorithm with the PageComplexityRank ranking function. The Tapir framework mechanism scans the following pages and prefers the more complex pages (usually containing more action elements to explore). Note that in page the ranking function ElementTypeRank is calculated for both link elements and action elements , whereas the PageComplexityRank is only calculated for link elements (refer to Tables I and II).
PageComplexityRank also slightly increased the average number of logged unique activated defects by 7.2% for the RANK_NEW strategy and 5.5% for the RANK_NEW_TEAM strategy. The difference in the average time to detect these defects was not significant.
From all analyzed data, the combination of navigational strategy and ranking function RANK_NEW_TEAM with PageComplexityRank presents the most efficient number of activated inserted defects and the extent of the explored SUT. However, when considering the time efficiency to explore the new SUT functions, RANK_NEW_TEAM with ElementTypeRank seems to be a better candidate.
VI-E Influence of Testers Experience
The last issue to discuss is the relation between the experience of the testers and the activated defects (RQ4). As the total testing time differed for individual testers, no clear trend can be observed from defects and u_defects values in Figure 11. However, when we analyze average time to activate a defect (time_defect) and average time to activate unique defect (time_u_defect), both of there values decrease with tester’s experience in case of manual exploratory testing. This effect has been observed previously also in a study by Micallef et al. [7]. With the Tapir framework support, we can observe a similar trend, nevertheless, the decrease of time_defect and time_u_defect values is not so significant as in the case of manual testing. This is because, for more junior testers (0.5 up to 1 year of experience), the Tapir framework allowed more efficient exploratory testing and the values time_defect and time_u_defect are lower. For more senior testers (2 up to 3 years of experience), the difference in time_defect and time_u_defect is not significant.
VI-F Summary
To conclude all three case studies, Case Studies 1 and 3 provided data to answer RQ1 and RQ2. Compared with the manual approach, the support of the Tapir framework enables the testers to explore larger extents of the SUT and parts of the SUT that were previously unreached. This finding is also documented by the number of SUT pages explored per time unit, which slightly increases in the case of the SUT pages in favor of the Tapir framework (6.6% for MantisBT, 7.4% for Pluto). However, this difference becomes significant when we consider unique pages (38.7% for MantisBT, 17.8% for Pluto), total links (43.2% for MantisBT, 35.3% for Pluto), unique links (68.1% for MantisBT, 44.5% for Pluto), total action elements (97.3% for MantisBT, 62.1% for Pluto), and unique action elements (141.9% for MantisBT, 86.6% for Pluto). However, these figures only documented the ability of the framework to enable more efficient exploration of new parts of the SUT by the testers, and a relationship to the intensity of testing is not expressed here. More thorough testing involves repetition of the SUT parts. Thus, the reliability of this indicator will be discussed in this case. The measured defect detection potential also indicates the superiority of the Tapir framework. With systematic support (and because the testers were able to explore a larger extent of the SUT), the testers activated 31.1% additional unique inserted defects in MantisBT and 22.6% in the Pluto system. Regarding the time efficiency to detect a defect, in the case of the Tapir framework, this indicator improved by 18.7% for the unique inserted defects for MantisBT and 11.8% for the Pluto system. Case Study 3 differed from Case Study 1 in the defects that were activated during the experiment. Instead of the artificial defects used in Case Study 1, the SUT code, which was the subject of Case Study 3, contained a set of real historical defects. Improvements achieved by the Tapir framework in Case Study 3 were slightly less than the improvements achieved by the Tapir framework in Case Study 1. However, improvements can also be observed in Case Study 3. Regarding RQ2, the analysis of the results did not indicate a decrease in the efficiency of the exploratory testing process supported by the Tapir framework.
Regarding the RQ2, no indicator documenting an aspect in which efficiency of the exploratory testing process supported by the Tapir framework would decrease was found during the analysis of the results.
Case Study 2 provided data to answer RQ3. Regarding the comparison between the RANK_NEW and RANK_NEW_TEAM navigational strategies, the team navigational strategy performs better in all measured aspects. For the ranking function, the PageComplexityRank ratio of unique explored pages increased by 7.0%, the ratio of unique link elements increased by 14.6%, and the ratio of unique action elements increased by 7.4%. The average time spent on a unique page improved by 21.3%, the average time spent on a unique link improved by 40.8%, and the average time spent on unique action elements improved by 28.9%. The total unique activated defects that were logged improved by 18.7%, and the average time to detect one unique defect improved by 22.5%. Separately analyzed, the ranking function ElementTypeRank in terms of the extent of explored SUT functions and generates a slightly higher number of activated unique defects.
The combination of the navigational strategy RANK_NEW_TEAM with the ranking functions ElementTypeRank and PageComplexityRank does not indicate a preference. RANK_NEW_TEAM with PageComplexityRank performed slightly better regarding the extent of explored SUT and detected defects; conversely, RANK_NEW_TEAM with ElementTypeRank was slightly more time efficient.
Regarding the RQ4, average times needed to activate a defect decreased with tester’s experience in case of manual exploratory testing and slightly in case of Tapir framework support. With the Tapir framework support, these times decreased significantly for junior testers (0.5 up to 1 year of experience). For more senior testers (2 up to 3 years of experience), the improvement in these indicators was not significant.
VII Threats to Validity
During the case study experiments, we attempted to equalize the conditions of the compared groups and compare only comparable alternatives while keeping other conditions fixed for all participant groups. Several concerns were identified regarding the validity of the data, which we discuss in this section.
We previously discussed the relevance of the metrics in Section VI, which was intended to be objective. For each of the key metrics, proper disclaimers and possible limiting conditions are described. In all studies, we employed a defect activation concept instead of a defect detection concept. Defect activation expresses the likelihood that the tester will notice the defect when executed. In Case Studies 1 and 2, the Tapir framework logging mechanism exactly logged the fact that a defect was activated. In Case Study 3, we obtained information about the presence of the defects in the SUT code employed in the experiment. The SUT code was accompanied by the logging mechanism, which recorded the flow calls of the SUT methods during the tests. Then, we performed an automated analysis of the defects that were activated by the exercised tests. This analysis ensured the accuracy of the collected data related to defect activation. In practice, we can expect a lower real defect reporting ratio because certain activated defects will not be noticed and reported by the testers. Because this metric was employed in all comparisons, our opinion is that it can be used for measuring a trend that is alternative to the defect detection ratio (which can be biased by individual flaws in defect reporting by experimental team members). The idle time of a tester can influence the measured times during a session (which is a likely scenario when analyzing measured data; refer to the graph in Figure 8). In the experiments, we did not have a better option for measuring the time spent during the testing process. Initially, we experimented with a subjective tester’s report of time spent by individual testing tasks; however, this method proved to be less reliable than the automated collection of time stamps related to the tester’s actions in the UI, which was employed in the case studies. We attempted to minimize this problem by excluding excessively lengthy steps (tester spent more than 15 minutes on a particular page) caused by leaving the session open and not testing.
We can consider that the influence of these excluded steps is not significant because the ratio of these steps was lower than 1.26% for the manual exploratory testing for all case studies and lower than 0.87% for the exploratory testing supported by the Tapir framework for all case studies.
In Case Study 1, the group that uses the Tapir framework was larger (31 versus 23 in the group that performed exploratory testing without support). The size of the group was sufficiently large to mitigate this risk, and all testers acted individually. Thus, team synergy did not have a role in this case study, and all analyzed data were averages for a particular group.
Previous experience in exploratory testing of the experiment participants and the natural ability of individuals to efficiently perform this type of testing can differ among the participants. In the experimental group, none of the testers were expertly specialized in exploratory testing, which could favor one of the groups. Participants of Case Studies 1 and 2 were randomly distributed to the groups, which should mitigate this issue. In the Case study 3, we distributed the testers to both groups to have the average length of praxis in both groups equal 1.5.
Regarding the size of the SUTs (Mantis BT tracker and Pluto), their workflows and screen-flow model are sufficiently extensive to draw conclusions regarding all defined research questions. The employed version of MantisBT consists of 202964 lines of code, 938 application files and 31 underlying database tables. The utilized version of the Pluto system consists of 56450 lines of code, 427 application files and 41 underlying database tables.
VIII Related Work
In this section, we analyze three principal areas relevant to the presented approach: (1) engineering of the SUT model, (2) generation of tests from the SUT model and (3) exploratory testing technique. The first two areas are usually closely connected in the MBT approach. However, in the Tapir framework, we reengineer the SUT model based on the SUT via a continuous process, which represents a difference from the standard MBT approach.
Current web applications have specific elements that differentiate them from any other software application, and these specific elements significantly affect the testing of these applications. The contemporary development styles of UI construction are not only HTML based, and the user experience is dynamically enhanced using JavaScript, which increases the difficulty of identifying the HTML elements. The dynamic nature of the UI hinders the correct identification of the UI elements. Crawlers, which are tools that systematically visit all pages of a web application, are often employed to rapidly collect information about the structure, content, and navigation relationships between pages and actions of the web application [10, 11]. Although crawlers can rapidly inspect an entire application, the sequence of steps by a crawl may differ from the sequence made by a manual tester. Some parts of the application are not reachable by the crawler. In addition, crawlers can address difficulties when user authorization is required in the SUT.
Several solutions for reengineering the SUT model from the actual SUT were discussed in the literature. As an example, we refer to Guitar [12], in which web applications are crawled and a state machine model is created based on the SUT user interface. A mobile application version of this crawler, MobiGuitar, has been developed [13]. As an alternative notation to these state machine models, the Page Flow Graph can be constructed from the actual web-based SUT [14]. The graph captures the relationship among the web pages of the application, and the test cases are generated by traversing this graph (all sequences of web pages). The PFG is converted into a syntax model, which consists of rules, and test cases are generated from this model. The construction of the PFG is not described in this paper. An extra step is required to convert the PFG to a syntax model to generate subsequent tests.
Common elements, including UI patterns, are utilized when developers create the UI of the applications. Examples of this pattern are Login, Find, and Search. Users with some level of experience know how to use the UI or how it should be used. As described by Nabuco et al. [15], generic test strategies can be defined to test these patterns. Pattern-based model testing uses the domain specific language PARADIGM to build the UI test models based on UI patterns and PARADIGM-based tools to build the test models and generate and execute the tests. To avoid the test case explosion, the test cases are filtered based on a specific configuration or are randomly filtered. An alternative approach is iMPAcT [16, 17], which analyzes UI patterns in mobile applications. These patterns can be employed in SUT model reengineering.
Numerous approaches can be employed to generate the tests from the SUT model. Extensive usage of UML as the design modeling language implies its use for the MBT techniques. A survey to improve the understanding of UML-based testing techniques was conducted by Shirole et al. [18], who who focused on the usage of behavioral specifications diagrams, e.g., sequence, collaboration, and state-chart and activity diagrams [19]. The research approaches were classified by the formal specifications, graph theory, heuristics of the testing process, and direct UML specification processing [18]. Use-case models may represent another source for creating functional test cases as explored by [20]. In addition to UML, other modeling languages, such as SysML [21] or IFML [22], mainstream programming languages, finite machine notations, and mathematical formalisms, such as coq [23], are utilized. The SUT user interface is subject to the model-based generation of test cases, and integration testing is also under investigation [24].
Open2Test test scripts are automatically generated from software design documents [25]. These documents are artifacts of the design process. A design document, design model and test model for the integration testing tool TesMa [26] are extended with information on the structure of the web page (identification of the HTML elements). When the software specification is changed, the latest scripts are regenerated from recent test design documents. This approach reduces the cost of the maintenance of the test scripts. However, the design documents must be extended with the detailed information before the test generation process can start.
The code-based API testing tool Randoop444https://randoop.github.io/randoop generates random sequences of method calls for a tested class. These sequences are stored as JUnit test cases. Klammer et al. [27] have harnessed this tool to generate numerous random interaction test sequences. The tool cannot interact with the UI of a tested application; therefore, a reusable set of adapters that transforms the API calls into UI events was created. The adapters also set up and tear down the runtime environment and provide access to the internal state of the SUT. Fraser et al. [28] have evaluated a test case generation tools called EvoSuite on a number of Java projects (open source, industrial and automatically generated projects). The large empirical study presented in the paper shows that EvoSuite can achieve high test coverage but not on all types of classes (for example the file system I/O classes). The interaction with the SUT can be recorded using a capture & replay tool, or the source code is analyzed to create a call graph, analyzes the event sequences and later generate the test cases [29]. The event sequences describe the executable actions that can be performed by the user when employing an application (an Android application, in this case). The actions are converted to JUnit tests classes that are executed in Robotium, which is a test automation framework.
The manual version of the exploratory testing technique has been investigated by several studies, e.g., [3, 4, 7]. The influence of a tester’s experience on the efficiency of the testing process has been examined [7]. During this experiment, more experienced testers detect more defects in the SUT. Teamwork organization in exploratory testing as a potential method to improve its efficiency was also explored [5]. In this proposal, team sessions are used to organize the work of the testers. The Tapir framework also employs the idea of teamwork, although none of the team sessions are organized. However, the framework collects information about explored parts of the SUT and test data and uses this information to prevent the duplication of tests within a defined team of testers.
Conceptually, combinations of exploratory testing and MBT can be traced in the related literature; however, the main use case of these concepts differs from the proposed Tapir framework. For instance, recordings of performed tests are used to detect possible inconsistent parts of the SUT design model [30].
In our approach, we use the web application model that was created via adopting, modifying, and extending the model by Deutsch et al. [9]. During our study, the model underwent significant changes, which we explained in Section II-B. From the related study, the model conceptually resembles the IFML standard. In our previous study, we explored the possibility of using IFML as an underlying model [22]. Specifics of the presented case enable us to retain the model as defined in this paper.
IX Conclusion
To conduct the exploratory testing process in a resource-efficient manner, the explored path in the SUT shall be recorded. The entered test data is remembered to fix defects or perform the regression testing process, and work is distributed to individual testers in a controlled and organized manner to prevent duplicate and inefficient tests. This step can be manually performed; however, this process usually requires the intensive and permanent attention of a Test Lead. A considerable amount of time is spent on administrative tasks related to recording the explored parts of the SUT and other details of tests. A strong need to communicate the progress of the team of testers and operationally re-plan the work assignments could render the exploratory testing technique more challenging for distributed work teams.
For the more extensive SUT, this organization of work can become difficult. To visualize the current state of the exploratory testing, a shared dashboard, which is either an electronic dashboard or a physical dashboard located in an office space, where the exploratory testers are located, can be utilized. In the case of a more extensive SUT, capturing the state of testing on a physical dashboard can become problematic, and the maintenance of data in an electronic dashboard may become a tricky task. To remember the previously employed test data, shared online tables can be utilized. However, accessing these tables and maintaining their content can generate particular overhead for the testers during the exploratory testing process. Thus, the efficiency gained by a systematic approach to the test data can be decreased by this overhead.
The proposed Tapir framework aims to automate the administrative overhead caused by the necessity to document the path in the SUT, test data, and related information. The framework serves to distribute the work in the team of exploratory testers by automated navigation based on several navigational and test data strategies. These strategies are designed to explore new SUT functions that were previously revealed by testing, retesting after SUT defect fixes and testing regressions. To prevent duplicate tests and duplicate test data (which is one of the risks of the manual exploratory testing process), team versions of the navigational strategies were designed.
To assess the efficiency of the proposed framework, we conducted three case studies. In these case studies, we used two systems under testing. The first system was an open-source MantisBT issue tracker with 19 inserted artificial defects, and it was accompanied by a logging mechanism to record the activation of the defects during the exploratory testing process. The second SUT was the Pluto system developed via a commercial software industrial project with 48 real software defects. The SUT code was accompanied by a logging mechanism that records the flow calls of the SUT methods during the tests. This mechanism enabled the automation of exact analyses to determine the defects that were activated during the tests.
A comparison of the same process performed by the manual exploratory testing and the exploratory testing supported by the Tapir framework focuses on the individual exploration of the SUT by particular testers, and several significant results were obtained. The exploratory testing supported by the Tapir framework enabled the testers to explore more SUT functions and to explore components of the SUT that were previously unreached. This effect was also confirmed by the measured number of SUT pages explored per time unit, which improved by 6.6% for MantisBT and by 7.4% for the Pluto system in the case of the Tapir framework. In the case of other elements, this metric significantly improved. In the case of MantisBT, the improvement was 38.7% for unique pages, 43.2% for total links, 68.1% for unique links, 97.3% for total action elements and 141.9% for unique action elements. In the case of the Pluto system, the improvement was 17.8% for unique pages, 35.3% for total links, 44.5% for unique links, 62.1% for total action elements and 86.6% for unique action elements.
However, these metrics document the capability of the framework to enable testers to efficiently explore new parts of the SUT, and they are the most relevant in the case of rapid lightweight exploratory testing, in which a tester’s goal is to efficiently explore new SUT functions and as many previously unexplored functions as possible. In the case of more thorough testing, the relevance of these metrics will be revised. In principle, SUT pages and elements would repeat the tests when exercised more frequently by more extensive input test data combinations. With the support of the Tapir framework, testers performing exploratory tests of MantisBT were able to reach and activate 31.1% more unique inserted artificial defects, and the time needed to activate one unique defect improved by 18.7%. In the experiment with the Pluto system, 22.6% additional unique real defects were activated. Regarding the time needed to activate one unique defect, the improvement was lower relative to MantisBT at 11.8% but still significant.
A comparison of navigational strategies and ranking functions clearly documented that team-based navigational strategies are more efficient than individual navigational strategies. For the PageComplexityRank ranking function employed in the comparison of the strategies, the ratio of unique explored pages increased by 7.0% for the team navigational strategy. In addition, the ratio of unique link elements increased by 14.6%, the ratio of unique action elements increased by 7.4%, the average time spent on a unique page improved by 21.3%, the average time spent on a unique link improved by 40.8%, the average time spent on unique action elements improved by 28.9%, the total unique activated defects that were logged improved by 18.7%, and the average time to detect one unique defect improved by 22.5%.
Regarding the ranking functions, PageComplexityRank performed slightly better than ElementTypeRank in several aspects. We are currently conducting additional experiments to obtain an optimal ranking function. The concept of the Tapir framework enables this function to be flexibly configured by setting the calibration constants (refer to II). In our opinion, the structure of the SUT pages and the complexity of its workflows have a role in determining the optimal ranking function for a specific case.
Average times needed to activate a defect decreased with tester’s experience. This trend was obvious in case of manual exploratory testing and also present, however, less significantly, in case of Tapir framework support. The Tapir framework support decreased times needed to activate a defect significantly for testers having 0.5 up to 1 year of experience. For more senior testers, having 2 up to 3 years of experience, no clear improvement trend was observed.
The results of the manual exploratory testing process can be influenced by the Test Lead. Even for a manual process, a systematic approach can be efficient. Providing systematic guidance to the testers (including proper documentation of the explored SUT parts) is a challenging task because this activity has to be continuously performed during the testing process. Thus, the proposed Tapir framework can provide efficient support in eliminating the administrative overhead and enabling the Test Lead to focus on the analyzing the state, performing strategic decisions during the testing process and motivating the testing team. The effect of this support would be even stronger in the case of extensive SUTs and exploratory software testing in business domains, with which the testers do not have familiarity. The results from the presented case studies documented the viability of the proposed concept and motivate us to evolve the framework.
Acknowledgments
This research is conducted as part of the project TACR TH02010296 Quality Assurance System for Internet of Things Technology. The research is supported by the internal grant of CTU in Prague, SGS17/097/OHK3/1T/13.
References
- [1] C. Ebert and S. Counsell, “Toward software technology 2050,” IEEE Software, vol. 34, no. 4, pp. 82–88, 2017.
- [2] M. Lindvall, D. Ganesan, S. Bjorgvinsson, K. Jonsson, H. S. Logason, F. Dietrich, and R. E. Wiegand, “Agile metamorphic model-based testing,” in Proceedings of the 1st International Workshop on Metamorphic Testing, ser. MET ’16. New York, USA: ACM, 2016, pp. 26–32.
- [3] D. Pfahl, H. Yin, M. V. Mäntylä, and J. Münch, “How is exploratory testing used? a state-of-the-practice survey,” in Proceedings of the 8th ACM/IEEE International Symposium on Empirical Software Engineering and Measurement. ACM, 2014, p. 5.
- [4] C. Ş. Gebizli and H. Sözer, “Impact of education and experience level on the effectiveness of exploratory testing: An industrial case study,” in 2017 IEEE International Conference on Software Testing, Verification and Validation Workshops (ICSTW), March 2017, pp. 23–28.
- [5] P. Raappana, S. Saukkoriipi, I. Tervonen, and M. V. Mäntylä, “The effect of team exploratory testing – experience report from f-secure,” in 2016 IEEE Ninth International Conference on Software Testing, Verification and Validation Workshops (ICSTW), April 2016, pp. 295–304.
- [6] S. M. A. Shah, C. Gencel, U. S. Alvi, and K. Petersen, “Towards a hybrid testing process unifying exploratory testing and scripted testing,” Journal of Software: Evolution and Process, vol. 26, no. 2, pp. 220–250, 2014.
- [7] M. Micallef, C. Porter, and A. Borg, “Do exploratory testers need formal training? an investigation using hci techniques,” in 2016 IEEE Ninth International Conference on Software Testing, Verification and Validation Workshops (ICSTW), April 2016, pp. 305–314.
- [8] B. S. Ahmed, K. Z. Zamli, and C. P. Lim, “Application of particle swarm optimization to uniform and variable strength covering array construction,” Applied Soft Computing, vol. 12, no. 4, pp. 1330–1347, 2012.
- [9] A. Deutsch, L. Sui, and V. Vianu, “Specification and verification of data-driven web applications,” Journal of Computer and System Sciences, vol. 73, no. 3, pp. 442–474, 2007.
- [10] H. Tanida, M. R. Prasad, S. P. Rajan, and M. Fujita, Automated System Testing of Dynamic Web Applications. Berlin, Heidelberg: Springer, 2013, pp. 181–196.
- [11] V. Dallmeier, M. Burger, T. Orth, and A. Zeller, WebMate: Generating Test Cases for Web 2.0. Berlin, Heidelberg: Springer Berlin Heidelberg, 2013, pp. 55–69.
- [12] B. N. Nguyen, B. Robbins, I. Banerjee, and A. Memon, “Guitar: an innovative tool for automated testing of gui-driven software,” Automated Software Engineering, vol. 21, no. 1, pp. 65–105, Mar 2014.
- [13] D. Amalfitano, A. R. Fasolino, P. Tramontana, B. D. Ta, and A. M. Memon, “Mobiguitar: Automated model-based testing of mobile apps,” Software, IEEE, vol. 32, no. 5, pp. 53–59, 2015.
- [14] J. Polpong and S. Kansomkeat, “Syntax-based test case generation for web application,” in 2015 International Conference on Computer, Communications, and Control Technology (I4CT), April 2015, pp. 389–393.
- [15] M. Nabuco and A. C. Paiva, “Model-based test case generation for web applications,” in Proceedings of the 14th International Conference on Computational Science and Its Applications ICCSA 2014 - Volume 8584. New York, NY, USA: Springer-Verlag, 2014, pp. 248–262.
- [16] I. C. Morgado and A. C. R. Paiva, “The impact tool: Testing ui patterns on mobile applications,” in 2015 30th IEEE/ACM International Conference on Automated Software Engineering (ASE), Nov 2015, pp. 876–881.
- [17] I. C. Morgado and A. C. R. paiva, “Testing approach for mobile applications through reverse engineering of ui patterns,” in 2015 30th IEEE/ACM International Conference on Automated Software Engineering Workshop (ASEW), Nov 2015, pp. 42–49.
- [18] M. Shirole and R. Kumar, “Uml behavioral model based test case generation: A survey,” SIGSOFT Softw. Eng. Notes, vol. 38, no. 4, pp. 1–13, Jul. 2013.
- [19] A. K. Jena, S. K. Swain, and D. P. Mohapatra, “A novel approach for test case generation from uml activity diagram,” in 2014 International Conference on Issues and Challenges in Intelligent Computing Techniques (ICICT), Feb 2014, pp. 621–629.
- [20] R. Lipka, T. Potuzak, P. Brada, P. Hnetynka, and J. Vinarek, “A method for semi-automated generation of test scenarios based on use cases,” in Software Engineering and Advanced Applications (SEAA), 2015 41st Euromicro Conference on. IEEE, 2015, pp. 241–244.
- [21] C. H. Chang, C. W. Lu, W. P. Yang, C. Chu, C. T. Yang, C. T. Tsai, and P. A. Hsiung, “A sysml based requirement modeling automatic transformation approach,” in 2014 IEEE 38th International Computer Software and Applications Conference Workshops, July 2014, pp. 474–479.
- [22] K. Frajtak, M. Bures, and I. Jelinek, “Transformation of ifml schemas to automated tests,” in Proceedings of the 2015 Conference on Research in Adaptive and Convergent Systems, ser. RACS. New York, USA: ACM, 2015, pp. 509–511.
- [23] Z. Paraskevopoulou, C. Hritcu, M. Denes, L. Lampropoulos, and B. C. Pierce, Foundational Property-Based Testing. Cham: Springer International Publishing, 2015, pp. 325–343.
- [24] T. Potuzak and R. Lipka, “Interface-based semi-automated generation of scenarios for simulation testing of software components,” in SIMUL. IARIA, 2014, pp. 35–42.
- [25] H. Tanno and X. Zhang, “Test script generation based on design documents for web application testing,” in 2015 IEEE 39th Annual Computer Software and Applications Conference, vol. 3, July 2015, pp. 672–673.
- [26] H. Tanno, X. Zhang, T. Hoshino, and K. Sen, “Tesma and catg: Automated test generation tools for models of enterprise applications,” in Proceedings of the 37th International Conference on Software Engineering - Volume 2, ser. ICSE ’15. Piscataway, NJ, USA: IEEE Press, 2015, pp. 717–720.
- [27] C. Klammer, R. Ramler, and H. Stummer, “Harnessing automated test case generators for gui testing in industry,” in 2016 42th Euromicro Conference on Software Engineering and Advanced Applications (SEAA), Aug 2016, pp. 227–234.
- [28] G. Fraser and A. Arcuri, “A large-scale evaluation of automated unit test generation using evosuite,” ACM Trans. Softw. Eng. Methodol., vol. 24, no. 2, pp. 8:1–8:42, Dec. 2014.
- [29] J. L. San Miguel and S. Takada, “Gui and usage model-based test case generation for android applications with change analysis,” in Proceedings of the 1st International Workshop on Mobile Development, ser. Mobile! 2016. New York, USA: ACM, 2016, pp. 43–44.
- [30] C. Ş. Gebizli and H. Sözer, “Improving models for model-based testing based on exploratory testing,” in 2014 IEEE 38th International Computer Software and Applications Conference Workshops, July 2014, pp. 656–661.