Radiative transfer calculations of the diffuse ionised gas in disc galaxies with cosmic ray feedback.
Abstract
The large vertical scale heights of the diffuse ionised gas (DIG) in disc galaxies are challenging to model, as hydrodynamical models including only thermal feedback seem to be unable to support gas at these heights. In this paper, we use a three dimensional Monte Carlo radiation transfer code to post-process disc simulations of the Simulating the Life-Cycle of Molecular Clouds (SILCC) project that include feedback by cosmic rays. We show that the more extended discs in simulations including cosmic ray feedback naturally lead to larger scale heights for the DIG which are more in line with observed scale heights. We also show that including a fiducial cosmic ray heating term in our model can help to increase the temperature as a function of disc scale height, but fails to reproduce observed DIG nitrogen and sulphur forbidden line intensities. We show that, to reproduce these line emissions, we require a heating mechanism that affects gas over a larger density range than is achieved by cosmic ray heating, which can be achieved by fine tuning the total luminosity of ionising sources to get an apropriate ionising spectrum as a function of scale height. This result sheds a new light on the relation between forbidden line emissions and temperature profiles for realistic DIG gas distributions.
keywords:
methods: numerical – radiative transfer – galaxies: ISM – galaxies: structure – cosmic rays1 Introduction
Observations of the extended ISM in the Milky Way and other galaxies have shown the existence of a diffuse ionised component of the ISM with scale heights of more than a kpc above the star forming disc (Haffner et al., 2009). Due to its temperatures of , this component is usually referred to as the warm ionised medium (WIM). The optical emission line ratios and inferred temperature () of the gas imply that it is photoionised, so that it is also referred to as the diffuse ionised gas (DIG). The most obvious possible source of ionising radiation is the O and B stars in the galactic disc itself (Reynolds, 1990). Previous studies have shown that this radiation is sufficient to ionise the DIG at high altitudes, provided that the gas density distribution is not smooth (Wood et al., 2005, 2010; Barnes et al., 2014). A fractal or lognormal density distribution is implied by observations and arises naturally from turbulence in the DIG (Elmegreen, 1997; Hill et al., 2008; Berkhuijsen & Fletcher, 2008). The importance of photoionisation indicates that the gas is heated by UV radiation.
To reproduce the observed scale height of the DIG in 3D models of the galactic disc, a detailed model of the structure of the disc is needed. Barnes et al. (2014) used the models of Hill et al. (2012), which include thermal stellar feedback in a full magnetohydrodynamical (MHD) treatment of the ISM, and showed that they fail to reproduce the required densities at high altitude that could explain the observed scale height of the DIG. Furthermore, they also show the need for an additional source of heating that would explain the observed intensities of the [Nii] Å and [Sii] Å forbidden lines as a function of the H intensity. These results indicate that a simple model including only thermal supernova feedback is unable to support an extended DIG and unable to heat the gas to high enough temperatures. This means we either need a more complete model of stellar feedback that also includes radiative feedback and stellar winds that can change the structure of the ISM (Gatto et al., 2017; Peters et al., 2017), an additional from of heating that affects gas at low densities (Reynolds, Haffner & Tufte, 1999), or both.
To address these issues, we repeat the analysis of Barnes et al. (2014) for a new sample of MHD simulations that include cosmic ray feedback (Girichidis et al., 2016b). Unlike thermal feedback, cosmic ray feedback does not couple directly to the local gas but can diffuse to higher altitudes through the magnetic field. This means it can heat the gas more efficiently and support a thicker disc. It also provides a non local heating term that could provide the additional heating needed to explain observed line ratios.
The structure of this paper is as follows. In Section 2, we summarize the new ionisation code we used, and give some more details about the simulation models. We then show that our models are converged (Section 3.1), and illustrate the effect of changing various model parameters (Section 3.2). We then move on to a full description of the time evolution of the models (Section 3.3), and of the emission line maps that we produce (Section 3.4). We end with our conclusions.
2 Method
2.1 Code
We use the new Monte Carlo radiative transfer code CMacIonize (Vandenbroucke & Wood, 2017) 111https://github.com/bwvdnbro/CMacIonize, which is essentially a rewritten version of the ionisation code of Wood, Mathis & Ercolano (2004). The code employs a basic model whereby ionising radiation from one or more sources is propagated through a discrete density grid, and only absorption and re-emission by hydrogen and helium are taken into account. As Wood et al. (2010) showed, the effect of dust absorption is minimal and can hence be neglected. The ionising part of the source spectrum is sampled using a number of discrete photon packets, which are emitted isotropically from the source location(s). Each photon packet is then followed while it traverses the simulation volume, until a randomly sampled optical depth is reached. At this point, the photon packet is absorbed, and is re-emitted at a randomly sampled frequency. We do not adopt the so called on the spot approximation, whereby re-emitted photons are absorbed locally, and instead treat re-emitted photons in the same way as source photons. Photon packets whose frequency drops below the ionisation treshold, or that leave the simulation box without scattering (through a non periodic boundary), are removed from the system.
For each cell in the simulation volume, we keep track of the path lengths traversed by photon packets that pass through it. After a sufficient number of photon packets has been evolved in this way, the path length counters in each cell can be used to obtain a good approximation of the mean ionising intensities in that cell. We then use these values to calculate the local ionisation equilibrium. This will likely change the properties of the cell, so that we need to repeat the whole process until convergence is reached.
As the ionisation equilibrium also depends on the temperature, we also need to keep track of heating and cooling processes that might affect the thermal equilibrium of the ISM. We consider heating caused by direct UV absorption by hydrogen and helium, heating due to indirect, “on the spot” absorption of Hei Ly, and heating caused by absorption by polycyclic aromatic hydrocarbons (PAHs). As an optional extra heating term, we also consider heating by cosmic rays, following Wiener, Zweibel & Oh (2013). Apart from cooling by recombination of ionised hydrogen and helium, and cooling by free-free emission (bremsstrahlung), we also consider a number of metals to obtain cooling rates : C, N, O, Ne, and S. To this end, intensity counters are also stored for different ions of these metals : C+, C++. N0, N+, N++, O0, O+, O++, Ne+, Ne++, S+, S++, and S+++.
Since the full combined ionisation and temperature algorithm is more computationally expensive than a more approximate approach whereby the temperature is kept fixed, we first explore the available parameter space using a fixed temperature of 8,000 K (which corresponds to the average equilibrium temperature of the observed DIG), and only use the combined algorithm to obtain line intensities for the models with the most realistic parameter values.
In runs that use the full version of the code, we can use the resulting ionisation structure of the various coolants and the equilibrium temperature to compute forbidden line emission (Wood, Mathis & Ercolano, 2004; Vandenbroucke & Wood, 2017). This allows us to produce line emission maps and line ratios that can be directly compared with observations.
2.2 ISM density field
We use simulated density fields from the Simulating the Life-Cycle of Molecular Clouds (SILCC) project (Walch et al., 2015; Girichidis et al., 2016a), more specifically, the three different models described by Girichidis et al. (2016b) : a model with only thermal stellar feedback, a model with only cosmic ray stellar feedback, and a model with both forms of feedback. Thermal stellar feedback consists of adding of energy to the gas surrounding a supernova event. This happens either as pure energy injection in regions where the Sedov-Taylor expansion of the supernova is resolved, or as a momentum injection in regions were it is not resolved. Cosmic ray feedback consists of adding of energy to the cosmic ray energy equation. This equation is evolved as an extra separate equation during the magnetohydrodynamical integration, and couples to the hydrodynamics as an extra pressure term in the momentum and energy equations. The cosmic ray energy equation assumes a simplified transport equation based on an isotropic particle distribution function, and neglects the effect of cosmic ray streaming. None of the models we post-process includes a prescription for photoionisation feedback.
The simulations themselves were run in a box of , with periodic and boundaries, and using an adaptive mesh with a resolution of ( cells) in the high resolution region. The three simulations respectively cover an evolution over , , and . In this work, we mainly focus on the results after of evolution, although we will also briefly discuss the time evolution of the ionisation structure. It is worth noting that the Girichidis et al. (2016b) simulations do not include a self-consistent modeling of star formation using sink particles, nor early stellar feedback from radiation or stellar winds, like e.g. Peters et al. (2017).
To perform the post-processing with our radiative transfer code, we resample the density grids on a Cartesian grid of cells, in a box with dimensions , and with the same periodic boundaries as the simulations themselves. Extending the box vertically to larger sizes does not change our results, since the density at large vertical heights drops to negligible values. The adopted number of cells was found to provide an optimal trade-off between accuracy and computational efficiency. We tested the convergence of our results using a simulation with a higher resolution, which oversamples the original SILCC data. The average vertical column density of the gas within our box is () for all three models at , consistent with the average Hi column density in the Milky Way (Dickey & Lockman, 1990), and in line with the column densities found close to Milky Way spiral arms (Nakanishi & Sofue, 2003).
2.3 Ionising sources
The ionising sources are luminous O and B stars. Garmany, Conti & Chiosi (1982) found an average stellar surface density of 24 kpc-2 for O stars in the solar neighbourhood, so we randomly sample 96 sources within our box. The and coordinates of the sources are uniformly sampled, while the coordinate is sampled from a normal distribution. The scale height of the stellar disc is a parameter for our models. We use a value of (Maíz-Appellániz, 2001) for most of our models. The typical ionising luminosity of an O star is s-1 (Sternberg, Hoffmann & Pauldrach, 2003), however it is not a priori clear how much of this radiation makes it out of the dense Hii region surrounding the star and into the interstellar medium (Wood et al., 2010). We therefore treat the fraction of the s-1 luminosity that is effectively used to ionise the ISM as a second parameter of our source model.
The spectrum of the ionising sources is based on the stellar models of Pauldrach, Hoffmann & Lennon (2001); we use the data tables compiled by Sternberg, Hoffmann & Pauldrach (2003) to obtain the spectrum of a 40,000 K star with a surface gravity of , on which we linearly interpolate.
The density fields we use contain asymmetries that can potentially propagate into our radiative transfer calculation, especially when our source distribution is sampled randomly and independent of the density field. We address this issue by testing the robustness of our results against a change in the seed for the random generator used to sample our source distribution.
2.4 Simulations
In total, 52 radiative transfer simulations were run for each of the three feedback models: 1 reference model, 10 models to test the convergence of our model, 6 to test the effect of parameter changes in the ionising source model, 10 more advanced models used to calculate emission lines, and 25 models to show the time evolution of the ionised disc. The latter used SILCC snapshots at different times throughout the simulation, while all the other simulations were run using the snapshot at . The different parameters and our adopted naming convention for the first two groups of models are shown in Table 1. Our reference model uses 20 iterations for a cell grid with photon packets, with a source scale height of and a per source luminosity of s-1, and fixed source positions (set by the fixed random seed 42). Note that simulations Ci20g128p7 and Ir42l49s063 both refer to this reference model.
The more advanced models use the same parameters, but with photon packets, to ensure converged coolant fractions.
| simulation name | number of iterations | grid resolution | number of photon packets |
|---|---|---|---|
| Ci20g128p7 | 20 | ||
| Ci05g128p7 | 5 | ||
| Ci10g128p7 | 10 | ||
| Ci15g128p7 | 15 | ||
| Ci25g128p7 | 25 | ||
| Ci20g064p7 | 20 | ||
| Ci20g256p7 | 20 | ||
| Ci20g256p8 | 20 | ||
| Ci20g128p5 | 20 | ||
| Ci20g128p6 | 20 | ||
| Ci20g128p8 | 20 |
| simulation name | random seed | ionising luminosity | scale height |
| () | (pc) | ||
| Ir42l49s063 | 42 | 63.0 | |
| Ir19l49s063 | 19 | 63.0 | |
| Ir55l49s063 | 55 | 63.0 | |
| Ir42l48s063 | 42 | 63.0 | |
| Ir42l50s063 | 42 | 63.0 | |
| Ir42l49s032 | 42 | 31.5 | |
| Ir42l49s126 | 42 | 126.0 |
3 Results and discussion
3.1 Convergence
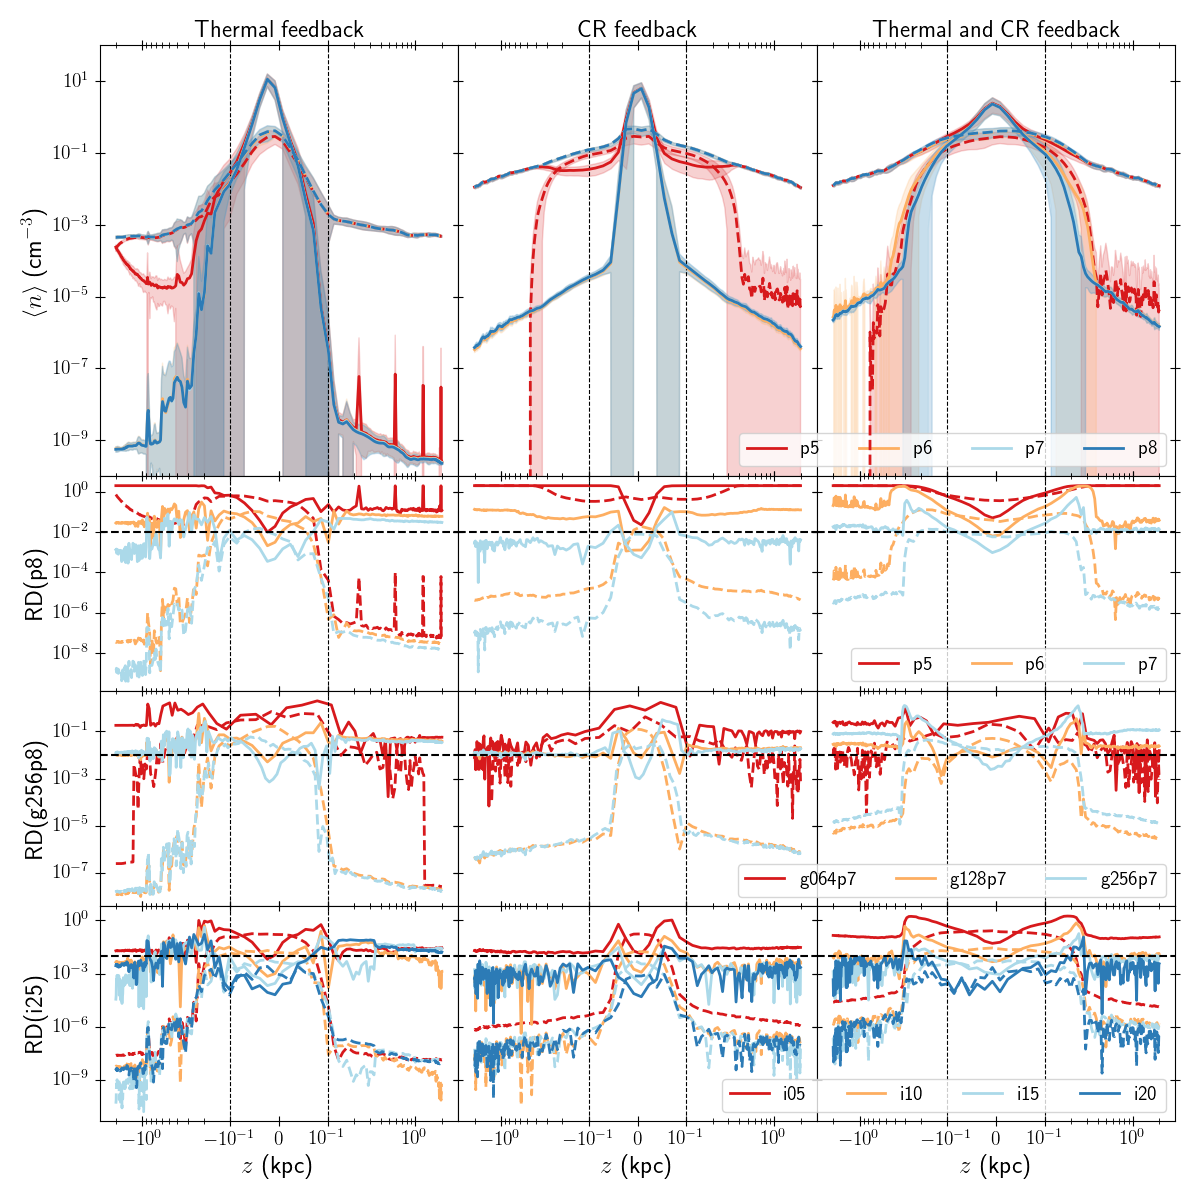
Before we can test convergence of our results, we have to make clear what convergence means in our case. We are interested in the vertical scale of the neutral and ionised disc, so we require vertical disc profiles which are sufficiently converged. To quantify convergence, we compare profiles for the average ionised and neutral gas densities. These are defined as respectively the spatially averaged ionised and neutral gas densities in kpc planar slices with constant height above or below the disc. Examples of density profiles are shown in the top panel of Fig. 1.
For each parameter of interest, we compare profiles for different parameter values with a reference model by computing the relative difference
| (1) |
with the parameter value that identifies the reference model. A model is considered sufficiently converged if the relative difference is of the level of 1 % or less for all values of .
We start with the number of iterations of our algorithm that is needed to obtain converged densities. The bottom row of Fig. 1 shows the relative difference between the density profiles after 5, 10, 15 and 20 iterations, and the reference result after 25 iterations. The largest differences between the low iteration number models and the reference model are located near the central disc. The ionised disc between 0.5 and 2 kpc is converged to 1 % accuracy after 20 iterations, which is the number we will use for all our simulations.
A very important parameter in our algorithm is the number of photon packets used to discretize the stellar radiation field. If this number is too low, discretization error will dominate our simulation, and the radiation field will be unable to spread throughout the simulation box. The top rows of Fig. 1 show the average densities for different numbers of photon packets, and for a fixed grid resolution of cells. It is immediately clear that the results for the simulations with only photon packets are qualitatively different from those of the other simulations, illustrating how the radiation field is unable to efficiently ionise the box if too few photon packets are used. Just as in the case of the number of iterations, using a low number of photons also affects the scale height of the ionised disc. The relative difference drops below 1 % for the simulations with photon packets, and this is the number that we will use in consecutive simulations.
A last important parameter for the convergence of our models is the grid resolution. Unlike the number of iterations or photon packets, this parameter is not immediately linked to our photoionisation algorithm. This means that we can obtain a converged photoionisation solution for any given grid resolution by using enough photon packets and iterations. If the grid samples the density field very badly, then this solution will not be converged to the solution imposed by the underlying density field, but from the point of view of the photoionisation algorithm, it will be converged nonetheless. Conversely, parameters that lead to a converged result for one grid resolution, will not necessarily work for another resolution. The central row of Fig. 1 shows how using a grid with only photon packets seems to change our result, indicating that we need at least this resolution to obtain a converged result. However, if we rerun the same model with 10 times more photon packets, then the solution looks much more similar to the result, showing that the latter resolution is sufficient for convergence. This is to be expected, as this is the resolution used by Girichidis et al. (2016b), so we are effectively overresolving the input density field with a grid. As pointed out by de Avillez & Breitschwerdt (2004); Hill et al. (2012), this resolution does not guarantee converged density fields in the midplane of the SILCC simulations, and might cause us to overestimate the ionising luminosity necessary to ionise the extended disc.
We conclude that 20 iterations of our algorithm, using a grid of cells and photon packets, is sufficient to obtain converged vertical density profiles for the ionised disc.
3.2 Ionising source model
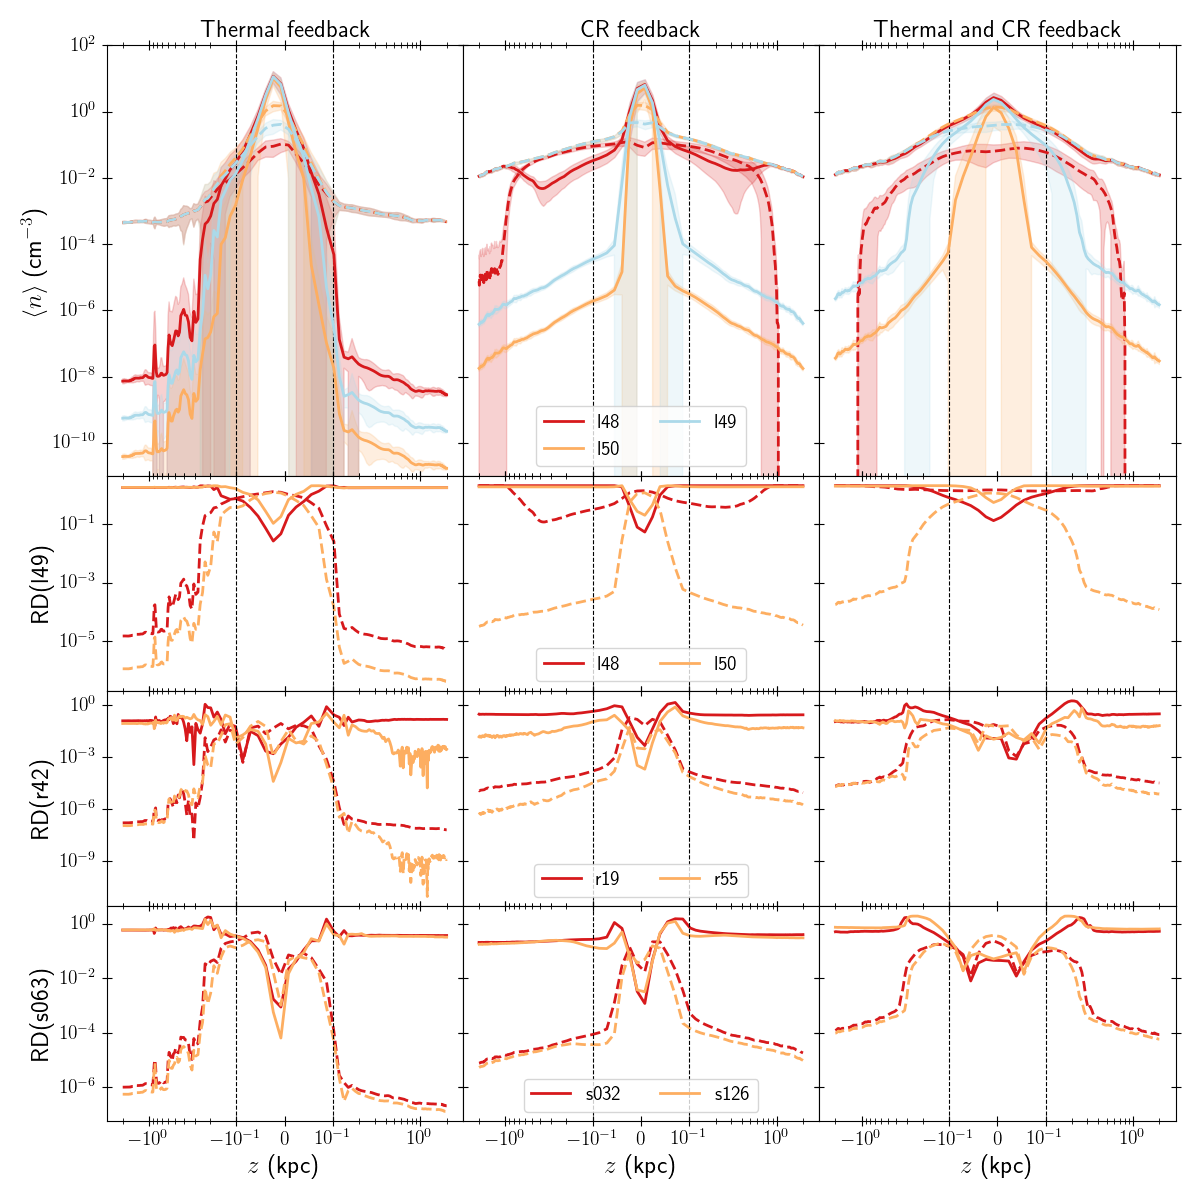
Before we can discuss the effect of changing the source luminosity or scale height of the source distribution on our results, we need to quantify the scatter introduced by our sampling of the source distribution. To this end, we rerun each of our models with two different seeds for the random generator that generates the positions of our discrete sources.
The central row of Fig. 2 shows the relative difference in densities for models with different random seeds (and hence different positions for the 96 ionising sources). Apart from a small difference in the width of the central density peak, the relative difference between the different models is of the order of 10% in the neutral gas density. There is a clear asymmetry in the neutral gas disc for the SILCC model without cosmic ray feedback, which shows that the exact positions of the sources can enhance asymmetries present in the density field. However, for the ionised gas density, and especially the extended disc which is of most interest to us, the relative differences between different source models are small. We conclude that the overall structure of our solution is independent of the numerical details of our ionising source model, so that we can use a single realization of the source model to study the structure of the ionised disc.
We already mentioned above that there is some uncertainty on the ionising luminosity of the individual sources in our model, since we do not know how much radiation is absorbed in the local envelope surrounding each source, which we do not resolve. To address this uncertainty, we run models with different ionising luminosities per ionising source. The top rows of Fig. 2 show the density profiles for three different values of the luminosity : the generic value of s-1, a value that is 10 times lower, and a value that is 10 times higher. The latter is not really physical, but it is instructive to see how it affects our results.
It is immediately clear from the figure that a low value of the luminosity can lead to results that are qualitatively completely different : if the luminosity is too low, then there is insufficient radiation to ionise the entire box, and we end up with an extended neutral disc instead of an ionised disc. However, when the luminosity is high enough, an ionised disc is created, the structure of which is relatively independent of the total ionising luminosity. Just as with the different random seeds above, we see that a different luminosity has some effect on the width of the central density profile, but does not really affect the extended disc (provided the luminosity is high enough to ionise it). The neutral density profile is affected, but only in the regions where the neutral gas fraction is already quite low.
The bottom row of Fig. 2 shows the relative differences for models with different values for the ionising source distribution scale height : the generic value of 63 pc, a value which is half of that, and a value which is twice the generic value. It is clear that the scale height of the sources has a small effect on the value of the neutral fraction, as it is easier for hard ionizing radiation to escape from the dense inner disc if the source distribution is more extended.
We conclude that the extended ionised disc in our models is robust against changes in our ionising source model, provided that the ionising luminosity of the combined sources is sufficient to ionise the disc. These results are in agreement with previous results of Wood et al. (2010).
3.3 Time evolution
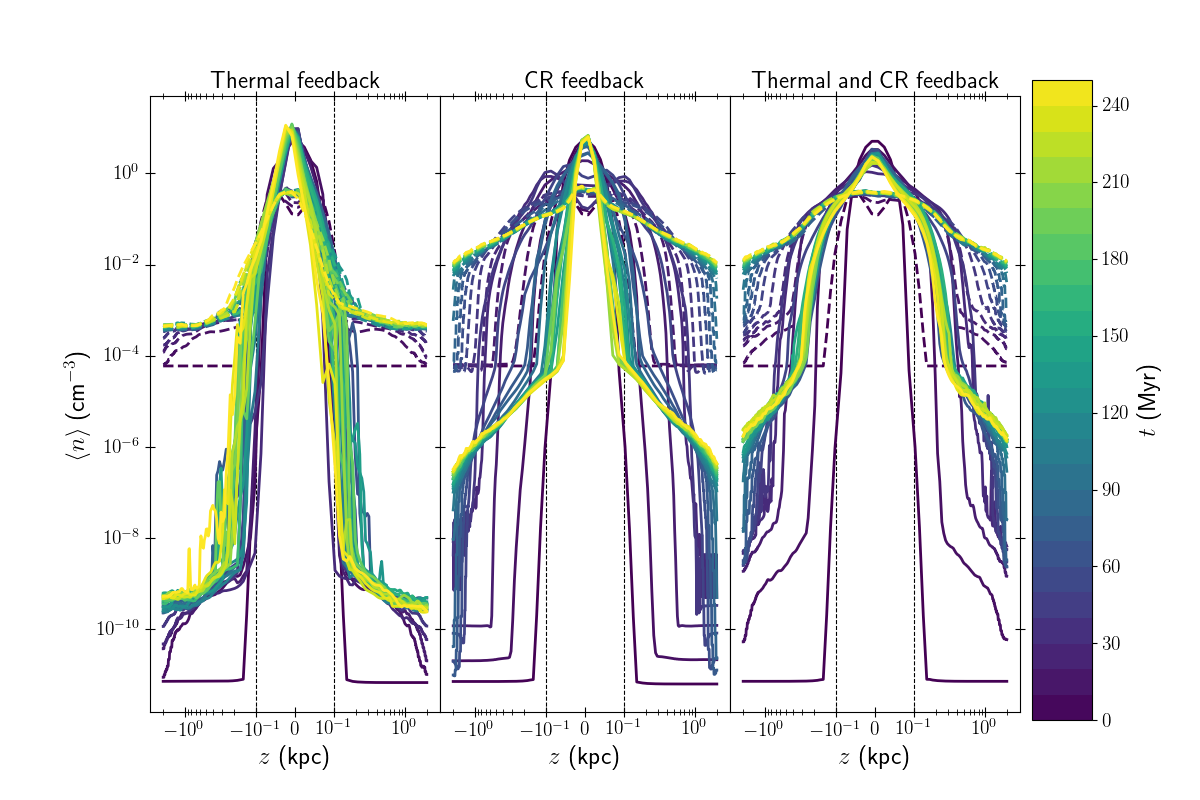
Fig. 3 shows the build-up of the density profiles over time, by post processing snapshots at a 10 Myr interval from time 0 Myr to the final snapshot at 250 Myr we extensively discussed before, for each of the three feedback models. For the model with only thermal feedback, the profiles quickly reach a stable configuration in less than 50 Myr, for the models with cosmic ray feedback, the build-up is slower and it takes approximately 100 Myr to reach a stable disc.
The figure also shows how all three models at first have very low disc densities, which slowly increase over time. For the model with only thermal feedback, this increase is limited, while for the other two models the disc growth is more extended.
It is important to note that these results were obtained in post processing, so there is no dynamical effect of the ionizing radiation on the evolution of the simulation model (other than the feedback model employed by the SILCC simulations themselves). Furthermore, all our results used the same source model, independent of the evolution of the underlying SILCC model.
3.4 Emission lines
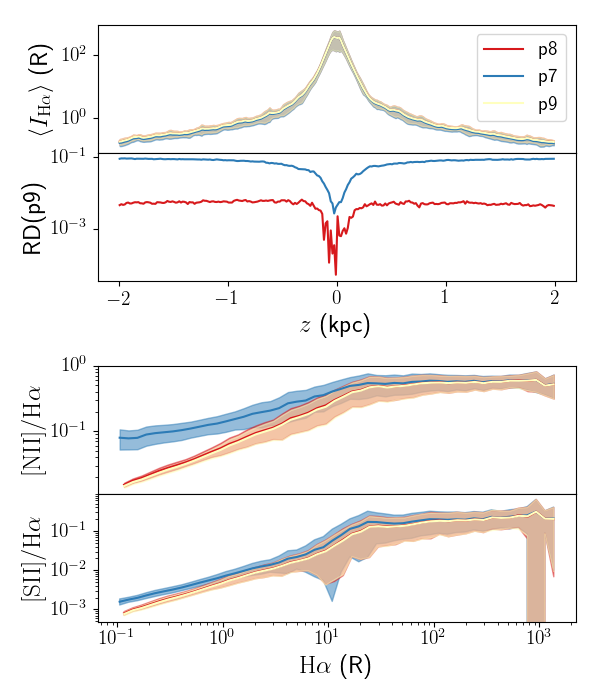
To calculate emission lines, we used the full version of CMacIonize, which treats the temperature of the ISM as a variable rather than a constant, and uses heating and cooling terms to obtain a converged temperature and ionisation state for each cell in the grid. Since the abundances of most coolants are significantly lower than those of hydrogen and helium, we increased the number of photons for these simulations with a factor of 10 to get better signal to noise ratios for the coolant ionic fractions. The convergence of the resulting H profiles and forbidden line emission ratios is shown in Fig. 4 for the model with both thermal and cosmic ray feedback. We see that photon packets is sufficient to get converged H profiles and emission line ratios.
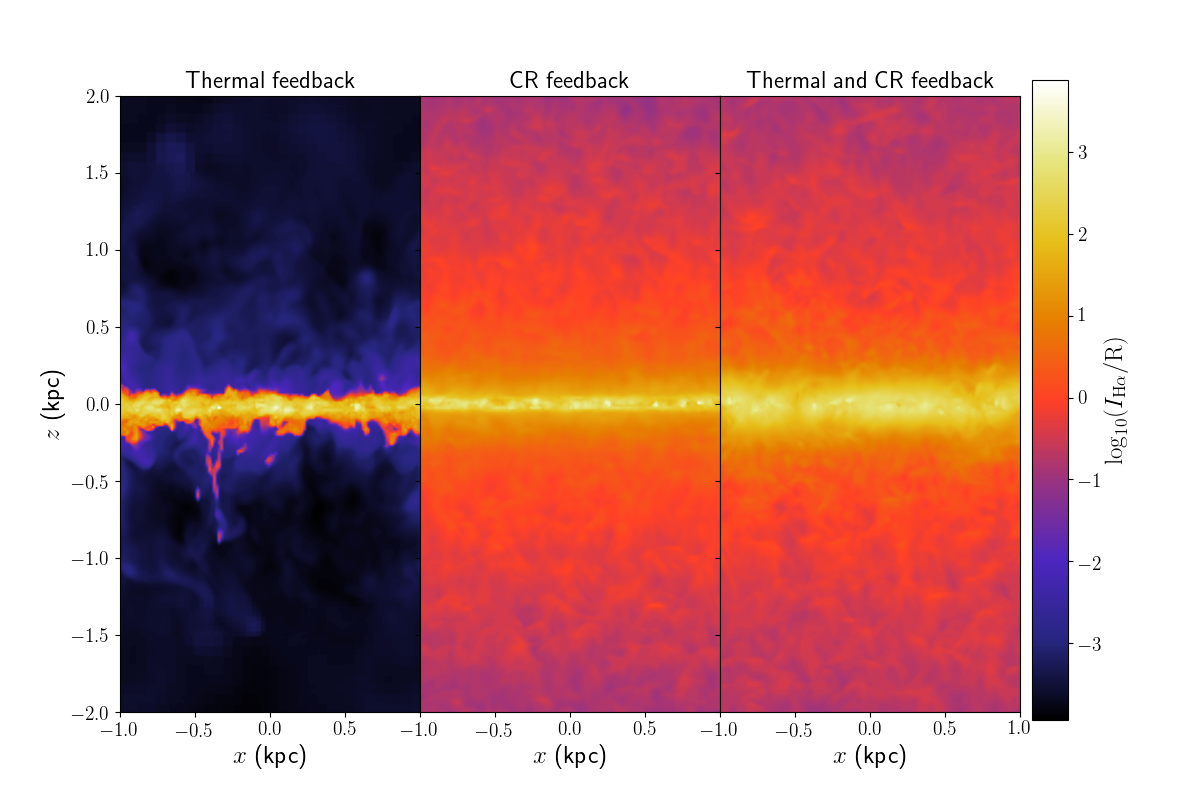
Fig. 5 shows simulated maps of the H intensity for our different models. It is clear that the H emission is significantly more extended in the simulations including cosmic ray feedback. Note that the H intensities we find here are significantly higher than those found by Barnes et al. (2014) (see Section 3.4.2 below).
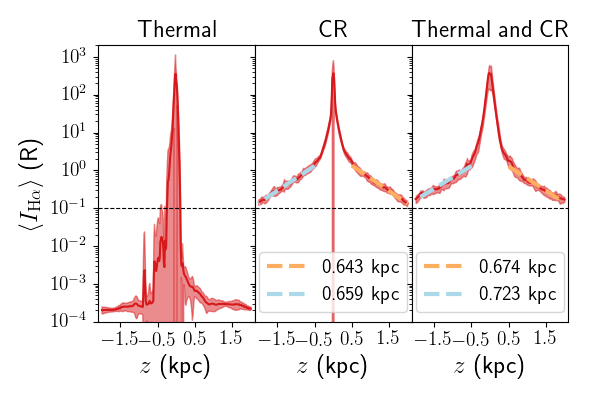
Fig. 6 shows horizontally averaged H profiles. It is clear that the simulation with only thermal feedback has very low intensities at even moderate heights above the midplane, which indicates that this model does not have an extended ionized disc. By fitting an exponential profile of the form at heights above and below for the models with cosmic ray feedback, we can determine the H scale height for those models. This yields values of and for the model with only cosmic ray feedback, and and for the model with both thermal and cosmic ray feedback. These values are in line with observed H scale heights in the Milky Way, which range from in the inner galaxy (Madsen & Reynolds, 2005), over in the near spiral arms (Haffner, Reynolds & Tufte, 1999; Hill et al., 2014; Krishnarao et al., 2017) and values of in the local solar neighbourhood (Gaensler et al., 2008; Savage & Wakker, 2009), to values of more than in the far Carina arm (Krishnarao et al., 2017). The values we find are also significantly higher than the scale heights found in Barnes et al. (2014).
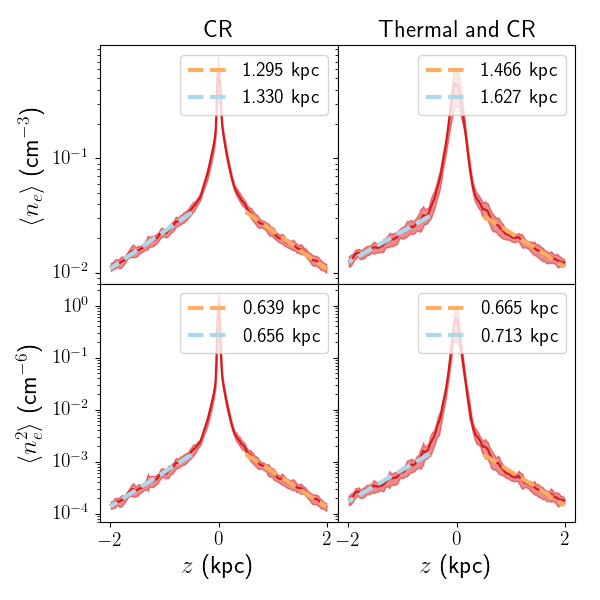
Gaensler et al. (2008) propose to measure the filling factor of ionized gas by comparing H scale heights with electron scale heights obtained from pulsar dispersion measurements. Assuming an ionizing gas filling factor which is constant as a function of height, the electron scale height (which traces the electron density ) and H scale height (which scales as ) should be linked by . However, if these scale heights are inferred from integrated quantities, then the presence of neutral regions in the integral could skew this ratio to higher values for low altitudes. We test this for our simulations by fitting scale heights to and , as shown in Fig. 7. As can be seen, the values we find are in good agreement with the integrated H values. Furthermore, the values we find are consistent with a ratio of 2.
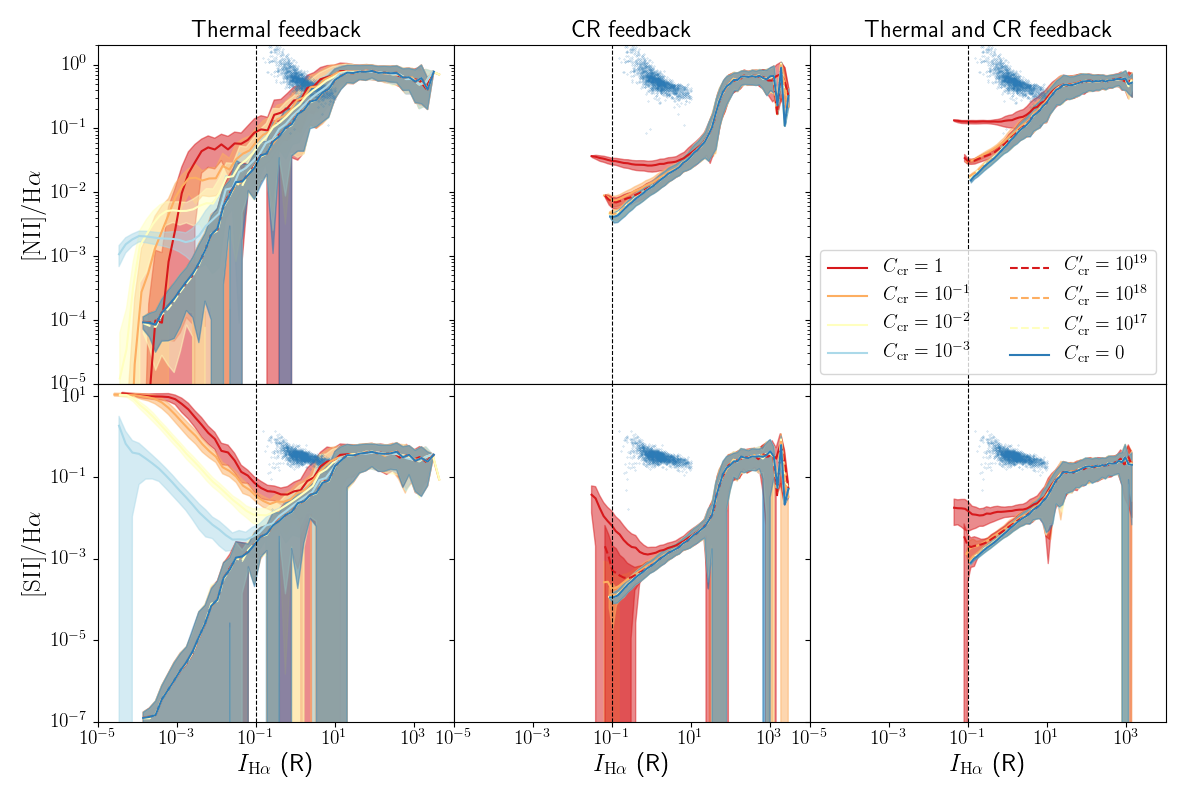
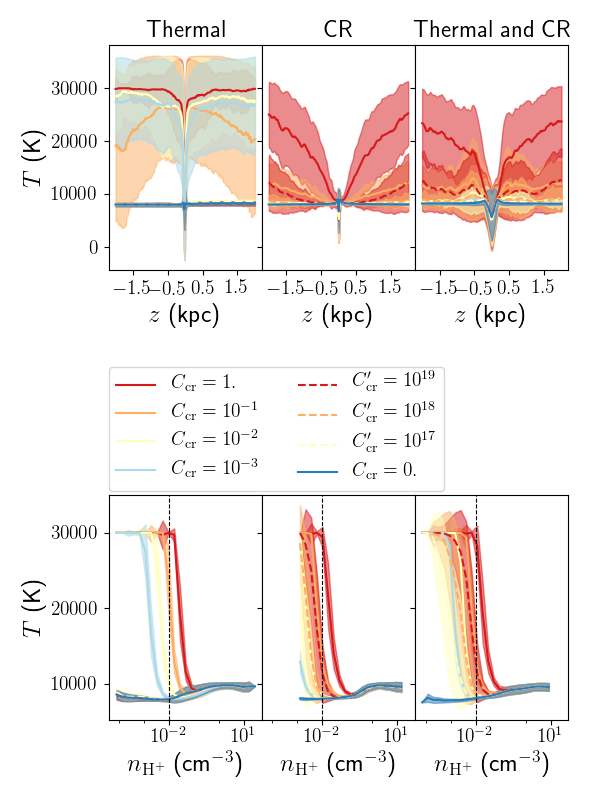
When we look at emission line ratios, the correspondence between model and observations is much less favourable however. Fig. 8 shows the and ratios as a function of the H intensity. We notice a clear upwards trend for both line ratios for increasing H intensity. This trend is completely opposite to the downwards trend found in observations (Haffner, Reynolds & Tufte, 1999), and agrees with earlier results found by Barnes et al. (2014). Since and trace warm ionised gas, the lack of high line ratios for low H intensities indicates that the temperature at high altitudes above the disc (where the H intensity is low) is too low in our models. This can also be seen in Fig. 9, where the equilibrium gas temperature is shown as a function of altitude. The equilibrium temperature in our models only increases very slowly across the ionised disc. If we want our models to line up with the observations, we hence need an extra heating mechanism that can increase the temperature at high altitudes.
3.4.1 Cosmic ray heating
One possible source of heating would be heating by cosmic rays. The cosmic ray model employed by the SILCC simulations introduces an extra pressure term and associated adiabatic heating and cooling due to cosmic rays, but does not constitute a direct heating term (Girichidis et al., 2016b). This means we cannot directly use the simulation snapshots to provide us with the required additional heating. We know however that cosmic rays can directly transfer energy to the gas by the generation of dampened Alfvén waves (Wentzel, 1971), a process which scales with , where is the electron density in the gas (Wiener, Zweibel & Oh, 2013).
To test if cosmic ray heating can explain the observed line ratios, we run additional photoionisation simulations with the advanced model that treats both the ionisation balance and the temperature as a variable, and include an extra heating term that scales with :
| (2) |
where is a constant parameter of our model, is the height above the disc, is the scale height of the cosmic ray heating, and the numerical factor was based on the factor given in Wiener, Zweibel & Oh (2013). As in Wiener, Zweibel & Oh (2013), we choose a value kpc. We will consider different values of the parameter .
We also implemented a second cosmic ray heating scheme that is based on the more exact expression for the cosmic ray heating(Wiener, Zweibel & Oh, 2013):
| (3) |
where is the Alfvén speed (, with the magnetic field, the vacuum permeability and the proton mass), and is the cosmic ray pressure (, with the cosmic ray polytropic index, and the cosmic ray energy density). and are present in the SILCC outputs, so our alternative heating term then can be formulated as
| (4) |
with a constant parameter. This heating term will be trivially zero for the SILCC model without cosmic ray feedback.
Since the heating terms described above diverge for very low values of the electron density, we have to be careful when adding them to our temperature calculation, as low electron densities do not only occur in ionised cells with low densities, but also in denser, neutral cells, where the electron density is low due to the high neutral fraction of the gas. We therefore, before entering the complex temperature iteration for a cell, compute the neutral fraction at a fixed temperature of 8000 K for that cell. If the cell has a neutral fraction that is higher than a cut off value of 0.75, we assume the cell is fully neutral and set its temperature to 500 K. In this case we do not enter the detailed cooling and heating routine, and avoid problems with finding the neutral fraction in cells with high densities and low electron densities.
Similarly, we also need to take care when heating the cells to very high temperatures, as we only included the relevant heating and cooling processes up to temperatures of about 30,000 K. We therefore manually reset the temperature to 30,000 K if cosmic ray heating pushes it to higher values.
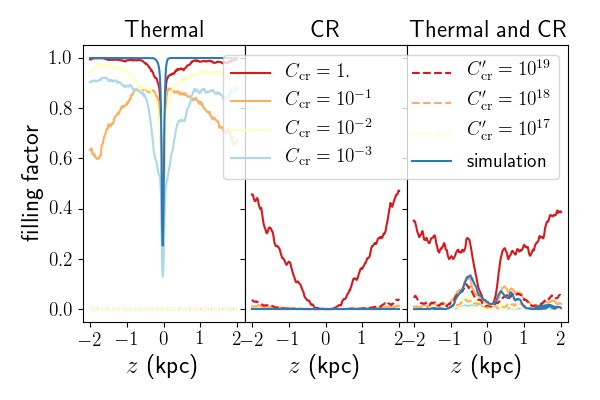
Fig. 9 shows the temperature profiles for various strengths of the cosmic ray heating. It is clear that cosmic ray heating is able to push the average temperature to higher values. However, it is also worth noting that a significant fraction of the gas ends up at 30,000 K, the imposed temperature limit, especially for cells at higher altitudes above the disc. These cells will have very low H intensities, so they do not contribute significantly to the observed line ratios. Fig. 10 shows the hot gas filling factor in each horizontal slice of the simulation, defined as the fraction of the cells in the slice with a temperature of 30,000 K. For comparison, we also show the hot gas filling factor in the actual SILCC snapshots. It is clear that the models with high cosmic ray feedback contain a lot of cells with very high temperatures. To reproduce the hot gas filling factor of the SILCC simulations in the models with cosmic ray feedback, we would need a cosmic ray heating parameter with about 10% of the value advocated in Wiener, Zweibel & Oh (2013), or the more advanced cosmic ray heating model with the highest parameter value.
Note that both cosmic ray heating models produce similar results. As can be seen from the bottom panel of Fig. 9, both mechanisms predominantly heat low density ionised gas, and cause a sharp increase in temperature at a density threshold set by the value of the heating parameter.
Also note that gas with densities lower than will most likely be shock heated and ionised to temperatures , an effect that we did not incorporate in our post-processing treatment. Therefore, we find that all but the strongest cosmic ray heating realisations only heat gas that would already be heated by other physical mechanisms.
Finally, Fig. 8 shows the line ratios for the different cosmic ray heating models. It is clear that the cosmic ray heating does not affect the high H intensity end of the curve, which corresponds to radiation emitted by the central disc. Cosmic ray heating does affect the low intensity line ratios in the diffuse ionised disc, and effectively changes the sign of the slope of the curve, leading to a trend that is more in line with the observed trend, although the effect is only noticeable for high values of the cosmic ray heating factor. This seems to indicate that the cosmic ray heating does not affect the temperature of the intermediate density ionised gas which is responsible for the observed H emission.
3.4.2 Lower total luminosity
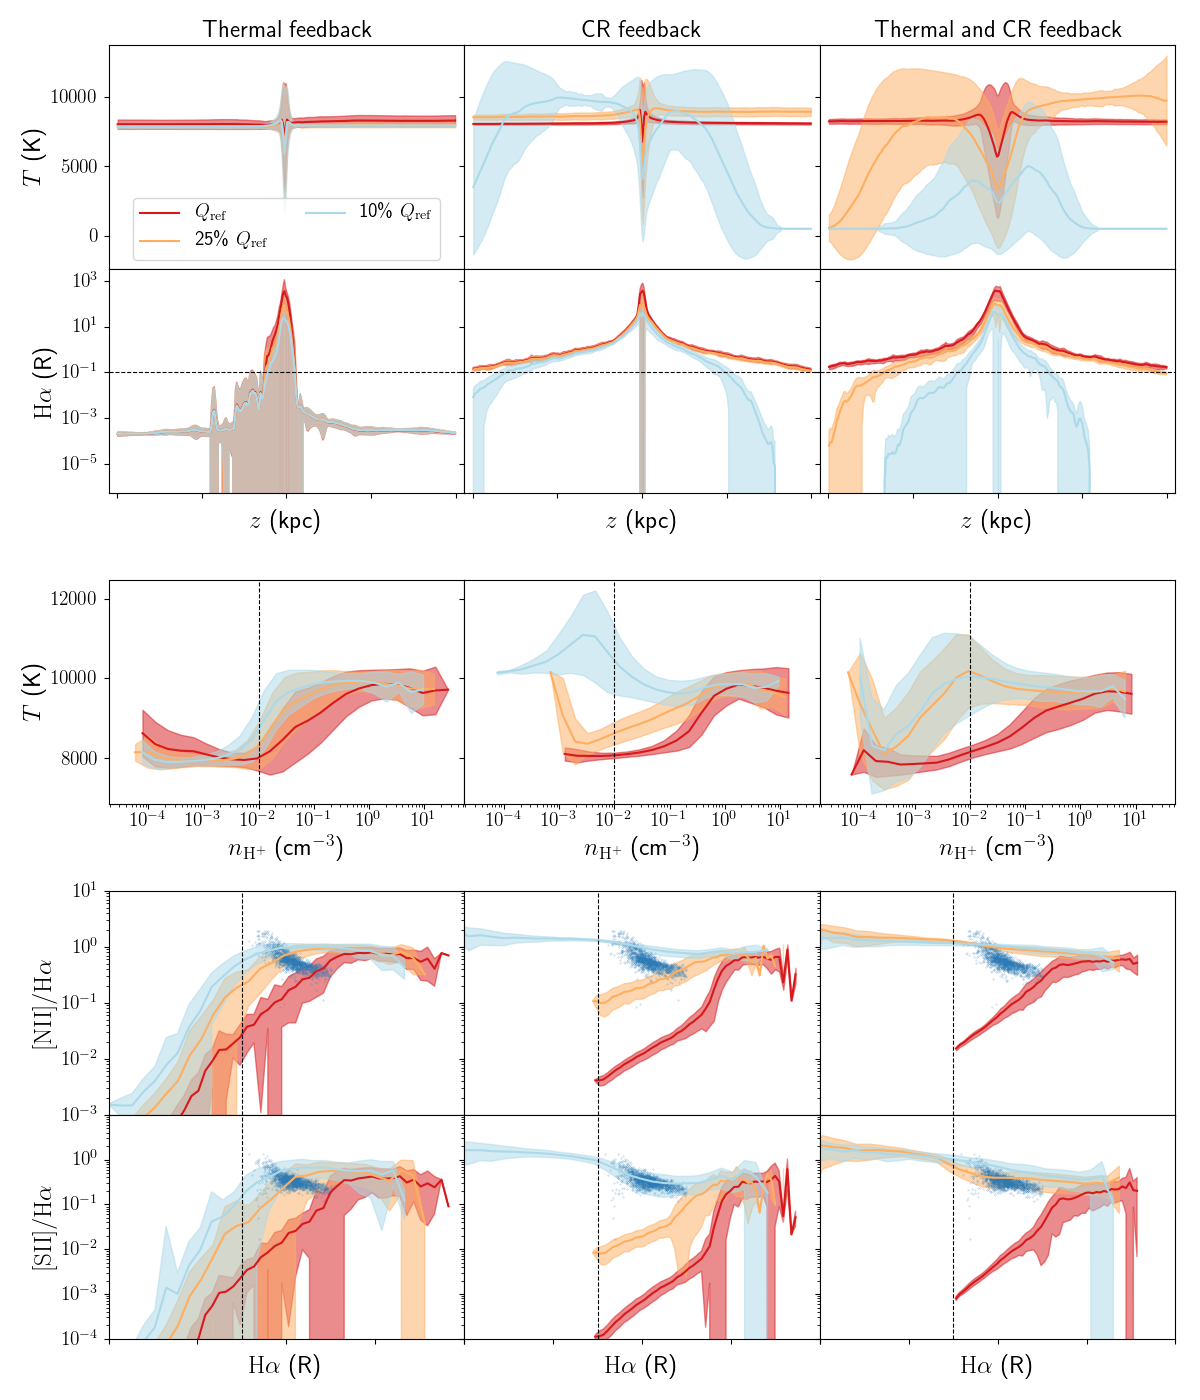
We require a relatively high luminosity to ionise out to large scale heights, compared to the values that were used by Barnes et al. (2014). This leads to H luminosities that are high compared to observed H luminosities. It is instructive to see how the temperature and line ratios change if a lower luminosity is used.
To this end, we run a set of simulations with the full version of the code, using lower luminosities for the ionising sources: a version with an ionizing luminosity of per ionising source (10% of the generic value), and a version with a luminosity of per ionising source (25% of the generic value).
| ionising luminosity | scale height | scale height |
| () | (kpc) | (kpc) |
| TH1_CR0 | ||
| TH0_CR1 | ||
| TH1_CR1 | ||
The results of these simulations are shown in Fig. 11. As expected, the lower luminosities lead to more noisy temperature and H profiles, as the sources are no longer able to ionise the entire low density disc. However, for the SILCC models including cosmic ray feedback, the H scale height for the simulation with 25% of the total ionizing luminosity is still comparable to the full luminosity result (as can be seen from Table 2), and hence in line with observed scale heights in the Milky Way. Furthermore, the runs with lower intensity show a clear increase in temperature for intermediate density ionised gas, which in turns translates into line ratios that increase with decreasing H intensity.
We hence find that a decrease in total ionising luminosity can actually lead to higher local temperatures and can hence explain the observed line ratios. This counter-intuitive result can be explained by the hardening of the ionising spectrum for large scale heights (Wood & Mathis, 2004) : low frequency photons are preferentially absorbed at low heights, so that the spectrum that reaches higher heights contains relatively more high frequency hydrogen ionising photons, which heat the gas to higher temperatures. If the total ionising luminosity is high, the fraction of photons absorbed at low heights will be low, and the hardening of the spectrum will happen over a large scale. However, if the luminosity is just enough to ionise out to the boundary of the simulation box, we see the full hardening of the spectrum and resulting rise in temperature, while still keeping the gas ionised. There is however some fine tuning required: decreasing the total luminosity further to 10% of the generic value significantly decreases the H scale length, and leads to results that are no longer in line with observations.
4 Conclusion
In this work, we post-processed star forming disc simulations of the SILCC project with the new Monte Carlo radiative transfer code CMacIonize. We showed that the more extended galactic disc present in MHD simulations that include cosmic ray feedback naturally leads to larger scale heights for the H emission from the DIG in these discs, provided that enough ionising radiation is present to ionise out to large scale heights. This more extended disc is a direct consequence of the specific way cosmic rays couple to the hydrodynamics of the ISM, which makes it possible to more efficiently heat the gas in a larger region compared to thermal feedback.
However, most of our simulations are unable to reproduce observed nitrogen and sulphur line ratios, even when additional heating due to cosmic rays is included in the model, since these models only affect the temperature of low density ionised gas that does not contribute to observed line ratios. Only if we use a total ionising luminosity that is marginally sufficient to ionise the DIG, we are able to increase the temperature of intermediate density ionised gas and reproduce observed Milky Way line ratios. This fine tuning can have several explanations:
-
•
The ionising radiation itself is partially responsible for setting the scale height of the ionised gas. This would naturally lead to a correlation between the total ionising luminosity and the scale height. However, we cannot study this effect in this work, as there is no direct dynamical link between the SILCC simulations and our post-processing tool. We plan to repeat our analysis for the Peters et al. (2017) simulations that do include photoionization feedback.
-
•
There is another physical heating mechanism that is responsible for the extra heating that is necessary to explain observed line ratios, and that affects intermediate rather than low density ionised gas. In this case we would not need to fine tune the ionising luminosity.
-
•
The dense gas surrounding young O stars aborbs about 75% of the ionising radiation from the star, so that only 25% is left to ionise the more diffuse surrounding gas. As we do not resolve the densest gas, this is an effect that is likely. But to find more accurate values of the ionising escape fraction, more detailed simulations of star forming clouds are necessary.
We hence have no satisfactory explanation for the observed line ratios in the DIG of the Milky Way, and leave this for future work. We do find that the observed decreasing line ratios of nitrogen and sulphur with increasing H intensity are not necessarily explained by an increasing average ISM temperature with increasing scale height, as is often assumed. Instead, these line ratios could also be consistent with an increase in temperature dispersion with increasing scale height, with an overall constant or decreasing average temperature.
Acknowledgements
We want to thank the anonymous referee for constructive and insightful remarks that significantly improved the quality of this work. BV and KW acknowledge support from STFC grant ST/M001296/1. PG acknowledges support from the DFG Priority Program 1573 Physics of the Interstellar Medium as well as funding from the European Research Council under ERC-CoG grant CRAGSMAN-646955.
References
- Barnes et al. (2014) Barnes, J. E., Wood, K., Hill, A. S., Haffner, L. M., 2014, MNRAS, 440, 3027
- Berkhuijsen & Fletcher (2008) Berkhuijsen, E. M., Fletcher, A., 2008, MNRAS, 390, L19
- Daflon et al. (2009) Daflon, S., Cunha, K., de la Reze, R., Holtzman, J., Chiappini, C., 2009, AJ, 138, 1577
- de Avillez & Breitschwerdt (2004) de Avillez, M. A., Breitschwerdt, D., 2004, A&A, 425, 899
- Dickey & Lockman (1990) Dickey, J. M., Lockman, F. J., 1990, ARA&A, 28, 215
- Elmegreen (1997) Elmegreen, B. G., 1997, ApJ, 477, 196
- Gaensler et al. (2008) Gaensler, B. M., Madsen, G. J., Chatterjee, S., Mao, S. A., 2008, Publ. Astron. Soc. Australia, 25, 184
- Garmany, Conti & Chiosi (1982) Garmany, C. D., Conti, P. S., Chiosi, C., 1982, ApJ, 263, 777
- Gatto et al. (2017) Gatto, A., Walch, S., Naab, T., Girichidis, P., Wünsch, R., Glover, S. C. O., Klessen, R. S., Clark, P. C., Peters, T., Derigs, D., Baczynski, C., Puls, J., 2017, MNRAS, 466, 1903
- Girichidis et al. (2016a) Girichidis, P., Walch, S., Naab, T., Gatto, A., Wünsch, R., Glover, S. C. O., Klessen, R. S. , Clark, P. C., Peters, T., Derigs, D., Baczynski, C., 2016a, MNRAS, 456, 3432
- Girichidis et al. (2016b) Girichidis, P., Naab, T., Walch, S., Hanasz, M., Mac Low, M.-M., Ostriker, J. P., Gatto, A., Peters, T., Wünsch, R., Glover, S. C. O., Klessen, R. S., Clark, P. C., Baczynski, C., 2016b, ApJL, 816, L19
- Haffner, Reynolds & Tufte (1999) Haffner, L. M., Reynolds, R. J., Tufte, S. L., 1999, ApJ, 523, 223
- Haffner et al. (2009) Haffner, L. M., Dettmar, R.-J., Beckman, J. E., Wood, K., Slaving, J. D., Giammanco, C., Madsen, G. J., Zurita, A., Reynolds, R. J., 2009, Rev. Mod. Phys., 81, 969
- Hill et al. (2008) Hill, A. S., Benjamin, R. A., Kowal, G., Reynolds, R. J., Haffner, L. M., Lazarian, A., 2008, ApJ, 686, 363
- Hill et al. (2012) Hill, A. S., Joung, M. R., Mac Low, M.-M., Benjamin, R. A., Haffner, L. M., Klingenberg, C., Waagan, K., 2012, ApJ, 750, 104
- Hill et al. (2014) Hill, A. S., Benjamin, R. A., Haffner, L. M., Gostisha, M. C., Barger, K. A., 2014, ApJ, 787, 106
- Jenkins (2009) Jenkins, E. B., 2009, ApJ, 700, 1299
- Krishnarao et al. (2017) Krishnarao, D., Haffner, L. M., Benjamin, R. A., Hill, A. S., Barger, K. A., 2017, ApJ, 838, 43
- Madsen & Reynolds (2005) Madsen, G. J., Reynolds, R. J., 2005, ApJ, 630, 925
- Maíz-Appellániz (2001) Maíz-Apellániz, J., 2001, AJ, 121, 2737
- Mathis (2000) Mathis, J. S., 2000, ApJ, 544, 347
- Nakanishi & Sofue (2003) Nakanishi, H., Sofue, Y., 2003, PASJ, 55, 191
- Pauldrach, Hoffmann & Lennon (2001) Pauldrach, A. W. A., Hoffmann, T. L., Lennon, M., 2001, A&A, 375, 161
- Peters et al. (2017) Peters, T., Naab, T., Walch, S., Glover, S. C. O., Girichidis, P., Pellegrini, E., Klessen, R. S., Wünsch, R., Gatto, A., Baczynski, C., 2017, MNRAS, 466, 3239
- Reynolds (1990) Reynolds, R. J., 1990, ApJ, 348, 153
- Reynolds, Haffner & Tufte (1999) Reynolds, R. J., Haffner, L. M., Tufte, S. L., 1999, ApJL, 525, L21
- Savage & Wakker (2009) Savage, B. D., Wakker, B. P., 2009, ApJ, 702, 1472
- Simpson et al. (2004) Simpson, J. P., Rubin, R. H., Colgan, S. W. J., Erickson, E. F., Haas, M. R., 2004, ApJ, 611, 338
- Sternberg, Hoffmann & Pauldrach (2003) Sternberg, A., Hoffmann, T. L., Pauldrach, A. W. A., 2003, ApJ, 599, 1333
- Vandenbroucke & Wood (2017) Vandenbroucke, B., Wood, K., 2017, submitted to Astron. Comp.
- Walch et al. (2015) Walch, S., Girichidis, P., Naab, T., Gatto, A., Glover, S. C. O., Wünsch, R., Klessen, R. S., Clark, P. C., Peters, T., Derigs, D., Baczynski, C., 2015, MNRAS, 454, 238
- Wentzel (1971) Wentzel, D. G., 1971, ApJ, 163, 503
- Wiener, Zweibel & Oh (2013) Wiener, J., Zweibel, E. G., Oh, S. P., 2013, ApJ, 767, 87
- Wood & Mathis (2004) Wood, K., Mathis, J. S., 2004, MNRAS, 353, 1126
- Wood, Mathis & Ercolano (2004) Wood, K., Mathis, J. S., Ercolano, B., 2004, MNRAS, 348, 1337
- Wood et al. (2005) Wood, K., Haffner, L. M., Reynolds, R. J, Mathis, J. S., Madsen, G., 2005, ApJ, 633, 295
- Wood et al. (2010) Wood, K., Hill, A. S., Joung, M. R., Mac Low, M.-M., Benjamin, R. A., Haffner, L. M., Reynolds, R. J., Madsen, G. J., 2010, ApJ, 721, 1397