Phonon mode softening and elastic properties of hafnium under pressure
Abstract
The effect of pressure on the zone-center optical phonon modes and the elastic properties of hafnium has been studied by both experimental (Raman scattering) and theoretical (DFT) approaches. It was found an anomaly dependence of the phonon frequency of E2g mode in the pressure range from 0 to 67 GPa. The calculated electronic structure of hafnium shows significant changes under pressure, which have a pronounced spatial anisotropy similar to the anisotropy of the observed phonon properties. The dependencies of the elastic properties on pressure including the components of the elasticity tensor, bulk and shear modulus, Poisson ratio and Universal anisotropy index obtained during the calculations has characteristic features indicating the occurrence of the structural phase transition.
- PACS numbers
pacs:
Valid PACS appear hereI Introduction
Technologically important transition metals of group IV (Ti, Zr, Hf) possess a hexagonal close-packed structure (hcp-) at atmospheric pressure. When the pressure increases, they all undergo successive structural transitions, initially to the phase with a simple hexagonal lattice with three atoms per unit cell, and then to the cubic phase with a bcc lattice. The crystal structure of hafnium under pressure was investigated by X-ray diffraction in Xia et al. (1990) where it was reported that the transition to the phase began at pressure of 45.8 GPa and one was completed at 58.3 GPa. The reverse transition from phase had a significant hysteresis, starting at 30 GPa and ending at 19.3 GPa. Subsequent X-ray investigation of hafnium at high pressures Hrubiak et al. (2012) did not reveal a transition to the phase at room temperature in the pressure region up to 51 GPa. A mixture of and phases was observed only with an increase in temperature up to 770 K at a pressure of 45 GPa. The authors explained the discrepancy obtained by the effects of nonhydrostaticity in experiment Xia et al. (1990) which can lower the temperature of the martensitic transition. Another X-ray study Pandey et al. (2014a) at room temperature confirmed the existence of a sequence of transformations in pure Hf. In Pandey et al. (2014a) transition with a wide hysteresis began above the pressure P = 50.6 GPa, and the transition occurred above the pressure P = 65 GPa. It has been shown that the use of different pressure transmitting media results in small shifts in the transition pressures , but the transition itself can be suppressed when the impurity concentration in the sample increases to 7.5%. In spite of the fact that some ab initio calculations of transition pressures have been carried out Gyanchandani et al. (1990); Ahuja et al. (1993); Ostanin and Trubitsin (2000); Jomard et al. (1998); Fang et al. (2011); Hao et al. (2011a); Qi et al. (2016) the mechanism of structural instability of hafnium has been studied insufficiently both experimentally and theoretically. A recent experimental and theoretical study of the elastic properties of hafnium Qi et al. (2016) showed the presence of softening of shear moduli with an increase in pressure above 10 GPa which could indicate the precursors of the transition.
Raman spectroscopy can provide information not only about the structural state of a substance under pressure but also about the effect of changes in interatomic distances on the vibrational and electronic spectrum. Thus, the Raman studies of titanium and zirconium Olijnyk and Jephcoat (1997); Ponosov et al. (2012) revealed an anomalous behavior of the frequency of the E2g phonon which is softened in the phase under pressure. The relationship between the E2g phonon frequency and the elastic modulus suggested a decrease in the latter under pressure which was confirmed by subsequent ultrasonic measurements Liu et al. (2008). For hafnium, Raman measurements, as well as calculations of the phonon spectrum, have not yet been reported.
Despite the substantial interest in this system from the scientific community to date, there is a lack of unambiguous insight on the relationship between phonon properties and structural stability at high pressures in hafnium. In our work, the evolution of the phonon spectrum of hafnium in the pressure region 0-67 GPa at room temperature is investigated by Raman spectroscopy. For the analysis and interpretation of experimental data, first-principles calculations of phonon frequencies and elastic properties at different pressures have been performed by using DFT.
II Methods
II.1 Experiment
Samples for measurements were cut from a hafnium single crystal with a purity of 99.8% having an residual resistivity ratio of . Thin (20 m) plates with transverse dimensions up to 100 m were placed in the center of the flat culets (300 m in diameter) of diamond anvils. The experiment was carried out without the use of a pressure transmitting medium: the sample was compressed between the anvil and the gasket. The pressure in the cell was determined from the shift of the high-frequency edge of the T2g phonon diamond line in the sample region under study. Preliminary calibration of the dependence of the diamond line frequency on the pressure in the used anvils was carried out using ruby luminescence method: the result practically coincided with the data of Akahama and Kawamura (2006). Two runs were performed. In the first, a gasket was made of steel, and the highest pressure was 50 GPa. In the second run, the pressure reached 67 GPa, and the use of a rhenium gasket provided an additional possibility of controlling the pressure Goncharov et al. (2002). The spectra were excited by lines of solid state (532 nm) and helium-neon (633 nm) lasers focused (50 objective) to a spot of 5-10 m in diameter. The scattered light was recorded in backscattering geometry using a Renishaw RM1000 spectrometer equipped with edge filters to exclude low-frequency Rayleigh scattering with a cut-off 40 cm-l and a cooled multichannel CCD detector.
II.2 Calculations
Crystal structure data for Hf at different values of pressure were taken from the paper Pandey et al. (2014b) and one has been used as an initial data for ab-initio electronic structure calculations based on the GGA approximation of the DFT implemented in VASP package Kresse and Furthmüller (1996); Blöchl (1994); Perdew and Burke (1996). In all the calculations the valence configuration is 5p6s5d with four valence electrons. The frozen-phonon method has been used to evaluate the optical phonon mode frequencies at the -point of the Brillouin zone. The plane wave energy cutoff was set to 450 eV and we have used -centered k-point mesh 12x12x12 for pressure values from 0 up to 65 GPa. Self-consistent convergence of the energy was set to 10-8 eV/cell and the force convergent criteria of 10-7 eV/Å.
III Results and discussion
In the hcp phase of Hf, there are three optical phonon modes: B1g and doubly degenerate E2g modes. The first one corresponds to the atomic displacements of the Hf ions along the z-direction (the green arrows in the 8). Whereas the E2g phonon mode associated with vibrational motion in the xy-plane (the red and blue arrows in the 8). According to the selection rules for hcp crystals in the Raman spectrum of the first order, one line - the E2g optical phonon at the point of the Brillouin zone should be observed. In the spectra of hafnium at P=0 GPa (figure 1) very narrow (about 2-3 cm-1) peak at the frequency of 85 cm-1 is recorded, whose energy is close to the value of the energy of the TO mode at obtained in the neutron experiment Stassis et al. (1981).

In addition to this peak, broad lines in the frequency range of 145 and 230-290 cm-1 were found in the spectra. They are observed only for a parallel orientation of the polarization of the incident and scattered light (A1g symmetry), which agrees with the selection rules for the two-phonon spectra activity in hcp crystal. A comparison with the phonon dispersion from the neutron experiment Stassis et al. (1981) suggests that the feature near 145 cm-1 is definitely associated with overtone scattering from transverse acoustic phonons at the M and A points of the Brillouin zone, while in the 235-290 cm-1 region there are overtone excitations from several rather flat longitudinal and transverse branches near the point M. A rather large intensity of two-phonon scattering makes it possible to obtain information on the density of phonon states in hafnium from the Raman experiment. The spectra obtained under pressure in the first run (figure 1) show a slight increase in the E2g mode frequency with an increase in pressure up to 10-15 GPa. With further increase in pressure, an anomalous softening of the E2g mode frequency is observed, while the energy of the broad feature at 145 cm-1 is increased by 15% with the growth of P up to 35 GPa (figure 1).
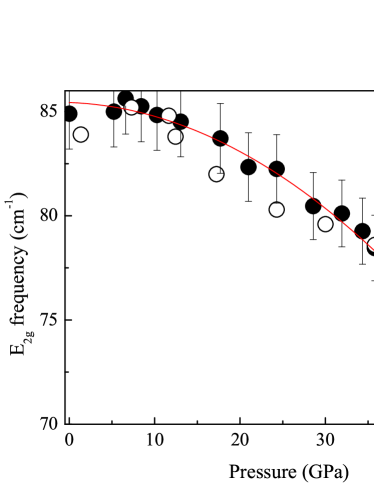
At higher pressures, the intensity of this feature is lower than the observation limit. The high-frequency peak at 230-290 cm-1 was not observed in measurements in the cell. The dependence of the E2g mode frequency vs pressure from the first run is shown in figure 2. Its energy drops by 17% to 50 GPa. Such a softening of the mode was previously observed in the -phase of zirconium Olijnyk and Jephcoat (1997) and was supposed to be due to changes in the electronic structure under pressure. Despite a significant decrease in the intensity of the E2g mode to 50 GPa in the first run, no Raman-active E2g phonon of the phase was observed in the spectra. On pressure release, we did not observe hysteresis in the behavior of the phonon frequency (see figure 2).
Raman spectra of Hf measured in the second run up to 67 GPa are shown in figure 3. The pressure dependence of the E2g frequency in the second run (see figure 3 and 4) coincides with the first run data in the region up to 50 GPa.

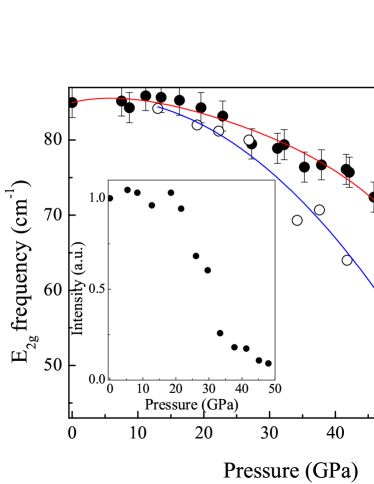
With a further increase in pressure, the frequency and intensity of the E2g mode decrease significantly. The highest pressure at which this line was observed was 64 GPa. With an increase in pressure above 50 GPa, the reflection of the investigated region of the sample in the microscope changed its intensity and became shiny at the highest pressure of 67 GPa. At this pressure, we could not observe the phonon line which implies the achievement of transition pressure. On pressure release, the line appeared again at a pressure of 52 GPa, and its frequency showed a significant hysteresis, recovering at pressures 20 GPa (figure 4). We also observed that the sample changed appearance from shiny to black in reflected light on pressure release to 50 GPa. We believe that the sharp drop in the frequency of the E2g mode above 50 GPa is associated with the onset of the transition to the phase (as in study Pandey et al. (2014a)). However, in our measurements, it was not possible to observe the Raman-active E2g phonon of the hexagonal high-pressure phase, either on loading or when unloading the sample. Such a line was well observed in the Raman spectra of the phase of titanium and zirconium Olijnyk and Jephcoat (1997); Ponosov et al. (2012). The reason for that may be its weak intensity or its low frequency unattainable for our spectrometer ( 45 cm-1). The frequency hysteresis of the E2g mode in the 20-50 GPa range (figure 4), which was not observed in the first experiment up to 50 GPa (figure 2), implies the appearance of phase in the second run. Besides, the intensity of the phonon line increased significantly on pressure release in the region 40-20 GPa (inset in figure 4), which agrees with the data of Pandey et al. (2014a) and perhaps indicates an increase in the amount of phase. These facts imply that, in spite of the absence of the phase line in our spectra, the and phases coexist in the region of 50-64 GPa on pressure increase and in the region of 52-20 GPa on pressure release. Disappearance at the highest pressure, possibly, implies a transition to the phase. Another explanation the absence of the phase line in our spectra assumes a direct transition of the phase to the phase.
Although Raman experiment probes only =0 phonon, it is obvious that at least the transverse optical phonons with q = 1/6 in hafnium will be significantly softened under pressure. A significant decrease of the elastic modulus (coupled with the E2g phonon frequency) indicates the involvement of acoustic phonons with the same wave vector. These observations support the transformation mechanism proposed in Ranganathan and Ostoja-Starzewski (2008).
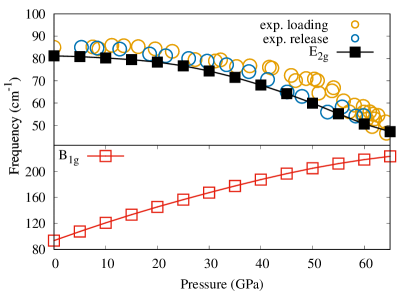
To clarify the relationship of the anomalous behavior of the phonon mode with electronic degrees of freedom of the system under the study, the calculations in the framework of the density functional theory were carried out for -Hf crystal structures at different pressures. During the GGA calculations, the values of the phonon mode frequencies at the -point were obtained by the frozen-phonon method in the pressure range from 0 up to 65 GPa. Our calculations confirmed the main results obtained in the experiment (see figure 5). As we can see from the upper panel of the figure the frequency of E2g mode is softening which is counterintuitive behavior during compression. At the same time, the calculated frequency of B1g phonon mode increases under pressure (lower panel in figure 5). The small difference between the calculated and experimental data may be because non-hydrostatic pressure is applied in the experiment. Also, it is possible Fang et al. (2011) that taking into account in the calculations the spin-orbit interaction can slightly improve the quantitative agreement with experiment.
To determine the influence of pressure on the electronic structure of the phase of hafnium, the total and partial densities of states were obtained. The density of hafnium 5p6s and 5d states are presented in figure 6 for two pressure values 0 and 50 GPa. The general shape and positions of the peaks are in good agreement with previously published data Ahuja et al. (1993); Fang et al. (2011).
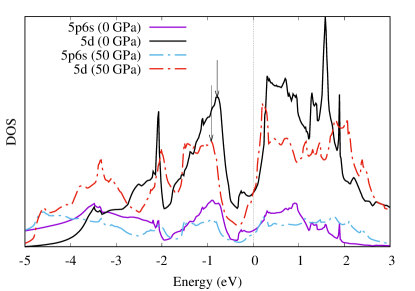
There are two competing effects which influence on the occupation of the d-level near the Fermi energy with a change in pressure. First of them connected with the effect of broadening of the relatively narrow peak under compression which leads to decrease of the d-state occupation due to the rise of the area under the curve above the Fermi level. The second one is due to the shift of the peak downward in energy, which leads to an increase the occupation of the corresponding states. In figure 6 the vertical arrows indicate the centers of the peaks under the Fermi level. As we can see, there is a shift of the peak to lower energy when pressure is applied. The value of the shift is about 0.13 eV. Along with this effect, the broadening of the bands below -2 eV towards lower energies is observed. Besides, it can be observed that the density of 5d-states at the Fermi level remain unchanged under compression as if the band would be attached to the zero energy. Such redistribution of the density of states leads to increase of the occupation of the 5d level. The figure 6 also shows the density of sp-Hf states. The position and the structure of the peaks on the curves quite clearly repeat ones in the d-band which confirms the presence of a strong hybridization between corresponding states. The growth of the number of d-electrons is associated with the rise of the hybridization between d- and sp-levels of neighboring atoms with increasing the pressure due to decreasing of the interatomic distances which leads to reducing the occupation of sp-states. In the -phase the distances between the nearest neighboring hafnium atoms are different for atoms in the -plane and atoms in neighboring planes. With increasing pressure, these distances and also the difference between them decrease up to a pressure of 70 GPa, at which the corresponding lengths coincide Pandey et al. (2014b). The number of 5d-electrons is changing from 2.11 at 0 GPa pressure to 2.30 at 50 GPa which agrees well with the previously published data Fang et al. (2011). For a more detailed analysis of the change in the density of states with increasing pressure the partial density of 5d-Hf states were constructed and are shown in figure 7 in comparison with 6s- and 5p-Hf states.
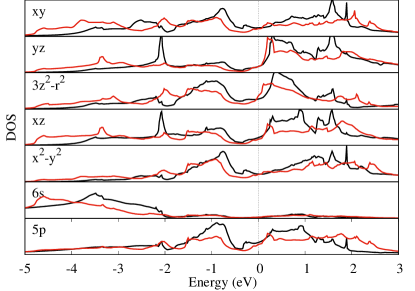
The figure 7 shows clearly that 6s states have the largest hybridization with 5d states with xy and yz symmetry in the bottom of the whole density of states. While 5p states hybridize predominantly with x2-y2, xy and 3z2-r2 states in the region from -2.5 eV up to the Fermi level as indicated by a pronounced peak near -0.8 eV. From figure 7, it follows that the occupation of 6s states remains unchanged whereas the area under 5p curve below EF is decreased when pressure is applying. As we can see from figure 7 the orbitals with x2-y2 and xy symmetry undergo the most noticeable shift of that relatively narrow peak edge which may indicate their dominant contribution to the redistribution of the density of states near the Fermi level as a result of the growth of the pd-hybridization. The average value of the peak edge shift has the value about 0.25 eV. At the same time, the edge of the peak under the Fermi level on the density of states of the orbital has no such shift with increasing pressure. Thus, the redistribution of the density of states, which have the largest contribution near the Fermi level, has a pronounced spatial anisotropy. These observations are consistent with the results of an analysis of the change in the charge density at external pressure.
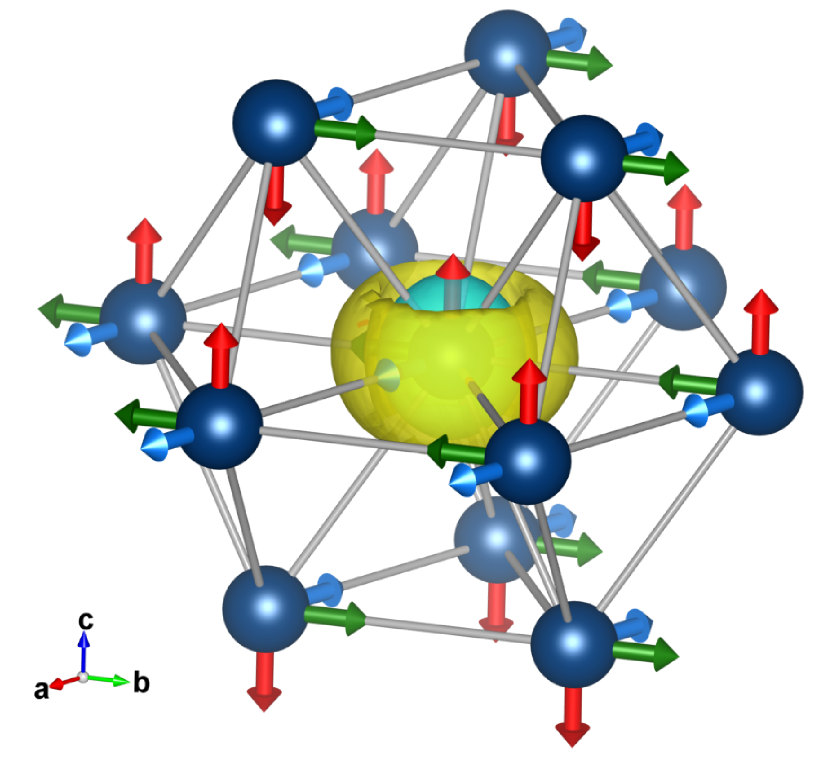
(a)
(b)
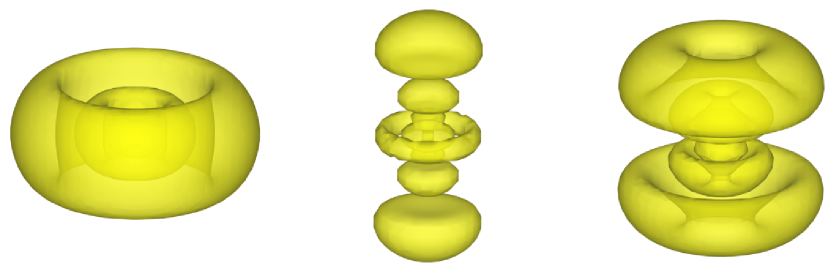
In figure 8 (a) it is presented the schematically view of the crystal structure of -Hf and the isosurface of the charge density difference between 45 GPa and 65 GPa pressures as well as the spatial shapes of 5d atomic orbital combinations in 8 (b). The important thing here is the shape of the isosurface of the positive charge density difference which repeats the shape of the square moduli sum of the wave functions of general 5d states with x2+y2 and xy symmetry (left shape in 8 (b)) in a greater degree than ones of 3z2+r2 or xz and yz symmetry (center and right shapes in 8 (b)). The negative difference of the charge density has a spherical-like shape which is probably due to a decrease in the occupation of the 5p-Hf states. This visually illustrates the effect of redistribution of the density of states which is connected with the spatial orientation of the partially filled d- and sp-orbitals and with increasing of the overlap area between them under pressure. In this way, during the pressure rise, the charge density becomes advantageous to redistribute to the xy-plane but not in the z-direction.
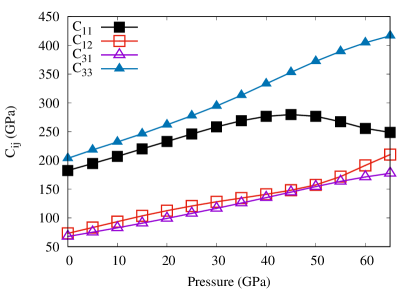
To understand a mechanical instability of the -Hf structure and possible causes of phase transition the change of the elastic and the mechanical properties under pressure were investigated. The components of the elasticity tensor at various values of the external pressure were determined in the course of the calculations. Figure 9 shows the dependencies of the values of the non-zero components of the elasticity tensor on pressure which values are in good agreement with those presented in the literature Qi et al. (2016).
The figure 10 shows the results of calculating of the elastic constant C44 obtained both during the DFT calculations and from the experimental data by using a simple model Verma and Upadhyaya (1971); Olijnyk and Jephcoat (2002) of the lattice dynamics of hcp metals implementing the relationship between the value of the elastic constant and the phonon frequency of E2g mode in the following form:
| (1) |
here and are the lattice constants, is the atomic mass, and is a frequency of the E2g mode. The value of the C44 elastic constant shows a dramatic fall ( 3 times) at the highest pressure P=65 GPa. In addition to condition which in this case is weakening, there is also one of the necessary and sufficient criteria for elastic stability of the hexagonal crystal system Mouhat and Coudert (2014):
| (2) |
And as we can see from figure 10, this condition is sharply weakened more than three times with increasing pressure above 40 GPa. Such behavior of the considered dependence explicitly indicates the structural instability of the crystal in the corresponding pressure range.
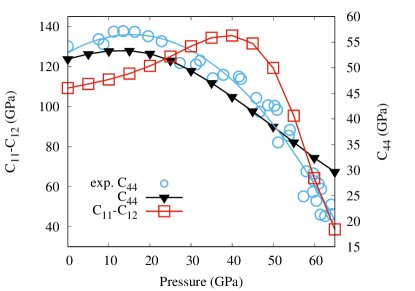
The elastic constant characterized a longitudinal compression (Young’s modulus) along the x(y)-direction has the change in the sign of the derivative in the pressure region of the phase transition. Simultaneously, the behavior of the (z-direction) elastic constant does not undergo similar changes and monotonically increases with increasing pressure. The difference in the dependence of these moduli on pressure indicates a change in the anisotropy of the crystal. The Universal elastic anisotropy index was calculated to verify this assertion by the definition proposed by the authors of the article Ranganathan and Ostoja-Starzewski (2008) in the following view
| (3) |
where , and , are the shear and bulk modulus’ Voigt and the Reuss estimate respectively. The dependence of Universal elastic anisotropy index on the pressure is presented in figure 12. As we can see the value of monotonically increases with increasing the pressure, and it undergoes a jump in the region above 45 GPa which may indicate the tendency to the transition into a more anisotropic phase. The figure 9 also shows the curves of the dependences of the and elastic constants on pressure which are defined by a transverse extension. As can be seen, the latter has an almost linear dependence on pressure, while the former has an extremum in the region of 45 GPa. This effect is also associated with a slight change in the slope of the Poisson’s ratio curve versus pressure at 45 GPa which can be seen in figure 11 (c). Thus, there is a difference between the elastic properties in z- and x,y-directions. The last one show an anomalous behavior which may serve as a precursor of the structural instability occurrence and the phase transition to a more stable phase.
On the basis of the values of the elasticity tensor components, the elastic moduli, the velocities of elastic waves and also the sound velocity were determined in the pressure range from 0 to 65 GPa.
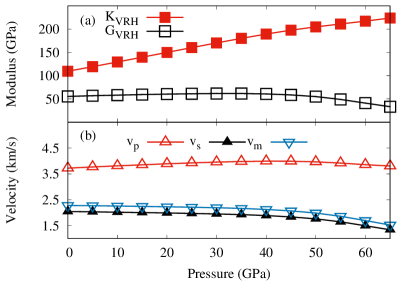
The averaged bulk and shear modulus were calculated by the Voigt-Reuss-Hill average scheme Hill (1952). Obtained dependencies of and on pressure is presented in figure 11 (a). The negative slope of the shear modulus pressure dependence has been found above 40 GPa which may indicate the shear instability of -Hf preceding the transition as was established for -Zr Liu et al. (2008). The compressional and shear waves velocity average values has been evaluated by the formula Hao et al. (2011b)
| (4) |
where is the density. The average value of the sound velocity Hao et al. (2011b) was calculated as:
| (5) |
The pressure dependencies of the propagation velocities of elastic waves are shown in figure 11 (b). As can be seen from this figure, the monotonic growth of the velocities in the pressure region up to 20 GPa is replaced by a monotonic decrease up to 65 GPa. This effect is most clearly seen for the shear wave velocity and the sound velocity. Such behavior may indicate a structural instability of the crystal lattice at pressures above 20 GPa.
To estimate the Isotropic Poisson ratio one was used the following formula de Jong et al. (2015):
| (6) |
The dependence of the on pressure is shown in figure 12 by the solid black curve with empty squares.
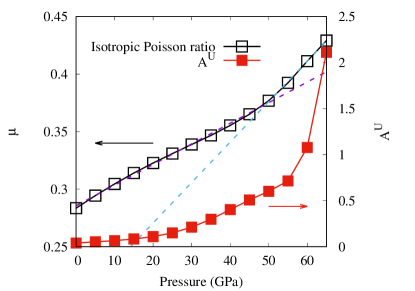
In the same figure, two dashed lines (violet and blue) are also given, which were obtained by the least squares approximation method in two corresponding pressure ranges from 0 to 35 GPa and from 50 to 65 GPa to illustrate the presence of two regions with different slopes of the Poisson’s ratio curve versus pressure as well as existence of wide transition region between them.
IV Conclusion
In the present study, the Raman scattering experiment under pressure found the phonon softening the effect of the E2g mode corresponding to the oscillations of Hf-atoms in the xy-plane. Theoretical calculations of an electronic structure carried out within the framework of the DFT also confirm the presence of this effect. The observed phonon mode softening effect under pressure reflects the close relationship between the electronic and lattice degrees of freedom in -Hf. It was found that two effects associated with the charge distribution occur simultaneously with increasing pressure. Growth in the external pressure leads to the rise of 5d-Hf shell occupation due to sp-d hybridization strengthening. Furthermore, there is a redistribution of the electron density between 5d sub-shells in favor of sub-shells corresponding to the orbitals oriented in the xy-plane. The values of the components of the elasticity tensor, the bulk and shear moduli, the Isotropic Poisson ratio, and the Universal anisotropy index obtained during the calculations demonstrate unusual behavior with increasing pressure that indicates the structural instability of the alpha phase and can serve as a good indicator of the appearance of the phase transition. It is known that the temperature of the superconducting transition in hafnium increases substantially under pressure. Tc is 0.128 K at atmospheric pressure and increases to 8K at 64 GPa Bashkin et al. (2004). Anomalous softening of the E2g mode can be one of the causes of Tc growth due to a change in the electron-phonon interaction.
V Acknowledgements
The present work was supported by the grant of the Russian Science Foundation (project no. 14-22-00004). The authors thank Patrakov E.I. for electron probe microanalysis of the samples as well as Streltsov S.V. and Korotin Dm.M. for useful discussion.
References
- Xia et al. (1990) H. Xia, G. Parthasarathy, H. Luo, Y. K. Vohra, and A. L. Ruoff, Physical Review B 42, 6736 (1990).
- Hrubiak et al. (2012) R. Hrubiak, V. Drozd, A. Karbasi, and S. K. Saxena, Journal of Applied Physics 111, 112612 (2012).
- Pandey et al. (2014a) K. K. Pandey, J. Gyanchandani, M. Somayazulu, G. K. Dey, S. M. Sharma, and S. K. Sikka, Journal of Applied Physics 115, 233513 (2014a).
- Gyanchandani et al. (1990) J. S. Gyanchandani, S. C. Gupta, S. K. Sikka, and R. Chidambaram, Journal of Physics: Condensed Matter 2, 301 (1990).
- Ahuja et al. (1993) R. Ahuja, J. M. Wills, B. Johansson, and O. Eriksson, Physical Review B 48, 16269 (1993).
- Ostanin and Trubitsin (2000) S. Ostanin and V. Trubitsin, Computational Materials Science 17, 174 (2000).
- Jomard et al. (1998) G. Jomard, L. Magaud, and A. Pasturel, Philos. Mag. B 77, 67 (1998).
- Fang et al. (2011) H. Fang, M. Gu, B. Liu, X. Liu, S. Huang, C. Ni, Z. Li, and R. Wang, Physica B: Condensed Matter 406, 1744 (2011).
- Hao et al. (2011a) Y. Hao, J. Zhu, L. Zhang, H. Ren, and J. Qu, Philos. Mag. Lett. 91 (2011a).
- Qi et al. (2016) X. Qi, X. Wang, T. Chen, and B. Li, Journal of Applied Physics 119, 125109 (2016).
- Olijnyk and Jephcoat (1997) H. Olijnyk and A. P. Jephcoat, 56, 751 (1997).
- Ponosov et al. (2012) Y. S. Ponosov, S. V. Streltsov, and K. Syassen, High Press.Res. 32 (2012).
- Liu et al. (2008) W. Liu, B. Li, L. Wang, J. Zhang, and Y. Zhao, Journal of Applied Physics 104, 076102 (2008).
- Akahama and Kawamura (2006) Y. Akahama and H. Kawamura, Journal of Applied Physics 100, 043516 (2006).
- Goncharov et al. (2002) A. F. Goncharov, E. Gregoryanz, V. V. Struzhkin, R. J. Hemley, H. K. Mao, N. Boctor, and E. Huang, Proceedings of the International School of Physics, “Enrico Fermi” Course CXLVII, R. J. Hemley, G.L.Chiarotti, M. Bernasconi, and L. Ulivi , 297 (2002).
- Pandey et al. (2014b) K. K. Pandey, J. Gyanchandani, M. Somayazulu, G. K. Dey, S. M. Sharma, and S. K. Sikka, Journal of Applied Physics 115, 0 (2014b).
- Kresse and Furthmüller (1996) G. Kresse and J. Furthmüller, Physical Review B 54, 11169 (1996).
- Blöchl (1994) P. E. Blöchl, Physical Review B 50, 17953 (1994).
- Perdew and Burke (1996) J. P. Perdew and K. Burke, International Journal of Quantum Chemistry 57, 309 (1996).
- Stassis et al. (1981) C. Stassis, D. Arch, O. D. McMasters, and B. N. Harmon, Physical Review B 24, 730 (1981).
- Ranganathan and Ostoja-Starzewski (2008) S. I. Ranganathan and M. Ostoja-Starzewski, Physical Review Letters 101, 3 (2008).
- Verma and Upadhyaya (1971) M. P. Verma and J. C. Upadhyaya, Journal of Physics F: Metal Physics 1, 315 (1971).
- Olijnyk and Jephcoat (2002) H. Olijnyk and A. P. Jephcoat, Metallurgical and Materials Transactions A 33, 743 (2002).
- Mouhat and Coudert (2014) F. Mouhat and F.-X. Coudert, Physical Review B 90, 224104 (2014).
- Hill (1952) R. Hill, Proceedings of the Physical Society. Section A 65, 349 (1952).
- Hao et al. (2011b) Y. Hao, J. Zhu, L. Zhang, H. Ren, and J. Qu, Philosophical Magazine Letters 91, 61 (2011b).
- de Jong et al. (2015) M. de Jong, W. Chen, T. Angsten, A. Jain, R. Notestine, A. Gamst, M. Sluiter, C. Krishna Ande, S. van der Zwaag, J. J. Plata, C. Toher, S. Curtarolo, G. Ceder, K. A. Persson, and M. Asta, Scientific Data 2, 150009 (2015).
- Bashkin et al. (2004) I. O. Bashkin, M. V. Nefedova, V. G. Tissen, and E. G. Ponyatovsky, Journal of Experimental and Theoretical Physics Letters 80, 655 (2004).