Synchrotron emission from nanowire-array targets irradiated by ultraintense laser pulses
Abstract
We present a numerical study, based on two-dimensional particle-in-cell simulations, of the synchrotron emission induced during the interaction of femtosecond laser pulses of intensities with nanowire arrays. Through an extensive parametric scan on the target parameters, we identify and characterize several dominant radiation mechanisms, mainly depending on the transparency or opacity of the plasma produced by the wire expansion. At , the emission of high-energy () photons attains a maximum conversion efficiency of for wire widths and interspacing. This maximum radiation yield is found to be similar to that achieved in uniform plasma of same average (sub-solid) density, but nanowire arrays provide efficient radiation sources over a broader parameter range. Moreover, we examine the variations of the photon spectra with the laser intensity and the wire material, and we demonstrate that the radiation efficiency can be further enhanced by adding a plasma mirror at the backside of the nanowire array. Finally, we briefly consider the influence of a finite laser local spot and oblique incidence angle.
pacs:
52.38.-r;52.65.Rr,81.07.Gfkeywords: relativistic laser-plasma interactions, particle-in-cell method, synchrotron radiation, nanowires
Introduction
Forthcoming multi-petawatt (PW) laser systems will enable scientists to access a new regime of laser-plasma interactions where radiative and quantum electrodynamics (QED) effects are strongly coupled with collective plasma processes [1]. On-target laser intensities in the range are expected to be reached at several facilitiesCILEX-Apollon [2], PULSER [3], ELI [4], Vulcan-10 PW [5] and XCELS [6], to name a few, opening up exciting applications in fundamental and applied research, such as radiation pressure ion acceleration [7, 8, 9], the study of quantum radiation reaction on laser-driven electrons [10, 11, 12, 13, 14], the massive production of electron-positron pairs through the Breit-Wheeler process [15, 16, 17, 18, 19, 20, 21], or relativistic laboratory astrophysics [22, 23, 24]. One fundamental mechanism common to all these applications is the copious generation of hard x-ray or -ray photons through synchrotron emission–equivalent to nonlinear inverse Compton scattering in the strong-field regime [25]. In recent years, experimental progress in this direction has been achieved by making ultrarelativistic electrons issued from a laser wakefield accelerator collide with an intense laser pulse [26, 27, 28, 29, 30, 31]. Furthermore, the capability of this configuration in yielding efficient pair creation at laser intensities has been numerically [32] and theoretically [33] examined.
The particle-in-cell (PIC) simulation technique [34] is the most widely used tool for modeling the kinetic and collective phenomena at play in intense laser-plasma interaction. Recently, in order to prepare for multi-PW laser experiments, much effort has been expended in enriching PIC codes with numerical models describing synchrotron emission and multiphoton Breit-Wheeler pair production [35, 36, 37, 38, 39, 40, 41, 42, 43, 44]. Such upgraded codes are being extensively exploited to gain understanding of the radiation-modified laser-plasma interaction in various parameter ranges. In uniform plasmas, several radiation regimes have been identified depending on the laser intensity and plasma density. Above the relativistic critical density, an electromagnetic standing wave is formed at the laser-irradiated target front; the resulting synchrotron radiation (referred to as skin depth emission, SDE [17]) is mainly emitted in a forward-directed cone, yet remains relatively weak (with a conversion efficiency at laser intensities ). In relativistically near-critical or undercritical plasmas, the radiation is predominantly emitted in the transverse (transversally oscillating electron emission, TOEE [45]) or in the backward direction (reinjected electron synchrotron emission, RESE [46]). The radiation yield has been found to be maximized in the RESE regime, with a conversion efficiency predicted at [47]. Strategies to enhance the synchrotron emission or improve its properties have been proposed, taking advantage of preplasmas [47], plasma channels [48, 49], or structured targets such as gratings [50], cone targets [19, 51, 52], clusters [53], micro-plasma waveguides [54], or nanowire arrays [55, 56, 57]. The purpose of the present paper is to further explore the potential of the latter target type for high-energy synchrotron radiation.
The realization of intense laser-driven synchrotron sources is but the latest application of nanowire (or nanotube) arrays. Originally, their use was aimed at strongly increasing the absorption of moderately relativistic () short-pulse lasers into fast electrons, which can then drive bright Bremsstrahlung or x-ray line emission [58, 59, 60, 61, 62]. Such targets also allow for long-distance collimated transport of the fast electrons as a result of self-induced electromagnetic fields [63, 64, 65]. Moreover, fast-electron relaxation causes rapid volumetric heating and homogenization of the nanowires, thus creating extremely hot dense matter samples. Formation of plasmas of densities and temperatures, associated with pressures of a few Gbar, has thus been inferred by x-ray emission at laser intensities [66, 67]. The increased number and mean energy of the fast electrons enabled by nanowire arrays coated on thin solid foils have also proven beneficial for accelerating ions in the target normal sheath acceleration regime [68, 69]. One should stress, however, that these experiments raise the key issue of the laser contrast, which, if too low, may prevent the laser light from penetrating the interwire gaps [70].
Along with the aforementioned experimental works, a number of PIC simulation studies have examined the dependencies of the laser absorption and fast-electron generation on the nanowire-array parameters [71, 72, 55, 56, 70]. These works suggest that the laser absorption can reach values as high as at and interwire spacings in the range. The possibility of triggering betatron electron acceleration in the superimposed laser and quasistatic fields around the wires has also been demonstrated under specific conditions (e.g., a laser pulse irradiating 60-nm-diameter wires) [55, 56]. These trends, revealed at relatively moderate laser intensities, make nanowire arrays promising setups for developing ultraintense synchrotron sources at extreme laser intensities, . Another argument in their favor is that the strong magnetostatic fields they give rise to (through the interplay of the fast electrons and the return current flowing inside the wires [73]) may, if sustained long enough, significantly enhance the synchrotron emission compared to that induced by the sole laser field. A similar scenario of synchrotron radiation boosted by quasistatic fields has been numerically evidenced in a plasma channel [48].
In the work reported here, based on 2D simulations performed with the PIC-QED code calder [42], we investigate the dominant processes of synchrotron emission and their properties as a result of the interaction of an ultraintense (), ultrashort () laser pulse with a nanowire array of varying geometry. Our paper is organized as follows. In Sect. 1, a reference scenario is presented, which considers a stand-alone nanowire array and serves to illustrate the main stages of photon emission. In Sect. 2, we perform a parametric scan where we vary the wire interspacing, width and atomic composition as well as the laser intensity. Our broad parameter range covers the transition from a regime where the structure of the nanowire array is maintained during the laser irradiation to a regime where it is destroyed early in the laser pulse, hence forming an essentially uniformized plasma. In addition, we compare the performance of nanowire arrays with that of uniform plasmas with varying density. In Sect. 3, we show that placing a solid foil at the backside of the nanowire array can notably increase the photon source efficiency (in case of significant laser transmission through the nanowires). Section 4 addresses the changes brought by a finite laser spot size and an oblique incidence angle. Finally, we summarize our results and suggest possible follow-up studies.
1 Main synchrotron emission processes in laser-nanowire-array interactions
1.1 2D PIC simulation setup
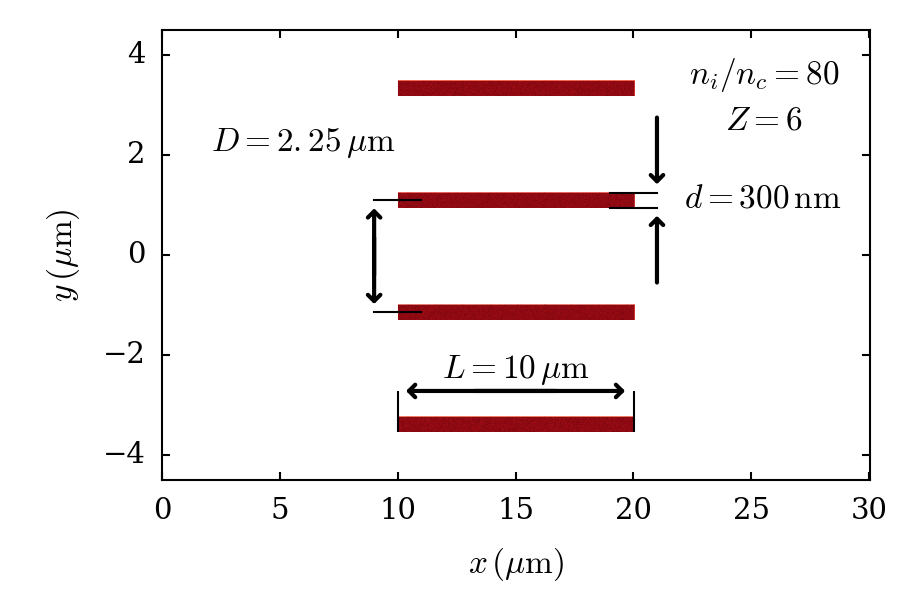
In this Section, we show that the synchrotron radiation proceeds through various stages during the interaction of an ultraintense laser pulse with a nanowire array. This is done in light of a reference 2D PIC simulation parameterized as follows. The laser pulse is modeled as a planar electromagnetic wave, propagating along the axis, linearly polarized along the direction and with a central wavelength . It has a Gaussian temporal profile with a FWHM duration of and a peak intensity (corresponding to a dimensionless field strength ). As depicted in Fig. 1, the target consists of a periodic array of solid-density carbon nanowires. The carbon atoms, of atomic number , and mass number , are initially unionized with an atomic density ( is the nonrelativistic critical density). The wires have a length , a width (diameter in 3D) and the interwire spacing is . The wire width is equal to that considered in Ref. [73], where it was shown to give rise to strong quasistatic fields at (for circular polarization). The absence of a substrate at the backside of the wires, which could absorb and reflect the laser pulse, allows us to isolate the effects induced by the sole wires. The simulation domain has dimensions , with a spatial resolution . The temporal resolution is (where is the optical cycle) and the simulation is run over . The boundary conditions are taken to be absorbing along and periodic along for both fields and particles, and macro-particles per cell and per species are used. The peak of the laser pulse hits the tips of the wires at time .
This illustrative simulation, as every other performed in this study, takes into account Coulomb binary collisions between charged particle species, field and impact ionization and synchrotron radiation. The synchrotron module implemented in calder [42] combines a continuous radiation reaction model [74] for electrons with a low quantum parameter () and a stochastic quantum description [37] for electrons with a higher quantum parameter (). We recall that the electron quantum parameter, which determines the radiation characteristics, is defined as , where is the electron velocity, its relativistic factor, is the magnetic field, is the electric field component parallel to , the electric field component normal to , and is the Schwinger field [1]. The chosen threshold value between the two regimes is quite arbitrary, yet ensures that the quantum regime is accurately described. Pair production from Breit-Wheeler and Bethe-Heitler processes is neglected. For this reason, and in order to reduce the computational load, the radiated photons are not advanced on the simulation grid (but their energy and emission angle are recorded).
1.2 Typical dynamics of the laser-nanowire-array interaction and its associated synchrotron emission
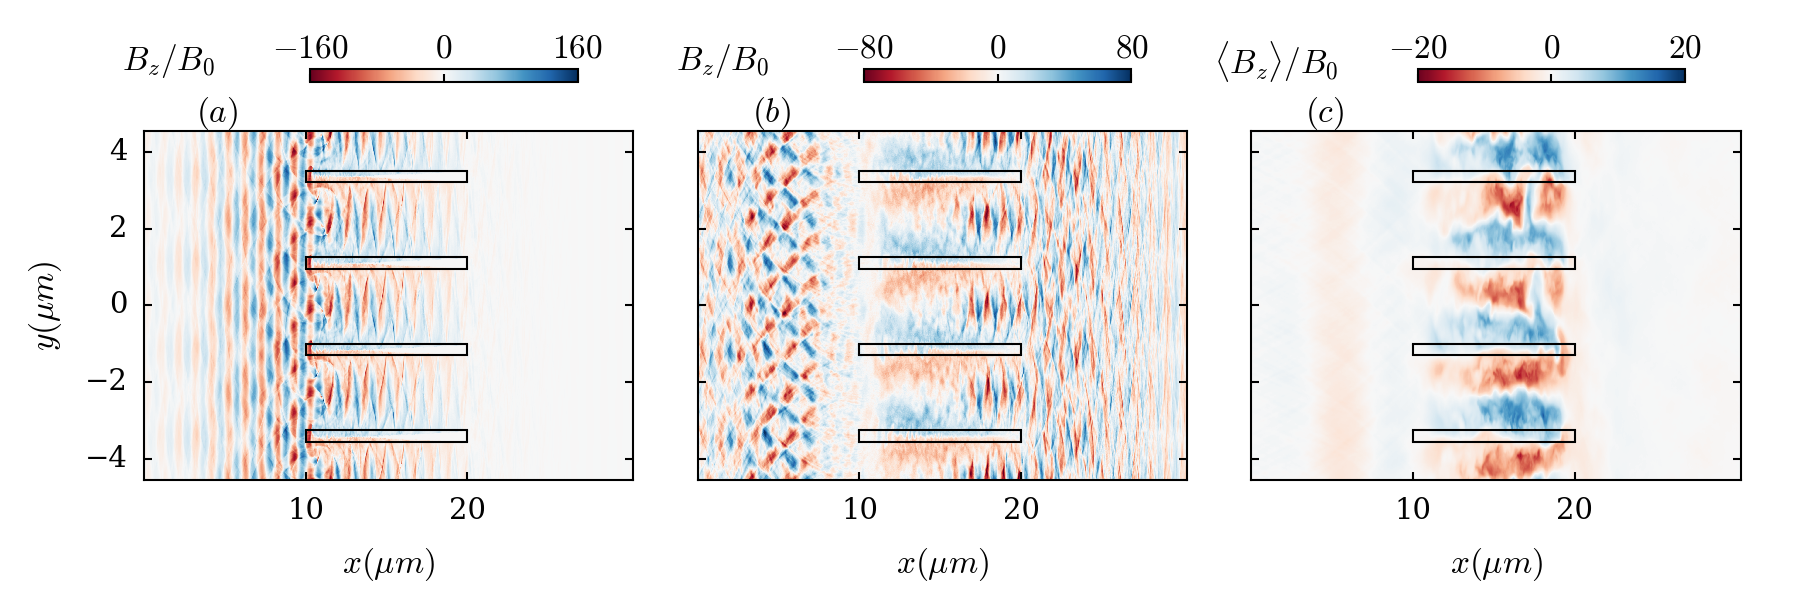
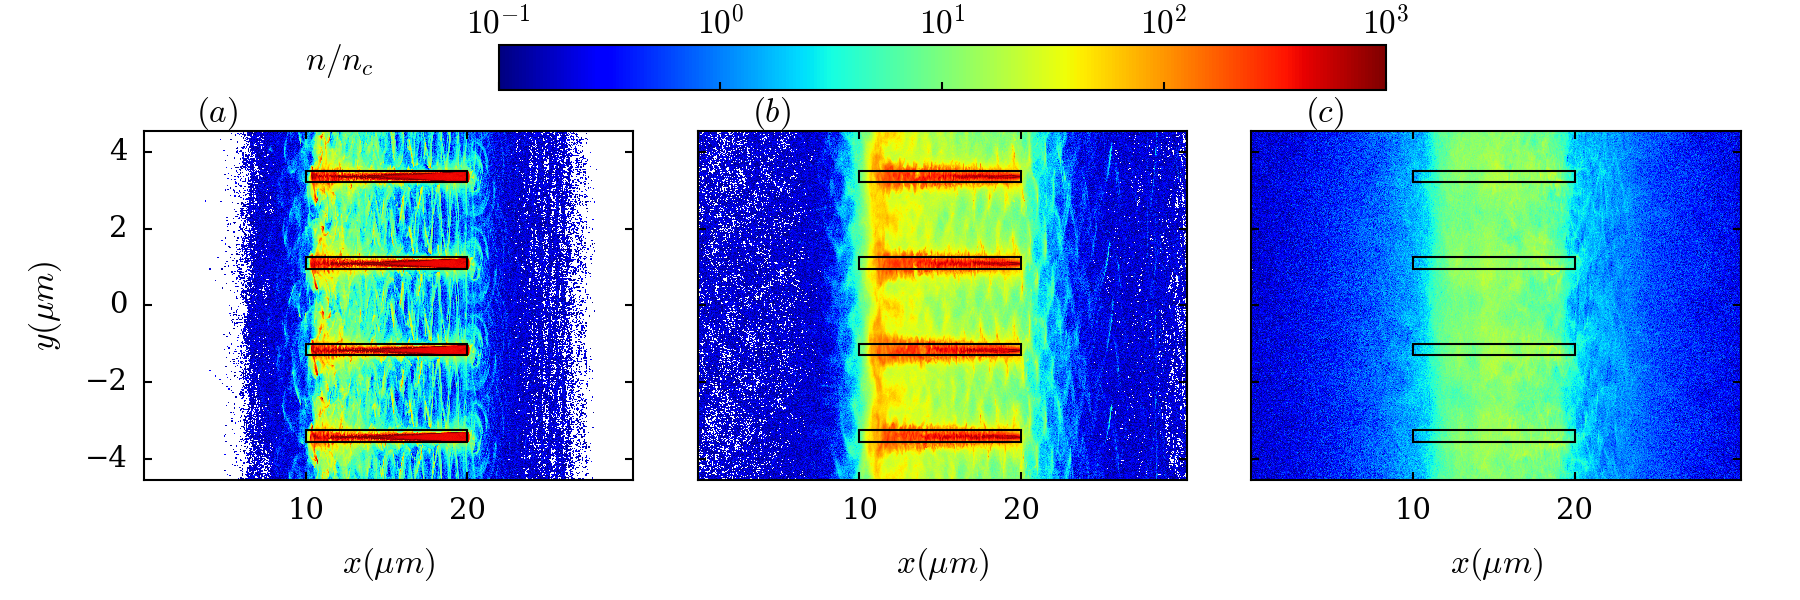
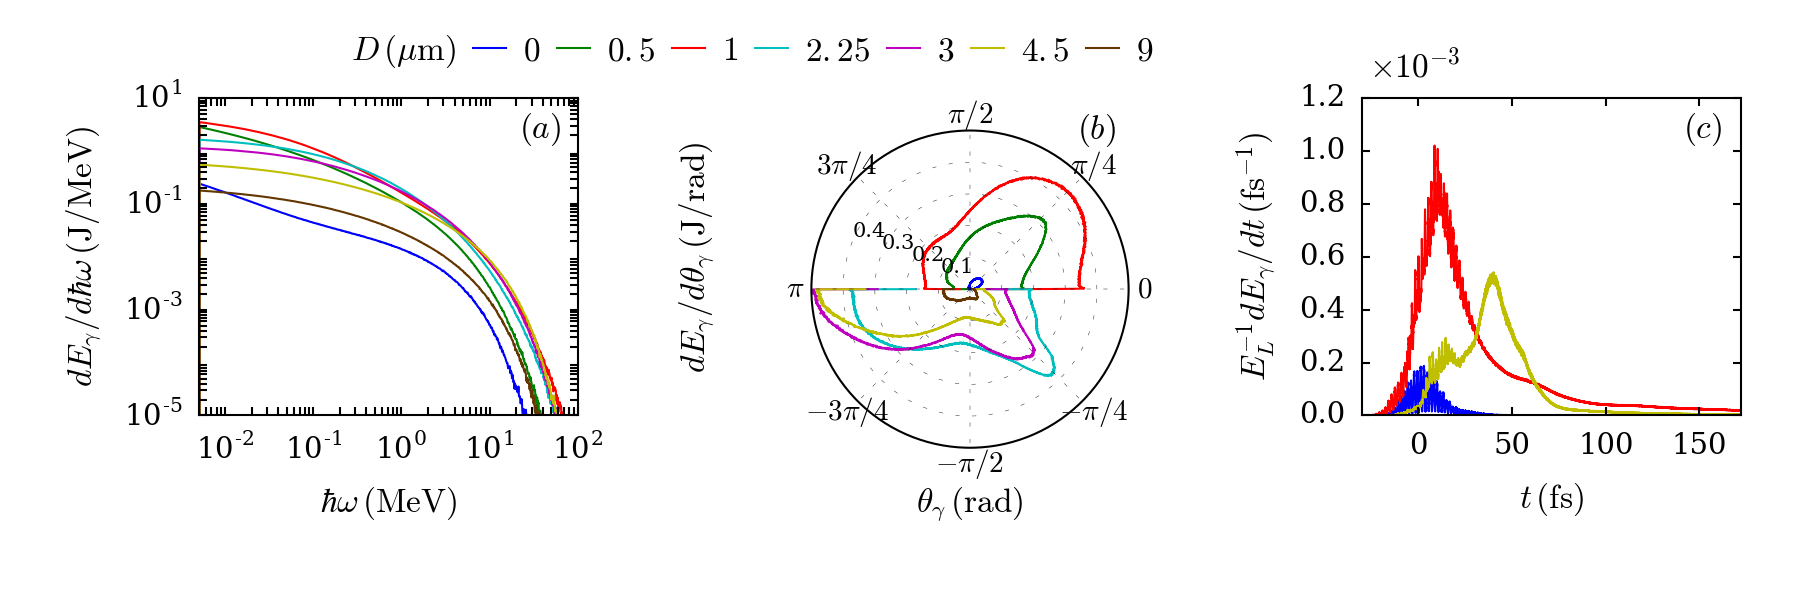
Figures 2(a-c) display maps of the magnetic field () at three successive times, visualizing the penetration of the laser wave through the interwire gaps and the generation of quasistatic fields. The magnetic field is normalized to (where is the electron mass, is the elementary charge, and is the laser angular frequency). The expansion dynamics of the wires is illustrated by the electron and ion density maps shown in Figs. 3(a-c). At the beginning of the interaction, the electrons are pulled over a distance from the wire surface by the component of the laser field, and accelerated in the forward direction by its component. As a result, the interwire gaps are filled with a population of energized electrons bunched at the laser wavelength . Figure 3(a) is recorded shortly after the on-target laser peak (), at which time the electron density in the interstices near the tips of the wires is of , i.e., approaches the relativistic critical density (see also Sec. 2.4). Figure 2(a) shows that, up to this time, the interstices have remained (partially) transparent to the laser wave. The hot-electron current flowing in the interstices induces a magnetostatic field that is screened inside the wires by a return current carried by bulk electrons (of density ). The amplitude of this field can be estimated by noting that the laser-accelerated electrons are initially extracted from a layer of thickness (assuming immobile ions and a balance between the transverse laser and space-charge fields). These electrons generate a magnetostatic field of normalized strength , with the mean longitudinal fast-electron velocity. One therefore expects the strength of the self-induced magnetostatic field to be comparable with that of the laser field, in agreement with the maximum value measured at the laser peak. At laser intensities (resp. wire width) high (resp. small) enough that , the number of electrons remaining inside the wires becomes lower than those expelled by the laser, so that current balance between the forward-moving hot electrons and the backward-moving core electrons [73] can no longer be maintained in the vicinity of a wire. In the planar-wave case under consideration, this leads to dropping with decreasing , from down to zero in the fully depleted regime ().
The magnetostatic field tends to deflect inwards the bulk electrons, resulting in the pinching of the wire cores [73]. This transverse magnetic compression occurs early in time, as shown in Fig. 3(a) where one can note a contraction of the wires compared to their initial position (solid black lines). Simultaneously, the space-charge sheath field transversely accelerates the ions from the outer wire regions, and hence an increasingly dense plasma progressively fills up the interwire gaps. At , the bulk electrons have expanded enough to form in the wire interstices a relativistically overcritical plasma () opaque to the laser light [Fig. 3(b)]. This causes the splitting of the laser pulse into a transmitted part and a reflected one, as seen in Fig. 2(b). The density modulations at the plasma surface arising from the incomplete homogenization of the wires account for the reflection interference pattern seen in front of the target. Given the relatively large interwire spacing considered here, the laser transmission across the target is significant (). Figure 3 shows that, by (about after the laser pulse has exited the simulation domain), the nanostructure has been completely homogenized, the ion density then tending to the average density .
Figure 2(c) plots the quasistatic magnetic field , averaged over an optical cycle, at . It demonstrates the relatively slow decay of the magnetostatic modulations sustained by the homogenized target electrons. At this instant, these modulations have a strength , which remains an appreciable fraction of the laser field, and a typical variation length of , leading to magnetization of electrons with up to energies, and therefore of the vast majority of the plasma electrons, of mean energy .
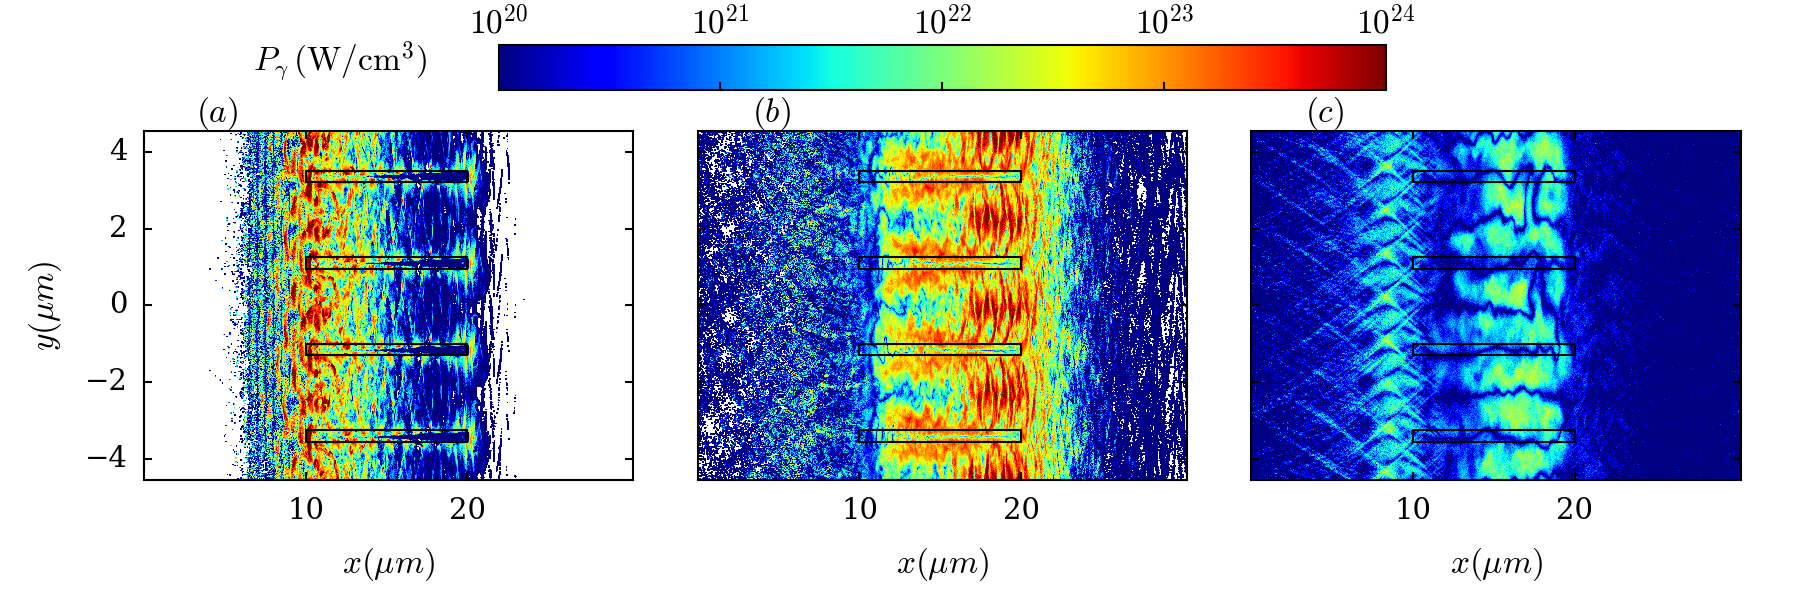
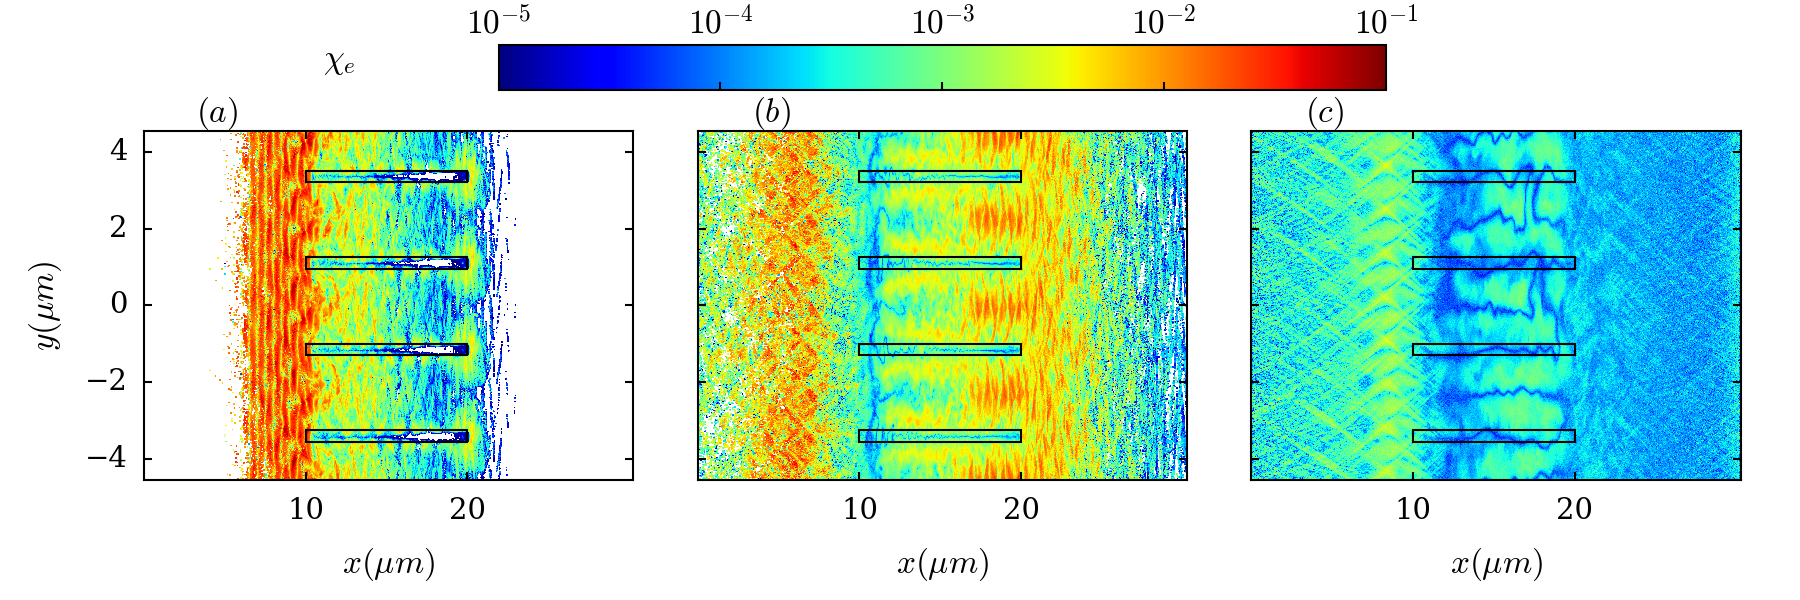
Let us now examine the synchrotron emission that takes place during and after the laser-nanowire interaction. To provide insight into the radiative processes, we plot the spatial distribution of the averaged (over the local electron distribution) radiated power density in Figs. 4(a-c) and of the averaged electron quantum parameter, in Figs. 5(a-c), at the same times as in Figs. 2(a-c). We remind that the power radiated by a single electron can be expressed as , with the Compton time, the fine structure constant, and a quantum correction [25]. The scaling is a good approximation in the classical regime (). These maps will help analyze the time evolution of the angle-resolved radiated power and the photon energy spectra (integrated over different time intervals) plotted in Figs. 6(a,b). The angle denotes the angle of the photon momentum relative to the laser axis (), i.e., .
Figure 6(a) indicates that the emission initially occurs in the laser direction () with an increasingly broad angular distribution. As expected, the emission strongly increases at the laser peak, and is at its brightest in the time period . Figure 6(b) shows that the spectrum radiated from the start of the interaction up to extends to , and makes up of the total radiated energy. The radiated power is then contained in a forward cone of half angle and is modulated at twice the laser frequency. This oscillation is typical of the synchrotron radiation from a relativistically overdense plasma layer in the SDE regime [75]. Consistently, Fig. 4(a), recorded at , shows that the emission then mainly occurs at the front side of the plasma (with electron density ) filling the wire gaps, where relatively high values are found. Deeper into the array (), the more dilute, -periodic electron bunches that move along the laser wave present a weaker quantum parameter, (due to compensating electric and magnetic forces), and hence emit little energy. Note, however, the relatively bright synchrotron spots at the right-hand tips of the wires, where space-charge fields deflect the electrons at an angle to the laser direction, hence increasing their quantum parameter (see below).
Figure 6(a) reveals that a secondary emission burst occurs in the time interval , when the transmitted laser pulse travels across the target backside. In contrast to the first emission burst, this emission takes place in the backward direction (). It originates from the interaction of the transmitted part of the laser pulse with the fast electrons reflected at the target backside by the space-charge field. Such a counterpropagating geometry maximizes the quantum parameter (where is the laser electric field). This mechanism is supported by Fig. 4(b), which shows a volumetric emission between (and near the backside of) the wires, where values of are reached [Fig. 5(b)]. About of the synchrotron yield is radiated during this stage (with maximum photon energies , similar to those in the primary stage). Of course, this phenomenon will be altered in the presence of a substrate coated at the target backside (see Sec. 3). We note that relatively high values () are also reached in the dilute plasma formed in front of the target, yet the electron density, [Fig 3(b)] is there too low to yield significant emission.
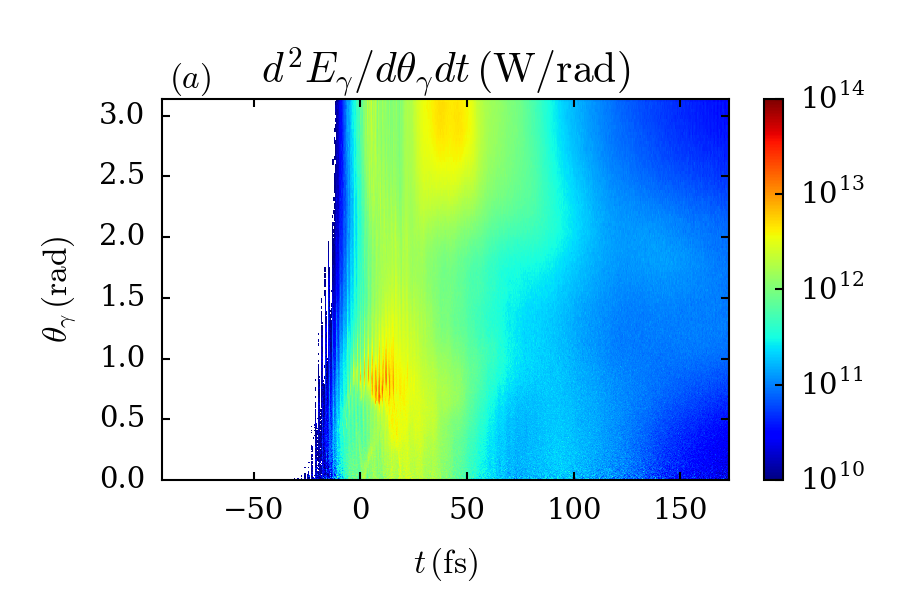
Following the laser irradiation (), the radiated power strongly drops, yet, in similar fashion to Ref. [48], the remaining magnetostatic fields can sustain additional radiation [Fig. 6(a)]. Figure 5(c) thus indicates that, at , attains values in the magnetic modulations. The weaker power radiated at such low values [Fig. 4(c)] is partially compensated for by the longer duration of this emission stage, which makes up of the total yield in the time period [Fig. 6(b)]. Since the magnetostatic fields build up early in the laser irradiation, their contribution is a priori not limited to the final times of the simulation. Yet their effect is initially mitigated by the transverse electrostatic field () around the wires, which tends to weaken the quantum parameter; as the wires radially expand and mix [Fig. 3(c)], however, diminishes and becomes small compared to , so that . At , we have and a mean electron energy in the expanded plasma, which implies , consistent with Fig. 5(c).
Our reference simulation has allowed us to pinpoint important processes affecting the synchrotron radiation in the interaction of a femtosecond laser pulse with a nanowire array of micron-scale interspacing. We will now examine the dependencies of the emission on the wire and laser parameters.
2 Parametric scan on the nanowire parameters and the laser intensity
In the following, we explore the dependency of the angle-energy spectra of the synchrotron radiation on the nanowire spacing (), width () and material (), as well as on the laser intensity (). Except for the varied parameter, the numerical setup is identical to that presented in Sec. 1.1. Our parametric scan will encompass various regimes of synchrotron radiation, which will be interpreted in light of the processes revealed in the reference case of Sec. 1.2 and previous simulation works [71, 46, 55, 56].
2.1 Variation of the interwire spacing: from forward to backward directed radiation
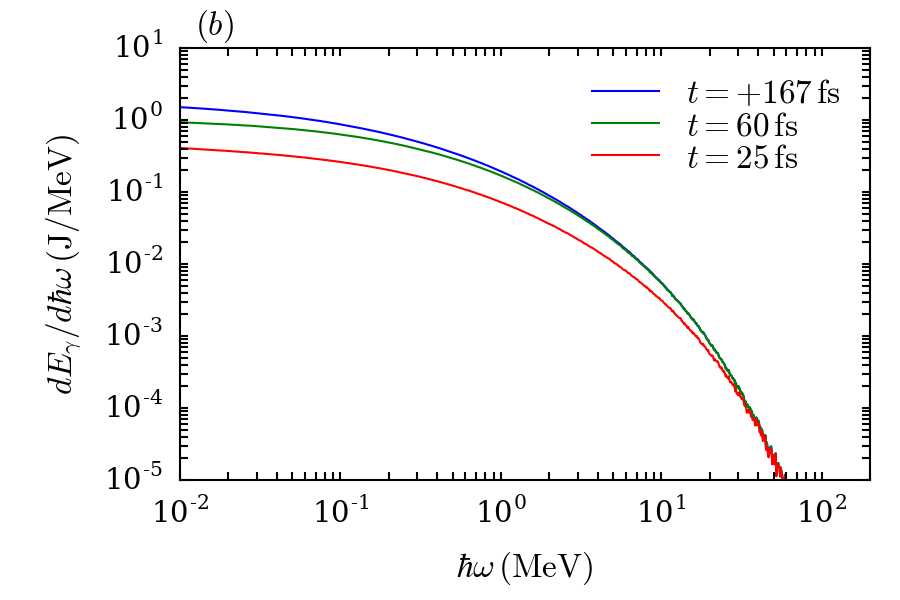
In our simulations, the interwire spacing has been varied over the set of values . Note that corresponds to a planar target. The chosen values exactly divide the transverse size of the domain () so as to keep the periodic condition valid. The other target parameters are set to , , and the laser intensity is .
The energy-resolved photon spectra recorded for various interwire spacings are plotted in Fig. 7(a). We see that the cutoff photon energy weakly varies for , where it reaches a maximum value , approximately twice that found at uniform density (). Figure 7(b), which displays the angle-resolved enery spectra, shows a transition from a mainly forward-directed emission at to an increasingly backward-directed emission at larger spacings. The two lobes of emission found at around the directions and originate from the same mechanisms discussed in Sec. 1.2. In particular, we emphasize that the backward emission follows from the electrons refluxing in the direction and colliding head-on with the transmitted part of the laser pulse. This results in a secondary backward-directed -ray burst after the primary (and weaker) forward-directed burst. This is evidenced in Fig. 7(c) where is plotted the time evolution of the radiated power: the curve at presents two distinct emission peaks, the second, brighter one taking place at , i.e., as the laser pulse exits the target.
At narrower spacings (), the interstices fill up with opaque plasma increasingly early before the laser pulse maximum. Looking at the increase in the instantaneous laser reflectivity, we find that the transparency-opacity transition occurs at for and for . The energy fraction and mean intensity of the transmitted light then diminishes with decreasing , which greatly weakens the aforementioned backward emission mechanism. At , about of the laser energy is transmitted, and this fraction becomes negligible for . The time history of the radiated power at , plotted in Fig. 7(c), thus presents a single maximum, ocurring at , just after the overdense plasma filling of the vacuum gaps. The primary radiation burst observed at occurs approximately at the same time: both signals exhibit a modulation, characteristic of SDE in an overcritical plasma [75]. The photons are then emitted in a large forward cone, as seen in the upper part of Fig. 7(b).
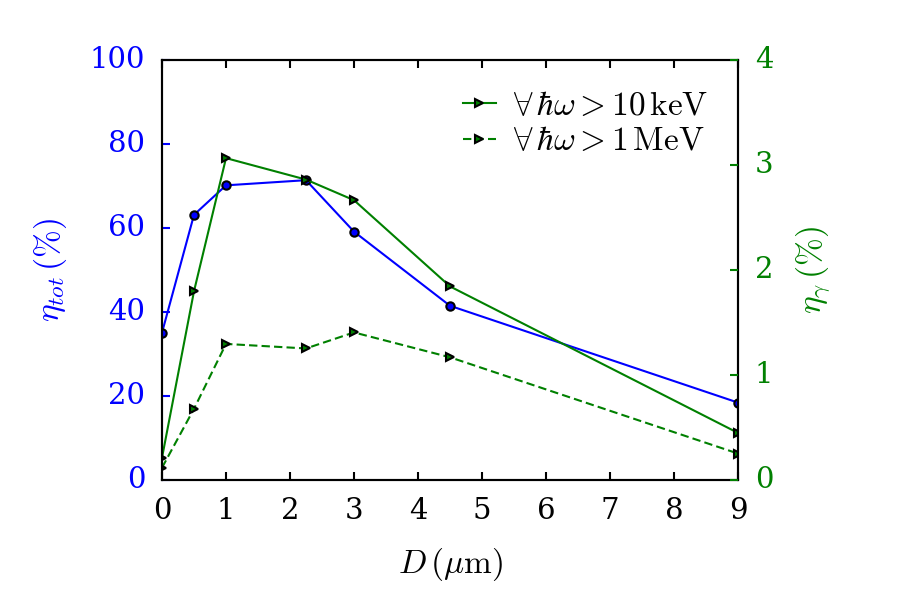
As pointed out in the Introduction, the interest for nanowire targets as potentially efficient radiation sources arose from their well-established capability in yielding high laser absorption fractions. Since the latter usually translate in large numbers of energetic electrons, it is tempting to predict that the laser absorption and radiation yield are correlated. To check this scenario, we plot in Fig. 8 the variations of the total absorbed laser energy fraction (, defined as the energy absorbed by all the particle and photon species, normalized to the laser energy) and the laser-to-photon energy conversion efficiency () with the interwire spacing. To discriminate between the contributions of the ‘low’ and ‘high’ energy photons in the radiation yield, the green solid and dashed curves are computed applying lower-energy cutoffs and , respectively. We note that the laser absorption rises from at uniform solid density to at , with a plateau above in the range . While the and curves look similar, a few quantitative differences are discernible. Both curves starting from very low values ( for and for ) at uniform solid density, they present a steeper rise at low values () than . Also, attains its maximum (, for ) at , lower than the value optimizing . For , we find in a broader range of interwire spacings, , with a weakly pronounced optimum at .
The overall evolution of the total laser absorption, as depicted in Fig. 8, is consistent with the results obtained in Ref. [71] at lower laser intensity () and in the sub-micron range (with ). In our work, by considering larger interwire spacings, we allow greater fractions of the laser light to be transmitted through the target, thus enabling the secondary radiation burst at the target backside discussed above. Moreover, in the laser intensity range , it is commonly believed that increasing the wire spacing enables the electrons to reach higher energies [76, 56, 70]. Our results partially corroborate this behavior at : the mean energy of the electrons above is found to increase from at to at . At larger spacings, , the mean hot-electron energy is found to saturate at , relatively close to the ponderomotive scaling [77, 78].
To summarize, we have identified two distinct regimes of synchrotron radiation by varying the interwire spacing. For narrowly spaced wires (), the vacuum gaps rapidly fill up with overdense plasma before the on-target laser peak, causing the emission to be concentrated at the target front and mainly forward directed, similarly to what occurs in a uniform overdense plasma. At larger interwire spacings (), this mechanism is progressively superseded by an additional emission taking place at the target backside, which results from the interaction of the transmitted laser light with the refluxing fast electrons. This backward-directed emission is distinct from the RESE mechanism highlighted in Ref. [46], which occurs at the moving laser front in relativistically underdense plasmas. To achieve the dilute plasma conditions required by the latter mechanism during the laser pulse, the wire width must be reduced, as is done in the next Section.
2.2 Variation of the wire width: from RESE to SDE, through TOEE
We now set the interwire spacing to the value maximizing the radiation efficiency, , and vary the wire width in the set of values . Note that the value corresponds to a uniform solid-density target. The resulting energy-angle photon spectra and radiation dynamics are displayed in Fig. 9(a-c).
For , most of the electrons are expelled from the wires by the laser field, hence leading to fast (i.e, before ion expansion) homogenization of the plasma profile at the average density . For , one has , which falls into the regime of relativistic self-induced transparency (RSIT). Such plasma conditions have been shown to favor the RESE process [46]: the electrons, pushed by the ponderomotive force at the laser front, are periodically reinjected back into the laser wave by the charge separation field. Their momentum () then forms an angle of with the laser wavevector, which maximizes the quantum parameter and the subsequent synchrotron radiation in the backward direction. Figure 9(b) confirms this prediction, showing that practically all the radiation is then directed backwards. In Fig. 9(c), we observe a temporal modulation of the radiated power at a period of , of the same order as the theoretical estimate derived for RESE in uniform plasmas [46]. This period is significantly larger than that of the oscillations arising in the SDE regime (see the curve with , corresponding to ).
As discussed below [see Fig. 15(a) in Sec. 2.4], we have checked the occurrence of RSIT by measuring the effective propagation velocity of the laser front in the homogenized plasma, in similar fashion to Ref. [79]. RSIT is found to occur for , thus leading to significant laser transmission across the plasma. For wire widths , the homogenized plasma becomes opaque to the laser light, which then propagates at a much reduced speed through hole boring (HB) [79].
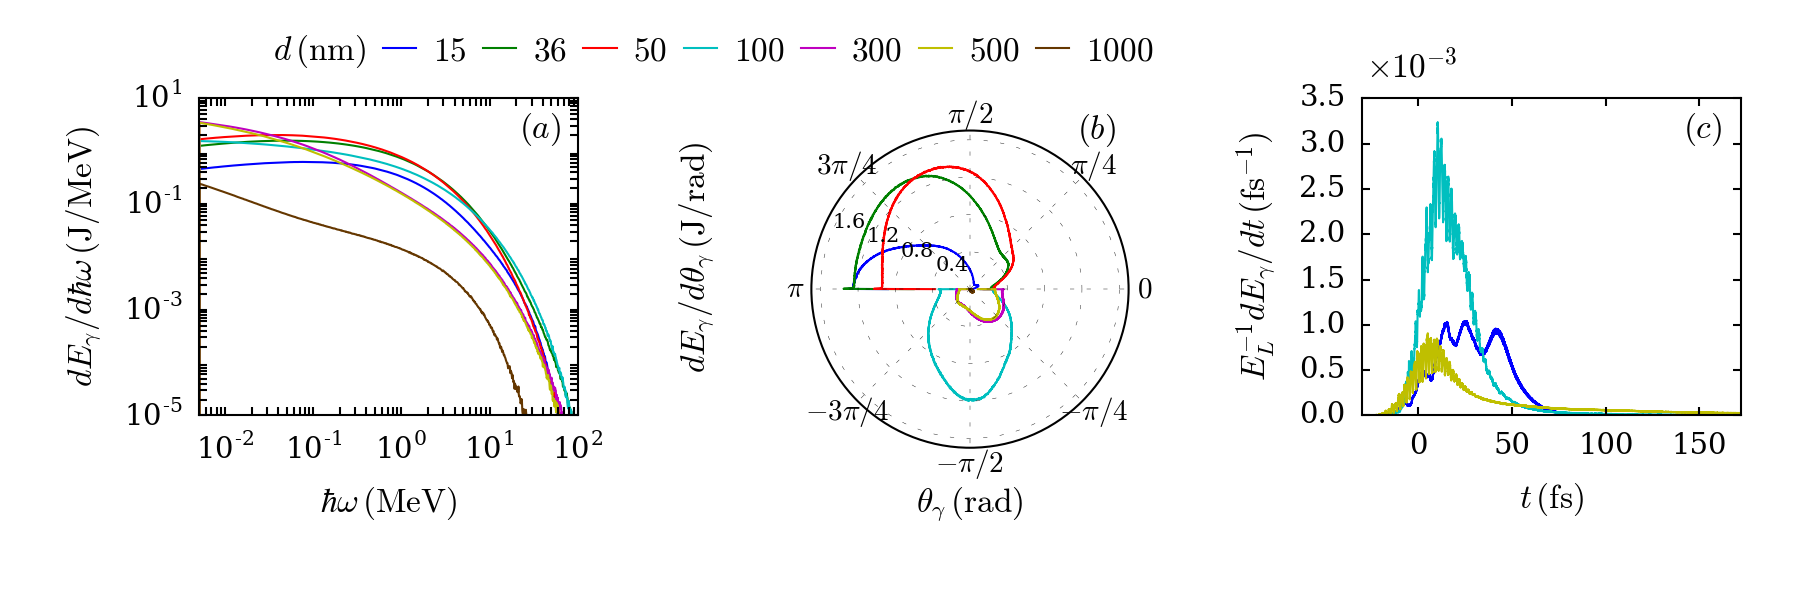
The synchrotron spectra of Fig. 9(a) show that the maximum photon energy weakly varies (), and in a non-monotonic way, for . The most notable variation occurs when the wire width is increased from to , leading to decreasing from to . More interestingly, it is found that the mean photon energy is maximized in the RSIT regime: for , we obtain , much higher than for , which leads to a relativistically overdense homogenized plasma () and .
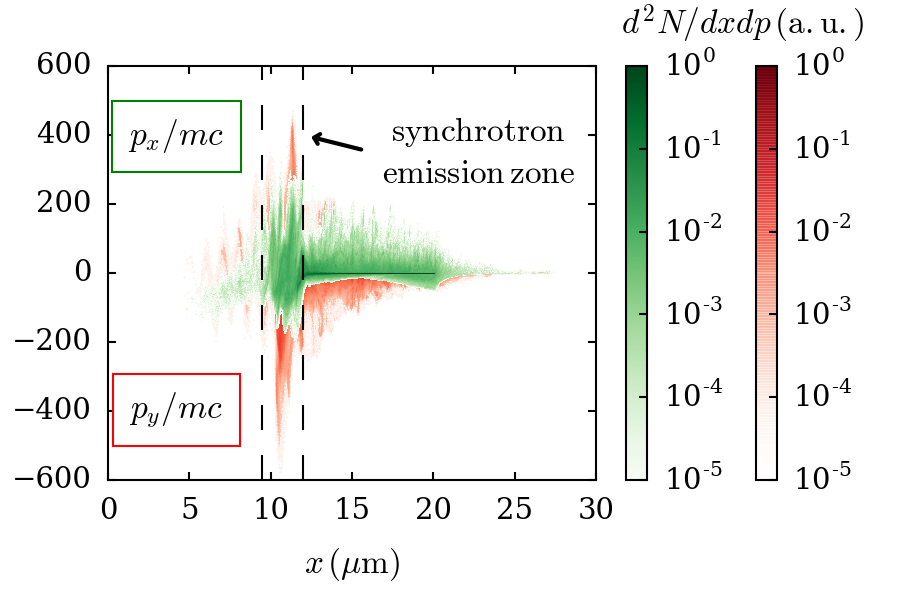
The case of , close to the RSIT/HB threshold, yields the highest maximum photon energies [Fig. 9(a)] but also, and more significantly, to a radiated energy concentrated in the transverse direction, [Fig. 9(b)]. This particular radiation pattern corresponds to the TOEE regime evidenced in Ref. [45]. In this mechanism, a balance is established between the laser ponderomotive force and the charge-separation field at the irradiated plasma front. This causes the electrons to predominantly oscillate in the transverse plane, thus inducing a mainly transverse synchrotron emission. This particular electron dynamics stands out in Fig. 10, which superimposes the (green colormap) and (red colormap) electron phase spaces at . Around the front side of the target where most of the radiation is emitted, the electron distribution is clearly more extended in the transverse direction than in the longitudinal direction. As the wire width is decreased (resp. increased) from , the radiation pattern is shifted to the backward (resp. forward) direction, characteristic of the RESE (resp. SDE) mechanism.
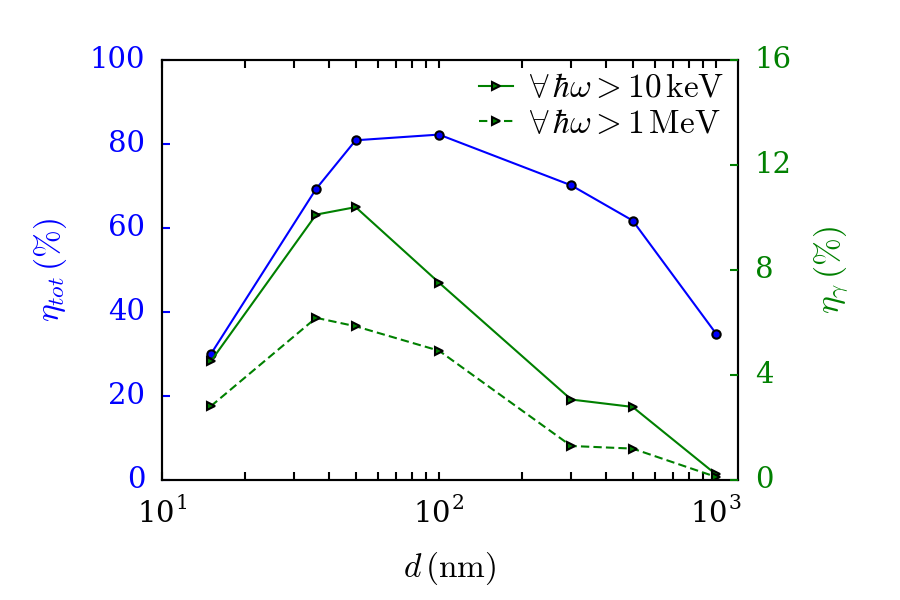
Figure 11 displays the wire-width dependence of the total laser absorption () and radiation conversion efficiencies () into and energy photons. The laser absorption rises from at to a maximum of at , before dropping to in the uniform-density case (). While the increase in at low wire widths is accompanied by similar rises in the curves, the latter attain their maxima (at ) slightly before . A peak value of (resp. ) for (resp. ) is obtained at (resp. ). Moreover, the two curves show a faster decrease at large than . To quantify this, let us compare the cases of and : although both widths give rise to similar absorption fractions (), the photon yield at is times larger than at . This marked difference follows from the distinct plasmas produced by the electron-depleted exploding wires: at , a relativistically undercritical plasma () forms, which triggers a RESE-type mechanism more efficient than SDE that arises in the overcritical plasma () generated at . Finally, we note that at , a sizable fraction () of the laser energy is transmitted across the array, which mechanically reduces the radiated energy fraction.
2.3 Changing the ion mass and the laser intensity
We now demonstrate that modifying other key parameters of the interaction such as the wire material or the laser intensity can also enable switching between the previously discussed radiation mechanisms. To this goal, we first replace, in the most efficient configuration for -ray production (, ), the neutral carbon atoms () by either copper ions () with a initial ionization degree and a solid density , or gold ions () with a initial ionization degree and a solid density . Second, we vary the laser intensity in the range for two values of the wire widths: and .
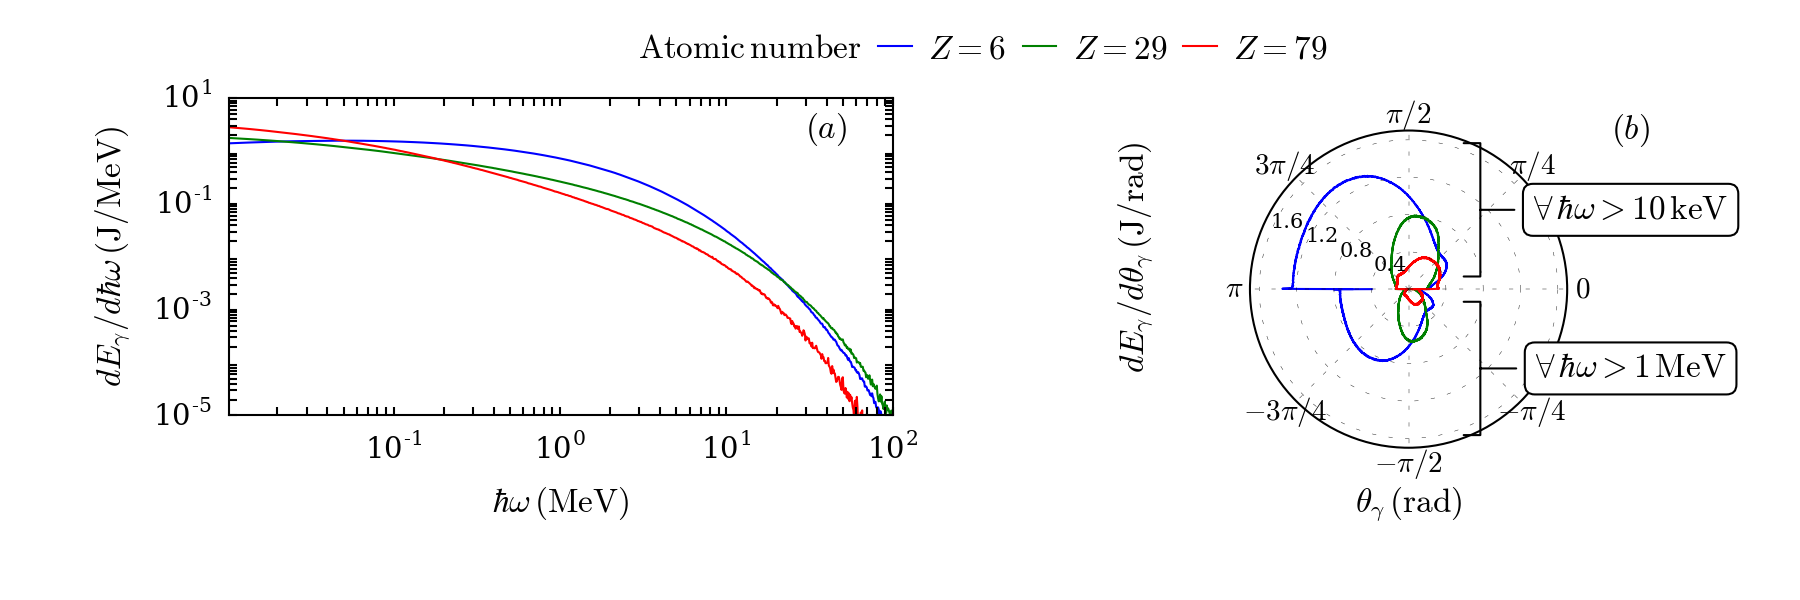
The energy-resolved radiated energy displayed in Fig. 12(a) indicates that the average photon energy is decreased by the use of copper () and gold () compared to carbon (). The radiation efficiency above also drops with increasing atomic number (from in carbon to in copper and in gold), in spite of a slightly enhanced laser absorption in copper and gold () than in carbon (, see Fig. 11). In light of our previous results, the reason for this difference is that the homogenized electron density () in the carbon wires lies in the RSIT regime, prone to RESE. In contrast, the copper (resp. gold) wires produce a higher-density plasma, (resp. ), opaque to the laser field, which favours TOEE (resp. SDE). This transition from RESE to SDE through TOEE is supported by the angular radiation patterns shown in Fig. 12(b): both for the and photon energy thresholds, we clearly see that the emission evolves from a mainly backward radiation in the carbon target to a predominatly transverse radiation in copper and to a forward directed radiation in gold.
In the gold case, we observe ionization rates up to at the laser-target interface, consistent with Ref. [67] where a similar setup is numerically considered. Also, the synchrotron photon yield above () is about of the yield above , similarly to the carbon and copper targets. Although this performance is not optimal due to too dense a homogenized plasma, it can be put in perspective with the record conversion efficiency into photons which has been recently reported using gold nanowires driven by a , laser pulse [62]. Rather than synchrotron emission, x-ray radiation in this experiment is caused by atomic physics processes (atomic line emissions, photorecombination and Bremsstrahlung). Another difference with our study is that, due to lower laser intensity, and hence slower nanowire expansion, the highest x-ray yield is found for significantly smaller interspacings (). The measured x-ray yield, however, rapidly drops with increasing photon energies (below for ). These results should stimulate further theoretical work on the radiation efficiencies of atomic physics and synchrotron processes as functions of the laser and nanowire parameters.
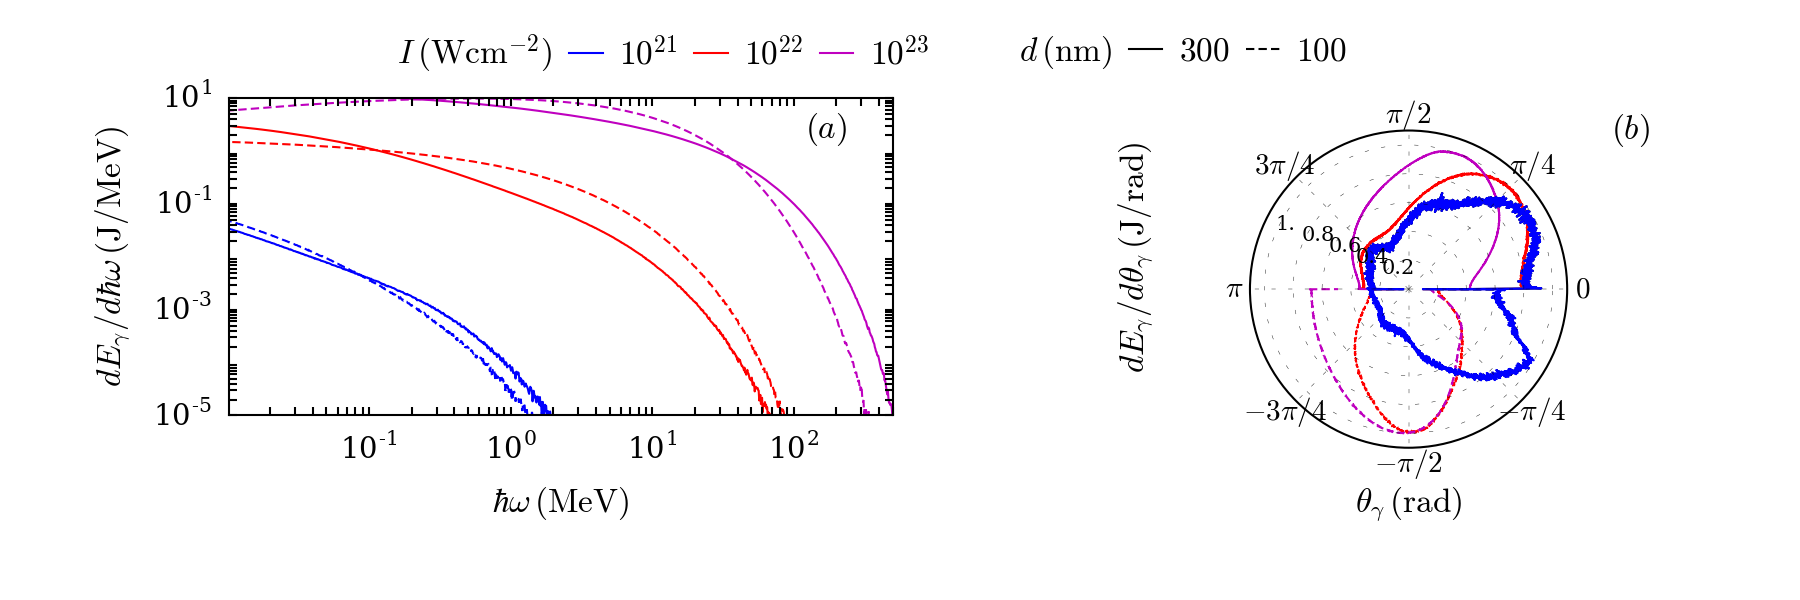
We now return to carbon nanowires and examine the photon distributions produced in the laser intensity range . Figure 13(a) reveals that the photon generation at occurs with the same efficiency for the two chosen values of the wire width, (dashed lines ) and (solid lines ). The case of , however, leads to higher maximum () and average () photon energies. At higher intensity (), by contrast, the average photon energy is much larger at than at ( vs. ). This stems from the fact that the expanded plasma then becomes relativistically transparent, whereas it remains opaque at (even at . Furthermore, the fraction of laser energy converted into photons is always higher at whatever the laser intensity in the studied range.
In Fig. 13(b), it is seen that the emission cone angle increases with increasing laser intensity. While at the radiation remains forward-directed up to , at it is forward directed at , becomes concentrated in the transverse direction at , and is mainly confined within angles at . Once again we stress that this evolution from SDE to RESE results from the onset of RSIT at high enough laser intensity. In the latter case, the radiation is mostly carried by -ray photons: the radiation conversion efficiency above indeed reaches , hardly lower than the conversion fraction in photons.
Since the radiation power should scale approximately as , it is worthwhile to inspect the variations of the mean hot-electron energy (counting all electrons above ) as a function of the laser intensity. Figure 14(a) plots for the wire widths (green triangles) and (blue circles). Both curves are consistent with an approximate scaling , quite close to the fit , reported at lower intensities () in Ref. [72]. The fact that roughly obeys the well-known ponderomotive law [77] is not a priori obvious given the various heating mechanims possibly at play in the nanowire array: from Brunel-type acceleration at the wire walls to stochastic heating in the interference field pattern inside the vacuum gaps, and ponderomotive acceleration in the homogenized plasma. It should be noted that the acceleration of super-ponderomotive electrons was recently demonstrated in the case of a nanowire array with and , driven at [76]. The main difference between this work and ours is the plasma-filling time of the interstices: the large interspacing in the experiment allows the laser to efficiently propagate between the wires, and energize electrons via the so-called direct laser acceleration mechanism [76]. In our case, such an efficient laser penetration is hampered by the fast homogenization of the nanostructure front, due to the comparatively lower interspacing investigated (at , the fraction of energy transmitted across the target is ).
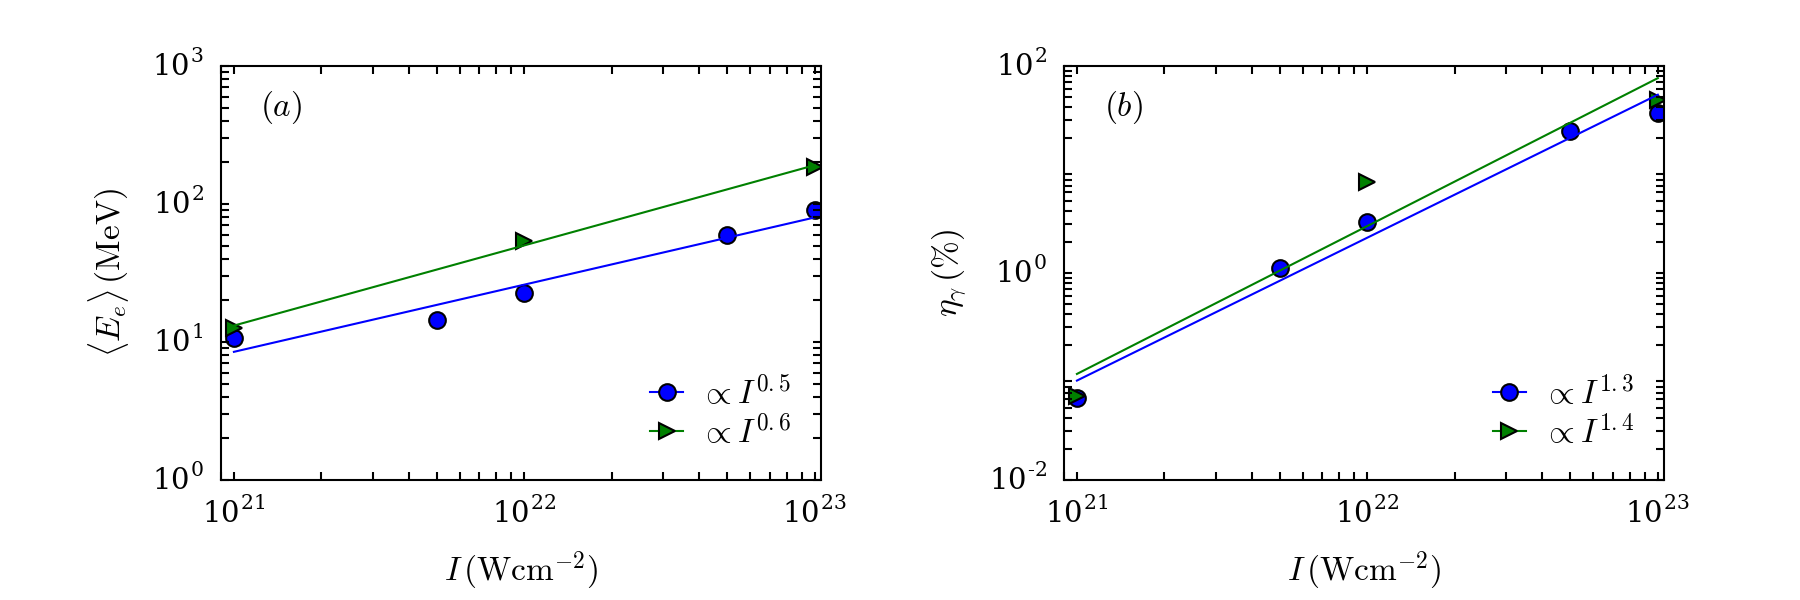
In Fig. 14(b) is plotted the radiation conversion efficiency (counting all photons above ) as a function of the laser intensity. The results can be approximately fitted to . This scaling happens to fall in between the one found at undercritical densities in the RESE regime, [46], and the one observed at overcritical densities in the SDE regime, [80]. This behavior could be expected since both radiation regimes can arise in our broad intensity range. Regarding the radiation efficiency, these two mechanisms mainly differ in the typical number of radiating electrons (). In the underdense plasma, this number is proportional to the areal density crossed by the laser, ; in an overdense plasma, this number scales as the areal density of the compressed electron layer at the target front, . Since and , we thus expect for RESE and for SDE.
2.4 Comparison with uniform-density targets
The dominant radiation processes that we have highlighted in nanowire arrays appear similar to those identified in previous simulation studies considering uniform plasmas. This is so because, under the present interaction conditions, the nanostructure is largely smoothed out during the laser pulse, so that a large part of it experiences a significantly homogenized plasma. One may then question the advantage, regarding synchrotron radiation, of using nanowire arrays compared to uniform plasmas at sub-solid densities. To answer this question, we have conducted a set of simulations considering a -thick carbon layer of uniform (free electron) density varying from to (solid density). This density range corresponds to that achieved in fully homogenized nanowire arrays () when increasing the wire width from to at fixed spacing . The laser intensity is set to .
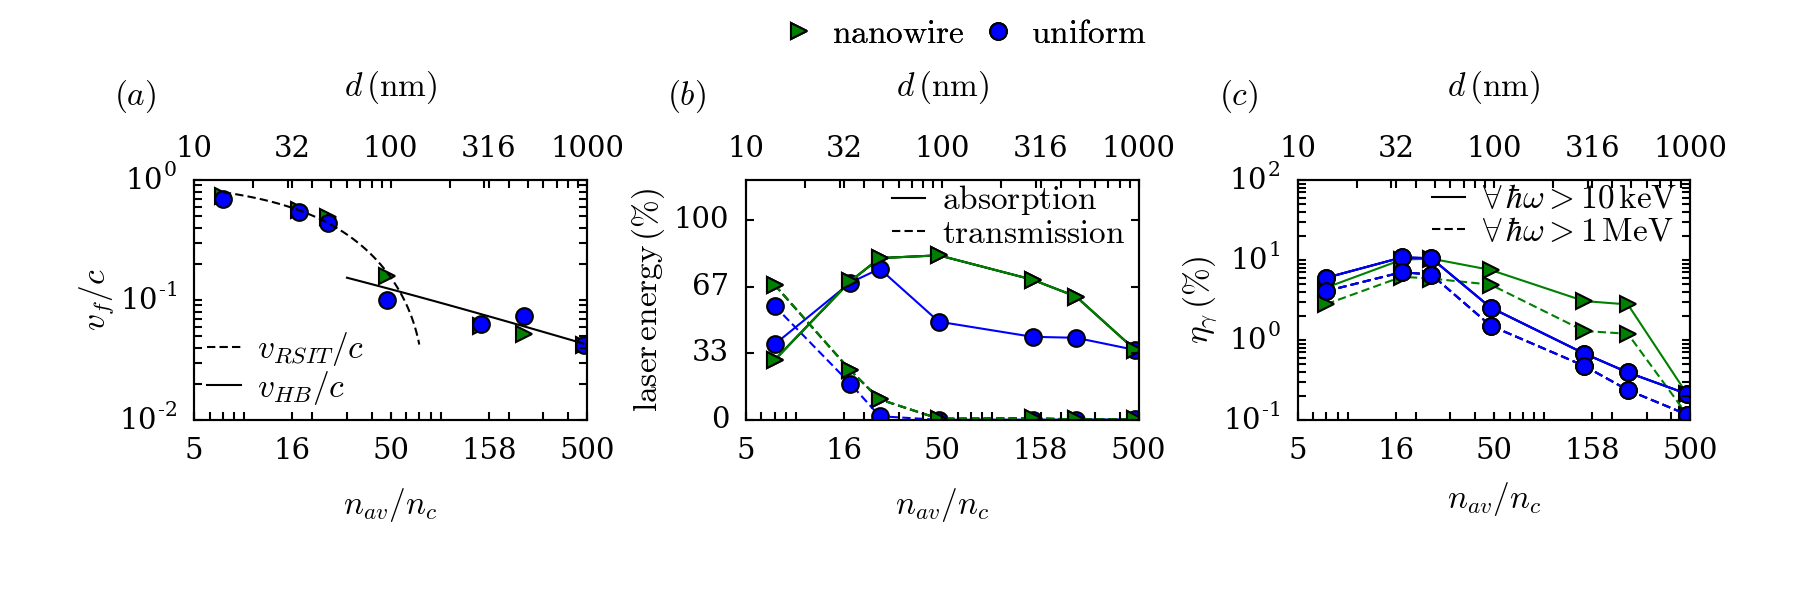
First, we examine the transition between plasma transparency (RSIT) and opacity (HB), which appears critical in determining the properties of the synchrotron emission. To properly identify the regime of laser-plasma interaction, we have tracked the position of the laser front in the target, , defined such that , with being the -averaged dimensionless laser field. This definition is similar to that used in Ref. [79] except that, due to our short pulse duration, we use instead of as is relevant to a semi-infinite pulse. For each simulation, is evaluated from a linear regression fit of . Figure 15(a) plots as a function of the wire width () in the nanowire-array case, and of the electron density () in the uniform-plasma case. Both target types lead to a similarly decreasing curve for , which drops from at down to at . This parameter range corresponds to RSIT, and we have further checked that the laser wave then overlaps with the plasma electrons and ions, as expected [81]. Nanowire arrays tend to yield slightly faster laser propagation, which is ascribed to inhomogeneity effects. For completeness, we have plotted (as a black solid line) the front velocity estimated in Ref. [79] in a simpler setting (1D geometry, semi-infinite pulse, no synchrotron losses), , where in the ultrarelativistic regime. Despite the short duration and time-varying intensity of our laser pulse, correct agreement is found between and up to (or ), where the transition from RSIT to HB occurs, also corresponding to the transition threshold between RESE and SDE [see Figs. 9(b) and 10]. At higher or , the front velocity approximately matches the theoretical HB velocity (black dashed line), , where [79].
In Fig. 15(b) are plotted the absorbed and transmitted laser energy fractions as functions of the wire width () in the nanowire-array case, and of the plasma density () in the uniform-target case. Similarly, Fig. 15(c) plots, for both target types, the variations with and of the conversion efficiencies into and photons. In uniform targets, the laser absorption strongly increases (from to ) with increasing density in the range . Similar variations are found in nanowire arrays with same equivalent density (i.e., ), with the differences, however, that is a bit smaller () at , but larger () at . In this parameter range, the interaction takes place in the RSIT regime in both targets, yet the transmitted laser fraction is always a bit larger in nanowire arrays, reaching at and at ). The most pronounced difference between the two target types arises at larger or : while the laser absorption in uniform targets abruptly drops beyond , (down to at , and at solid density), it stays at a high level () up to (i.e., ).
The general trends observed for the laser absorption also hold for the synchrotron radiation. While uniform targets yield slightly better radiation efficiencies at ( vs. , for ), both setups give very similar maximum efficiencies, (resp. for (resp. ) in the range (i.e., ). The robustness of the laser absorption enhancement in nanowire arrays is accompanied by a similar robustness of the radiation efficiency, which remains relatively high, (resp. ) for (resp. ) up to (). By contrast, the radiation yield from uniform targets decreases rapidly after its maximum: drops by a factor when is increased from to , and falls below for .
If we restrict our analysis to the forward radiation (), we find that the highest yield into photons () is provided by a nanowire array of width , yet with little variation () in the range. Also, the highest yield into photons is observed for (), with variation in the range.
3 Radiation enhancement by a reflective substrate
We now investigate whether a more realistic setup, whereby the nanowire array is coated on a solid-density substrate, may substantially improve the synchrotron process. The rationale for this is that, for the parameters (carbon wires with and ) previously found to yield the highest radiation efficiencies (), a sizable fraction of the laser energy (e.g., at ) shines through the target via RSIT. Making this transmitted light reflect off a plasma mirror so as to interact with the hot electrons filling the nanowire array could sustain the synchrotron emission, and hence increase its efficiency.
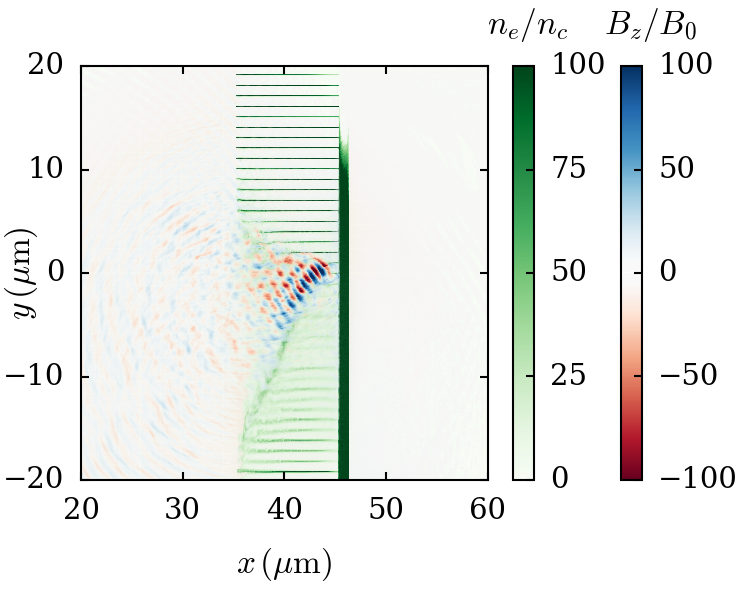
To test this scenario, we have performed a simulation in which a -thick copper foil is placed at the backside of a carbon wire array with , and . The Cu ions are initialized with charge state and a density . As before, collisional and field ionizations are described. The laser pulse maximum () strikes the Cu foil at . For this simulation only, the -ray photons () are advanced (ballistically) on the simulation domain. The evolution of their density is depicted in Figs. 16(a,b). At [Fig. 16(a)], the wires have rapidly expanded (in the leading edge of the laser) to form a relativistically underdense plasma (), in which synchrotron emission occurs volumetrically mainly through RESE, as analyzed in Sec. 2.2. At [Fig. 16(b)], high-density () photon bunches are seen to radiate from the target backside.
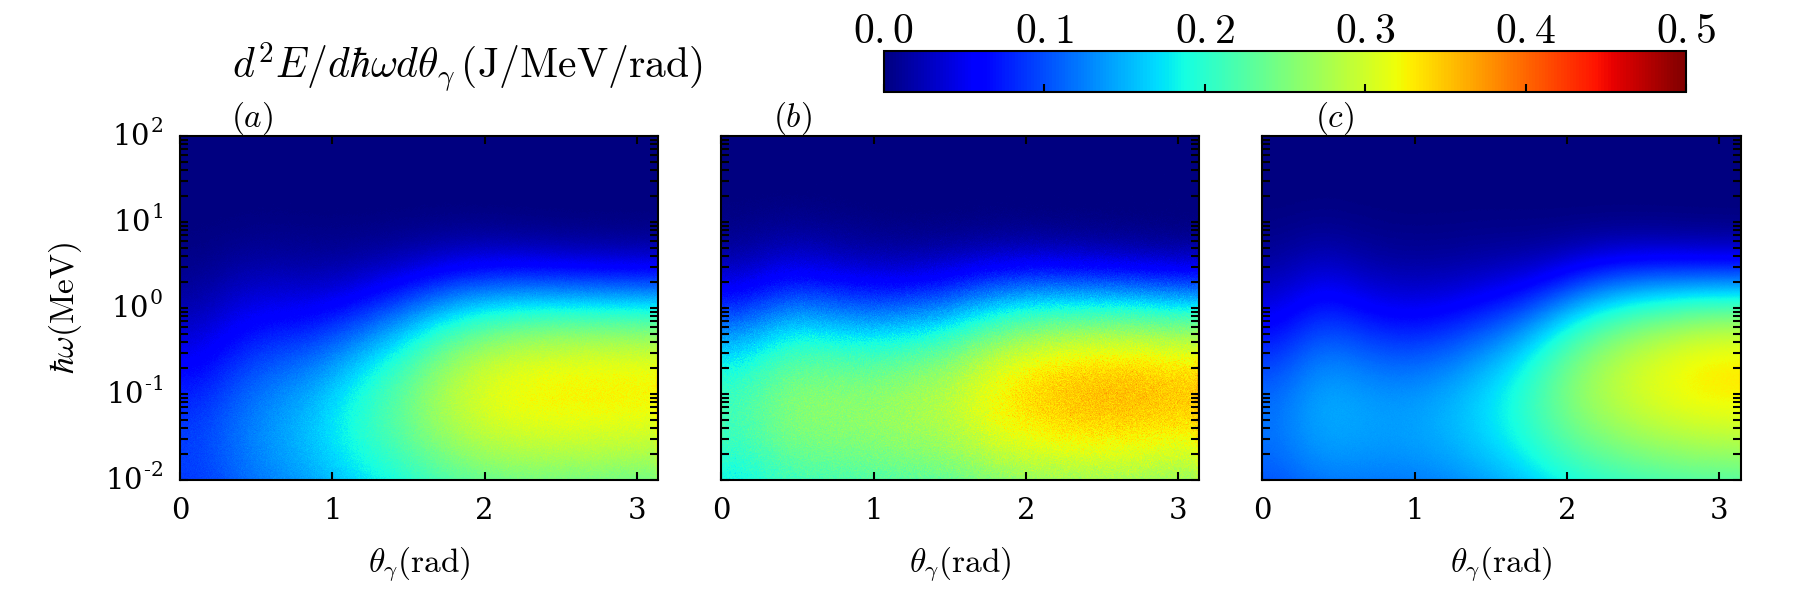
The resulting time-integrated energy-angle radiation spectrum is displayed in Fig. 17(b), and compared with that obtained from the sole nanowire array [Fig. 17(a)]. Comparison of the two spectra reveals the generation of two distinct photon groups. The first one originates from the interaction with the expanded wires, and is broadly distributed in the backward direction () with mean energies (resp. ) for (resp. ). The second one follows the reflection of the laser head off the foil, and its interaction with the electrons still accelerated in the laser tail. As already stressed, the quantum parameter is maximized for the forward-moving electrons that stream against the reflected pulse. Consequently, in this emission stage the radiated energy is mainly, but not entirely, forward-directed, as seen by comparing Figs. 17(a) and (b). This secondary emission stage increases the integrated radiation efficiency to (vs. without substrate, for ). Closer analysis reveals that out of the of laser energy hitting the Cu foil, approximately is further gained by electrons and ions, is converted into photons, and escapes through the target front side.
Finally, we show in Fig. 17(c) the energy-angle spectrum recorded from the optimized uniform-density target (), giving a radiation efficiency into photons. It corroborates our previous findings that optimized nanowire arrays and uniform targets yield similar photon distributions. Notable differences, however, are visible: the backward-emission cone angle is slightly narrower, and is complemented by a distinct, albeit weaker, forward emission around .
While the optimized nanowire array with substrate yields the highest radiation conversion efficiency, (for ), its performance falls by an order of magnitude, as does that of the two other types, if we consider only photon energies and forward emission angles (as would be relevant for, e.g., creating electron-positron pairs in a thicker high- substrate): one then obtains with a substrate and from the uniform target.
4 Effects of a finite focal spot and an oblique incidence angle
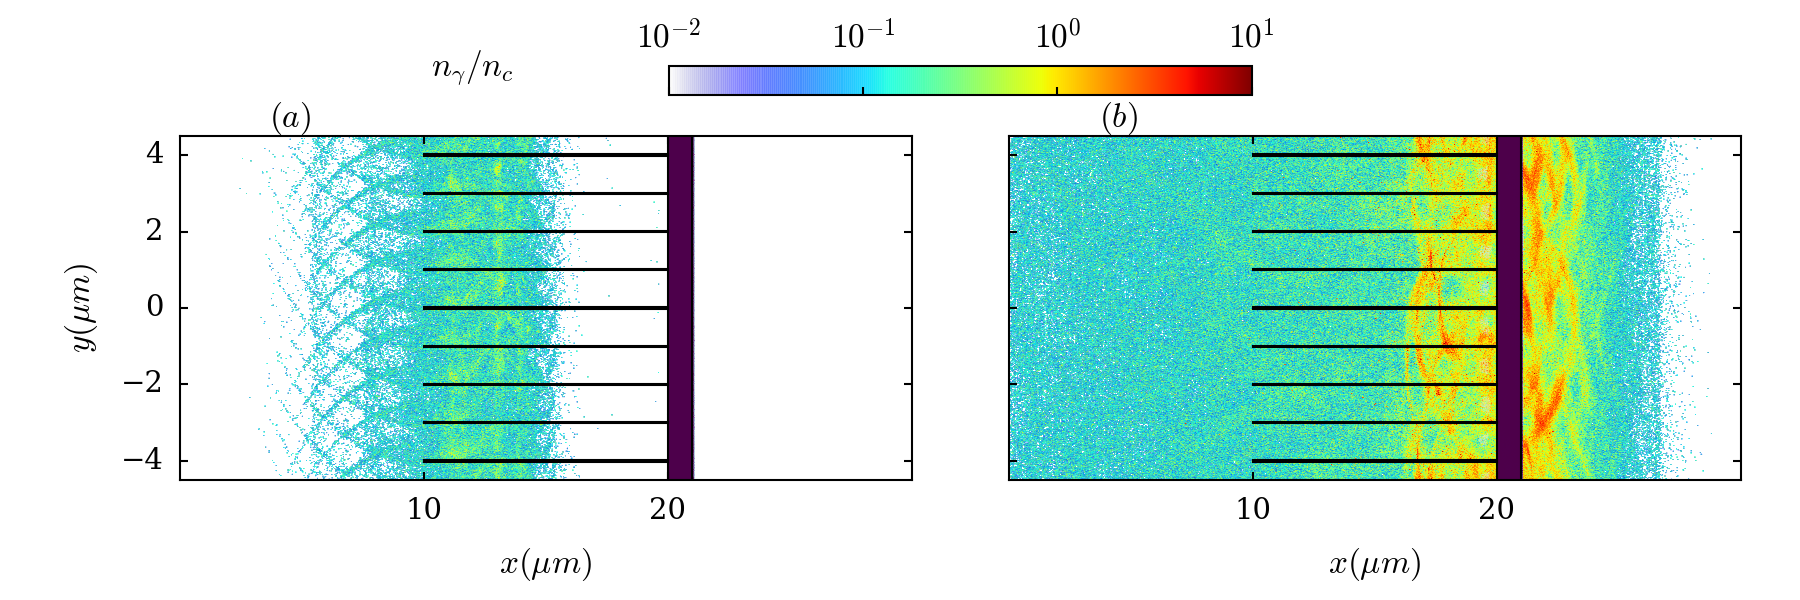
All the results of the previous sections correspond to a planar laser wave normally incident on a nanowire array. One may wonder whether they still hold in the more realistic case of a focused, possibly obliquely incident, laser beam. The variations of the synchrotron yield with the laser incidence angle have been recently investigated in Ref. [82], but this study considered planar targets irradiated at a very high laser intensity (). The strongest emission was found for an incidence angle and an electron density . Our goal here is not to extend this comprehensive study to the case of nanowire arrays but, rather, to examine briefly how the use of an obliquely incident, focused laser pulse may alter the properties of the emission compared to the optimal planar-wave configuration. To this end, we have run additional simulations in which the , laser pulse has an 8th-order hyper-Gaussian transverse profile of FWHM , and impinges onto the target at an angle or . The choice of a hyper-Gaussian transverse profile aims at minimizing intensity gradient effects, thus easing comparison with the planar-wave results. The laser electric field is in the plane ( polarization). The target consists of the highest-yield nanowire setup (, , with a Cu substrate) as previously identified.
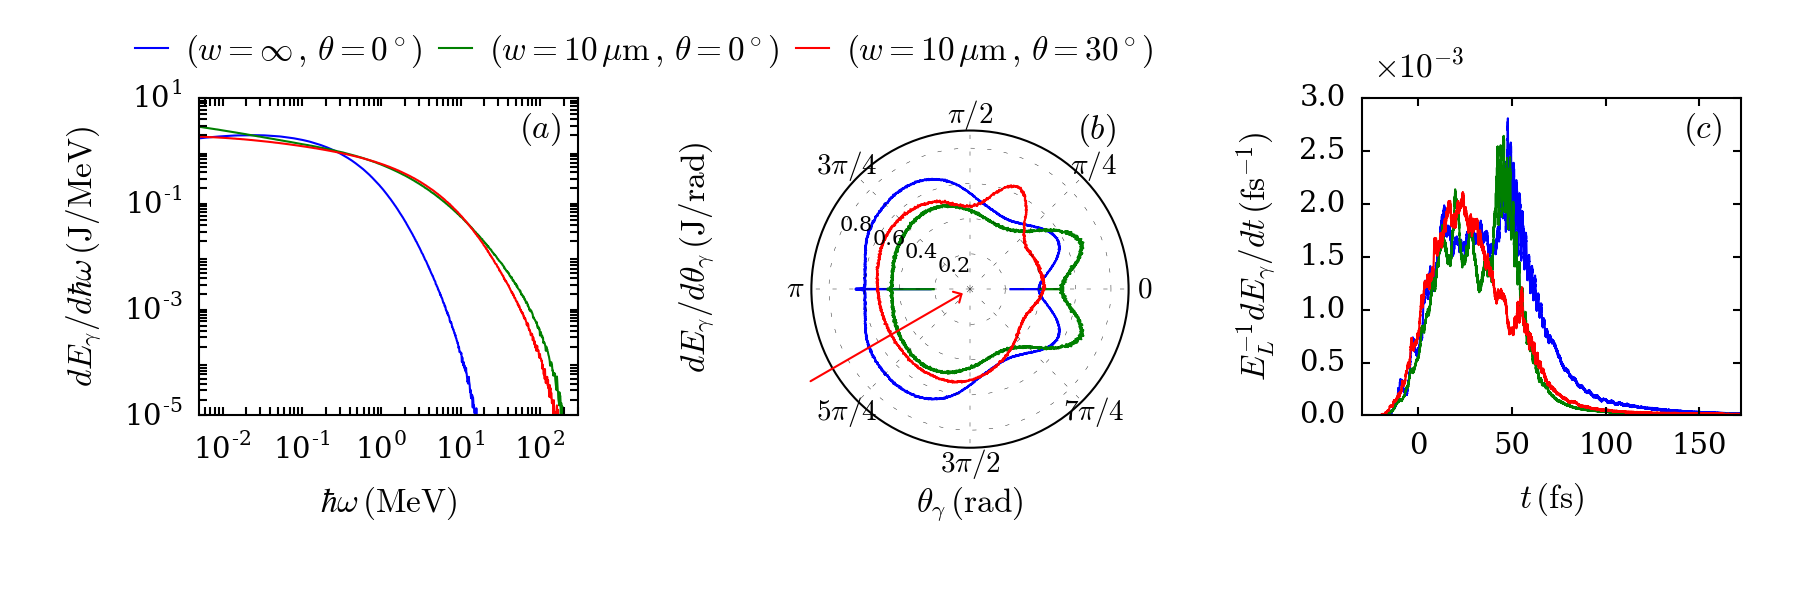
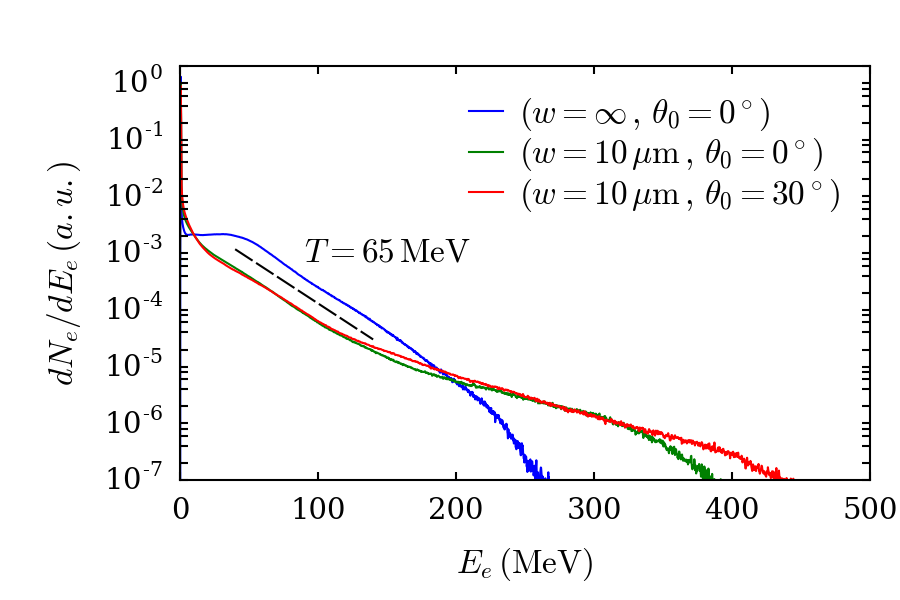
The changes induced by the laser’s finite focal spot size and oblique incidence angle on the synchrotron radiation are displayed in Figs. 18(a-c). Since the problem is no longer symmetric relative to the -axis, the photon emission angles are now defined as . A striking result [Fig. 18(a)] is that a laser focal spot leads to a 10-fold increase in the cutoff photon energy, which attains (weakly dependent on ) compared to for a plane wave. The mean photon energies are also increased, albeit to a lower extent, from (above ) for a plane wave to in the focused case.
These enhanced photon energies stem for the relativistic self-focusing undergone by the finite-spot laser pulse in the homogenized plasma [83]. This phenomenon is illustrated in Fig. 19, which displays the maps of the magnetic field and electron density in the case at after the on-target laser peak. We see that the laser beam has self-focused to a spot where it reaches a maximum field strength of , consistent with the absorption it has then experienced. The laser self-focusing significantly affects the electron energy spectra, as shown in Fig. 20 at . While the electron energy spectra produced by the focused beams show similar temperatures (, such that ) to the planar wave case up to , they present additional hotter, high-energy tails, extending up to .
As a result, the angle-resolved photon spectra obtained with the focused beams show notable differences with the planar-wave case [Fig 18(b)]. At , the backward emission is reduced while the forward radiation is enhanced and emitted into smaller-angle emission lobes (). As for the planar wave, the time-resolved radiated power presents two successive maxima corresponding to the laser interaction with the homogenized nanowires and the substrate [Fig. 18(c)]. The overall conversion efficiency is found to be slightly lower than that observed using a planar wave ( vs. ), with a larger fraction emitted in the forward () direction ( vs. ). At , the backward emission is also lowered (though less than at ), yet the main difference concerns the forward emission, peaked at angles and . Another difference is the much reduced second maximum in the time-resolved radiated power. This follows from the longer penetration length, and hence increased absorption of the obliquely propagating laser pulse across the nanowires, which therefore interacts at a lower intensity with the substrate. This weakened secondary radiation, however, is compensated for by a strengthened radiation throughout the nanowires, thus leading to a total radiation efficiency () equal to that obtained at normal incidence.
Overall, those results show that the salient radiation properties evidenced in the planar-wave case are significantly, but not strongly, affected by using a few nanowires wide focal spot and a moderately oblique incidence angle.
Conclusions
Synchrotron radiation from nanowire-array targets irradiated by ultraintense (), ultrashort () laser pulses has been numerically investigated using 2D PIC simulations. We have shown that distinct radiation mechanisms can arise in the course of the interaction, and at various locations in the target depending on its geometry. A main finding is that, under the strong-field conditions studied, the wires rapidly expand during the laser pulse, hence forming a fairly (but not fully) homogenized, relativistically hot plasma. Consequently, the major emission mechanisms (SDE, RESE, TOEE) previously evidenced in uniform-density plasmas [17, 46, 45] also take place in nanowire arrays. Moreover, we have found that the electrostatic reflection of the energized electrons at the target backside and the slowly-decaying magnetostatic fields induced around the wires can provide additional radiation channels. In the case of carbon wires driven at , optimum radiation efficiency, (resp. ) for (resp. ), is achieved for an interspacing and wire widths . In the resulting relativistically transparent () plasma, synchrotron emission proceeds through RESE, and is mainly radiated in a large-aperture backward cone. When increasing the wire width and/or decreasing the interwire spacing so that the homogenized plasma becomes overdense, the radiation is increasingly forward-directed due to the then-prevailing SDE. Conversely, decreasing the wire width or increasing the interspacing tends to favor backward radiation processes, i.e., RESE and the backside emission due to refluxing electrons. Although we have not conducted an extensive parametric scan at laser intensities other than , we have found that the radiation efficiency typically increases from at to at .
While a peak radiation efficiency into photons is also reported in uniform carbon plasmas of ‘equivalent’ density (), nanowire arrays are observed to achieve significant () radiation yields up to half solid () average densities. Nanowire arrays therefore prove useful not only as practical means of producing, after fast homogenization, plasma targets of controlled sub-solid density and composition (by varying the array parameters) [83], but also per se as robust and efficient high-energy photon sources. Besides, we have shown that the radiation yield can be further boosted (up to ) by adding a plasma mirror (a micrometric solid foil) at the backside of the array. The influence of a finite laser focal spot () has also been briefly addressed: the increased laser intensity that results from relativistic self-focusing enhances the production of high-energy electrons, which in turn leads to a slightly more forward-directed and significantly more energetic photon source, with a (resp. ) increase in the mean (resp. cutoff) photon energy. Operating with a incidence angle gives very similar results.
To conclude, we remark that our study has assumed a negligible laser prepulse, and therefore that the nanostructure is intact at the arrival of the intense laser pulse. Were the nanostructure to be prematurely destroyed, it would remain worthwhile to adjust its parameters so as to produce a relativistically underdense plasma, and to employ a plasma mirror to enhance the total radiation yield. On the theory side, a limitation of our work, due to computational constraints, is its reduced (2D) geometry. A recent related study [56] points out that the resonant processes responsible for electron energization in nanowire arrays may notably differ between 2D and 3D simulations. This work, however, considers immobile ions and a much weaker intensity () than ours, so that the array structure is maintained over a longer time. In our case, by contrast, most of the laser interaction takes place as in a fairly uniformized plasma, which should somewhat mitigate the 2D/3D discrepancy highlighted in Ref. [56]. We therefore expect that our major findings, regarding the nature, efficiency and interplay of the relevant emission processes, remain mostly valid when moving to 3D. Finally, we neglected the emission of Bremsstrahlung by the hot electrons, as well as all secondary processes possibly induced by the high-energy photons during their transport, such as electron-positron pair generation or photonuclear reactions. Some of these limitations will be addressed in future works.
References
References
- [1] Di Piazza A, Müller C, Hatsagortsyan K Z and Keitel C H 2012 Rev. Mod. Phys. 84(3) 1177–1228
- [2] CILEX, Centre Interdisciplinaire Lumière Extrême http://cilexsaclay.fr/
- [3] Jeong T M and Lee J 2014 Annalen der Physik 526 157–172 ISSN 1521-3889
- [4] ELI, Extreme Light Infrastructure http://www.eli-beams.eu/
- [5] VULCAN petawatt laser system https://www.clf.stfc.ac.uk/Pages/Vulcan.aspx/
- [6] XCELS, Exawatt Center for Extreme Light Studies http://www.xcels.iapras.ru/
- [7] Naumova N, Schlegel T, Tikhonchuk V T, Labaune C, Sokolov I V and Mourou G 2009 Phys. Rev. Lett. 102(2) 025002
- [8] Bulanov S V, Echkina E Y, Esirkepov T Z, Inovenkov I N, Kando M, Pegoraro F and Korn G 2010 Phys. Rev. Lett. 104 135003
- [9] Tamburini M, Liseykina T V, Pegoraro F and Macchi A 2012 Phys. Rev. E 85(1) 016407
- [10] Blackburn T G, Ridgers C P, Kirk J G and Bell A R 2014 Phys. Rev. Lett. 112(1) 015001
- [11] Ji L L, Pukhov A, Kostyukov I Y, Shen B F and Akli K 2014 Phys. Rev. Lett. 112(14) 145003
- [12] Wang H Y, Liu B, Yan X Q and Zepf M 2015 Phys. Plasmas 22 033102
- [13] Cole J M, Behm K T, Gerstmayr E, Blackburn T G, Wood J C, Baird C D, Duff M J, Harvey C, Ilderton A, Joglekar A S, Krushelnick K, Kuschel S, Marklund M, McKenna P, Murphy C D, Poder K, Ridgers C P, Samarin G M, Sarri G, Symes D R, Thomas A G R, Warwick J, Zepf M, Najmudin Z and Mangles S P D 2018 Phys. Rev. X 8(1) 011020
- [14] Poder K, Tamburini M, Sarri G, Di Piazza A, Kuschel S, Baird C D, Behm K, Bohlen S, Cole J M, Duff M, Gerstmayr E, Keitel C H, Krushelnick K, Mangles S P D, McKenna P, Murphy C D, Najmudin Z, Ridgers C P, Samarin G M, Symes D, Thomas A G R, Warwick J and Zepf M 2017 ArXiv e-prints (Preprint 1709.01861)
- [15] Bell A R and Kirk J G 2008 Phys. Rev. Lett. 101(20) 200403
- [16] Nerush E N, Kostyukov I Y, Fedotov A M, Narozhny N B, Elkina N V and Ruhl H 2011 Phys. Rev. Lett. 106(3) 035001
- [17] Ridgers C P, Brady C S, Duclous R, Kirk J G, Bennett K, Arber T D, Robinson A P L and Bell A R 2012 Phys. Rev. Lett. 108(16) 165006
- [18] Ji L L, Pukhov A, Nerush E N, Kostyukov I Y, Shen B F and Akli K U 2014 Phys. Plasmas 21 023109
- [19] Zhu X L, Yu T P, Sheng Z M, Yin Y, Turcu I C E and Pukhov A 2016 Nature Comm. 7 13686
- [20] Grismayer T, Vranic M, Martins J L, Fonseca R A and Silva L O 2017 Phys. Rev. E 95(2) 023210
- [21] Jirka M, Klimo O, Vranic M, Weber S and Korn G 2017 Sci. Reports 7 15302
- [22] Liang E 2013 High. Energ. Dens. Phys. 9 425–427
- [23] Chen H, Fiuza F, Link A, Hazi A, Hill M, Hoarty D, James S, Kerr S, Meyerhofer D D, Myatt J, Park J, Sentoku Y and Williams G J 2015 Phys. Rev. Lett. 114 215001
- [24] Lobet M, Ruyer C, Debayle A, d’Humières E, Grech M, Lemoine M and Gremillet L 2015 Phys. Rev. Lett. 115(21) 215003
- [25] Kirk J G, Bell A R and Arka I 2009 Plasma Phys. Control. Fusion 51 085008
- [26] Phuoc K T, Corde S, Thaury C, Malka V, Tafzi A, Goddet J P, Shah R C, Sebban S and Rousse A 2012 Nature Photon. 6 308-311
- [27] Chen S, Powers N D, Ghebregziabher I, Maharjan C M, Liu C, Golovin G, Banerjee S, Zhang J, Cunningham N, Moorti A, Clarke S, Pozzi S and Umstadter D P 2013 Phys. Rev. Lett. 110(15) 155003
- [28] Yan W, Fruhling C, Golovin G, Luo D H J, Zhang P, Zhao B, Zhang J, Liu C, Chen M, Chen S, Banerjee S and Umstadter D 2013 Nature Photon. 7 796-800
- [29] Powers N D, Ghebregziabher I, Golovin G, Liu C, Chen S, Banerjee S, Zhang J and Umstadter D P 2014 Nature Photon. 8 28-31
- [30] Sarri G, Corvan D J, Schumaker W, Cole J M, Di Piazza A, Ahmed H, Harvey C, Keitel C H, Krushelnick K, Mangles S P D, Najmudin Z, Symes D, Thomas A G R, Yeung M, Zhao Z and Zepf M 2014 Phys. Rev. Lett. 113(22) 224801
- [31] Yu C, Qi R, Wang W, Liu J, Li W, Wang C, Zhang Z, Liu J, Qin Z, Fang M, Feng K, Wu Y, Tian Y, Xu Y, Wu F, Leng Y, Weng X, Wang J, Wei F, Yi Y, Song Z, Li R and Xu Z 2016 Sci. Reports 6 29518
- [32] Lobet M, Davoine X, d’Humières E and Gremillet L 2017 Phys. Rev. Accel. Beams 20(4) 043401
- [33] Blackburn T G, Ilderton A, Murphy C D and Marklund M 2017 Phys. Rev. A 96(2) 022128
- [34] Birdsall C K and Langdon A B 2004 Plasma Physics Via Computer Simulation Series in Plasma Physics (New York: Taylor & Francis)
- [35] Zhidkov A, Koga J, Sasaki A and Uesaka M 2002 Phys. Rev. Lett. 88(18) 185002
- [36] Tamburini M, Pegoraro F, Di Piazza A, Keitel C H and Macchi A 2010 New J. Phys. 12 123005
- [37] Duclous R, Kirk J G and Bell A R 2011 Plasma Phys. Control. Fusion 53 015009
- [38] Capdessus R, d’Humières E and Tikhonchuk V T 2012 Phys. Rev. E 86(3) 036401
- [39] Chen M, Esarey E, Geddes C G R, Schroeder C B, Plateau G R, Bulanov S S, Rykovanov S and Leemans W P 2013 Phys. Rev. ST Accel. Beams 16(3) 030701
- [40] Vranic M, Martins J L, Vieira J, Fonseca R A and Silva L O 2014 Phys. Rev. Lett. 113(13) 134801
- [41] Gonoskov A, Bastrakov S, Efimenko E, Ilderton A, Marklund M, Meyerov I, Muraviev A, Sergeev A, Surmin I and Wallin E 2015 Phys. Rev. E 92(2) 023305
- [42] Lobet M, d’Humières E, Grech M, Ruyer C, Davoine X and Gremillet L 2016 J. Phys. Conf. Ser. 688 012058
- [43] Wallin E, Gonoskov A and Marklund M 2015 Phys. Plasmas 22 033117
- [44] Niel F, Riconda C, Amiranoff F, Duclous R and Grech M 2017 ArXiv e-prints (Preprint 1707.02618)
- [45] Chang H X, Qiao B, Zhang Y X, Xu Z, Yao W P, Zhou C T and He X T 2017 Phys. Plasmas 24 043111
- [46] Brady C S, Ridgers C P, Arber T D, Bell A R and Kirk J G 2012 Phys. Rev. Lett. 109(24) 245006
- [47] Brady C S, Ridgers C P, Arber T D and Bell A R 2014 Phys. Plasmas 21 033108
- [48] Stark D J, Toncian T and Arefiev A V 2016 Phys. Rev. Lett. 116(18) 185003
- [49] Huang T W, Zhou C T, Zhang H, Wu S Z, Qiao B, He X T and Ruan S C 2017 Appl. Phys. Lett. 110 021102
- [50] Pan K Q, Zheng C Y, Wu D, Cao L H, Liu Z J and He X T 2015 Appl. Phys. Lett. 107 183902
- [51] Zhu X L, Yin Y, Yu T P, Shao F Q, Ge Z Y, Wang W Q and Liu J J 2015 New J. Phys. 17 053039
- [52] Liu J J, Yu T P, Yin Y, Zhu X L and Shao F Q 2016 Opt. Express 24 15978–15986
- [53] Iwata N, Nagatomo H, Fukuda Y, Matsui R and Kishimoto Y 2016 Phys. Plasmas 23 063115
- [54] Yi L, Pukhov A, Luu-Thanh P and Shen B 2016 Phys. Rev. Lett. 116(11) 115001
- [55] Andreev A A and Platonov K Y 2016 IEEE J. Quant. Electron. 46 109
- [56] Lecz Z and Andreev A 2017 Phys. Plasmas 24 033113
- [57] Wang W M, Sheng Z M, Gibbon P, Chen L M, Li Y T and Zhang J 2017 ArXiv e-prints (Preprint 1710.11356)
- [58] Zhao Z, Cao L, Cao L, Wang J, Huang W, Jiang W, He Y, Wu Y, Zhu B, Dong K, Ding Y, Zhang B, Gu Y, Yu M Y and He X T 2010 Phys. Plasmas 17 123108
- [59] Ovchinnikov A, Kostenko O, Chefonov O, Rosmej O, Andreev N, Agranat M, Duan J, Liu J and Fortov V 2011 Laser & Part. Beams 29 249–254
- [60] Mondal S, Chakraborty I, Ahmad S, Carvalho D, Singh P, Lad A D, Narayanan V, Ayyub P, Kumar G R, Zheng J and Sheng Z 2011 Phys. Rev. B 83(3) 035408
- [61] Ivanov K A, Gozhev D A, Rodichkina S P, Makarov S V, Makarov S S, Dubatkov M A, Pikuz S A, Presnov D E, Paskhalov A A, Eremin N V, Brantov A Vand Bychenkov V Y, Volkov R V, Timoshenko V Y, Kudryashov S I and Savel’ev A B 2017 Appl. Phys. B 123 252 ISSN 1432-0649
- [62] Hollinger R, Bargsten C, Shlyaptsev V N, Kaymak V, Pukhov A, Capeluto M G, Wang S, Rockwood A, Wang Y, Townsend A, Prieto A, Stockton P, Curtis A and Rocca J J 2017 Optica 4 1344–1349
- [63] Ji Y, Jiang G, Wu W, Wang C, Gu Y and Tang Y 2010 Appl. Phys. Lett. 96 041504
- [64] Chatterjee G, Singh P K, Ahmed S, Robinson A P L, Lad A D, Mondal S, Narayanan V, Srivastava I, Koratkar N, Pasley J, Sood A K and Kumar G R 2012 Phys. Rev. Lett. 108(23) 235005
- [65] Tian Y, Liu J, Wang W, Wang C, Lu X, Leng Y, Liang X, Li R and Xu Z 2014 Plasma Phys. Control. Fusion 56 075021
- [66] Purvis M A, Shlyaptsev V N, Hollinger R, Bargsten C, Pukhov A, Prieto A, Wang Y, Luther B M, Yin L, Wang S and Rocca J J 2013 Nature Photon. 7 796-800
- [67] Bargsten C, Hollinger R, Capeluto M G, Kaymak V, Pukhov A, Wang S, Rockwood A, Wang Y, Keiss D, Tommasini R, London R, Park J, Busquet M, Klapisch M, Shlyaptsev V N and Rocca J J 2017 Sci. Adv. 3
- [68] Khaghani D, Lobet M, Borm B, Burr L, Gärtner F, Gremillet L, Movsesyan L, Rosmej O, Toimil-Molares M E, Wagner F and Neumayer P 2017 Sci. Reports 7 11366
- [69] Bin J H, Yeung M, Gong Z, Wang H Y, Kreuzer C, Zhou M L, Streeter M J V, Foster P S, Cousens S, Dromey B, Meyer-ter Vehn J, Zepf M and Schreiber J 2018 Phys. Rev. Lett. 120(7) 074801
- [70] Cristoforetti G, Londrillo P, Singh P K, Baffigi F, D’Arrigo G, Lad A D, Milazzo R G, Adak A, Shaikh M, Sarkar D, Chatterjee G, Jha J, Krishnamurthy M, Kumar G R and Gizzi L A 2017 Sci. Reports 7 1479
- [71] Cao L, Gu Y, Zhao Z, Cao L, Huang W, Zhou W, He X T, Yu W and Yu M Y 2010 Phys. Plasmas 17 043103
- [72] Cao L, Gu Y, Zhao Z, Cao L, Huang W, Zhou W, Cai H B, He X T, Yu W and Yu M Y 2010 Phys. Plasmas 17 103106
- [73] Kaymak V, Pukhov A, Shlyaptsev V N and Rocca J J 2016 Phys. Rev. Lett. 117(3) 035004
- [74] Sokolov I V, Naumova N M, Nees J A, Mourou G A and Yanovsky V P 2009 Phys. Plasmas 16 093115
- [75] Brady C S, Ridgers C P, Arber T D and Bell A R 2013 Plasma Phys. Control. Fusion 55 124016
- [76] Jiang S, Ji L L, Audesirk H, George K M, Snyder J, Krygier A, Poole P, Willis C, Daskalova R, Chowdhury E, Lewis N S, Schumacher D W, Pukhov A, Freeman R R and Akli K U 2016 Phys. Rev. Lett. 116(8) 085002
- [77] Wilks S C, Kruer W L, Tabak M and Langdon A B 1992 Phys. Rev. Lett. 69(9) 1383–1386
- [78] Fiuza F, Stockem A, Boella E, Fonseca R A, Silva L O, Haberberger D, Tochitsky S, Gong C, Mori W B and Joshi C 2012 Phys. Rev. Lett. 109(21) 215001
- [79] Weng S M, Murakami M, Mulser P and Sheng Z M 2012 New J. Phys. 14 063026
- [80] Ji L, Pukhov A, Nerush E, Kostyukov I, Akli K and Shen B 2014 Eur. Phys. J. Spec. Top. 223 1069–1082 ISSN 1951-6401
- [81] Siminos E, Grech M, Svedung Wettervik B and Fülöp T 2017 New J. Phys. 19 123042
- [82] Serebryakov D A and Nerush E N 2016 Quantum Electron. 46 299
- [83] Bin J H, Ma W J, Wang H Y, Streeter M J V, Kreuzer C, Kiefer D, Yeung M, Cousens S, Foster P S, Dromey B, Yan X Q, Ramis R, Meyer-ter Vehn J, Zepf M and Schreiber J 2015 Phys. Rev. Lett. 115(6) 064801