From jamming to collective cell migration through a boundary induced transition
Abstract
Cell monolayers provide an interesting example of active matter, exhibiting a phase transition from a flowing to jammed state as they age. Here we report experiments and numerical simulations illustrating how a jammed cellular layer rapidly reverts to a flowing state after a wound. Quantitative comparison between experiments and simulations shows that cells change their self-propulsion and alignement strength so that the system crosses a phase transition line, which we characterize by finite-size scaling in an active particle model. This wound-induced unjamming transition is found to occur generically in epithelial, endothelial and cancer cells.
I Introduction
Understanding collective cell migration, when cells move as a cohesive and coordinated group is important to shed light on key aspects of embryogenesis, wound repair and cancer metastasis Friedl and Gilmour (2009). While cellular and multicellular dynamics and motility is controlled by a complex network of biochemical pathways Ilina and Friedl (2009), it is becoming increasingly clear that a crucial role is also played by physical interactions among cells and between cells and their environmentTambe et al. (2011); Brugues et al. (2014); Haeger et al. (2014); Lange and Fabry (2013); Koch et al. (2012). Dense cellular assemblies, such as epithelial monolayers or cancer cell colonies, share many features with amorphous glassy materials, displaying slow relaxationAngelini et al. (2011), jamming Park et al. (2015) and intermittent avalanche fluctuations Chepizhko et al. (2016).
Cells can collectively flow like a fluid, but as cell proliferation increases cell density mutual crowding leads to slowing down and arrest Angelini et al. (2011); Park et al. (2015). The phenomenon of cell jamming could have a functional biological role, ensuring the development of tissue elasticity and protective barriers in epithelial tissues, providing also a suppressive mechanism for the aberrant growth of oncogenic clones. An unjamming transition into a collective flowing state could also provide a mechanism for cell migration that is alternative to the well studied epithelial-to-mesenchymal transition (EMT), characterized by individual cell migration as a result of the loss of intracellular adhesion Ye and Weinberg (2015).
The loss of motility in cellular assemblies shares similar features to the jamming transition observed in disordered materials such as colloids, granular media or foams Liu et al. (2010). As in disordered solids, cell jamming is thought to occur across different routes, either through the increase of cell density, or the reduction of the active forces responsible for cell motility. In analogy with inanimate glassy systems, is seems reasonable to assume that jamming could also be produced by increasing intracellular adhesion, yet experimental observations show that unjamming is associated with an increased adhesion, questioning the role of ashesion as a principal determinant of jamming Park et al. (2015). Recent experiments also show that over-expression of the endocytic master regulator RAB5A leads to rapid fluidization and unjamming of a jammed confluent cell monolayer, due to polarization of cell protrusion and increase in traction force Malinverno et al. (2017).
Theoretical understanding of the cell jamming transition mostly relies on simulations of vertex models Bi et al. (2015), similar to those used for foam rheology Weaire and Kermode (1984); Okuzono and Kawasaki (1995), and self-propelled Voronoi (SPV) models Li and Sun (2014); Bi et al. (2016), also including self-propulsion typical of active particle modelsSzabó et al. (2006); Poujade et al. (2007); Sepúlveda et al. (2013); Vedula et al. (2013). In the SPV model, space is subdivided into Voronoi polygons endowed with a mechanical energy due to cell surface tension, compression and adhesion. The polygonal structure then evolves according to equation of motion taking into account an active self-propulsion force and a noise term. Extensive numerical simulations allow us to identify the jamming transition and to reconstruct a possible phase diagram in terms of the main physical parameters encoded in the model Bi et al. (2016). In this way, it is possible to identify physical determinants for jamming, including the strength of the self-propulsion force and the shape anisotropy of the cell, determined by the ratio between the cell area and its squared perimeter Park et al. (2015); Bi et al. (2016).
While cell jamming is typically observed experimentally by following in time the evolution of a cell monolayer in a confined space, collective cell migration is mostly observed and quantified in wound healing assays where cells are allowed to invade an empty space Tambe et al. (2011); Brugues et al. (2014); Haeger et al. (2014); Lange and Fabry (2013); Koch et al. (2012); Poujade et al. (2007); Sepúlveda et al. (2013); Vedula et al. (2013). The implementation of current vertex and Voronoi models rely on periodic boundary conditions and are thus not appropriate to study wound healing, whose statistical features are well described by active particle modelsSzabó et al. (2006); Sepúlveda et al. (2013); Chepizhko et al. (2016). In this paper, we analyze the response of a jammed cell monolayer to the appearance of a wound, which creates empty space for the cells at the boundary. To this end, we analyze a large set of time-lapse images of cell layers using different cell types and experimental treatment, under confluent and wound healing conditions, and compare the results with simulations of an active particle model. We show that the model is able to quantitatively describe experimentally measured velocity distributions with open but also with confined boundary conditions. The model allows for a systematic investigation of the role of each relevant physical parameter so that we can place each experiment into a suitable phase diagram. Our simulations show that the model exhibits a clear jamming transition characterized by finite-size scaling. When we compare wound healing with confined experiments, we find that the latter are described by a set of physical parameters that place the system into the jamming phase, while the former fall into the flowing phase. Hence, the presence of a wound re-awakens jammed cells in a way similar to the effect of the overexpression of the endocytic regulator RAB5A Malinverno et al. (2017).
II Experimental results
We consider time lapse images recorded during wound healing assays performed for a variety of cell lines under different experimental conditions (see section A for detailed information): HeLa cells on different substrates: plastic, soluble collagen, or fibrillar collagen (see Chepizhko et al. (2016)); Endothelial cells derived from embryonic stem cells with homozygous null mutation of the VE-cadherin gene (VEC null) Balconi et al. (2000) and those with the corresponding wild type form of VE-cadherin (VEC positive) Lampugnani et al. (2002); Endothelial cells isolated from lungs of wild type adult mice (lung ECs) Giampietro et al. (2015); Chepizhko et al. (2016); A non-tumorigenic human mammary epithelial cell line (MCF-10A) with the over-expression of RAB5A, known to induce unjamming, and the corresponding wild type (WT) cells Malinverno et al. (2017). As a comparison, we also analyze HeLa cells and and MCF-10A cells in confluent conditions without inducing wound healing.
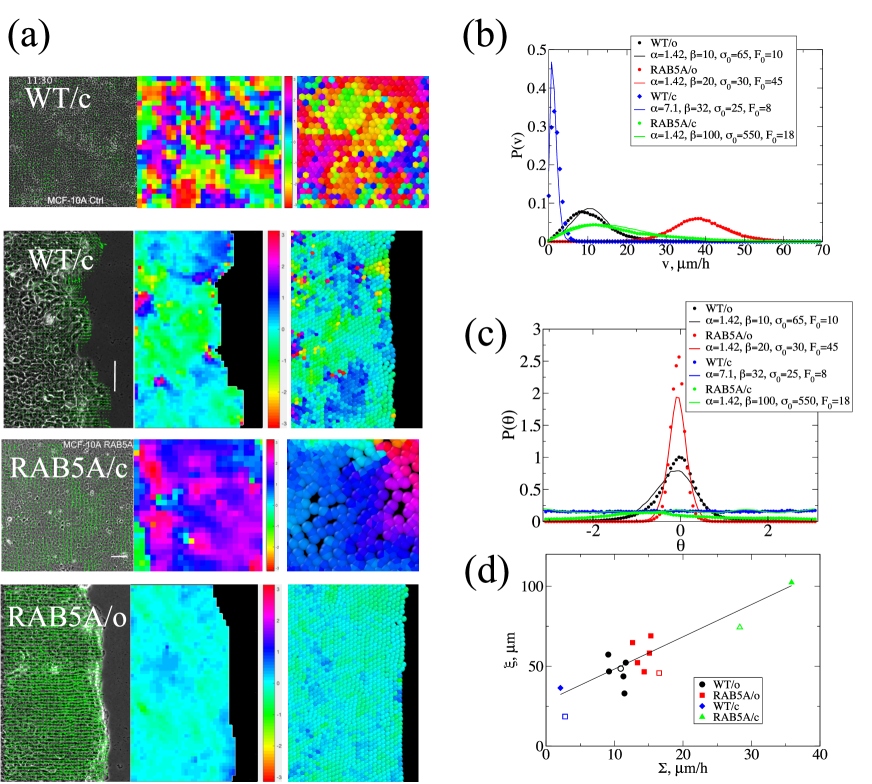
We analyze all the experimental time lapse images using particle image velocimetry (PIV) which allows us to estimate the local velocity field inside the cell sheet (See Fig. 1a) and the corresponding velocity distributions Chepizhko et al. (2016). In particular, we measure the distribution of the velocity absolute values (See Fig. 1b), the distribution of the velocity orientations (See Fig. 1c) and the velocity-velocity correlation lengths from an exponential fit of the correlation functions (See Fig. 1c). It is interesting to notice that correlations lengths obtained from MCF-10A cells under different conditions scale linearly with the standard deviation of the velocity distribution . This relation was predicted by a theoretical model of collective cell migration where it implies that the effective friction is dominated by cell-cell interactions over cell-substrate interactions (Garcia et al., 2015).
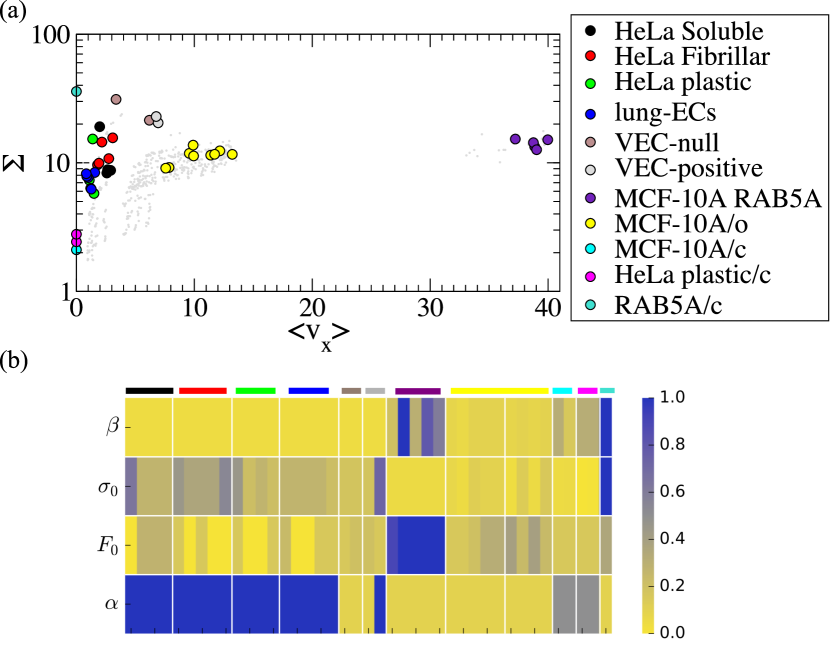
Considering all the experimental results, we obtain a set of 40 distributions for different cell lines and experimental conditions describing the statistical features of the velocity during collective cell migration. To visualize all the data in a simple way, in Fig. 3a we report the average velocity perpendicular to the front as a function of . The results show that the standard deviation of confluent systems is roughly one order of magnitude smaller than the one observed during wound healing for the same cells. Considering the wound healing case, we observe that MCF-10A cells move considerably faster than the other cells and, as expected, RAB5A overexpression leads to net increase in the average velocity with little changes in .
III Model
In order to relate the statistical properties of collective cell migration quantified from our experiments with the presence of a jamming critical point, we compare the expperimental results with simulations of a model for interacting cells similar to the one introduced in Ref. (Sepúlveda et al., 2013). Cells are treated as particles moving according to the following equation of motion:
| (1) |
The first term represents the dissipation processes and is a damping parameter. The second term represents the interaction of -th cell with the other cells. The interaction reflects the tendency of a particle to orient its velocity with the velocity of its neighbors, with a coupling strength , and is the number of neighbors of -th cell. The second interaction term, , represents the short-range hard-core repulsion and long-range attraction, and has the form
| (2) |
where
| (3) |
where is the Heaviside function for and otherwise. The motion of a cell is affected by a noise term , where is an Ornstein-Uhlenbeck process with correlation time :
| (4) |
is a delta-correlated white noise, independent for each cell .
As in the original model Sepúlveda et al. (2013), the free surface is modeled by surface particles, that are hindering cells invade the space. The interaction between a surface particle and a cell is modeled by:
| (5) |
where is . With each surface particle a scalar damage variable is associated, and it is chosen to obey:
| (6) |
The surface particle disappears if the damage variable reaches its critical value . To simulate wound healing conditions, we place the cell in a box of size in which we place cells surrounded by surface particles. We first do not allow damage on the surface particles and let the system relax for a time . We then allow surface particles to be damaged so that the wound healing process starts. We first let the front evolve for an additional time and finally collect velocity statistics for a time . This procedures allows to minimize transient effects. The model can also be simulated in confluent conditions by setting the damage variable to , so that the cells never invade the surrounding space.
IV Simulations
IV.1 Experimental velocity distribution are described by the model
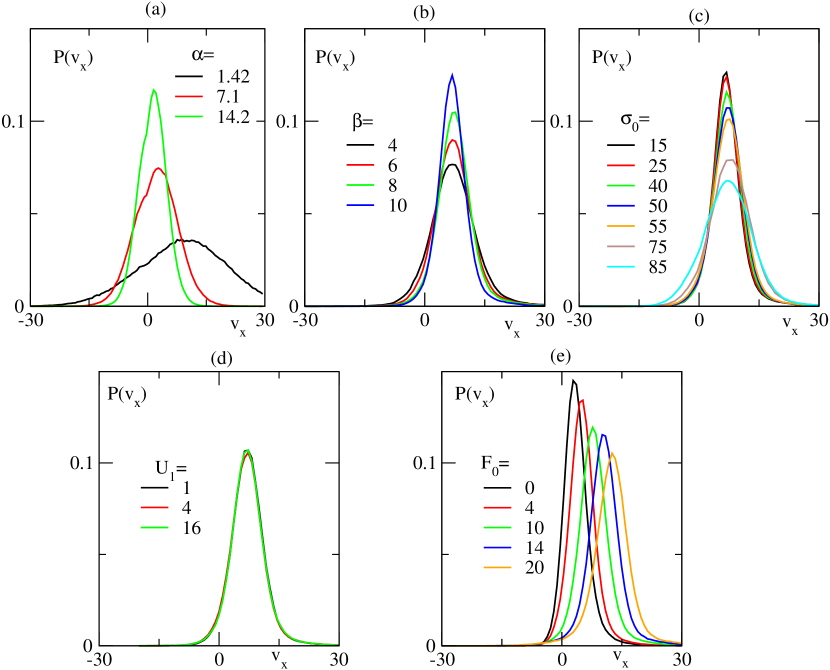
To compare the experiment with the model, we run a large set of simulations with both open and closed boundary conditions, employing a cell density that corresponds to the one observed in experiments for confluent cell layers. We explore the parameter space defined by different values of (, , , , ) and inspect how each parameter affects the velocity distributions (see Fig. 2). We observe that and have a considerable effect on , while and have opposite effects on the velocity fluctuations: increases with and decreases with . The adhesion strength is found to have little effect on the velocity distributions for the range we examined.
We find the best match between experiments and simulations (see supplementary methods) and identify a set of four parameters (, , , ) that best describe each individual experiment. Representative examples of the good match between experiments and model are reported in Fig. 1 for the case of MCF-10A cells under different conditions. We have also checked that the simulations reproduce the value of the correlation length with reasonable accuracy. The collection of parameters obtained for all the experiments is summarized in Fig. 3b as normalized color maps. The map allows us to observe some general trends in the parameter space: in particular MCF10-A with RAB5A overexpression stand out for their higher value of self-propulsion () and mutual alignment () with respect to the other cells. Furthermore, MCF-10A, both WT and RAB5A, display weaker noise () in comparison with the other cells.
IV.2 Finite size scaling at the jamming transition
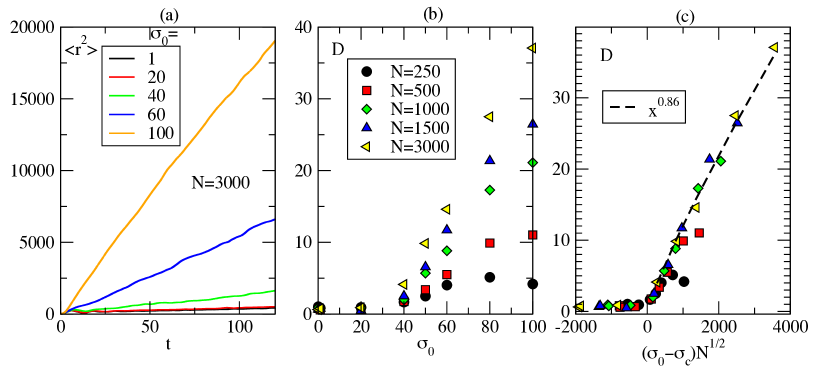
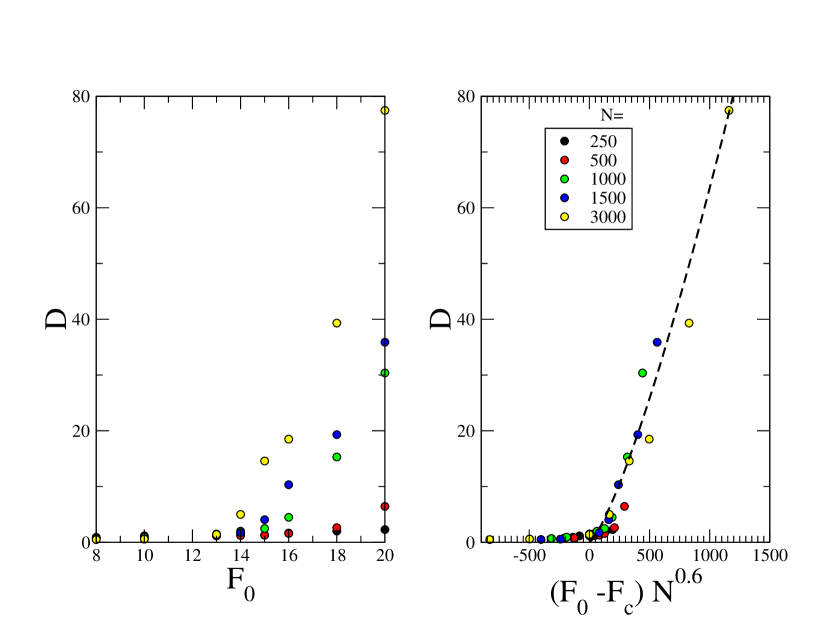
A simple inspection of the experimentally measured velocity distributions does not provides a clear understanding of the possible jamming or flowing behavior of the cell monolayers. Simulating the model, however, allows for a complete characterization of its dynamical behavior in term of a reduced set of parameters. Following recent work, we analyze the mean-square displacement (MSD) of individual cells in simulations of confluent layers and study how it changes as key parameters are varied. For instance, Fig. 4a shows that the MSD is a linear function of time whose slope, the effective diffusion constant , increases with noise parameter . A sharp increase in is usually associated with a transition from a jamming to a flowing state. In our case, Fig. 4b shows that depends on in a system-size dependent manner. This is generally expected for phase transitions in and out of equilibrium, where finite size scaling governs the behavior of the system near the critical point. We thus propose a finite-size scaling form for the noise and size dependence of the diffusion constant
| (7) |
where the scaling function for and for . The data collapse reported in Fig. 4c according to Eq. 7 indicates that and . A similar finite-size scaling collapse can be done in dependence on : , with for (see Fig. 5), yielding and .
IV.3 Wound healing induces unjamming
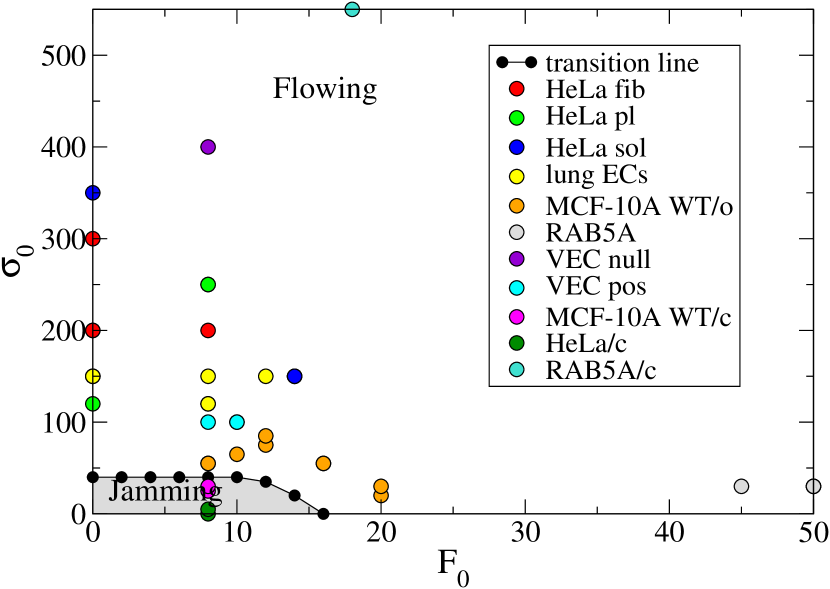
Collecting together all the simulations performed, we construct a phase diagram distinguishing the jammed from the flowing state as a function of and , as reported in Fig. 6. Here for practical reasons, we have concentrated on fixed values for and that correspond to a large set of experimental data. It is possible in principle to reconstruct the whole 4-dimensional phase diagram but this is extremely demanding computationally.
We are now in position to reach the goal posed at the beginning of this paper and identify the phase for each experimental sample. To this end, we report in Fig. 6 all the parameter values (,) extracted from the experimental measurement (see Table S1 for the parameter list). The general trend we observe from the figure is that all the experiments performed in confluent layers fall into the jammed phase, while almost all of the wound healing experiments are in the flowing phase. Notice that here we are projecting all the data into the (, ) plane so discrepancies could also arise due to the fact that experimental data are described by different values of and .
Taken together our results suggest that when a jammed confluent layer is perturbed by wound healing, providing additional space for the cells, the system undergoes a phase transition to the flowing state. This is reflected by the fact that key parameters describing self-propulsion, noise or alignment change their values, implying that the monolayer responds in an active way to the change of boundary conditions. We checked that this process is not an artifact of the model or the fitting by considering wound healing before and after closure. Results show that it is possible to fit the velocity distributions before and after healing with the same parameters. It is only some time after closure that the cell layer slowly falls back into the jammed state.
V Discussion
Soft and glassy materials are known to undergo a jamming transition, characterized by limited mobility and slow relaxation upon fine tuning of a set of physical control parameters including density, temperature and shear stress Liu et al. (2010). Dense cellular assemblies such as epithelial tissues and cancer are recently emerging as paradigmatic examples of jamming in active matter Angelini et al. (2010); Garcia et al. (2015); Park et al. (2015), a well studied non-equilibrium state of matter where an internal force drives each of the elementary units of the system. Examples of active matter range from artificial self-propelled colloidal particles, to bacteria, epithelial and cancer cells or even large groups of animals such as fish schools or birds flocks. A key issue for active matter is to understand what are the main physical determinants for jamming, which would play a role analogous to stress, density and temperature in conventional matter.
Current understanding of the jamming transition in cellular systems comes mostly from vertex models Bi et al. (2015) and SVP models Li and Sun (2014); Bi et al. (2016), which allow to clarify the role of many key biophysical parameters, such as cell anisotropies and self-propulsion strength. These models, however, are defined for systems with periodic boundary conditions and are therefore not appropriate to study the response of jammed epithelia to a wound, a well studied protocol to understand and quantify collective cell migration in epithelial and cancer cells Tambe et al. (2011); Brugues et al. (2014); Haeger et al. (2014); Lange and Fabry (2013); Koch et al. (2012); Chepizhko et al. (2016); Poujade et al. (2007); Sepúlveda et al. (2013); Vedula et al. (2013). Active particle models have proven very effective to quantitatively describe wound healing Sepúlveda et al. (2013); Chepizhko et al. (2016), but are usually not employed to study the jamming transition. Hence, the relation between wound healing and the jamming transition has not been explored. In the paper, we fill this gap by a combination of experiments and numerical simulations.
We analyze a large set of time-lapse experiments of cellular assemblies performed for different cell lines both in confluent conditions or after wound healing. In all these case, we compute the velocity distributions by PIV and study how the distribution changes in presence of a wound. We start our analysis from the MCF-10A cell line that was recently shown to undergo a transition from a jammed to a flowing state by over-expression of RAB5A, a master regulator of endocytosis Malinverno et al. (2017). Here we compare this transition with the similar fluidization induced by a wound. To obtain a quantitative characterization of the transition, we compare the experimental results with numerical simulations of an active particle model. In this way, we obtain the model parameters that best describe the experimentally measured velocity distributions. This parameters describe the self-propulsion force, the alignment interactions, intracellular adhesion, damping and noise and allow for a physical characterization of different cell lines and experimental conditions.
Our first observation is that the internal parameters typically change when a wound is present. This is a typical feature of living matter and not shared by ordinary inanimate matter where boundary conditions are not expected to influence the internal parameters of the system. Thus a jammed solid could possibly slowly invade a new open space and unjamming would eventually only occur because of a reduction of the density. In our case, however, the change of velocity distribution is instead compatible with a rapid change of internal parameters such as self-propulsion or alignment, way before the cell density is reduced. Once the parameters associated to each experiments have been determined, we are able to place them on a phase diagram reconstructed with the model. To this end, we perform numerical simulations of the active particle model under closed boundary conditions. The jamming phase can be identified considering the particle diffusion, quantified by the mean-square displacement Bi et al. (2016). We observe that the effective diffusion constant displays system size dependent effect in parameter space, allowing us to identify the transition point. As expected for second-order phase transitions, the curve describing the variation of the diffusion constant with control parameters and system size obeys finite size scaling. We can thus obtain scaling exponents by performing data collapse.
In our analysis of wound healing experiments, we have recorded parameters in steady-state conditions, disregarding the initial transient phase where the horizontal velocity builds up. Previous studies have shown that collective migration is associated with the propagation of waves of coordinated reorientation starting at the front Zaritsky et al. (2014, 2015). This is in line with our observation of a change of parameters induced by the boundary and suggests that changes first occur at the wound site and then rapidly propagate inside the layer. The phenomenon of collective cell velocity reorientation in the direction of the wound has been explained considering cell guidance through intracellular force propagation in combination with the idea of plithotaxis, defined as the tendency for cells to move along the axis of maximal normal stress Trepat and Fredberg (2011). The presence of a wound suddenly decreases the local stress on the boundary cells, inducing internal changes that are then transmitted to the bulk cells, leading to the emergent unjamming of the entire monolayer.
Appendix A Methods
Cell culture
HeLa cell line (ATCC CCL-2) is cultured as discussed in Ref. Chepizhko et al. (2016). Cells are seeded in bovine soluble collagen, or fibrillar bovine collagen or without collagen-coated dishes and growth up to reach confluence overnight (see Chepizhko et al. (2016)) Endothelial cells derived from embryonic stem cells with homozygous null mutation of the VE-cadherin gene (VEC null) Balconi et al. (2000). The wild type form of VE-cadherin was introduced in these cells (VEC positive) as described in detail in Lampugnani et al. (2002). Endothelial cells isolated from lungs of wild type adult mice and cultured as previously described Giampietro et al. (2015); Chepizhko et al. (2016). The MCF-10A cell line is a non-tumorigenic human mammary epithelial cell line cultured as discussed in Malinverno et al. (2017).
Wound healing assay
For the migration assay, a wound is introduced in the central area of the confluent cell sheet by using a pipette tip and the migration followed by time-lapse imaging. Hela cells were stained with 10 M Cell tracker green CMFDA (Molecular Probes) in serum-free medium for 30 minutes and then the complete medium was replaced. Mouse endothelial cell monolayers were wounded after an overnight starving, washed with PBS, and incubated at 37∘C in starving medium. MCF-10A cell monolayers were wounded after an O/N doxycicline induction, washed with PBS, and incubated at 37∘C in fresh media+doxycicline.
Time lapse imaging
For Hela cells, time-lapse multifield experiments were performed using an automated inverted Zeiss Axiovert S100 TV2 microscope (Carl Zeiss Microimaging Inc., Thornwood, NY) with a chilled Hamamatsu CCD camera OrcaII-ER. Displacements of the sample and the image acquisition are computer-controlled using Oko-Vision software (from Oko-lab). This Microscope was equipped with a cage incubator designed to maintain all the required environmental conditions for cell culture all around the microscopy workstation, thus enabling to carry out prolonged observations on biological specimens. Cell Tracker and Phase contrast images were acquired with an A-Plan 10x (NA 0.25) objective; the typical delay between two successive images of the same field was set to 10 minutes for 12 hours. For mouse endothelial cells and MCF-10A cells, time-lapse imaging of cell migration was performed on an inverted microscope (Eclipse TE2000-E; Nikon) equipped with an incubation chamber (OKOLab) maintained at 37∘C in an atmosphere of 5% CO2. Movies were acquired with a Cascade II 512 (Photometrics) charge-coupled device (CCD) camera controlled by MetaMorph Software (Universal Imaging) using a 4X or 10× magnification objective lens (Plan Fluor 10×, NA 0.30). Images were acquired every 2 or 5 min over a 24h period. ters. See Refs. Chepizhko et al. (2016); Malinverno et al. (2017) for more details.
Particle image velocimetry (PIV)
The measurements of the velocity field were done using PIVlab app for Matlab Thielicke (2014); Thielicke and Stamhuis (2014). The method is based on the comparison of the intensity fields of two consequent photographs of cells. The difference in the intensity is converted into velocity field measured in and then converted to Chepizhko et al. (2016).
Fit of the experimental data
To find the values of simulation parameters that fit experimental data, extensive numerical simulations were performed to cover the parameter space. The main parameters to vary were , , , and, to less extent, . Then the fitting was done for each experimental pair of values and , through the variable . The variable was computed for a large number of simulations spanning the parameter space and its minimum was selected as the best fit.
References
- Friedl and Gilmour (2009) Peter Friedl and Darren Gilmour, “Collective cell migration in morphogenesis, regeneration and cancer,” Nat Rev Mol Cell Biol 10, 445–57 (2009).
- Ilina and Friedl (2009) Olga Ilina and Peter Friedl, “Mechanisms of collective cell migration at a glance,” J Cell Sci 122, 3203–8 (2009).
- Tambe et al. (2011) Dhananjay T Tambe, C Corey Hardin, Thomas E Angelini, Kavitha Rajendran, Chan Young Park, Xavier Serra-Picamal, Enhua H Zhou, Muhammad H Zaman, James P Butler, David A Weitz, Jeffrey J Fredberg, and Xavier Trepat, “Collective cell guidance by cooperative intercellular forces,” Nat Mater 10, 469–75 (2011).
- Brugues et al. (2014) Agusti Brugues, Ester Anon, Vito Conte, Jim H. Veldhuis, Mukund Gupta, Julien Colombelli, Jose J. Munoz, G. Wayne Brodland, Benoit Ladoux, and Xavier Trepat, “Forces driving epithelial wound healing,” Nat Phys 10, 683–690 (2014).
- Haeger et al. (2014) Anna Haeger, Marina Krause, Katarina Wolf, and Peter Friedl, “Cell jamming: collective invasion of mesenchymal tumor cells imposed by tissue confinement,” Biochim Biophys Acta 1840, 2386–95 (2014).
- Lange and Fabry (2013) Janina R Lange and Ben Fabry, “Cell and tissue mechanics in cell migration,” Exp Cell Res 319, 2418–23 (2013).
- Koch et al. (2012) Thorsten M Koch, Stefan Münster, Navid Bonakdar, James P Butler, and Ben Fabry, “3d traction forces in cancer cell invasion,” PLoS One 7, e33476 (2012).
- Angelini et al. (2011) Thomas E Angelini, Edouard Hannezo, Xavier Trepat, Manuel Marquez, Jeffrey J Fredberg, and David A Weitz, “Glass-like dynamics of collective cell migration,” Proc Natl Acad Sci U S A 108, 4714–9 (2011).
- Park et al. (2015) Jin-Ah Park, Jae Hun Kim, Dapeng Bi, Jennifer A Mitchel, Nader Taheri Qazvini, Kelan Tantisira, Chan Young Park, Maureen McGill, Sae-Hoon Kim, Bomi Gweon, Jacob Notbohm, Robert Steward, Jr, Stephanie Burger, Scott H Randell, Alvin T Kho, Dhananjay T Tambe, Corey Hardin, Stephanie A Shore, Elliot Israel, David A Weitz, Daniel J Tschumperlin, Elizabeth P Henske, Scott T Weiss, M Lisa Manning, James P Butler, Jeffrey M Drazen, and Jeffrey J Fredberg, “Unjamming and cell shape in the asthmatic airway epithelium,” Nat Mater 14, 1040–1048 (2015).
- Chepizhko et al. (2016) Oleksandr Chepizhko, Costanza Giampietro, Eleonora Mastrapasqua, Mehdi Nourazar, Miriam Ascagni, Michela Sugni, Umberto Fascio, Livio Leggio, Chiara Malinverno, Giorgio Scita, Stéphane Santucci, Mikko J Alava, Stefano Zapperi, and Caterina A M La Porta, “Bursts of activity in collective cell migration,” Proc Natl Acad Sci U S A 113, 11408–11413 (2016).
- Ye and Weinberg (2015) Xin Ye and Robert A Weinberg, “Epithelial-mesenchymal plasticity: A central regulator of cancer progression,” Trends Cell Biol 25, 675–86 (2015).
- Liu et al. (2010) Andrea J. Liu, Sidney R. Nagel, and J. S. Langer, “The jamming transition and the marginally jammed solid,” Annu. Rev. Condens. Matter Phys. 1, 347–369 (2010).
- Malinverno et al. (2017) Chiara Malinverno, Salvatore Corallino, Fabio Giavazzi, Martin Bergert, Qingsen Li, Marco Leoni, Andrea Disanza, Emanuela Frittoli, Amanda Oldani, Emanuele Martini, Tobias Lendenmann, Gianluca Deflorian, Galina V Beznoussenko, Dimos Poulikakos, Ong Kok Haur, Marina Uroz, Xavier Trepat, Dario Parazzoli, Paolo Maiuri, Weimiao Yu, Aldo Ferrari, Roberto Cerbino, and Giorgio Scita, “Endocytic reawakening of motility in jammed epithelia,” Nat Mater 16, 587–596 (2017).
- Bi et al. (2015) Dapeng Bi, J. H. Lopez, J. M. Schwarz, and M. Lisa Manning, “A density-independent rigidity transition in biological tissues,” Nat. Phys. 11, 1074–+ (2015).
- Weaire and Kermode (1984) D. Weaire and J. P. Kermode, “Computer simulation of a two-dimensional soap froth ii. analysis of results,” Philosophical Magazine B 50, 379–395 (1984), https://doi.org/10.1080/13642818408238863 .
- Okuzono and Kawasaki (1995) Tohru Okuzono and Kyozi Kawasaki, “Intermittent flow behavior of random foams: A computer experiment on foam rheology,” Phys. Rev. E 51, 1246–1253 (1995).
- Li and Sun (2014) Bo Li and Sean X Sun, “Coherent motions in confluent cell monolayer sheets,” Biophys J 107, 1532–41 (2014).
- Bi et al. (2016) Dapeng Bi, Xingbo Yang, M. Cristina Marchetti, and M. Lisa Manning, “Motility-driven glass and jamming transitions in biological tissues,” Phys. Rev. X 6, 021011 (2016).
- Szabó et al. (2006) B. Szabó, G. J. Szöllösi, B. Gönci, Zs. Jurányi, D. Selmeczi, and Tamás Vicsek, “Phase transition in the collective migration of tissue cells: Experiment and model,” Phys. Rev. E 74, 061908 (2006).
- Poujade et al. (2007) M Poujade, E Grasland-Mongrain, A Hertzog, J Jouanneau, P Chavrier, B Ladoux, A Buguin, and P Silberzan, “Collective migration of an epithelial monolayer in response to a model wound,” Proc Natl Acad Sci U S A 104, 15988–93 (2007).
- Sepúlveda et al. (2013) Néstor Sepúlveda, Laurence Petitjean, Olivier Cochet, Erwan Grasland-Mongrain, Pascal Silberzan, and Vincent Hakim, “Collective cell motion in an epithelial sheet can be quantitatively described by a stochastic interacting particle model,” PLoS Comput Biol 9, e1002944 (2013).
- Vedula et al. (2013) Sri Ram Krishna Vedula, Andrea Ravasio, Chwee Teck Lim, and Benoit Ladoux, “Collective cell migration: a mechanistic perspective,” Physiology (Bethesda) 28, 370–9 (2013).
- Balconi et al. (2000) G Balconi, R Spagnuolo, and E Dejana, “Development of endothelial cell lines from embryonic stem cells: A tool for studying genetically manipulated endothelial cells in vitro,” Arterioscler Thromb Vasc Biol 20, 1443–51 (2000).
- Lampugnani et al. (2002) Maria Grazia Lampugnani, Adriana Zanetti, Ferruccio Breviario, Giovanna Balconi, Fabrizio Orsenigo, Monica Corada, Raffaella Spagnuolo, Martha Betson, Vania Braga, and Elisabetta Dejana, “Ve-cadherin regulates endothelial actin activating rac and increasing membrane association of tiam,” Mol Biol Cell 13, 1175–89 (2002).
- Giampietro et al. (2015) Costanza Giampietro, Andrea Disanza, Luca Bravi, Miriam Barrios-Rodiles, Monica Corada, Emanuela Frittoli, Cecilia Savorani, Maria Grazia Lampugnani, Barbara Boggetti, Carien Niessen, Jeff L Wrana, Giorgio Scita, and Elisabetta Dejana, “The actin-binding protein eps8 binds ve-cadherin and modulates yap localization and signaling,” J Cell Biol 211, 1177–92 (2015).
- Garcia et al. (2015) Simon Garcia, Edouard Hannezo, Jens Elgeti, Jean-François Joanny, Pascal Silberzan, and Nir S Gov, “Physics of active jamming during collective cellular motion in a monolayer,” Proc Natl Acad Sci U S A 112, 15314–9 (2015).
- Angelini et al. (2010) Thomas E Angelini, Edouard Hannezo, Xavier Trepat, Jeffrey J Fredberg, and David A Weitz, “Cell migration driven by cooperative substrate deformation patterns,” Phys Rev Lett 104, 168104 (2010).
- Zaritsky et al. (2014) Assaf Zaritsky, Doron Kaplan, Inbal Hecht, Sari Natan, Lior Wolf, Nir S Gov, Eshel Ben-Jacob, and Ilan Tsarfaty, “Propagating waves of directionality and coordination orchestrate collective cell migration,” PLoS Comput Biol 10, e1003747 (2014).
- Zaritsky et al. (2015) Assaf Zaritsky, Erik S Welf, Yun-Yu Tseng, M Angeles Rabadán, Xavier Serra-Picamal, Xavier Trepat, and Gaudenz Danuser, “Seeds of locally aligned motion and stress coordinate a collective cell migration,” Biophys J 109, 2492–500 (2015).
- Trepat and Fredberg (2011) Xavier Trepat and Jeffrey J Fredberg, “Plithotaxis and emergent dynamics in collective cellular migration,” Trends Cell Biol 21, 638–46 (2011).
- Thielicke (2014) William Thielicke, The flapping flight of birds: Analysis and application, Ph.D. thesis (2014).
- Thielicke and Stamhuis (2014) W. Thielicke and E.J. Stamhuis, “Pivlab – towards user-friendly, affordable and accurate digital particle image velocimetry in matlab,” 2 (2014), 10.5334/jors.bl.