∎
McMaster University
Hamilton, Ontario, Canada, L8S 4K1
44email: {smiths,carette}@mcmaster.ca
Statistical Software for Psychology: Comparing Development Practices Between CRAN and Other Communities
Abstract
Context: Different communities rely heavily on software, but use quite different software development practices. Objective: We wanted to measure the state of the practice in the area of statistical software for psychology to understand how it compares to best practices. Method: We compared and ranked 30 software tools with respect to adherence to best software engineering practices on items that could be measured by end-users. Results We found that R packages use quite good practices, that while commercial packages were quite usable, many aspects of their development is too opaque to be measures, and that research projects vary a lot in their practices. Conclusion We recommend that more organizations adopt practices similar to those used by CRAN to facilitate success, even for small teams. We also recommend close coupling of source code and documentation, to improve verifiability.
Keywords:
Software quality, Analytic Hierarchy Process (AHP), R, Statistical software for Psychology1 Introduction
Best practices can be slow to propagate between disciplines. This paper attempts to address this problem between the fields of psychology and software engineering. In particular, we look at the state of practice for the development of statistical software meant to be used in psychology111For brevity, we will abbreviate this to SSP for the rest of this paper.. Developers of SSP, as in other scientific domains, frequently develop their own software because domain-specific knowledge is critical for the success of their applications (Wilson et al, 2013). However, these scientists are often self-taught programmers and thus potentially unaware of software development best practices. To help remedy this situation, Wilson et al (2013) provide general advice for scientific software development. We look at how well this advice is applied in the specific scientific domain of SSP. Our goal is to first understand what the state of the practice is in SSP, and then provide advice as to what software engineering practices would likely provide the biggest gains in perceived software quality, as measured by end-user perception.
A first look at the state of practice for software in a specific scientific community is provided by (Gewaltig and Cannon, 2012), for the domain of computational neuroscience. (A newer version of their paper is available (Gewaltig and Cannon, 2014), but we reference the original version, since its simpler software classification system better matches our needs.) Gewaltig and Cannon (2012) provide a high level comparison of existing neuroscience software, but little data is given on the specific metrics for their comparison. We build on the idea of studying software created and used by a specific scientific community, while also incorporating detailed measures of software qualities. In this paper we use the term software qualities as used by software engineers to refer to properties of software such as installability, reliability, maintainability, portability etc. When we speak of software qualities, we mean the union of these properties.
Here we target 30 SSP packages, developed by different communities using different models. The packages were selected from a combination of three external lists: Wikipedia (2014), the National Council on Measurement in Education NCME (2014), and the Comprehensive R Archive Network CRAN (2014b).
Combining our own ideas with suggestions from Wilson et al (2013) and Gewaltig and Cannon (2012), we created a grading sheet to systematically measure each package’s qualities. We used the Analytic Hierarchy Process (AHP) (Saaty, 1994) to quantify the ranking between packages via pair-wise comparisons. Our grading assumes that the software is intended to be user ready, as defined by Gewaltig and Cannon (2012). That is, the grading assumes that the intention is for new users to be able to undertake their work without requiring communication with the original developers. In many cases a low “grade” should not be attributed to a deficiency in the software, but rather to the fact that the overall goal was not user readiness, but rather research readiness (Gewaltig and Cannon, 2012). The overall quality target should be taken into account when interpreting the final rankings.
Unlike Gewaltig and Cannon (2012), the authors of this study are not domain experts. Our aim is to analyze SSP with respect to software engineering aspects only. Due to our lack of domain knowledge, algorithms and background theory will not be discussed, and packages will not be judged according to the different functionalities they provide. We reach our conclusions through a systematic and objective grading process, which incorporates some experimentation with each package.
Others have looked at issues surrounding the engineering of scientific software. Of particular relevance is Heaton and Carver (2015), which looks at different software engineering practices across papers that examine software development as performed by scientists. The software engineering practices are grouped as development workflow, consisting of design issues, lifecycle model, documentation, refactoring, requirements, testing, and verification and validation; and infrastructure, consisting of issue tracking, reuse, third-party issues and version control. These, naturally, have significant overlap with software qualities, as these practices are supposed to improve these qualities. Even though this is a survey of practices, and one would expect that this would be biased towards success stories and thus fairly good practices, what emerges is different. In other words, even among success stories, the state of the practice is rather mixed. This further motivates us to look at the state of the practice of SSP projects “from the outside”, and thus picking from a (hopefully) wider cross-section of projects. Another relevant study is Kanewala and Bieman (2014), where the authors systematically reviewed studies of relevance to software testing, motivated by the increasing number of paper retractions traceable to software faults. The main conclusion is that the cultural difference between scientist developers and software engineers, coupled with issues specific to scientific software, makes testing very difficult. We are gratified that this independent study justifies both our choice to not do our own independent testing, as well as the idea that investigating the “software engineering maturity level” of particular domains is likely to find non-trivial variations.
Background information is provided in the first section below. This is followed by the experimental results and basic comparisons between packages, along with information on how the software developed by the CRAN community compares to SSP developed by other communities.
2 Background
This section covers the process used for our study and the rationale behind it. We also introduce the terms and definitions used to construct the software quality grading sheet and the AHP technique, which we used to make the comparisons. The process was,
- 1.
-
2.
Pick 30 packages from authoritative lists. For SSP, this is a combination of NCME, CRAN and Wikipedia lists mentioned previously. We picked 15 R packages hosted by CRAN, and another 15 developed by other communities. Packages common to at least two of the lists (15 out 30) were selected first, with the remaining selected randomly.
-
3.
Build our grading sheet. The template used is given in Appendix A and is available at: https://github.com/adamlazz/DomainX.
-
4.
Grade each software. Our main goal here is to remain objective. To ensure that our process is reproducible, we asked different people to grade the same package. The result showed that different people’s standards for grading vary, but the overall ranking of software remained the same, since the overall ranking is based on relative comparisons, and not absolute grades.
-
5.
Apply AHP on the grading sheet to reduce the impact of absolute grade differences.
-
6.
Analyze the AHP results, using a series of different weightings, so that conclusions and recommendations can be made.
2.1 Categories and Status
The development models of each package fell into three categories:
-
1.
Open source: “Computer software with its source code made available and licensed so the copyright holder provides the rights to study, change and distribute the software to anyone for any purpose” (Laurent, 2004).
-
2.
Freeware: “Software that is available for use at no monetary cost, but with one or more restricted usage rights such as source code being withheld or redistribution prohibited” (LINFO, 2006).
-
3.
Commercial: “Computer software that is produced for sale or that serves commercial purposes” (Dictionary, 2014).
The status of each project is said to be Alive if the package, related documentation, or web site has been updated within the last 18 month; Dead if the last update was months ago or longer; Unclear if last release information could not be easily derived (denoted ? in tables).
2.2 Software qualities
We use the software engineering terminology from Ghezzi et al (2002) and best practices from Wilson et al (2013) to derive our terms and measures. We measure items of concern to both end users and developers. Since the terminology is not entirely fixed across the software engineering literature, we provide the definitions we will use throughout. The qualities are presented in (roughly) the order we measured them. Where relevant, information on how each quality was measured is given.
-
•
Installability is a measure of the ease of software installation. This is largely determined by the quantity and quality of installation information provided by developers. Good installability means detailed and well organized installation instructions, with less work to be done by users and automation whenever possible.
-
•
Correctness and Verifiability are related to how much a user can trust the software. Software that makes use of trustworthy libraries (those that have been used by other packages and tested through time) can bring more confidence to users and developers than self-developed libraries (Dubois, 2005). Carefully documented specifications should also be provided. Specifications allow users to understand the background theory for the software, and its required functionality. Well explained examples (with input, expected output and instructions) are helpful too, so that users can verify for themselves that the software produces the same result as expected by the developers.
-
•
Reliability is based on the dependability of the software. Reliable software has a high probability of meeting its stated requirements under a given usage profile over a given span of time.
-
•
Robustness is defined as whether a package can handle unexpected input. A robust package should recover well when faced with unexpected input.
-
•
Performance is a measure of how quickly a solution can be found and the resources required for its computation. Given the constraint that we are not domain experts, in the current context we are simply looking to see whether there is evidence that performance is considered. Potential evidence includes signs of use of a profiler, or other performance data.
-
•
Usability is a measure of how easy the software is to use. This quality is related to the quality and accessibility of information provided by the software and its developers. Good documentation helps with usability. Some important documents include a user manual, a getting started tutorial, and standard examples (with input, expected output and instructions). The documentation should facilitate a user quickly familiarizing themselves with the software. The GUI should have a consistent look and feel for its platform. Good visibility (Herr, 2002) can allow the user to find the functionality they are looking for more easily. A good user support model (e.g. forum) is beneficial as well.
-
•
Maintainability is a measure of the ease of correcting and updating the software. The benefits of maintainability are felt by future contributors (developers), as opposed to end users. Keeping track of version history and change logs facilitates developers planning for the future and diagnosing future problems. A developer’s guide is necessary, since it facilitates new developers doing their job in an organized and consistent manner. Use of issue tracking tools and concurrent version system is a good practice for developing and maintaining software (Wilson et al, 2013).
-
•
Reusability is a measure of the ease with which software code can be used by other packages. In our project, we consider a software package to have good reusability when part of the software is used by another package and when the API (Application Program Interface) is documented.
-
•
Portability is the ability of software to run on different platforms. We examine a package’s portability through developers’ statement from their web site or documents, and the success of running the software on different platforms.
-
•
Understandability (of the code) measures the quality of information provided to help future developers with understanding the behavior of the source code. We surface check the understandability by looking at whether the code uses consistent indentation and formatting style, if constants are not hard coded, if the code is modularized, etc. Providing a code standard, or design document, helps people become familiar with the code. The quality of the algorithms used in the code is not considered here.
-
•
Interoperability is defined as whether a package is designed to work with other software, or external systems. We checked whether that kind of software or system exists and if an external API document is provided.
-
•
Visibility/Transparency is a measure of the ease of examining the status of the development of a package. We checked whether the development process is defined in any document. We also record the examiner’s overall feeling about the ease of accessing information about the package. Good visibility allows new developers to quickly make contributions to the project.
-
•
Reproducibility is a measure of whether related information, or instructions, are given to help verify a products’ results (Davison, 2012). Documentation of the process of verification and validation is required, including details of the development and testing environment, operating system and version number. If possible, test data and automated tools for capturing the experimental context should be provided.
Our grading sheet, as shown in Appendix A, is derived from these qualities. Installability, for example was determined by asking the questions shown in Table 1, where Unavail means that uninstallation is not available, and the superscript ∗ means that this response should be accompanied by explanatory text.
| Question (Allowed responses) |
|---|
| Are there installation instructions? (Yes/ No) |
| Are the installation instructions linear? (Yes/ No) |
| Is there something in place to automate the installation? (Yes∗/ No) |
| Is there a specified way to validate the installation, such as a test suite? (Yes∗/ No) |
| How many steps were involved in the installation? (Number) |
| How many packages need to be installed before or during installation? (Number) |
| Run uninstall, if available. Were any obvious problems caused? (Unavail/Yes∗/ No) |
2.3 Analytic Hierarchy Process (AHP)
“The AHP is a decision support tool which can be used to solve complex decision problems. It uses a multi-level hierarchical structure of objectives, criteria, subcriteria, and alternatives. The pertinent data are derived by using a set of pairwise comparisons. These comparisons are used to obtain the weights of importance of the decision criteria, and the relative performance measures of the alternatives in terms of each individual decision criterion” (Triantaphyllou, 1995). By using AHP, we can compare between qualities and packages without worrying about different scales, or units of measurement.
Generally, by using AHP, people can evaluate options with respect to criteria. The criteria can be prioritized, depending on the weight given to them. An decision matrix is formed where each entry is the pair-wise weightings between criteria. Then, for each criterion, a pairwise analysis is performed on each of the options, in the form of an matrix . (There is a matrix for each criteria). It is formed through using a pair-wise score between options as each entry. The entry of the upper triangle of is scaled between one to nine, defined as in Saaty (1990).
Here we compared 30 packages () with respect to the 13 qualities () mentioned previously. Overall quality judgements will depend on the context in which each package is meant to be used. To approximate this, we experimented with different weights for each property.
We capture a subjective score, from one to ten, for each package for each criteria through our grading process. To turn these into pair-wise scores, one starts with two scores and (one for each package), and the result for versus is:
For example, if installability is measured as an for package and a for package , then the entry in corresponding to versus is , while that of versus is . The implication is that installing is much simpler than installing .
3 Experimental Results
We briefly introduce the packages. Next we present the AHP results by discussing trends for each quality and then looking at the final rankings, assuming both equal and non-equal weights. The detailed results are in Appendix B and available on-line at https://github.com/adamlazz/DomainX.
3.1 Packages
-
•
19 packages are open source; 8 are freeware; and 3 are commercial.
- •
-
•
3 projects use C++; 2 use Java; 2 use Fortran, and 1 uses BASIC. The programming language of the remaining 7 is not mentioned by the developers.
-
•
All the packages from CRAN are alive, using the definition given in the background section. Two of the commercial software product are alive and one is unclear. For the rest of software packages (mostly from university projects or research groups), 6 are alive, 5 are dead and the last is unclear.
| Name | Released | Updated | Status | Source | Lang. |
|---|---|---|---|---|---|
| eRm (Mair et al, 2014) | 2007 | 2014 | Alive | Available | R |
| Psych (Revelle, 2014) | 2007 | 2014 | Alive | Available | R |
| mixRasch (Willse, 2014) | 2009 | 2014 | Alive | Available | R |
| irr (Gamer et al, 2014) | 2005 | 2014 | Alive | Available | R |
| nFactors (Raiche and Magis, 2014) | 2006 | 2014 | Alive | Available | R |
| coda (Plummer et al, 2014) | 1999 | 2014 | Alive | Available | R |
| VGAM (Yee, 2013) | 2006 | 2013 | Alive | Available | R |
| TAM (Kiefer et al, 2014) | 2013 | 2014 | Alive | Available | R |
| psychometric (Fletcher, 2013) | 2006 | 2013 | Alive | Available | R |
| ltm (Rizopoulos, 2014) | 2005 | 2014 | Alive | Available | R |
| anacor (de Leeuw and Mair, 2014) | 2007 | 2014 | Alive | Available | R |
| FAiR (Goodrich, 2014) | 2008 | 2014 | Alive | Available | R |
| lavaan (Rosseel et al, 2014) | 2011 | 2014 | Alive | Available | R |
| lme4 (Bates et al, 2014) | 2003 | 2014 | Alive | Available | R |
| mokken (van der Ark, 2013) | 2007 | 2013 | Alive | Available | R |
| Name | Released | Updated | Status | Source | Lang. |
|---|---|---|---|---|---|
| ETIRM (Wothke, 2008) | 2000 | 2008 | Dead | Available | C++ |
| SCPPNT (Wothke, 2007) | 2001 | 2007 | Dead | Available | C++ |
| jMetrik (jMetrik, 2014) | 1999 | 2014 | Alive | Not | Java |
| ConstructMap (Berkeley, 2012) | 2005 | 2012 | Dead | Not | Java |
| TAP (TAP, 2014) | ? | ? | ? | Not | ? |
| DIF-Pack (DIF, 2012) | ? | 2012 | Alive | Available | Fortran |
| DIM-Pack (DIM, 2012) | ? | 2012 | Alive | Available | Fortran |
| ResidPlots-2 (Liang et al, 2008) | ? | 2008 | Dead | Not | ? |
| WinGen3 (Han, 2013) | ? | 2013 | Alive | Not | ? |
| IRTEQ (Han, 2011) | ? | 2011 | Dead | Not | ? |
| PARAM (Rudner, 2012) | ? | 2012 | Alive | Not | BASIC |
| IATA (IATA, 2014) | ? | 2014 | Alive | Not | ? |
3.2 AHP results
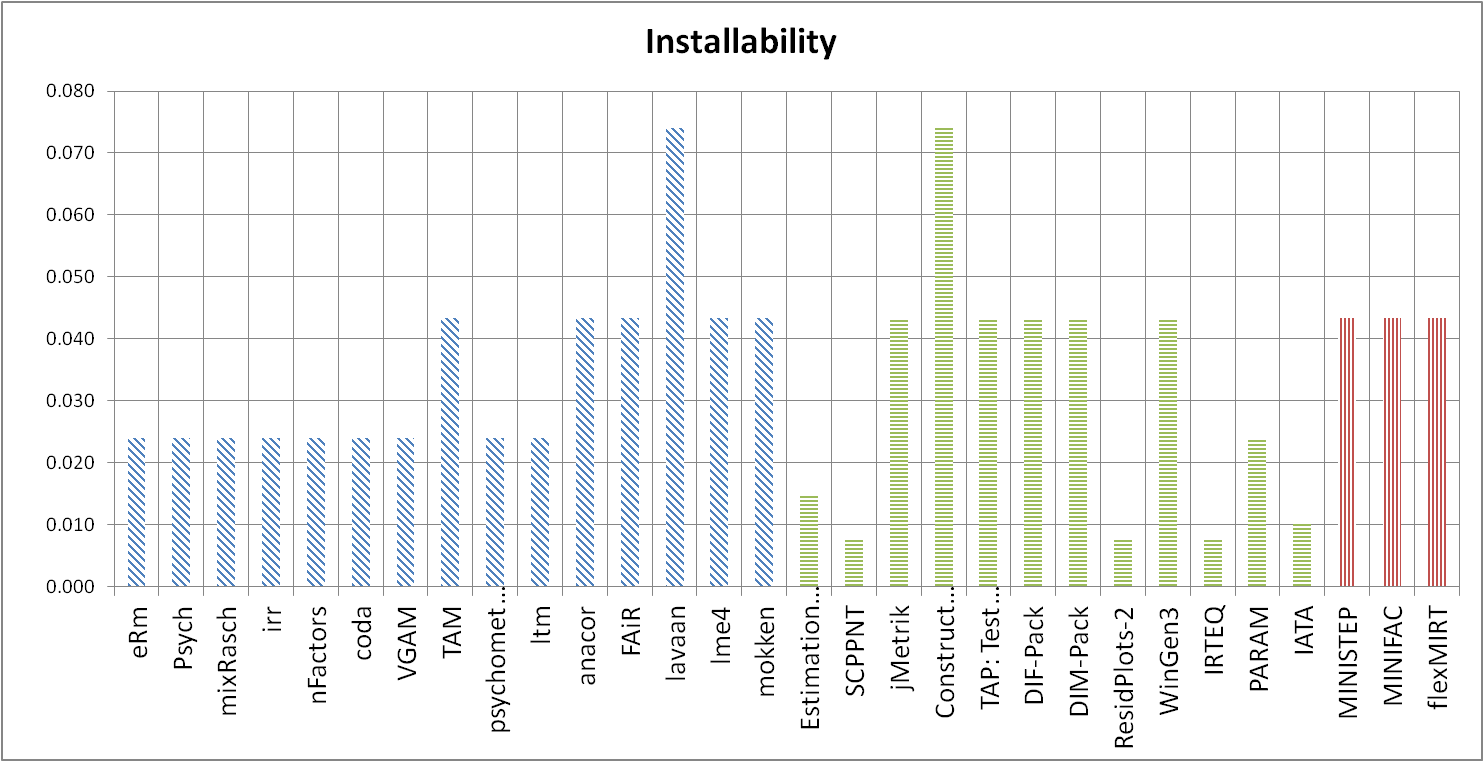
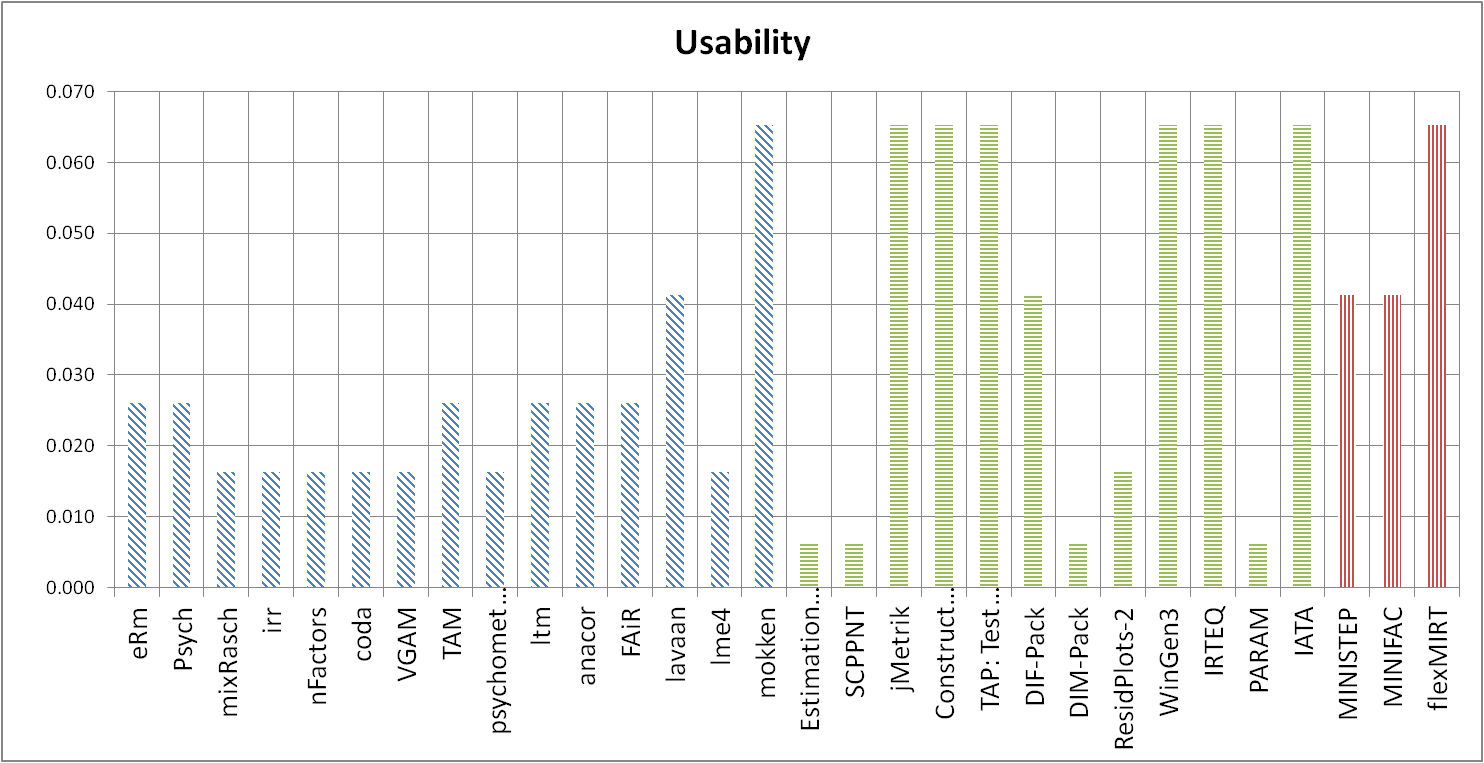
We explain the AHP results for each quality. In the charts, blue bars (slashes) are for packages hosted by CRAN222As all relevant R packages are hosted by CRAN, we will drop this qualifier for the rest of this paper., green bars (horizontal lines) for research groups projects and red bars (vertical lines) for commercial software.
3.2.1 Installability
We installed each package on a clean virtual machine. We did this to ensure we used a clean environment for each installation, to not create bias for software tested later. We also checked for installation instructions, and whether these instructions are organized linearly. Automated tools for installation and test cases for validation are preferred. The number of steps during installation and the number of external libraries required was counted. At the end of the installation and testing, if an uninstaller is available, we ran it to see if it completed successfully. The AHP results are in Figure 1. Some key findings are as follows:
-
•
R packages: The CRAN community provides general installation instructions (CRAN, 2014a) for all packages it maintains. However, in some cases links to the general instructions are not given in the package page, which may cause confusion for beginner users. The following packages addressed this problem by providing detailed installation information on their own web site: TAM, anacor, FAiR, lavaan, lme4 and mokken. All the packages installed easily and automatically. Most of the packages have dependencies on other R packages, but the required packages can be found and installed automatically. The uninstallation process is as easy as the installation process. A drawback of R packages for installability is that none of the packages provide a standard suite of test cases specifically for the verification of installation. lavaan provide a simple test example, without output data, which does show some consideration toward verification of the installation process.
-
•
Research group projects: The results of installability in the research group projects are uneven. Several are similar to R packages, but some rank lower because no installation instructions are given (5 out of 12), or the given instruction is not linearly organized (one). The developers may think that the installation process is simple enough that there is no need for installation instructions. However, even for a simple installation, it is good practice to have documentation to prevent trouble for new users. Another common problem is the lack of a standard suite of test cases, only ConstructMap and PARAM showed consideration of this issue.
-
•
Commercial software: They have well organized installation instructions, automated installers and only a few tasks needed to be done manually. However, commercial software tends to have the same problem as the R packages – in no instance is a standard test suite provided specifically for the verification of the installation.
3.2.2 Correctness and Verifiability
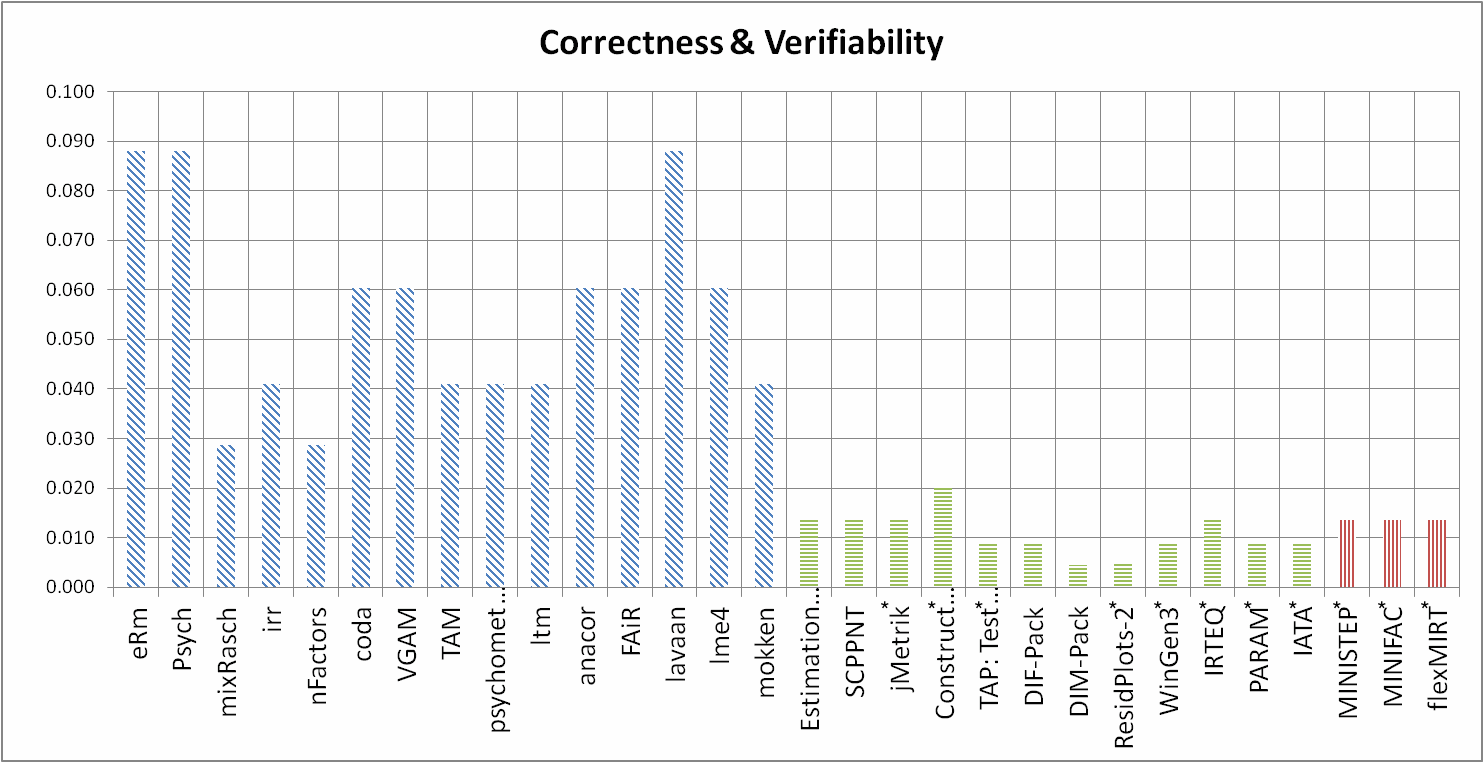
We checked for evidence of trustworthy libraries and a requirements specification. With respect to the requirements specification, we did not require the document to be written in a strict software engineering style – it was considered adequate if it described the relevant mathematics. We tried the given examples, if any, to see if the results matched the expected output. The results are shown in Figure 2. In particular, we observe that
-
•
R packages: For of the , there are either technical reports or published papers about the mathematics used by the package. For instance, lme4, eRm and mokken are covered in a special volume (number 20) on SSP from the Journal of Statistical Software (JSS) (de Leeuw and Mair, 2007). A later special volume (number 48) of JSS covers further R extensions, including lavaan (Rosseel, 2012). The software has consistent documentation because R extensions must satisfy the CRAN Repository policy, which includes standardized interface documentation through Rd (R documentation) files. Rd is a markup language that can be processed to create documentation in LaTeX, HTML and text formats (R Core Team, 2014). Although not required by the CRAN policy, some of the R extensions also include vignettes, which provide additional information in a more free format than the Rd documentation allows. Vignettes can act as user manuals, tutorials, and extended examples. Many vignettes are written with Sweave (Leisch, 2002), which is a Literate Programming (LP) (Knuth, 1984) tool for R. All the R packages have examples about how to use the software, but did not provide expected output data; we encountered a small precision difference when we ran ltm and compared with the expected results. Many packages rely on other packages (which can be seen as CRAN provides package dependencies as well as reverse dependencies); such reuse not only eases development burden, but reused packaged tend to be generally more trustworthy than newly developed libraries.
-
•
Research group projects: None provide requirements specifications nor reference manuals. Examples are given in most case ( of ), but of those did not provide input or output data. Only two mentioned that standard libraries were used.
-
•
Commercial: Much less information (especially as compared to R) was provided for building confidence in correctness and verifiability. Neither did they provide requirement specification documents, or reference manuals. As this is commercial software, it may be the case that the companies believe that their proprietary algorithms given them added value; we should not prematurely conclude that these packages are not correct or verifiable. On the plus side, all these packages provide standard examples with relevant output and all the calculated results produced from our machine matched the expected results. None of the selected packages mentioned whether they used existing popular libraries.
Little evidence of verification via testing was found among the three classes of software. The notable exception to this is the diagnostic checks done by CRAN on each of the R extensions. To verify that the extensions will work, the R package checker, R CMD check, is used. The tests done by R CMD check include R syntax checks, Rd syntax and completeness checks and, if available, example checks, to verify that the examples produce the expected output (R Core Team, 2014). These checks are valuable, but they focus more on syntax than on semantics. The R community has not seemed to fully embrace automated testing, since common development practices of R programmers do not usually include automatically re-running test cases (Wickham, 2011).
Of the three classes of software, R packages provides the most complete and consistent documentation, but there also seems to be a missed opportunity here. If there is a drawback to the R documentation, it is that the documents only assist with the use of the tools, not their verification. In other words, although LP is used for user documentation, it is not used for the implementation itself, so that documented code can be more easily verified. Nedialkov (2010) is a good example of the improved verifiability one can achieve by maintaining the code and documentation together in one source; the CRAN community does not appear to follow this approach.
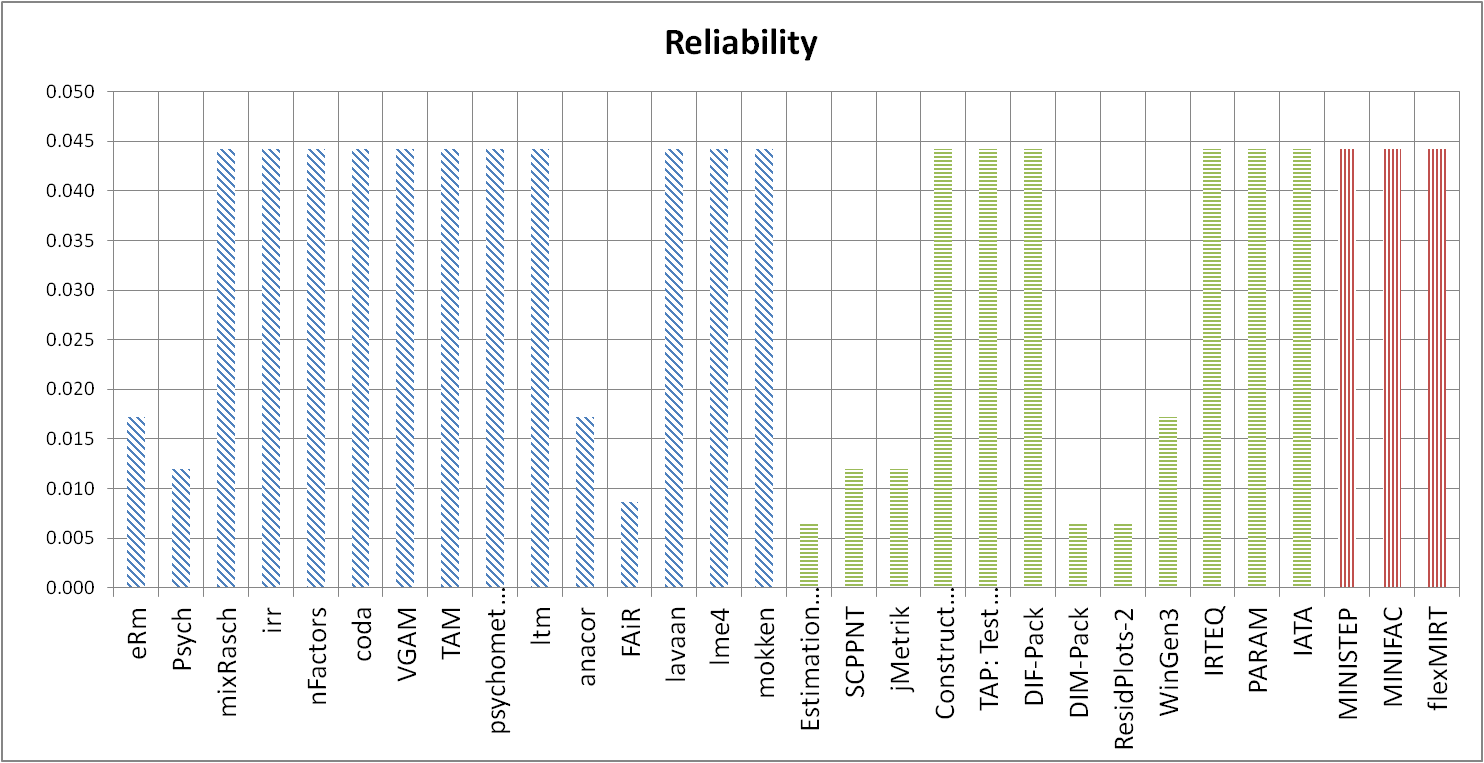
3.2.3 Reliability (Surface)
We checked rudimentary reliability by attempting to run the package after installing it. In particular, if there was a tutorial for the package, we tried to run through its examples to see if we obtained the same results. This can only be considered a surface measure of reliability, as we did not conduct any domain-specific checks.
-
•
R packages: For packages, there were no problems during installation and initial tutorial testing. There were small installation problems for eRm, Psych, anacor, FAiR because the instructions were not up to date with the software. The problems included dead URLs and a lack of required packages. Our suggestion is that developers should maintain their install instructions, or point users to the general instruction given by CRAN.
-
•
Research group projects: For half of these, we found no problems. The other half suffered from problems like Makefile errors (SCPPNT), old instructions (WinGen3), or an absence of instructions.
-
•
Commercial software: There were no problem during installation and initial tutorial testing when using the given instructions.
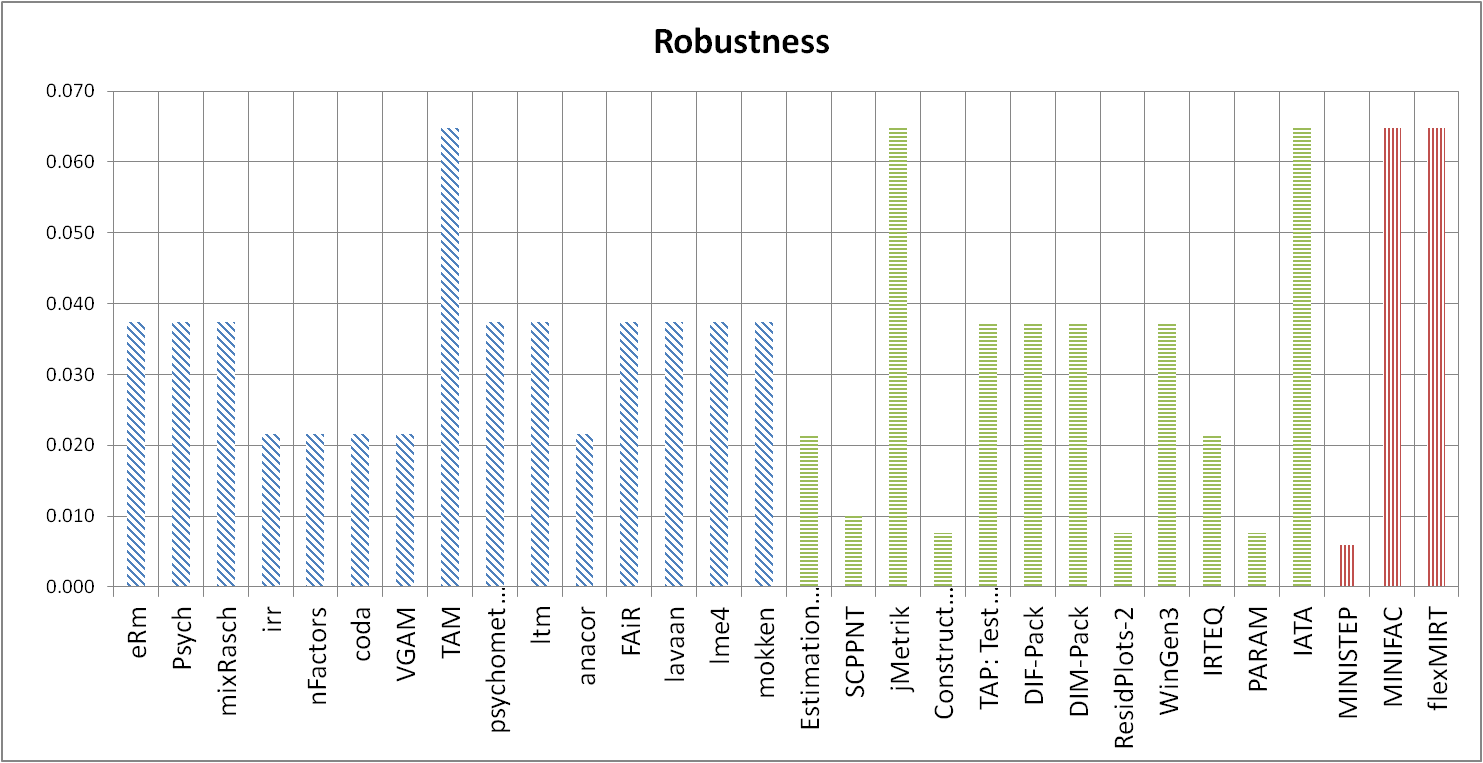
3.2.4 Robustness (Surface)
We checked robustness by providing the software with “bad” input. We wanted to know how well they deal with situations that the developers may not have anticipated. For instance, we checked whether they handle garbage input (a reasonable response may be an appropriate error message) and whether they gracefully handle text input files where the end of line character follows a different convention than expected. Like reliability, this is only a surface check. With reference to Figure 4, we have the following remarks:
-
•
R packages: handle unexpected input reasonably; they provide information or warnings when the user enters invalid data. R packages do not use text files as input files; therefore, a change of format in a text file is not an issue.
-
•
Research group projects: performed well. The rest had problems like an inability to handle when the input file is not present, or when it does not have the designated name.
-
•
Commercial software: two did well, but MINISTEP did not issue a warning when using an invalid format for an input – and the software crashed.
3.2.5 Performance (Surface)
No useful evidence or trends were obtained for performance; therefore, no comparison can be made.
3.2.6 Usability (Surface)
We checked usability mainly by looking at the documentation. Better usability means the users get more help from the developers. We checked for a getting started tutorial, for a fully worked example and for a user manual. Also, we looked for a reasonably well designed GUI, a clear declaration of the expected user characteristic, and for information about the user support model. The results are shown in Figure 5. We observed the following:
-
•
R packages: Thanks to the CRAN repository policy, Rd files and Sweave vignettes, users are provided with complete and consistent documentation. With respect to usability, two notably good examples are mokken and lavaan. They give detailed explanations for their examples and provide well-organized user manuals. However, R packages have a common drawback – only a few (4 out of 15) provide getting started tutorials. The common user support model is an email address, with only two (eRm and anacor) providing a discussion forum as well.
-
•
Research group projects: There was great inconsistency here; a few packages (IATA, ConstructMap, TAP: Test Analysis Program come to mind) provided the best examples for others to follow.
-
•
Commercial software: Commercial software did better than the R packages here. They all have getting started tutorials, explanations for their examples and good user manuals. The main drawback is that their GUIs do not have the usual look and feel for the platforms they are on. For the user support model, MINISTEP and MINIFAC provide user forums and a feedback section, in addition to email support.
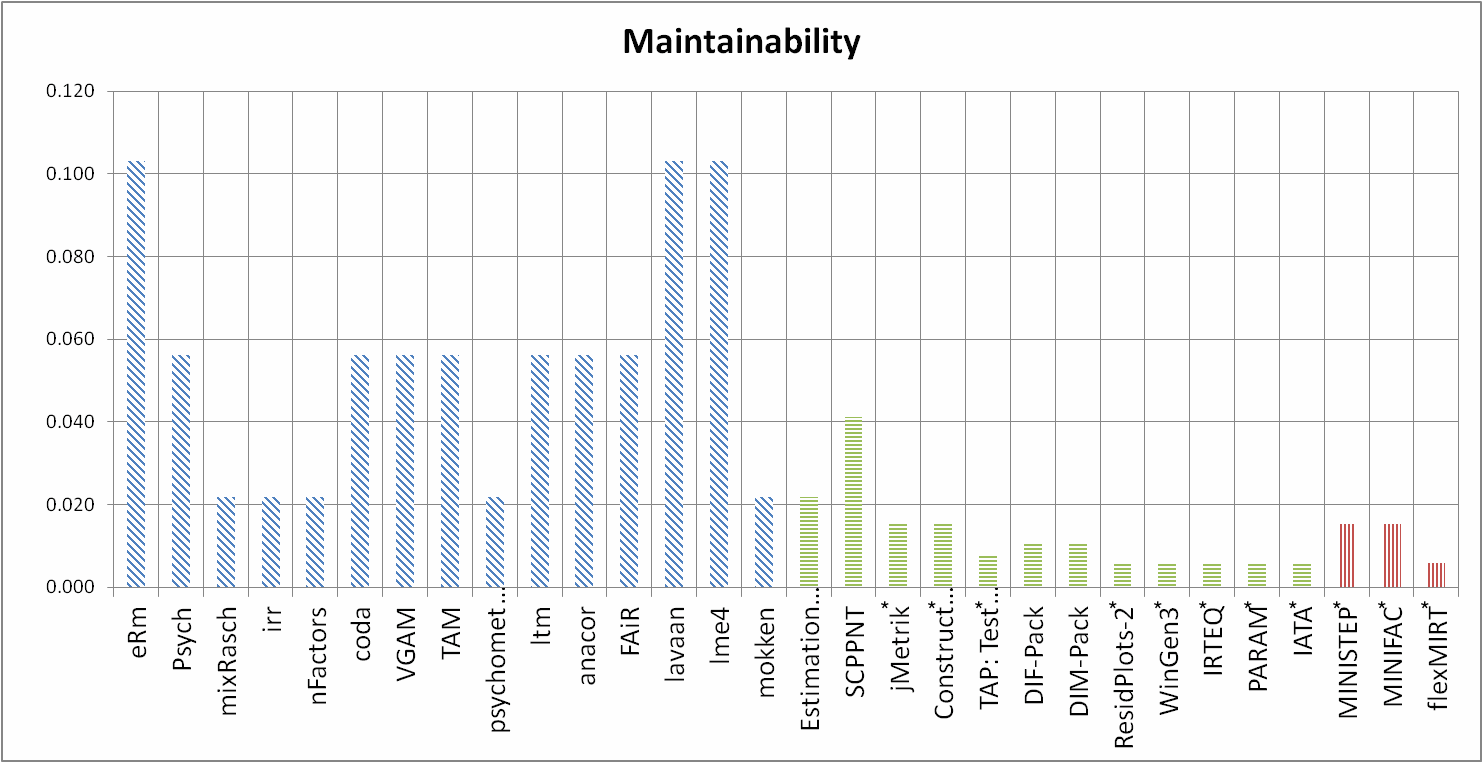
3.2.7 Maintainability
We looked for evidence that the software has actually been maintained and that consideration was given to assisting developers with maintaining the software. We looked for a history of multiple versions, documentation on how to contribute or review code, and a change log. In cases where there was a change log, we looked for the presence of the most common types of maintenance (corrective, adaptive or perfective).
We were also concerned about the tools that the developers used. For instance, what issue tracking tool was employed and does it show when major bugs were fixed? Since it is important for all scientific software (Wilson et al, 2013), we also looked to see which versioning system is in use. Effort toward clear, non-repetitive code is considered as evidence for maintainability. The results are shown in Figure 6, and we can highlight the following:
-
•
R packages: All of them provide a history of multiple versions and give information about how the packages were checked. A few of them, like lavaan and lme4, also give information about how to contribute. provide change logs, indicate use of an issue tracking tool (Tracker and GitHub) and versioning systems (SVN and GitHub). All of them consider maintainability in the code, with no obvious evidence of code clones.
-
•
Research group projects: Research group projects did not show much evidence that they pay attention to maintainability. Only provide the version history of their software; two give information about how to contribute and three provided change logs. None of them showed evidence of using issue tracking tools, or of using a versioning system in their project.
-
•
Commercial software: Because of the nature of commercial software, they did not show much externally visible evidence of maintainability. Two did provide history of multiple versions of the software and change logs, but other information is usually not provided by the vendors. In this case, our measurements may not be an accurate reflection of the maintainability of these packages.
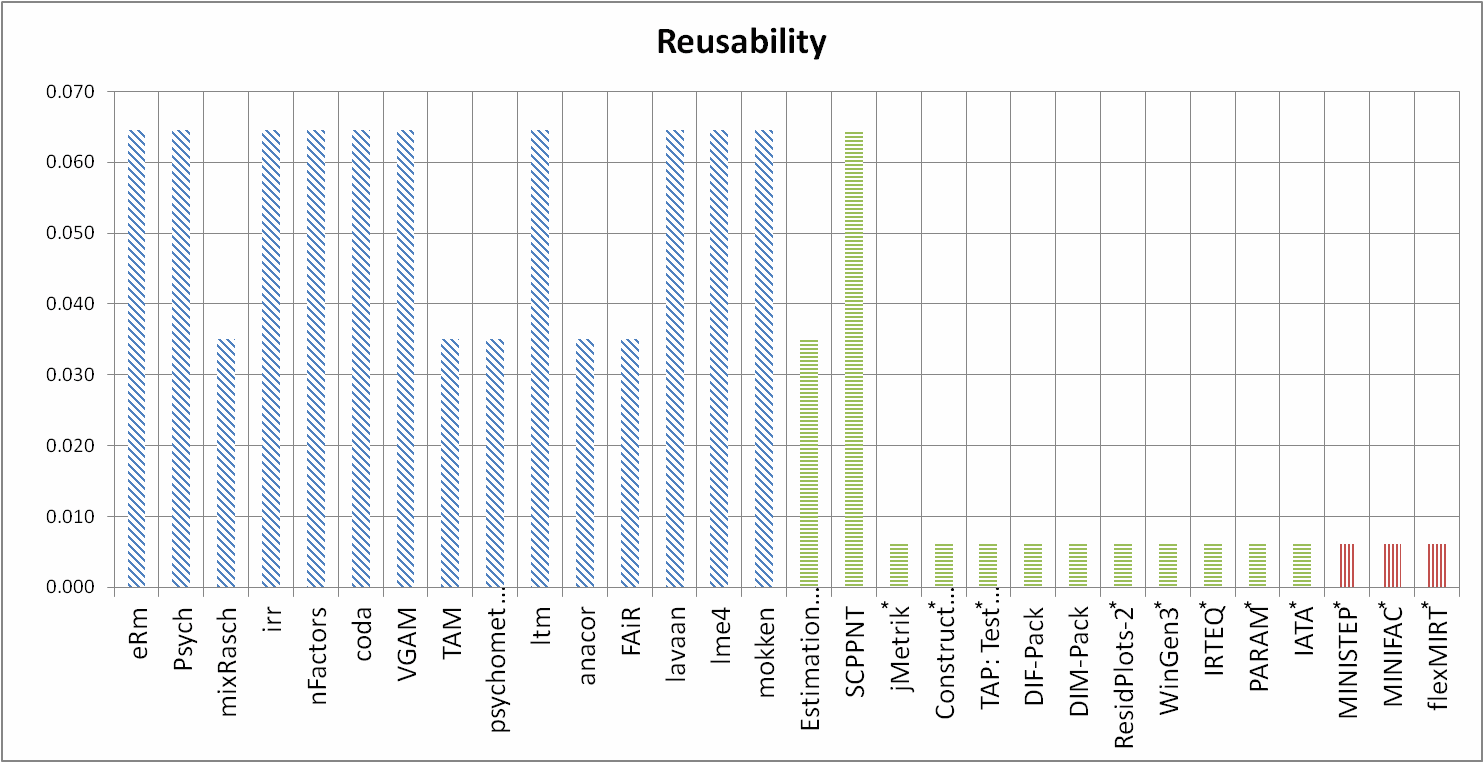
3.2.8 Reusability
We checked to see if the given software is itself used by another package, or if there is evidence that reusability was considered in the design. With reference to Figure 7, our observations are as follows:
-
•
R packages: There is clear evidence that 12 out of 15 software packages have been reused by other packages. Also, the Rd reference manual required by CRAN can serve as an API document (of sorts), which helps others to reuse the package.
-
•
Research group projects: No evidence was found that their packages have been reused. Two of them (ETIRM and SCPPNT) provide API documentation.
-
•
Commercial software: Due to their nature, no accurate result can be presented here.
3.2.9 Portability
We checked which platforms the software is advertised to work on, how people are expected to handle portability, and whether there is evidence in the documentation which shows that portability has been achieved. Since the results are so uniform by category, we omit the figure.
-
•
R packages: These are consistently portable. There are different versions of the package for different platform. Also, software checking results from CRAN showed that it does work well on different platforms.
-
•
Research group projects: All claim to work on Windows, with little evidence of working on other platforms. An attempt for portability does not appear to have been made.
-
•
Commercial software: The results are similar to the research group projects.
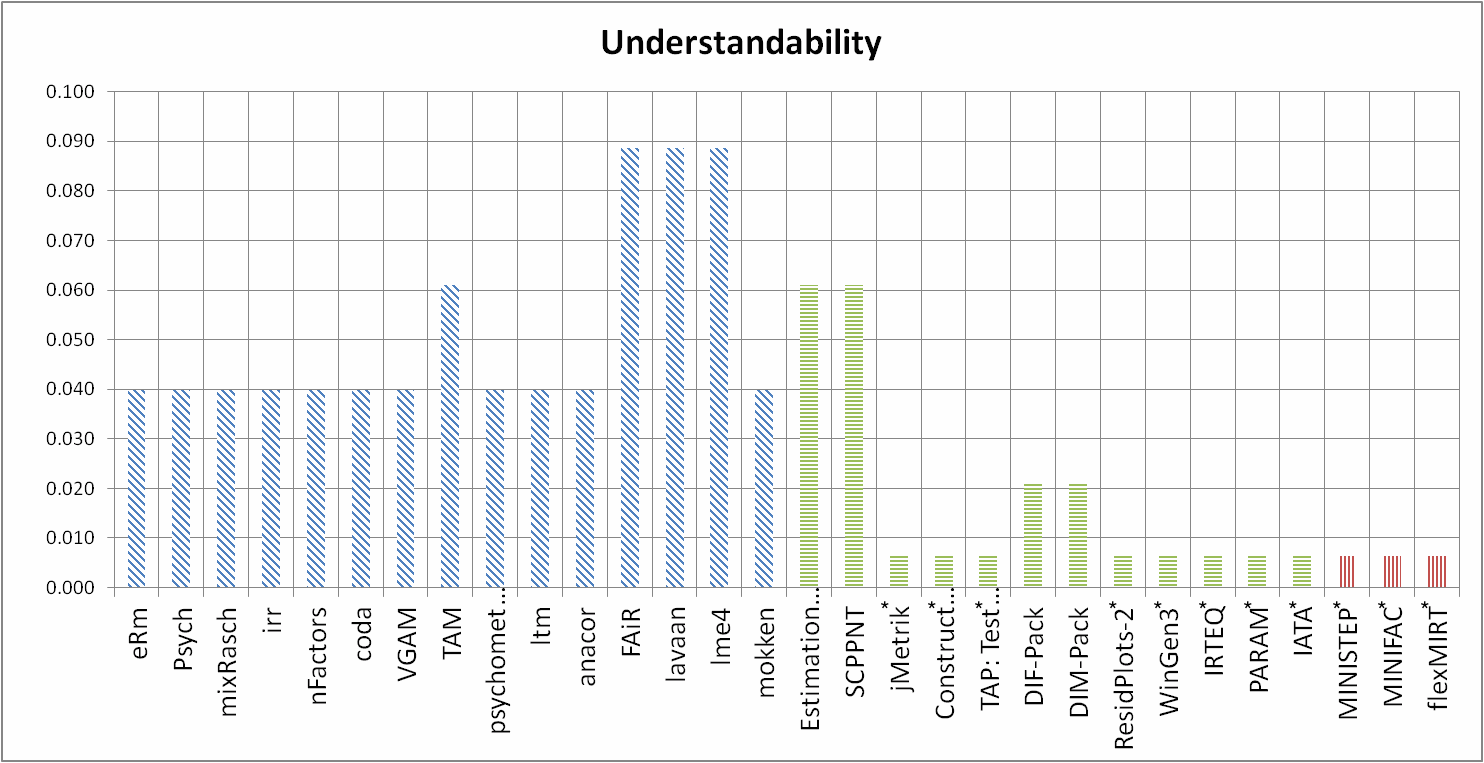
3.2.10 Understandability (Surface)
We checked how easy it is for people to understand the code. We focused on code formatting style, existence of the use of coding standards and comments, identifier and parameters style, use of constants, meaningful file names, whether code is modularized and whether there is a design document. The results are summarized in Figure 8. We can points out the following:
-
•
R packages: These generally do quite well, with some specific stand-outs: (FAiR, lavaan, lme4). One definite issue is that no coding standard is provided (for R in general) and there are few comments in the code. If LP were used to maintain the code and its documentation together, understandability could be greatly improved.
-
•
Research group projects: 8 out of 12 projects are closed source. For the closed source projects, no measure of understandability is given. The common problem for the remaining open source projects is not specifying any coding standard.
-
•
Commercial software: Due to commercial software being closed source, no accurate result can be presented here.
3.2.11 Interoperability
We looked for evidence for any external systems the software communicates or interoperates with, for a workflow that uses other software, and for external interactions (API) being clearly defined. The results for interoperability of the SSP follow. As the results are similar within each category, we omit the figure.
-
•
R packages: These do quite well, largely because of the documentation requirements from CRAN. While there is no obvious evidence that these packages communicate with external system, it is very clear that existing workflows use other R packages.
-
•
No sign of interoperability is found in commercial software and research group projects.
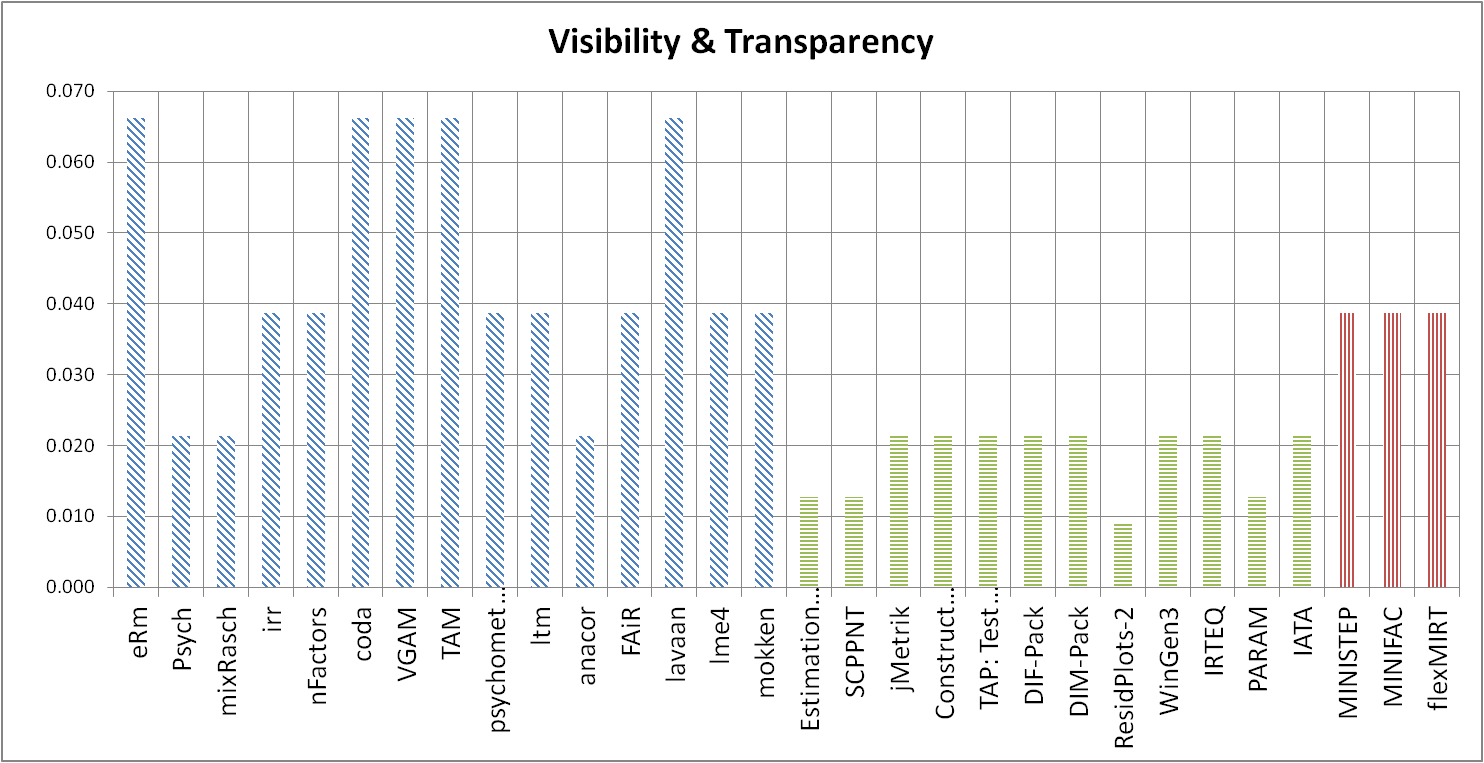
3.2.12 Visibility/Transparency
We looked for a description of the development process. We also give a subjective score about the ease of external examination of the product, relative to the average of the other products being considered. This score is intend to reflect how easy it is for other users to get useful information from the software web site or documentation. The AHP results are shown in Figure 9.
-
•
R packages: No information about the development process is given, but packages like lavaan provide web sites outside of CRAN with detailed information about the software, including examples and instructions. The benefit of the external web sites is that they provide more information to users; the downside is that maintaining information in two different places can be difficult. If an external web site is used, developers need to make sure that all the web sites are up to date, and that links exist between them.
-
•
Research group projects and commercial software: None provide information about their development process for either of these categories, but information on the software is easily obtainable through web sites and documentation.
3.2.13 Reproducibility
We looked for a record of the environment used for development and testing, test data for verification and automated tools used to capture experimental context. Only R packages provide a record of the environment for testing (all of them); the other products do not explicitly address reproducibility. R packages also benefit from the use of Sweave for vignettes (if present).
4 Discussion
It should be clear that different development groups have different priorities; research projects typically aim to advance the state-of-the-art, while commercial projects wish to be profitable. This tends to mean that commercial projects have more of an incentive to provide user-friendly software, with well written manuals, and so on. To a certain extent, the R community tends to fall in the middle of these extremes. On the other hand, it is not clear that such priorities are always reflected in the actual development process. The authors are well aware of research software where very careful attention was paid to usability, and of commercial software which is barely usable (but succeeds because it provides a service for which there is no effective competition).
In other words, while it may appear to be unfair to compare commercial and research software, we disagree: assuming reasonable prices, users do not care so much about these details, but they do care about using software tools to accomplish their tasks. Being scientists, it is fair for us to measure these tools, even if it turns out that the answer simply agrees with conventional wisdom.
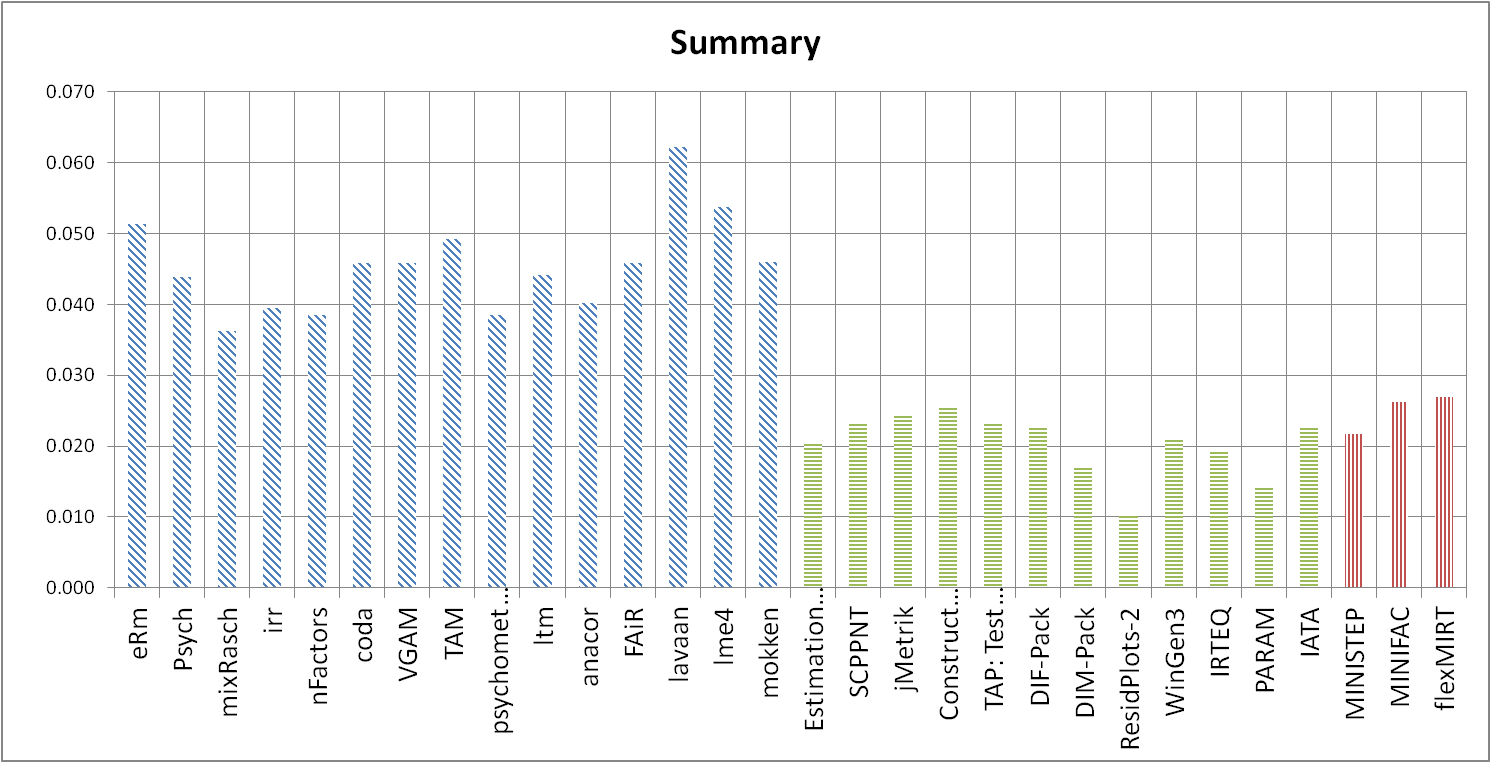
Below, we provide some rankings, based on the measurements reported in the previous section.
For our first analysis (see Figure 10), we use the same weight for each quality. In this case, closed source packages ranked significantly lower, since their open source counterparts provide more information for qualities like maintainability, understandability, etc. Thus, it is not surprising that R packages fare dramatically better. With respect to research projects, the R packages may outperform them because the R community explicitly targets user readiness. As discussed in the introductory section, some software developers implicitly target the “lower” goal of research readiness, since the burdens on design and documentation are lower in this case.
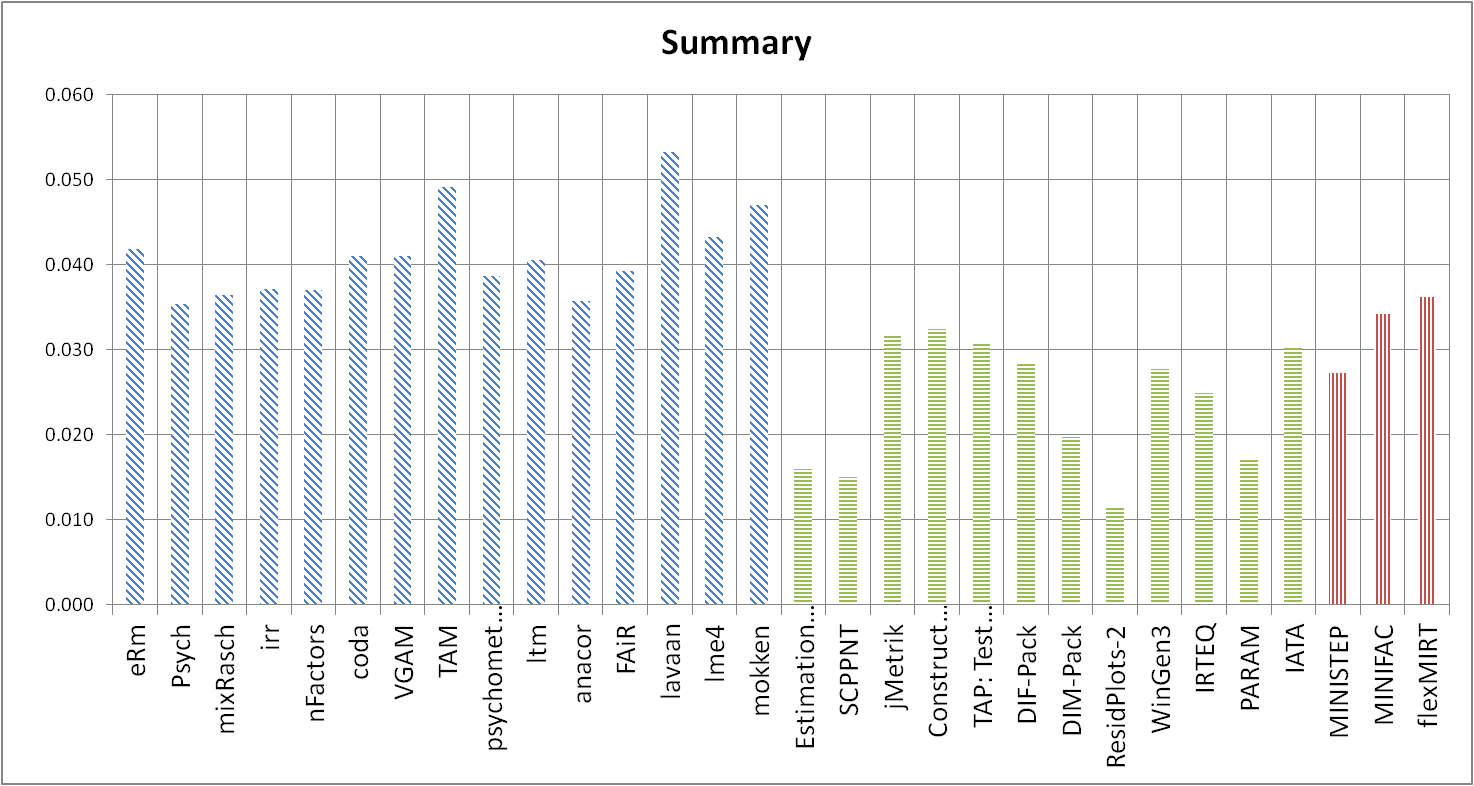
To minimize the influence of open/closed source, we gave correctness & verifiability, maintainability, reusability, understandability and reproducibility low weights (a weight of for these qualities, while all others use ) – See Figure 11. Interestingly, R packages still fare best, but not to the same extent as in the previous analysis.
One could argue that the results shown in Figure 10 are unfairly biased against commercial software. We disagree. They are (unfairly?) biased towards users being able to ascertain that the product they have is of high quality. Most commercial software vendors make choices in how they package their products which make this very difficult. We believe that users should be able to have confidence in the quality of their tools – and to obtain such confidence through direct measurement. This does mean that closed source is a serious impediment; but this is not a barrier to commercialization, just to certain business models.
At the end of the day, every user must decide the relative weight that they want to put on each quality, which is why our full data is available at https://github.com/adamlazz/DomainX.
5 Conclusion and Recommendations
For the surveyed software, R packages clearly performed far better than the other categories for qualities related to development, such as maintainability, reusability, understandability and visibility. As we expected, commercial software provided better usability but could not be easily verified. In terms of quality measurements, research projects usually ranked lower and showed a larger variation in the quality measures between products.
There is much to learn from the success of CRAN. The overall high ranking of R packages stems largely from their use of Rd, Sweave, R CMD check and the CRAN Repository Policy. The policy, together with the support tools, mean that even a single developer project can be perceived externally as being sufficiently well developed to be worth using. A small research project usually does not have the resources to set up an extensive development infrastructure and process, even though the end results would benefit greatly from doing so.
As strong as the R community is, there is still room for improvement. In particular, the documentation of an R extension seems to put too much trust in the development team. The documentation is solely aimed at teaching the use of the code to a new user, not to convincing other developers that the implementation is correct. So while we applaud the use of the LP tool Sweave for the user documentation, we are frankly puzzled that this was not broadened to the code as well. Another area for improvement would be an increased usage of regression testing, supported by automated testing tools. Regression testing can be used to ensure that updates have not broken something that previously worked.
For each of the qualities, we can make further specific recommendations. Some of these sound incredibly obvious, but are nevertheless forced to make them as we found sufficiently many instances of packages which did not do this.
-
•
Installability: Systematically provide detailed installation instructions and a standard suite of test cases for verification of the installation.
-
•
Correctness and Verifiability: Developers should consider following the example provided by CRAN, in terms of the organization of the reference manual, requirement specification, and information about the libraries used. With respect to user examples, commercial software, such as flexMIRT, provides a wide variety of examples. Although CRAN facilitates inclusion of examples, they are not generally required by repository policy – they should consider increasing the number of required examples, possibly through vignettes, to match what is being done by commercial software.
-
•
Reliability: The user documentation, including installation instructions, need to be kept in sync with the software as it is updated.
-
•
Robustness: It was disappointing to see that several programs did not gracefully handle simple incorrect input. Additional testing should be performed (and automated!), and issues uncovered, as shown in Appendix B, should be fixed.
-
•
Usability: CRAN should require a detailed getting started tutorial in addition to, or as part of, the user manual. Commercial software should put more effort in designing a platform-friendly GUI.
-
•
Maintainability: For open source projects, a versioning system and issue tracking tool are strongly suggested. Information like a change log, or how to contribute, should also be presented.
-
•
Reusability: For programs to be reusable, a well-documented API should be provided. If the generation of the documentation can be automated, there is a better chance that this will be done, and that it will be in sync with the code.
-
•
Understandability: Where not currently given, coding standards and design documents should be provided. Developers should consider using LP for code development, so that the code can be written with the goal of human understanding, as opposed to computer understanding. While the R community already uses such tools, for others, they can look to tools such as cweb, noweb, etc.
-
•
Visibility and Transparency: Projects that anticipate the involvement of future developers should provide details about the development process adopted.
-
•
Reproducibility: Developers should explicitly track the environment used for development and testing, to make the software results more reproducible. Through the use of the R environment and Sweave, CRAN provides good examples for how to do this. However, the benefit of Sweave (or similar tools) would be improved if all CRAN developers were required to write vignettes for the package documentation.
References
- van der Ark (2013) van der Ark LA (2013) mokken: Mokken Scale Analysis in R. URL http://cran.r-project.org/web/packages/mokken/index.html, R package version 2.7.5
- Bates et al (2014) Bates D, Maechler M, Bolker B, Walker S, Haubo R, Christensen B, Singmann H, Dai B (2014) lme4: Linear mixed-effects models using Eigen and S4. URL http://cran.r-project.org/web/packages/lme4/index.html, R package version 1.1-7
- Berkeley (2012) Berkeley (2012) ConstructMap. URL http://bearcenter.berkeley.edu/software/constructmap
- CRAN (2014a) CRAN (2014a) The comprehensive r archive network. URL http://cran.r-project.org/
- CRAN (2014b) CRAN (2014b) Cran task view: Psychometric models and methods. URL http://cran.at.r-project.org/web/views/Psychometrics.html
- Davison (2012) Davison AP (2012) Automated capture of experiment context for easier reproducibility in computational research. Computing in Science and Engineering 14(4):48–56
- Dictionary (2014) Dictionary (2014) The free on-line dictionary of computing. URL http://dictionary.reference.com/browse/commercialsoftware
- DIF (2012) DIF (2012) DIF-Pack. URL http://psychometrictools.measuredprogress.org/dif1
- DIM (2012) DIM (2012) DIM-Pack. URL http://psychometrictools.measuredprogress.org/dif2
- Dubois (2005) Dubois PF (2005) Maintaining Correctness in Scientific Programs. Computing in Science & Engineering 7(3):80–85, DOI 10.1109/MCSE.2005.54
- Fletcher (2013) Fletcher TD (2013) psychometric: Applied Psychometric Theory. URL http://cran.r-project.org/web/packages/psychometric/index.html, R package version 2.2
- flexMIRT (2014) flexMIRT (2014) flexMIRT. URL https://flexmirt.vpgcentral.com/
- Gamer et al (2014) Gamer M, Lemon J, Fellows I, Singh P (2014) irr: Various Coefficients of Interrater Reliability and Agreement. URL http://cran.r-project.org/web/packages/irr/index.html, R package version 0.84
- Gewaltig and Cannon (2012) Gewaltig MO, Cannon R (2012) Quality and sustainability of software tools in neuroscience. arXiv preprint arXiv:12053025
- Gewaltig and Cannon (2014) Gewaltig MO, Cannon R (2014) Current practice in software development for computational neuroscience and how to improve it. PLoS computational biology 10(1):1003,376
- Ghezzi et al (2002) Ghezzi C, Jazayeri M, Mandrioli D (2002) Fundamentals of Software Engineering, 2nd edn. Prentice Hall, Upper Saddle River, NJ, USA
- Goodrich (2014) Goodrich B (2014) FAiR: Factor Analysis in R. URL http://cran.r-project.org/web/packages/FAiR/index.html, R package version Ben Goodrich
- Han (2011) Han KT (2011) IRTEQ: Windows Application that Implements IRT Scaling and Equating, Version 1.1. URL http://www.hantest.net/irteq
- Han (2013) Han KT (2013) WinGen3. URL http://www.hantest.net/wingen
- Heaton and Carver (2015) Heaton D, Carver JC (2015) Claims about the use of software engineering practices in science: A systematic literature review. Information and Software Technology 67:207 – 219, DOI http://dx.doi.org/10.1016/j.infsof.2015.07.011, URL http://www.sciencedirect.com/science/article/pii/S0950584915001342
- Herr (2002) Herr N (2002) Summary of Don Norman’s design principles. URL http://www.csun.edu/science/courses/671/bibliography/preece.html
- IATA (2014) IATA (2014) IATA. URL http://www.polymetrika.org/IATA
- jMetrik (2014) jMetrik (2014) jMetrik. URL http://www.itemanalysis.com/index.php
- Kanewala and Bieman (2014) Kanewala U, Bieman JM (2014) Testing scientific software: A systematic literature review. Information and Software Technology 56(10):1219 – 1232, DOI http://dx.doi.org/10.1016/j.infsof.2014.05.006, URL http://www.sciencedirect.com/science/article/pii/S0950584914001232
- Kiefer et al (2014) Kiefer T, Robitzsch A, Wu M (2014) TAM: Test Analysis Modules. URL http://cran.r-project.org/web/packages/TAM/index.html, R package version 1.0-3
- Knuth (1984) Knuth DE (1984) Literate programming. The Computer Journal 27(2):97–111, DOI 10.1093/comjnl/27.2.97, URL http://comjnl.oxfordjournals.org/content/27/2/97.abstract, http://comjnl.oxfordjournals.org/content/27/2/97.full.pdf+html
- Laurent (2004) Laurent AMS (2004) Understanding Open Source and Free Software Licensing. O’Reilly Media, Inc.
- de Leeuw and Mair (2007) de Leeuw J, Mair P (2007) An introduction to the special volume on psychometrics in r. Journal of Statistical Software 20(1):1–5, URL http://www.jstatsoft.org/v20/i01
- de Leeuw and Mair (2014) de Leeuw J, Mair P (2014) anacor: Simple and Canonical Correspondence Analysis. URL http://cran.r-project.org/web/packages/anacor/index.html, R package version 1.0-4
- Leisch (2002) Leisch F (2002) Sweave: Dynamic generation of statistical reports using literate data analysis. In: Härdle W, Rönz B (eds) Compstat 2002 — Proceedings in Computational Statistics, Physica Verlag, Heidelberg, pp 575–580, URL http://www.stat.uni-muenchen.de/~leisch/Sweave, iSBN 3-7908-1517-9
- Liang et al (2008) Liang T, Han KT, Hambleton RK (2008) ResidPlots-2. URL http://www.umass.edu/remp/software/residplots/
- LINFO (2006) LINFO (2006) Freeware definition by the linux information project (linfo). URL http://www.linfo.org/freeware.html
- Mair et al (2014) Mair P, Hatzinger R, Maier MJ (2014) eRm: Extended Rasch Modeling. URL http://cran.r-project.org/web/packages/eRm/index.html, R package version 0.15-4
- MINIFAC (2014) MINIFAC (2014) MINIFAC. URL http://www.winsteps.com/minifac.htm
- MINISTEP (2014) MINISTEP (2014) MINISTEP. URL http://www.winsteps.com/ministep.htm
- NCME (2014) NCME (2014) Psychometric software database — national council on measurement in education. URL http://ncme.org/resource-center/psychometric-software-database/
- Nedialkov (2010) Nedialkov NS (2010) Implementing a Rigorous ODE Solver through Literate Programming. Tech. Rep. CAS-10-02-NN, Department of Computing and Software, McMaster University, Hamilton, ON, Canada
- Plummer et al (2014) Plummer M, Best N, Cowles K, Vines K, Sarkar D, Almond R (2014) coda: Output analysis and diagnostics for MCMC. URL http://cran.r-project.org/web/packages/coda/index.html, R package version 0.16-1
- R Core Team (2014) R Core Team (2014) Writing R extensions. URL http://cran.r-project.org/doc/manuals/r-release/R-exts.html
- Raiche and Magis (2014) Raiche G, Magis D (2014) nFactors: Parallel Analysis and Non Graphical Solutions to the Cattell Scree Test. URL http://cran.r-project.org/web/packages/nFactors/index.html, R package version 2.3.3
- Revelle (2014) Revelle W (2014) psych: Procedures for Psychological, Psychometric, and Personality Research. URL http://cran.r-project.org/web/packages/psych/index.html, R package version 1.4.5
- Rizopoulos (2014) Rizopoulos D (2014) ltm: Latent Trait Models under IRT. URL http://cran.r-project.org/web/packages/ltm/index.html, R package version 1.0-0
- Rosseel (2012) Rosseel Y (2012) lavaan: An r package for structural equation modeling. Journal of Statistical Software 48(2):1–36, URL http://www.jstatsoft.org/v48/i02
- Rosseel et al (2014) Rosseel Y, Oberski D, Byrnes J, Vanbrabant L, Savalei V, Merkle E, Hallquist M, Rhemtulla M, Katsikatsou M, Barendse M (2014) lavaan: Latent Variable Analysis. URL http://cran.r-project.org/web/packages/lavaan/index.html, R package version 0.5-16
- Rudner (2012) Rudner LM (2012) PARAM. URL http://echo.edres.org:8080/irt/param/
- Saaty (1990) Saaty T (1990) How to make a decision: The analytic hierarchy process. European Journal of Operational Research 48(1):9–26
- Saaty (1994) Saaty T (1994) How to make a decision: The analytic hierarchy process. Interfaces 24(6):19–43
- TAP (2014) TAP (2014) TAP: Test Analysis Program. URL http://www.ohio.edu/people/brooksg/software.htm#TAP
- Triantaphyllou (1995) Triantaphyllou SHM (1995) Using the analytic hierarchy process for decision making in engineering applications. International Journal of Industrial Engineering: Applications and Practice 2(1):35–44
- Wickham (2011) Wickham H (2011) testthat: Get started with testing. The R Journal 3:5–10, URL http://journal.r-project.org/archive/2011-1/RJournal_2011-1_Wickham.pdf
- Wikipedia (2014) Wikipedia (2014) Psychometric software — wikipedia, the free encyclopedia. URL http://en.wikipedia.org/w/index.php?title=Psychometric_software&oldid=607324773
- Willse (2014) Willse JT (2014) mixRasch: Mixture Rasch Models with JMLE. URL http://cran.r-project.org/web/packages/mixRasch/, R package version 1.1
- Wilson et al (2013) Wilson G, Aruliah D, Brown CT, Hong NPC, Davis M, Guy RT, Haddock SH, Huff KD, Mitchell IM, Plumblet MD, Waugh B, White EP, Wilson P (2013) Best practices for scientific computing. CoRR abs/1210.0530
- Wothke (2007) Wothke W (2007) Simple C++ Numerical Toolkit. URL http://www.smallwaters.com/software/cpp/scppnt.html
- Wothke (2008) Wothke W (2008) ETIRM: Estimation Toolkit for Item Response Models. URL http://www.smallwaters.com/software/cpp/etirm.html
- Yee (2013) Yee TW (2013) VGAM: Vector Generalized Linear and Additive Models. URL http://cran.r-project.org/web/packages/VGAM/index.html, R package version 0.9-4
Appendix A Full grading template
The table below lists the full set of measures that are assessed for each software product. The measures are grouped under headings for each quality, and one for summary information. Following each measure, the type for a valid result is given in brackets. Many of the types are given as enumerated sets. For instance, the response on many of the questions is one of “yes,” “no,” or “unclear.” The type “number” means natural number, a positive integer. The types for date and url are not explicitly defined, but they are what one would expect from their names. In some cases the response for a given question is not necessarily limited to one answer, such as the question on what platforms are supported by the software product. Case like this are indicated by “set of” preceding the type of an individual answer. The type in these cases are then the power set of the individual response type. In some cases a superscript ∗ is used to indicate that a response of this type should be accompanied by explanatory text. For instance, if problems were caused by uninstall, the reviewer should note what problems were caused. An (I) precedes the question description when its measurement requires a successful installation.
| Summary Information |
| Software name? (string) |
| URL? (url) |
| Educational institution (string) |
| Software purpose (string) |
| Number of developers (number) |
| How is the project funded (string) |
| Number of downloads for current version (number) |
| Release date (date) |
| Last updated (date) |
| Status ({alive, dead, unclear}) |
| License ({GNU GPL, BSD, MIT, terms of use, trial, none, unclear}) |
| Platforms (set of {Windows, Linux, OS X, Android, Other OS}) |
| Category ({concept, public, private}) |
| Development model ({open source, freeware, commercial}) |
| Publications using the software (set of url) |
| Publications about the software (set of url) |
| Is source code available? ({yes, no}) |
| Programming language(s) (set of {FORTRAN, Matlab, C, C++, Java, R, Ruby, Python, Cython, BASIC, Pascal, IDL, unclear}) |
| Installability (Measured via installation on a virtual machine.) |
| Are there installation instructions? ({yes, no}) |
| Are the installation instructions linear? ({yes, no, n/a}) |
| Is there something in place to automate the installation? ({yes∗, no}) |
| Is there a specified way to validate the installation, such as a test suite? ({yes∗, no}) |
| How many steps were involved in the installation? (number) |
| How many software packages need to be installed before or during installation? (number) |
| (I) Run uninstall, if available. Were any obvious problems caused? ({unavail, yes∗, no}) |
| Overall impression? ({1 .. 10}) |
| Correctness and Verifiability |
| Are external libraries used? ({yes∗, no, unclear}) |
| Does the community have confidence in this library? ({yes, no, unclear}) |
| Any reference to the requirements specifications of the program? ({yes∗, no, unclear}) |
| What tools or techniques are used to build confidence of correctness? (string) |
| (I) If there is a getting started tutorial, is the output as expected? ({yes, no∗, n/a}) |
| Overall impression? ({1 .. 10}) |
| Surface Reliability |
| Did the software “break” during installation? ({yes∗, no}) |
| (I) Did the software “break” during the initial tutorial testing? ({yes∗, no, n/a}) |
| Overall impression? ({1 .. 10}) |
| Surface Robustness |
| (I) Does the software handle garbage input reasonably? ({yes, no∗}) |
| (I) For any plain text input files, if all new lines are replaced with new lines and carriage returns, will the software handle this gracefully? ({yes, no∗, n/a}) |
| Overall impression? ({1 .. 10}) |
| Surface Performance |
| Is there evidence that performance was considered? ({yes∗, no}) |
| Overall impression? ({1 .. 10}) |
| Surface Usability |
| Is there a getting started tutorial? ({yes, no}) |
| Is there a standard example that is explained? ({yes, no}) |
| Is there a user manual? ({yes, no}) |
| (I) Does the application have the usual “look and feel” for the platform it is on? ({yes, no∗}) |
| (I) Are there any features that show a lack of visibility? ({yes, no∗}) |
| Are expected user characteristics documented? ({yes, no}) |
| What is the user support model? (string) |
| Overall impression? ({1 .. 10}) |
| Maintainability |
| Is there a history of multiple versions of the software? ({yes, no, unclear}) |
| Is there any information on how code is reviewed, or how to contribute? ({yes∗, no}) |
| Is there a changelog? ({yes, no}) |
| What is the maintenance type? (set of {corrective, adaptive, perfective, unclear}) |
| What issue tracking tool is employed? (set of {Trac, JIRA, Redmine, e-mail, discussion board, sourceforge, google code, git, none, unclear}) |
| Are the majority of identified bugs fixed? ({yes, no∗, unclear}) |
| Which version control system is in use? ({svn, cvs, git, github, unclear}) |
| Is there evidence that maintainability was considered in the design? ({yes∗, no}) |
| Are there code clones? ({yes∗, no, unclear}) |
| Overall impression? ({1 .. 10}) |
| Reusability |
| Are any portions of the software used by another package? ({yes∗, no}) |
| Is there evidence that reusability was considered in the design? (API documented, web service, command line tools, …) ({yes∗, no, unclear}) |
| Overall impression? ({1 .. 10}) |
| Portability |
| What platforms is the software advertised to work on? (set of {Windows, Linux, OS X, Android, Other OS}) |
| Are special steps taken in the source code to handle portability? ({yes∗, no, n/a}) |
| Is portability explicitly identified as NOT being important? ({yes, no}) |
| Convincing evidence that portability has been achieved? ({yes∗, no}) |
| Overall impression? ({1 .. 10}) |
| Surface Understandability (Based on 10 random source files) |
| Consistent indentation and formatting style? ({yes, no, n/a}) |
| Explicit identification of a coding standard? ({yes∗, no, n/a}) |
| Are the code identifiers consistent, distinctive, and meaningful? ({yes, no∗, n/a}) |
| Are constants (other than 0 and 1) hard coded into the program? ({yes, no∗, n/a}) |
| Comments are clear, indicate what is being done, not how? ({yes, no∗, n/a}) |
| Is the name/URL of any algorithms used mentioned? ({yes, no∗, n/a}) |
| Parameters are in the same order for all functions? ({yes, no∗, n/a}) |
| Is code modularized? ({yes, no∗, n/a}) |
| Descriptive names of source code files? ({yes, no∗, n/a}) |
| Is a design document provided? ({yes∗, no, n/a}) |
| Overall impression? ({1 .. 10}) |
| Interoperability |
| Does the software interoperate with external systems? ({yes∗, no}) |
| Is there a workflow that uses other softwares? ({yes∗, no}) |
| If there are external interactions, is the API clearly defined? ({yes∗, no, n/a}) |
| Overall impression? ({1 .. 10}) |
| Visibility/Transparency |
| Is the development process defined? If yes, what process is used. ({yes∗, no, n/a}) |
| Ease of external examination relative to other products considered? ({1 .. 10}) |
| Overall impression? ({1 .. 10}) |
| Reproducibility |
| Is there a record of the environment used for their development and testing? ({yes∗, no}) |
| Is test data available for verification? ({yes, no}) |
| Are automated tools used to capture experimental context? ({yes∗, no}) |
| Overall impression? ({1 .. 10}) |
Appendix B Summary of Measurements
B.1 Installability
The columns of the table below should be read as follows:
II: Installation instructions available, II linear:
Linear installation instructions, AI: Automated Installation,
Inst Valid: Tests for installation validation, # S/w lib: Number of
software/libraries required for installation, uninst: Any uninstallation
problem?
| Name | II | II linear | AI | Inst Valid | # of Steps | # S/w lib | uninst |
|---|---|---|---|---|---|---|---|
| eRm | yes | yes | yes | no | 2 | 1 | no |
| Psych | yes | yes | yes | no | 4 | 4 | no |
| mixRasch | general | yes | yes | no | 2 | 1 | no |
| irr | general | yes | yes | no | 2 | 2 | no |
| nFactors | general | yes | yes | no | 2 | 4 | no |
| coda | general | yes | yes | no | 2 | 1 | no |
| VGAM | general | yes | yes | no | 2 | 4 | no |
| TAM | yes | yes | yes | no | 2 | 7 | no |
| psychometric | general | yes | yes | no | 2 | 3 | no |
| ltm | general | yes | yes | no | 2 | 3 | no |
| anacor | yes | yes | yes | no | 2 | 5 | no |
| FAiR | yes | yes | yes | no | 3 | 7 | no |
| lavaan | yes | yes | yes | yes | 2 | 13 | no |
| lme4 | yes | yes | yes | no | 2 | 16 | no |
| mokken | yes | yes | yes | no | 2 | 1 | no |
| ETIRM | yes | no | yes | no | 4 | 2 | n/a |
| SCPPNT | no | n/a | yes | no | 1 | 0 | n/a |
| jMetrik | yes | yes | yes | no | 1 | 0 | no |
| ConstructMap | yes | yes | yes | no | 1 | 1 | no |
| TAP | yes | yes | yes | no | 1 | 1 | no |
| DIF-Pack | yes | yes | yes | no | 5 | 1 | no |
| DIM-Pack | yes | yes | yes | no | 5 | 1 | no |
| ResidPlots-2 | no | n/a | yes | no | 1 | 1 | no |
| WinGen3 | yes | yes | yes | no | 2 | 2 | no |
| IRTEQ | no | n/a | yes | no | 2 | 2 | no |
| PARAM | no | n/a | yes | yes | 1 | 1 | no |
| IATA | no | n/a | yes | no | 2 | 2 | no |
| MINISTEP | yes | yes | yes | no | 1 | 1 | no |
| MINIFAC | yes | yes | yes | no | 1 | 1 | no |
| flexMIRT | yes | yes | yes | no | 1 | 1 | no |
B.2 Correctness and Verifiability
The columns of the table below should be read as follows:
Library: Use of standard libraries,
SRS: Software Requirements Specification, Evidence?: Evidence to build
confidence?, Example: Standard example explained.
| Name | Library | SRS | Evidence? | Example |
|---|---|---|---|---|
| eRm | yes (Cran) | yes | manual | yes |
| Psych | yes (Cran) | yes | manual | yes |
| mixRasch | yes (Cran) | no | manual | yes (no expected output) |
| irr | yes (Cran) | no | manual | yes (no expected output) |
| nFactors | yes (Cran) | no | manual | yes (no expected output) |
| coda | yes (Cran) | yes | manual | yes (no expected output) |
| VGAM | yes (Cran) | yes | manual | yes (no expected output) |
| TAM | yes (Cran) | no | manual | yes |
| psychometric | yes (Cran) | no | manual | yes (no expected output) |
| ltm | yes (Cran) | yes | manual | small difference in answers |
| anacor | yes (Cran) | yes | manual | yes (no expected output) |
| FAiR | yes (Cran) | yes | manual | yes (no expected output) |
| lavaan | yes (Cran) | yes | manual | yes |
| lme4 | yes (Cran) | yes | manual | yes |
| mokken | yes (Cran) | yes | manual | yes |
| ETIRM | yes (SCPPNT) | no | no | yes (no expected output) |
| SCPPNT | no | no | no | yes |
| jMetrik | yes (psychometric) | no | no | yes (not from latest version) |
| ConstructMap | ? | no | test case | yes (output not clear) |
| TAP | ? | no | no | yes (no expected output) |
| DIF-Pack | ? | no | no | yes (no expected output) |
| DIM-Pack | ? | no | no | no |
| ResidPlots-2 | ? | no | no | Example data is not given |
| WinGen3 | ? | no | no | yes (no expected output) |
| IRTEQ | ? | no | no | yes |
| PARAM | ? | no | no | yes (no expected output) |
| IATA | ? | no | no | yes (no expected output) |
| MINISTEP | ? | no | no | yes |
| MINIFAC | ? | no | no | yes |
| flexMIRT | ? | no | no | yes |
B.3 Reliability, Robustness and Performance
The columns of the table below should be read as follows:
install: Software breaks during installation, test: Software breaks during initial tutorial testing, Wrong I/P handling: Handling of wrong input by software, Format: Can the software gracefully handle a change of the format of text input files where the end of line follows a different convention?, Perf: Evidence that performance was considered?
| Name | install | test | Wrong I/P handling | Format | Perf |
|---|---|---|---|---|---|
| eRm | yes | no | yes | n/a | ? |
| Psych | yes | no | yes | n/a | ? |
| mixRasch | no | no | yes | n/a | ? |
| irr | no | no | ? | n/a | ? |
| nFactors | no | no | ? | n/a | ? |
| coda | no | no | ? | n/a | ? |
| VGAM | no | no | ? | n/a | ? |
| TAM | no | no | yes | n/a | ? |
| psychometric | no | no | yes | n/a | ? |
| ltm | no | no | yes | n/a | ? |
| anacor | yes | no | ? | n/a | ? |
| FAiR | yes | yes | yes | n/a | ? |
| lavaan | no | no | yes | n/a | ? |
| lme4 | no | no | yes | n/a | ? |
| mokken | no | no | yes | n/a | ? |
| ETIRM | no | ? | ? | n/a | ? |
| SCPPNT | yes | no | yes | n/a | ? |
| jMetrik | yes | no | yes | yes | ? |
| ConstructMap | no | no | no | n/a | ? |
| TAP | no | no | yes | n/a | ? |
| DIF-Pack | no | no | yes | n/a | ? |
| DIM-Pack | no | ? | yes | n/a | ? |
| ResidPlots-2 | no | ? | ? | n/a | ? |
| WinGen3 | no | no | yes | n/a | ? |
| IRTEQ | no | no | no | n/a | ? |
| PARAM | no | no | no | n/a | ? |
| IATA | no | no | yes | n/a | ? |
| MINISTEP | no | no | no | no | ? |
| MINIFAC | no | no | yes | yes | ? |
| flexMIRT | no | no | yes | n/a | ? |
B.4 Usability
The columns of the table below should be read as follows:
Tut: Getting started tutorial, Ex: Standard example, UM:
User Manual, Look/feel: Usual look and feel of software, Vis: Lack of
visibility (Norman’s Principle), User Char: User characteristics documented.
| Name | Tut | Ex | UM | Look/feel | Vis | User Char | User support |
|---|---|---|---|---|---|---|---|
| eRm | no | yes | yes | yes | yes | yes | Forum/Email |
| Psych | yes | yes | yes | yes | yes | no | |
| mixRasch | no | yes | yes | yes | yes | no | |
| irr | no | yes | yes | yes | yes | no | |
| nFactors | no | yes | yes | yes | yes | no | |
| coda | no | yes | yes | yes | yes | no | |
| VGAM | no | yes | yes | yes | yes | no | |
| TAM | yes | yes | yes | yes | yes | no | |
| psychometric | no | yes | yes | yes | yes | no | |
| ltm | no | yes | yes | yes | yes | no | Email/FAQ |
| anacor | no | yes | yes | yes | yes | no | Email/Forum |
| FAiR | no | yes | yes | yes | yes | no | |
| lavaan | yes | yes | yes | yes | yes | no | Email/Discussion group |
| lme4 | no | yes | yes | yes | yes | no | |
| mokken | yes | yes | yes | yes | yes | yes | |
| ETIRM | no | yes | no | no | yes | no | |
| SCPPNT | no | no | no | no | yes | no | |
| jMetrik | yes | yes | no | yes | no | yes | Email/FAQ/Tech support |
| ConstructMap | yes | yes | yes | yes | no | no | Email/FAQ |
| TAP | yes | yes | yes | yes | no | yes | |
| DIF-Pack | yes | yes | yes | no | no | no | Email/Discussion group |
| DIM-Pack | no | no | no | no | no | no | Email/Discussion group |
| ResidPlots-2 | no | yes | yes | no | no | no | |
| WinGen3 | yes | yes | yes | yes | no | no | Email/Survey |
| IRTEQ | yes | yes | yes | yes | no | no | |
| PARAM | no | no | yes | no | no | no | no |
| IATA | yes | yes | yes | no | no | yes | |
| MINISTEP | yes | yes | yes | no | no | no | Forum/Feedback/Email |
| MINIFAC | yes | yes | yes | no | no | no | Forum/Feedback/Email |
| flexMIRT | yes | yes | yes | yes | no | no |
B.5 Maintainability
The columns of the table below should be read as follows:
VH: Versions History available, RC: Information on reviewing and
Contributing, log: Change log available, MT: Maintenance Type, Issue:
Issue tracking tool, Bugs: Majority of bugs fixed, VS:
Versioning System used, Evid: Any evidence that maintainability was
considered in design, Clone: Are there code clones?, C: Corrective, P:
Perfective, A: Adaptive.
| Name | VH | RC | log | MT | Issue | Bugs | VS | Evid | Clone |
|---|---|---|---|---|---|---|---|---|---|
| eRm | yes | yes | yes | C | Tracker | yes | svn | yes | |
| Psych | yes | check | yes | C/P | ? | yes | ? | yes | no |
| mixRasch | yes | check | no | ? | ? | ? | ? | yes | no |
| irr | yes | check | no | ? | ? | ? | ? | yes | no |
| nFactors | yes | check | no | ? | ? | ? | ? | yes | no |
| coda | yes | check | yes | C/P | ? | yes | ? | yes | no |
| VGAM | yes | check | yes | C/P | ? | yes | ? | yes | no |
| TAM | yes | check | yes | C/P | ? | yes | ? | yes | no |
| psychometric | yes | check | no | ? | ? | ? | ? | yes | no |
| ltm | yes | check | yes | C/P | ? | yes | ? | yes | no |
| anacor | yes | yes | no | ? | Tracker | yes | svn | yes | no |
| FAiR | yes | check | yes | C/P | ? | yes | ? | yes | no |
| lavaan | yes | yes | yes | C/P | git | yes | git | yes | no |
| lme4 | yes | yes | yes | C/P | git | yes | git | yes | no |
| mokken | yes | check | no | ? | no | ? | ? | yes | no |
| ETIRM | yes | no | no | ? | no | ? | ? | yes | no |
| SCPPNT | yes | no | yes | P | ? | yes | ? | yes | no |
| jMetrik | yes | no | yes | C/P | ? | ? | ? | ? | ? |
| ConstructMap | yes | no | yes | C/P | ? | ? | ? | ? | ? |
| TAP | yes | no | no | ? | ? | ? | ? | ? | ? |
| DIF-Pack | no | contri | no | ? | ? | ? | ? | no | no |
| DIM-Pack | no | contri | no | ? | ? | ? | ? | no | no |
| ResidPlots-2 | no | no | no | ? | ? | ? | ? | ? | ? |
| WinGen3 | no | no | no | ? | ? | ? | ? | ? | ? |
| IRTEQ | no | no | no | ? | ? | ? | ? | ? | ? |
| PARAM | no | no | no | ? | ? | ? | ? | ? | ? |
| IATA | no | no | no | ? | ? | ? | ? | ? | ? |
| MINISTEP | yes | no | yes | C/P | ? | ? | ? | ? | ? |
| MINIFAC | yes | no | yes | C/P | ? | ? | ? | ? | ? |
| flexMIRT | no | no | no | ? | ? | ? | ? | ? | ? |
B.6 Reusability
| Name | S/w reused by any package | Any evidence of reusability |
|---|---|---|
| eRm | yes | yes (API) |
| Psych | yes | yes (API) |
| mixRasch | ? | yes (API) |
| irr | yes | yes (API) |
| nFactors | yes | yes (API) |
| coda | yes | yes (API) |
| VGAM | yes | yes (API) |
| TAM | yes | yes (API) |
| psychometric | yes | yes (API) |
| ltm | yes | yes (API) |
| anacor | no | yes (API) |
| FAiR | no | yes (API) |
| lavaan | yes | yes (API) |
| lme4 | yes | yes (API) |
| mokken | yes | yes (API) |
| ETIRM | no | yes |
| SCPPNT | yes | yes |
| jMetrik | no | no |
| ConstructMap | no | no |
| TAP | no | no |
| DIF-Pack | no | no |
| DIM-Pack | no | no |
| ResidPlots-2 | no | no |
| WinGen3 | no | no |
| IRTEQ | no | no |
| PARAM | no | no |
| IATA | no | no |
| MINISTEP | no | no |
| MINIFAC | no | no |
| flexMIRT | no | no |
B.7 Portability
The columns of the table below should be read as follows:
Platforms: Platforms specified for the software to work on, Port in
code: How portability is handled (if source code given), Port not imp:
Portability explicitly identified as not important, Evid in doc: Convincing
evidence present in documentation for portability?.
| Name | Platforms | Port in code | Port not imp | Evid in doc |
|---|---|---|---|---|
| eRm | Win/Mac/Linux | Branch in repository | no | yes |
| Psych | Win/Mac/Linux | Branch in repository | no | yes |
| mixRasch | Win/Mac/Linux | Branch in repository | no | yes |
| irr | Win/Mac/Linux | Branch in repository | no | yes |
| nFactors | Win/Mac/Linux | Branch in repository | no | yes |
| coda | Win/Mac/Linux | Branch in repository | no | yes |
| VGAM | Win/Mac/Linux | Branch in repository | no | yes |
| TAM | Win/Mac/Linux | Branch in repository | no | yes |
| psychometric | Win/Mac/Linux | Branch in repository | no | yes |
| ltm | Win/Mac/Linux | Branch in repository | no | yes |
| anacor | Win/Mac/Linux | Branch in repository | no | yes |
| FAiR | Win/Mac/Linux | Branch in repository | no | yes |
| lavaan | Win/Mac/Linux | Branch in repository | no | yes |
| lme4 | Win/Mac/Linux | Branch in repository | no | yes |
| mokken | Win/Mac/Linux | Branch in repository | no | yes |
| ETIRM | Win/Mac/Linux | no | no | no |
| SCPPNT | Win/Mac/Linux | no | no | no |
| jMetrik | Win/Mac/Linux | n/a | no | ? |
| ConstructMap | Win/Mac/Linux | n/a | no | ? |
| TAP | Win | n/a | no | no |
| DIF-Pack | Win | ? | no | no |
| DIM-Pack | Win | ? | no | no |
| ResidPlots-2 | Win | n/a | no | no |
| WinGen3 | Win | n/a | no | no |
| IRTEQ | Win | n/a | no | no |
| PARAM | Win | n/a | no | no |
| IATA | Win | n/a | no | no |
| MINISTEP | Win | n/a | no | yes |
| MINIFAC | Win | n/a | no | yes |
| flexMIRT | Win | n/a | no | no |
B.8 Understandability (of code)
The columns of the table below should be read as follows:
Frmt: Consistent identation and formatting, Std: Explicit
coding standard, Id: Distinctive, meaningful Identifier names, Const:
Constants (other than 0 or 1) hard coded, PC: Proper comments, Algo:
Reference to algorithm used, Mod: Code is modularised, Para: Parameters
are in same order, SC: Descriptive names of Source Code files, DD: Design
Document present.
| Name | Frmt | Std | Id | Const | PC | Algo | Mod | Para | SC | DD |
|---|---|---|---|---|---|---|---|---|---|---|
| eRm | yes | no | yes | no | no | no | yes | yes | yes | yes |
| Psych | yes | no | yes | no | no | no | yes | yes | yes | yes |
| mixRasch | yes | no | yes | no | no | no | yes | yes | yes | yes |
| irr | yes | no | yes | no | no | no | yes | yes | yes | yes |
| nFactors | yes | no | yes | no | no | no | yes | yes | yes | yes |
| coda | yes | no | yes | no | no | no | yes | yes | yes | yes |
| VGAM | yes | no | yes | no | no | no | yes | yes | yes | yes |
| TAM | yes | no | yes | no | yes | no | yes | yes | yes | yes |
| psychometric | yes | no | yes | no | no | no | yes | yes | yes | yes |
| ltm | yes | no | yes | no | no | no | yes | yes | yes | yes |
| anacor | no | no | yes | no | yes | yes | yes | yes | yes | yes |
| FAiR | yes | no | yes | no | yes | yes | yes | yes | yes | yes |
| lavaan | yes | no | yes | no | yes | yes | yes | yes | yes | yes |
| lme4 | yes | no | yes | no | yes | yes | yes | yes | yes | yes |
| mokken | yes | no | yes | no | yes | no | yes | yes | yes | yes |
| ETIRM | yes | no | yes | no | yes | no | yes | yes | yes | yes |
| SCPPNT | yes | no | yes | no | yes | no | yes | yes | yes | yes |
| jMetrik | n/a | n/a | n/a | n/a | n/a | n/a | n/a | n/a | n/a | no |
| ConstructMap | n/a | n/a | n/a | n/a | n/a | n/a | n/a | n/a | n/a | no |
| TAP | n/a | n/a | n/a | n/a | n/a | n/a | n/a | n/a | n/a | no |
| DIF-Pack | yes | no | yes | yes | yes | no | yes | no | yes | no |
| DIM-Pack | yes | no | yes | yes | yes | no | yes | no | yes | no |
| ResidPlots-2 | n/a | n/a | n/a | n/a | n/a | n/a | n/a | n/a | n/a | no |
| WinGen3 | n/a | n/a | n/a | n/a | n/a | n/a | n/a | n/a | n/a | no |
| IRTEQ | n/a | n/a | n/a | n/a | n/a | n/a | n/a | n/a | n/a | no |
| PARAM | n/a | n/a | n/a | n/a | n/a | n/a | n/a | n/a | n/a | no |
| IATA | n/a | n/a | n/a | n/a | n/a | n/a | n/a | n/a | n/a | no |
| MINISTEP | n/a | n/a | n/a | n/a | n/a | n/a | n/a | n/a | n/a | no |
| MINIFAC | n/a | n/a | n/a | n/a | n/a | n/a | n/a | n/a | n/a | no |
| flexMIRT | n/a | n/a | n/a | n/a | n/a | n/a | n/a | n/a | n/a | no |
B.9 Interoperability
The columns of the table below should be read as follows:
External package: Software communicates with external package,
Workflow uses other s/w: Workflow uses other software, API: External
interactions (API) defined?
| Name | External package | Workflow uses other s/w | API |
|---|---|---|---|
| eRm | no | yes | yes |
| Psych | no | yes | yes |
| mixRasch | no | yes | yes |
| irr | no | yes | yes |
| nFactors | no | yes | yes |
| coda | no | yes | yes |
| VGAM | no | yes | yes |
| TAM | no | yes | yes |
| psychometric | no | yes | yes |
| ltm | no | yes | yes |
| anacor | no | yes | yes |
| FAiR | no | yes | yes |
| lavaan | no | yes | yes |
| lme4 | no | yes | yes |
| mokken | no | yes | yes |
| ETIRM | no | no | no |
| SCPPNT | no | no | no |
| jMetrik | no | no | no |
| ConstructMap | no | no | no |
| TAP | no | no | no |
| DIF-Pack | no | no | no |
| DIM-Pack | no | no | no |
| ResidPlots-2 | no | no | no |
| WinGen3 | no | no | no |
| IRTEQ | no | no | no |
| PARAM | no | no | no |
| IATA | no | no | no |
| MINISTEP | no | no | no |
| MINIFAC | no | no | no |
| flexMIRT | no | no | no |
B.10 Visibility/Transparency
The columns of the table below should be read as follows:
Dev process defined?: Development
process defined, Ease of ext exam:
Ease of examination relative to other software (out of 10).
| Name | Dev process defined? | Ease of ext exam |
|---|---|---|
| eRm | no | 9 |
| Psych | no | 8 |
| mixRasch | no | 9 |
| irr | no | 9 |
| nFactors | no | 9 |
| coda | no | 10 |
| VGAM | no | 10 |
| TAM | no | 10 |
| psychometric | no | 9 |
| ltm | no | 9 |
| anacor | no | 8 |
| FAiR | no | 7 |
| lavaan | no | 10 |
| lme4 | no | 9 |
| mokken | no | 9 |
| ETIRM | no | 6 |
| SCPPNT | no | 6 |
| jMetrik | no | 7 |
| ConstructMap | no | 7 |
| TAP | no | 6 |
| DIF-Pack | no | 6 |
| DIM-Pack | no | 6 |
| ResidPlots-2 | no | 5 |
| WinGen3 | no | 7 |
| IRTEQ | no | 7 |
| PARAM | no | 6 |
| IATA | no | 7 |
| MINISTEP | no | 8 |
| MINIFAC | no | 8 |
| flexMIRT | no | 8 |
B.11 Reproducibility
The columns of the table below should be read as follows:
Dev env record: Record of development environment, Test data for
verification: Availability of test data for verification, Auto tools: Automated
tools (like Madagascar) used to capture experimental data.
| Name | Dev env record | Test data for verification | Auto tools |
|---|---|---|---|
| eRm | only for testing | no | no |
| Psych | only for testing | no | no |
| mixRasch | only for testing | no | no |
| irr | only for testing | no | no |
| nFactors | only for testing | no | no |
| coda | only for testing | no | no |
| VGAM Snap | only for testing | no | no |
| TAM | only for testing | no | no |
| psychometric | only for testing | no | no |
| ltm | only for testing | no | no |
| anacor | only for testing | no | no |
| FAiR | only for testing | no | no |
| lavaan | only for testing | no | no |
| lme4 | only for testing | no | no |
| mokken | only for testing | no | no |
| ETIRM | no | no | no |
| SCPPNT | no | no | no |
| jMetrik | no | no | no |
| ConstructMap | no | no | no |
| TAP | no | no | no |
| DIF-Pack | no | no | no |
| DIM-Pack | no | no | no |
| ResidPlots-2 | no | no | no |
| WinGen3 | no | no | no |
| IRTEQ | no | no | no |
| PARAM | no | no | no |
| IATA | no | no | no |
| MINISTEP | no | no | no |
| MINIFAC | no | no | no |
| flexMIRT | no | no | no |