Thermoelectricity in
Correlated narrow-gap semiconductors
Abstract
We review many-body effects, their microscopic origin, as well as their impact onto thermoelectricity in correlated narrow-gap semiconductors. Members of this class—such as FeSi and FeSb2—display an unusual temperature dependence in various observables: insulating with large thermopowers at low temperatures, they turn bad metals at temperatures much smaller than the size of their gaps. This insulator-to-metal crossover is accompanied by spectral weight-transfers over large energies in the optical conductivity and by a gradual transition from activated to Curie-Weiss-like behaviour in the magnetic susceptibility. We show a retrospective of the understanding of these phenomena, discuss the relation to heavy-fermion Kondo insulators—such as Ce3Bi4Pt3 for which we present new results—and propose a general classification of paramagnetic insulators. From the latter FeSi emerges as an orbital-selective Kondo insulator. Focussing on intermetallics such as silicides, antimonides, skutterudites, and Heusler compounds we showcase successes and challenges for the realistic simulation of transport properties in the presence of electronic correlations. Further, we advert to new avenues in which electronic correlations may contribute to the improvement of thermoelectric performance.
pacs:
71.27.+a, 71.10.-w, 79.10.-nAvant-propos
Thermoelectricity is the striking ability of some materials to generate an electrical voltage when subjected to a temperature gradient (and vice versa). Prospective applications are multifarious, ranging from radiation and temperature sensors, vacuum gauges, to Peltier coolers and power generators. However, the current efficiency of thermoelectric conversion is insufficient for commercially viable coolers and generators on a larger scale. Indeed, for these applications, thermoelectric devices are so far limited to niche products for which flexibility in design, reliability, and maintenance-free operation trump aspects of cost. Examples are low-performance fridges, waste-heat recovery modules and power supplies for space-probes.111The prime example are the radioisotope thermoelectric generators aboard Voyager 1 that have been operating since 5-Sep-1977 and will continue to power the spacecraft—now well into interstellar space—until at least 2025.
Nowadays, most commercially used thermoelectrics are doped intermetallic narrow-gap semiconductors, built from post-transition metals, pnictogens, and chalcogens, e.g., Pb(Se,Te) and Bi2Te3, while at high temperatures group-IV element alloys, Si1-xGex, are deployed. These materials combine good powerfactors (determined by the thermopower and the resistivity ) with reasonably low thermal conductivities to reach a favourable thermoelectric conversion efficiency (measured by the figure of merit ). Indeed doped semiconductors present the optimal compromise between good conduction ( small for high carrier density) and a high thermopower ( large for low carrier densities), see Fig. (33). Much recent thermoelectric research has been devoted to reducing contributions from phonons to the thermal conduction via micro-/nano-/super-structuring or by finding crystal structures with intrinsically low . Here, we will instead focus on the powerfactor , which is controlled by the electronic structure of a material (see however Sec. III.3.6).
One class of materials whose electronic structures give rise to a particularly extensive—and so far largely untapped—panoply of functionalities are correlated materials. In these materials electrons interact strongly with each other, causing a high sensitivity of even fundamental properties to perturbations, such as changes in temperature, pressure, doping, and applied external fields. These stimuli can induce unusual behaviours, e.g., metal-insulator transitions, various types of long-range order, and, in particular, large response functions. These phenomena are, both, a great challenge for fundamental research and a harbinger for technical developments in sensors, switches, transistors and, indeed, thermoelectric devices.
Electronic correlation effects occur in systems in which orbitals of small radial extent—thus particularly those with maximal angular quantum number: , —are partially filled and thus strongly affect low-energy properties. In consequence, correlations effects are ubiquitous among many families of compounds, such as transition metals, their oxides, silicides, pnictides, chalcogenides, as well as lanthanide and actinide based materials. Exploiting various aspects of correlation effects numerous new functionalities were realized or have been proposed. Among them are new transparent conductorsZhang et al. (2015), oxide electronicsNgai et al. (2014), such as the Mott transistorScherwitzl et al. (2010); Zhong et al. (2015), electrode materialsMoyer et al. (2013), eco-friendly pigmentsTomczak et al. (2013a), or intelligent window coatingsLi et al. (2012); Tomczak and Biermann (2009a).
Naturally the question arises, whether correlation effects could also be used to overcome limitations of present thermoelectrics, all of which are (see above) uncorrelated narrow-gap semiconductors. This question constitutes one of the interests in correlated narrow-gap semiconductors—the subject of this article. The review is organized as follows:
1. Introduction. In Section (I) we give an overview of characteristic signatures of electronic correlation effects in narrow-gap semiconductors and detail in which material classes they can be found. Examples include transition-metal-based intermetallics, Skutterudites, and Heusler compounds. Since basic observables in some of the identified compounds bear a cunning empirical resemblance to that of heavy-fermion Kondo insulators, we give in Section (I.2) a quite extensive comparison of both types of materials, focusing on a contrasting juxtaposition of the prototype compounds FeSi and Ce3Bi4Pt3.
2. Theories of correlated narrow-gap semiconductors.
A key part of this review is dedicated to the description and microscopic understanding of the electronic structure of correlated narrow-gap semiconductors. We begin Section (II) with a review of early phenomenological proposals that advocate the importance of electronic correlation effects. Again, we focus the discussion on protagonist materials, such as FeSi, FeSb2 and Ce3Bi4Pt3. section (II.2) presents the band-structure point of view for these materials. While highlighting the deficiencies of effective one-particle theories in describing the physics of our materials of interest, these first principle techniques provide key insights into the chemistry of bonding, and complexities related to crystal fields and other multi-orbital effects. section (II.2.3) includes new material on the Kondo insulator Ce3Bi4Pt3. Guided, or at least inspired, by realistic band-structure calculations, the physics of electronic correlations was investigated within many-body models, such as that due to Hubbard, Kanamori and Gutzwiller, as well as the periodic Anderson model. Works that are directly linked to our compounds of interest are reviewed in Section (II.3). Next, we discuss in Section (II.4) the current understanding of the physics of correlated narrow-gap semiconductors from the perspective or realistic many-body simulations. In Section (II.4.1), we first showcase results from state-of-the-art dynamical mean-field methodologies for the example of FeSi. Indeed, a vast array of observables can be simulated in quantitative congruence with experiment: photoemission spectra, optical conductivities, neutron spectra, and—as discussed in Section (III.2)—transport properties, including the thermopower. After such validation of the theoretical framework, we discuss in Section (II.4.2) the microscopic insights that have been extracted from the numerical calculations. In Section (II.4.3) we further include new realistic many-body simulations for the Kondo insulator Ce3Bi4Pt3. For paramagnetic insulators with partially filled or -shells we then (i) introduce a microscopic classification from the dynamical mean-field perspective (Section (II.5.1)), and (ii) propose a simple measure for the occurrence of Kondo-characteristics in said systems (Section (II.5.3)). Equipped with these tool, we then compare the ab initio results for FeSi and Ce3Bi4Pt3 (Section (II.5.4)) and propose an orbital-selective Kondo-scenario for FeSi. Finally, Section (II.7) discusses the potential influence of the lattice degrees of freedom onto the electronic structure.
3. Thermoelectricity.
After a brief introduction to thermoelectricity in Section (III.1), we review in Section (III.1.2) the potential influence of electronic correlations onto thermoelectric performance. In Section (III.1.3) we investigate the impact of basic many-body renormalizations in a semiconductors and motivate that the thermopower has an upper bound if excitations are coherent. Effects of incoherence (finite lifetimes) are studied in Section (III.1.4) and demonstrated to be beyond semi-classical Boltzmann approaches. Then, we review experimental findings and theoretical simulations for transport and thermoelectric properties for representative materials among silicides (Section (III.2)), antimonides (Section (III.3)), skutterudites (Section (III.4)), and Heusler compounds (Section (III.5)). In particular, we discuss the impact of finite lifetimes and effective mass renormalizations for FeSi, the proposal that the colossal thermopower of FeSb2 is driven by the so-called phonon-drag effect, as well as the pitfalls of electronic structure theory and the influence of defects and disorder in CoSb3 and Fe2VAl.
4. Conclusions and outlook. Finally, we summarize the covered material, point out open challenges, and identify possible directions of future research.
| structure/ | see | |||||
| material | [meV] | [meV] | [meV] | [mV/K] | [W/K2cm] | section |
| B20 structure | ||||||
| FeSi | 60-73 Schlesinger et al. (1993) | 50-70Bocelli et al. (1996); Paschen et al. (1997) | 50Jaccarino et al. (1967); Takagi et al. (1981) | 0.5@50KWolfe et al. (1965) | 42.1@62KWolfe et al. (1965) | I.1 II.2.1 I.2 |
| Damascelli et al. (1997a); Menzel et al. (2009) | 1.2@32KSales et al. (2011) | II.4.1 III.2 | ||||
| RuSi | 200-400 | 310Buschinger et al. (1997a) | not act.Buschinger et al. (1997b) | I.1 II.2.1 | ||
| Buschinger et al. (1997a); Vescoli et al. (1998) | 260Hohl et al. (1998) | 0.27@286KHohl et al. (1998) | 8.7@347KHohl et al. (1998) | III.2 | ||
| marcasites | ||||||
| FeSb2 | 130Herzog et al. (2010a) | 30Bentien et al. (2007) | 32Jaccarino et al. (1967) | -45Bentien et al. (2007) | 2300@12KBentien et al. (2007); Sun et al. (2009a) | I.1 II.2.2 |
| 37-48Hu et al. (2006) | -18Sun et al. (2013) -25Takahashi et al. (2016) | 8000@28KJie et al. (2012) | III.3 | |||
| RuSb2 | 790Herzog et al. (2010a) | 290Sun et al. (2009a) 330Harada et al. (2004) | not act.Sun et al. (2009a) | -3.1@15KSun et al. (2009a) | 40@32KSun et al. (2009a) | I.1 II.2.2 |
| FeAs2 | 200-220Fan et al. (1972); Sun et al. (2009a) | 200Sun et al. (2009a) | -7@12KSun et al. (2009a) | 153@30KSun et al. (2009a) | I.1 II.2.2 | |
| FeP2 | 370-400Hulliger (1959); Boda et al. (1971) | not act.Boda et al. (1971) | ||||
| CrSb2∗ | 50Sales et al. (2012), 70Harada et al. (2004) | 50Sales et al. (2012) | -4.5@18KSales et al. (2012) | 46@24KSales et al. (2012) | III.3 | |
| CoGa3-type structure | ||||||
| FeGa3 | 600Knyazev and Kuz’min (2017) | 260Amagai et al. (2004) | 300-400Gamża et al. (2014) | -0.35@350KHadano et al. (2009) | 0.003@100KHadano et al. (2009) | I.1 III.3 |
| 400-500Hadano et al. (2009); Arita et al. (2011) | 290-450Tsujii et al. (2008a) | -0.45@300K Haldolaarachchige et al. (2011) | 0.2@400KHaldolaarachchige et al. (2011) | |||
| Tsujii et al. (2008a); Gamża et al. (2014); Wagner-Reetz et al. (2014) | -15@12KWagner-Reetz et al. (2014) | |||||
| RuGa3 | 650Knyazev and Kuz’min (2017) | 320Amagai et al. (2004) | 0.3@566KAmagai et al. (2004) | 3.8@920KAmagai et al. (2004) | I.1 | |
| skutterudites | ||||||
| CoSb3 | 230Tang et al. (2015) | 230-700Sharp et al. (1995); Tang et al. (2015) | not act.Yang et al. (2000) | 0.2@300KMandrus et al. (1995a) | 9.5@625KZhang et al. (2011a) | I.1III.4 |
| Kawaharada et al. (2001); Mandrus et al. (1995a) | -0.4@450KKuznetsov et al. (2003) | |||||
| Heuslers | ||||||
| Fe2VAl | 100-200 | 90-130Kato et al. (2000); Nakama et al. (2005) | 270Lue and Ross (1998) | KNakama et al. (2005) | 3.3@300KKnapp et al. (2017) | I.1 III.5 |
| Okamura et al. (2000); Shreder et al. (2015) | doped:68@300KMiyazaki et al. (2014) | |||||
| Oxides | ||||||
| LaCoO3 | 100Yamaguchi et al. (1996); Tokura et al. (1998) | 100Yamaguchi et al. (1996); Tokura et al. (1998) | 30Yamaguchi et al. (1996) | 1.2Señarı́s-Rodrı́guez and Goodenough (1995), 33@80KBenedict et al. (2016) | 0.136@80KBenedict et al. (2016) | II.2.1 II.4.2 II.5 |
| Kondo insulators | ||||||
| Ce3Bi4Pt3 | 37Bucher et al. (1994) | 8-12Hundley et al. (1990); Dzsaber et al. (2017) | 12Severing et al. (1991) | 0.055@23KKatoh and Takabatake (1998) | 1.67@30KKatoh and Takabatake (1998) | I.2 II.2.3 |
| II.4.3 | ||||||
I Introduction
Correlated narrow-gap semiconductors are systems with small band-gaps in which many-body effects play an important role. In the following Section (I.1) we will give an overview over what typical signatures of such correlation effects are and in which kind of materials one can expect to find them. In Section (I.2) we will give a more detailed account of the intriguing physical observations, but focus the discussion on a one-to-one comparison of a prototypical correlated narrow-gap semiconductor, FeSi, and the archetypical Kondo insulator Ce3Bi4Pt3, with which it shares many empirical similarities.
I.1 Correlated narrow-gap semiconductors: a brief overview
A paradigmatic class of materials with strong electronic correlations are transition metal oxidesImada et al. (1998). They boast extremely rich phase diagrams, indicative of competing energy scales. Indeed, the electronic structure of these oxides is dominated by the interplay of a relatively strong ionic character of bonding (causing large crystal-field splittings), and strong electron-electron interactions (Mott & Hund physics). As a result—while they can be induced by small changes in external conditions—insulating phases in transition metal oxides have comparatively large gaps (eV). Therefore, this review does not mention oxides, with the notable exception of LaCoO3. In transition metal intermetallics, on the other hand, the bonding has a much stronger covalent character (see Section (II.2.1) and Section (II.5) for a discussion of ionic vs. covalent compounds). Also, in most insulating intermetallics the gap is determined by bonding and/or anti-bondig states formed by the -orbitals of a transition metal and the -orbitals of a group 13-15 element. Such hybridization gaps in covalent insulators are typically rather narrow (eV, see table (1) for examples). Insulating intermetallic compounds that contain transition metal atoms with partially filled -shells constitute the pool of materials that we focus on in this review. We will group materials into classes according to their crystal-structure and discuss the electronic structure and thermoelectric effects of representative members in Section (II) and Section (III), respectively. To be specific, the chosen prototypical classes and representative compounds are:
- •
- •
-
•
CoGa3-structure: FeGa3, RuGa3 [see Section (III.3.8)]
-
•
skutterudites: CoSb3 [see Section (III.4)]
-
•
Heusler compounds: Fe2VAl [see Section (III.5)]
The following gives a brief overview of basic experimental findings for the above classes of correlated narrow-gap semiconductors. Besides, for the above materials, we collected in table (1) a list of experimental data, such as the direct (optical), indirect, and spin gaps, as well as peak amplitudes of thermopowers and powerfactors. In that list, we have further included a single oxide: LaCoO3. While exhibiting similarities in some physical observables (see Fig. (1), Fig. (2)), the microscopic physics underlying them are pronouncedly different than in all other compounds listed here. These differences will be discussed in Section (II.2.1), Section (II.4.2) as well as Section (II.5).
I.1.1 Signatures of correlation effects.
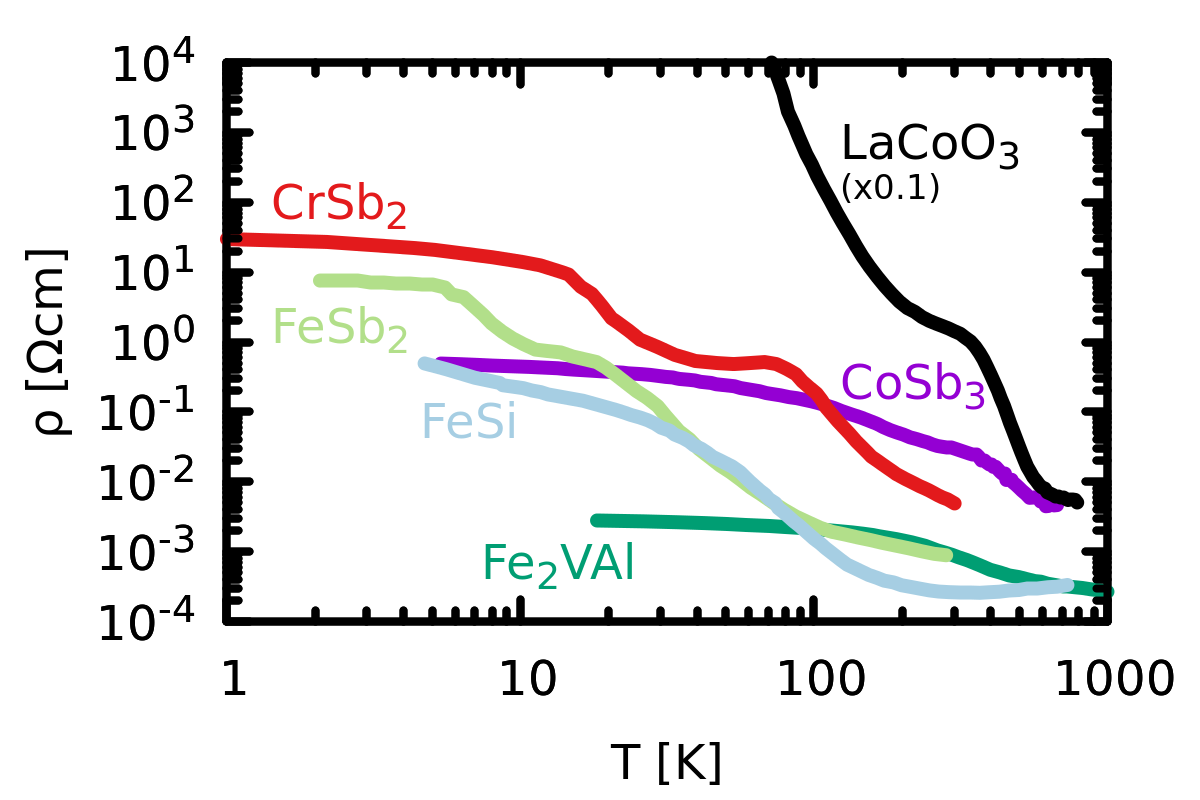
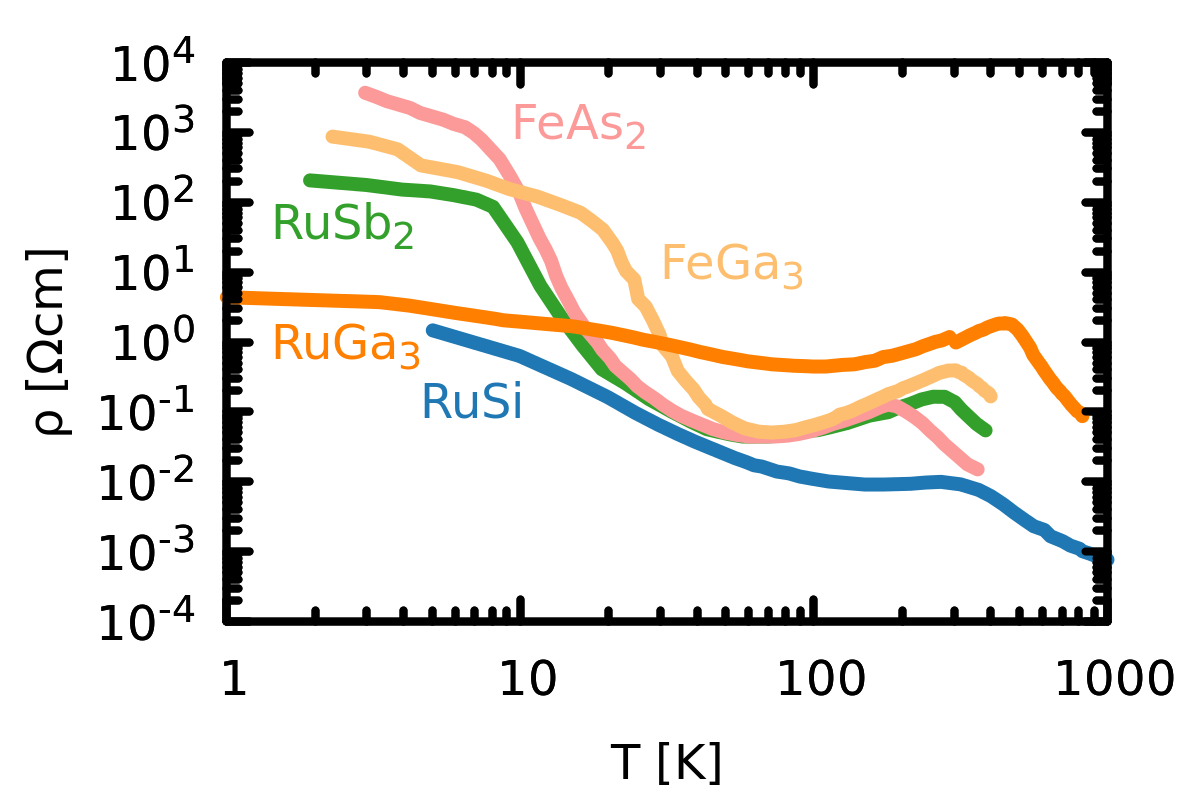
Correlated narrow-gap semiconductors display a number of intriguing properties. In particular the temperature-dependence of transport, spectroscopic and magnetic quantities is highly unusual.
Charge degrees of freedom.
Basically all materials considered here exhibit one or more temperature regimes in which the resistivity follows activated behaviour, as expected for conventional semiconductors, see Fig. (1). In systems with comparatively large gaps (meV), e.g., FeAs2, RuSb2, or FeGa3, there can be several regions that are amendable to an activation-law fit with gaps of different sizes. The largest of the latter will give a description of the activation regime that is highest in temperature and is identified as the fundamental gap, oftentimes in congruence with the direct gap extracted from optical experiments. The smaller gaps are then interpreted as arising from impurity or defect states inside the intrinsic gap. The different activated regimes may be connected by regions in which the slope of the resistivity is positive, albeit in absence of any metallic characteristics in optical or photoemission spectra.
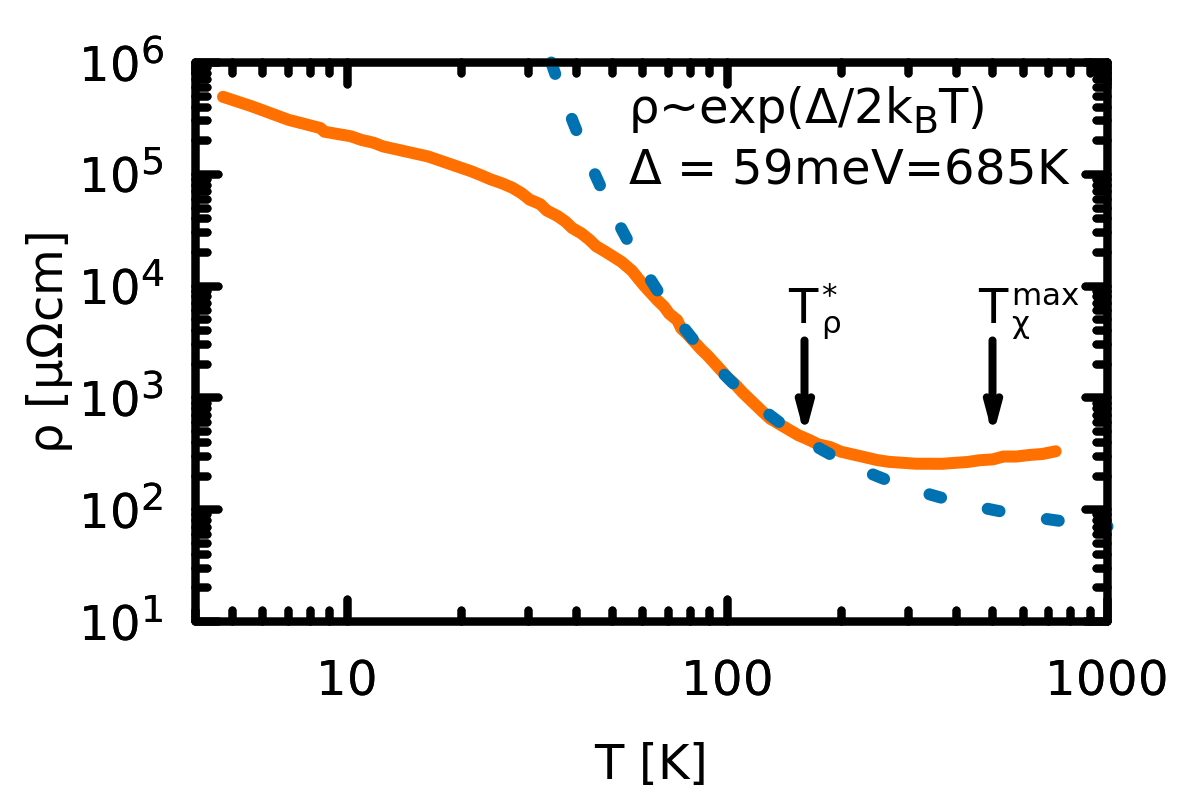
The situation is different for the materials on our list that have the narrowest gaps (meV), e.g., FeSi or FeSb2. These systems behave as renormalized but coherent semiconductors at low temperatures. However, activated behaviour persists only up to a temperature that is still significantly smaller than the respective gap : . Here, we arbitrarily define as the temperature where the relative deviation from activated behaviour, , exceeds , see Fig. (4)(a) for the case of FeSi. There, the resistivity clearly surpasses the exponential decay above K and even develops a positive slope, while meVmeV. Concomitantly, opticalSchlesinger et al. (1993); Damascelli et al. (1997b); Chernikov et al. (1997); Menzel et al. (2009); Perucchi et al. (2006); Herzog et al. (2010a), RamanNyhus et al. (1995), photoemissionPark et al. (1995); Saitoh et al. (1995); Klein et al. (2009); Ishizaka et al. (2005); Arita et al. (2008a) and tunnellingFäth et al. (1998) spectroscopy witness in FeSi and FeSb2 a clear crossover to a metallic phase, see Fig. (5)(a) & (b). These results are in clear defiance of a mere thermal activation across a fundamental gap. Moreover, with changing temperature, transfers of spectral-weight in the optical conductivity occur over energy-scales much larger than the size of the gapSchlesinger et al. (1993); Menzel et al. (2009); Perucchi et al. (2006); Herzog et al. (2010a), suggestive of many-body effectsRozenberg et al. (1996) that are controlled by large interactions rather than the size of the gap, . This will be discussed in more detail in Section (I.2).
Besides the intriguing temperature dependence, also the energies of one-particle excitations, such as the gap, are beyond expectations from band-theory: In the case of FeSi, the low temperature gap as well as band-dispersions are largely overestimated by density functional theory (DFTKohn (1999); Jones and Gunnarsson (1989)) (cf. Section (II.2)), indicative of notably enhanced masses caused by dynamical correlations.
The mentioned effects are most pronounced for the materials that have the smallest gaps. Within a given class, these are the systems build from a transition metal and a group 13-15 element with large atomic radius. Indeed, correlation effects, and thus band-width and gap renormalizations, are expected to be less pronounced for transition metals with more extended -orbitals. For comparisons of -transition metal systems to their homologues, see Section (II.2.1) and Section (II.2.2) for the cases of silicides and antimonides, respectively.
Also at very low temperature deviations to activated behaviour occur in the resistivities, see Fig. (1). Indeed, they show pronounced tendencies towards saturation for basically all materials considered here. Commonly, this behaviour is ascribed to the presence of impurity or defect states inside the gap that pin the chemical potential and supply residual conduction.222See Section (III.3.6) for a modelling of such impurity contributions to the conductivity in FeSb2. This scenario is supported by the presence of different activation regimes in some compounds (see above), as well as a strong sample dependence of low-temperature transport observables. However, finite lifetimes of intrinsic valence and conduction states—ubiquitous in correlated materials—provide an alternative mechanism for resistivity saturation, as will be discussed in Section (III.1.4).
The importance of electronic correlation effects in narrow-gap intermetallic semiconductors with open -shells is further strengthened by the following: Doping the discussed stoichiometric compounds yields metallic phases in which mobile charge carriers exhibit largely enhanced effective masses. Some examples are:
- •
-
•
Fe1-xCoxSi has masses up to Chernikov et al. (1997), as extracted from the specific heat.
-
•
FeSb2-xTex yields as extracted from the thermopowerSun et al. (2011).
-
•
FeSb2-xSnx exhibits for masses as extracted from the specific heatBentien et al. (2006).
- •
-
•
Fe2VAl: the residual in-gap density in typical (possibly off-stoichiometric) samples causes a metallic specific heat from which effective masses enhanced by a factor of 5 have been extractedLue et al. (1999).
Magnetic properties.
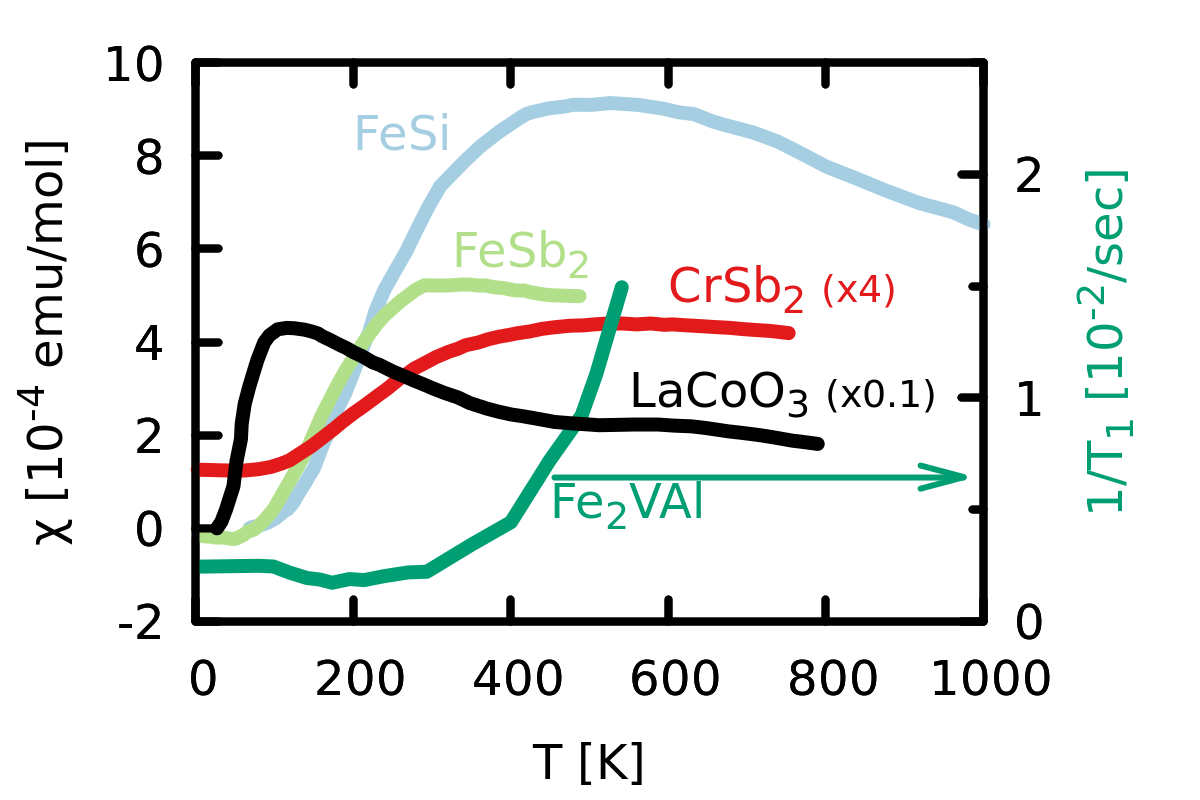
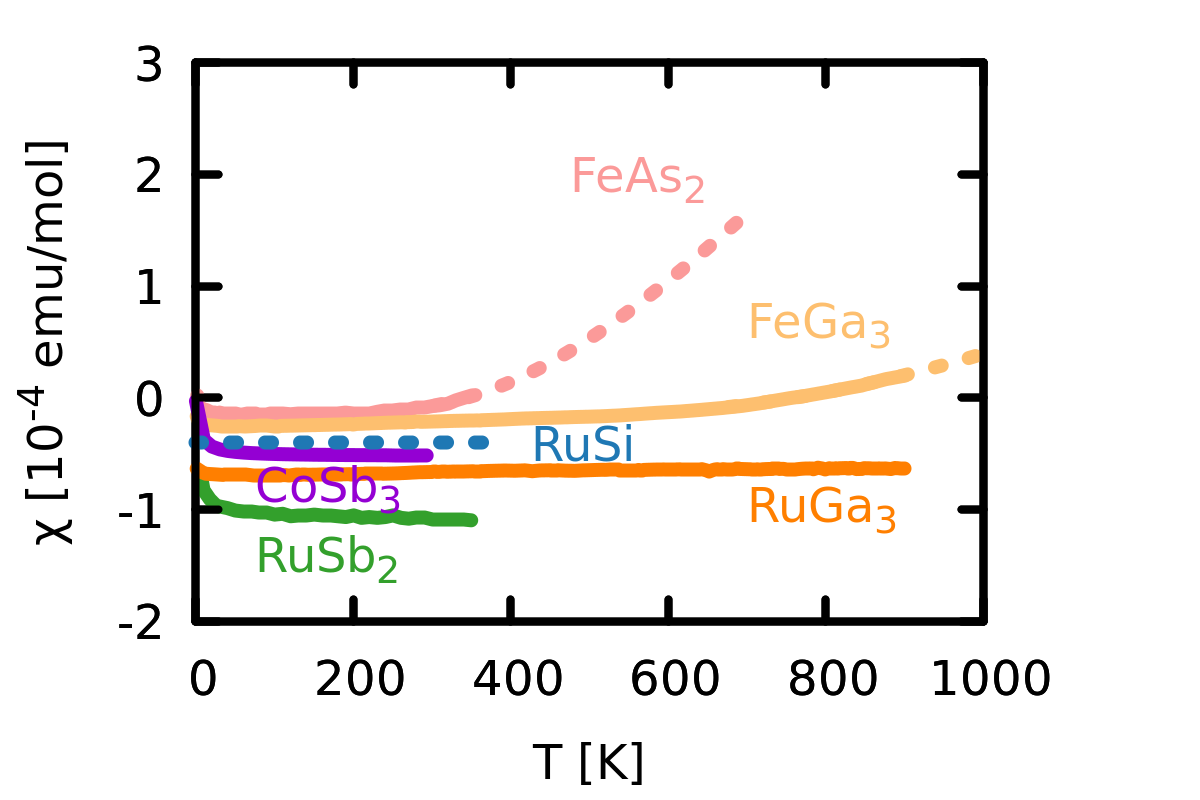
The intriguing insulator-to-metal crossover in the small-gap materials is accompanied by large changes in the magnetic response, see Fig. (2): Starting from low temperatures, the uniform spin susceptibility of some systems rises to quite large absolute values. Following activated behaviour, the increase in the response is largest for the materials with the smallest fundamental gaps. Beyond that, one can surmise that electronic correlations—greater in than transition metal-based compounds—play a role in the prefactor of the exponential rise: Indeed while FeAs2 and RuSi, as well as FeGa3 and RuGa3, have pairwise comparable gaps (see table (1)), only the compounds show an activated susceptibility (within the available experimental temperature window). In the theory Section (II), see in particular Section (II.6), we suggest that this distinction is mainly driven by the difference in the Hund’s rule coupling.
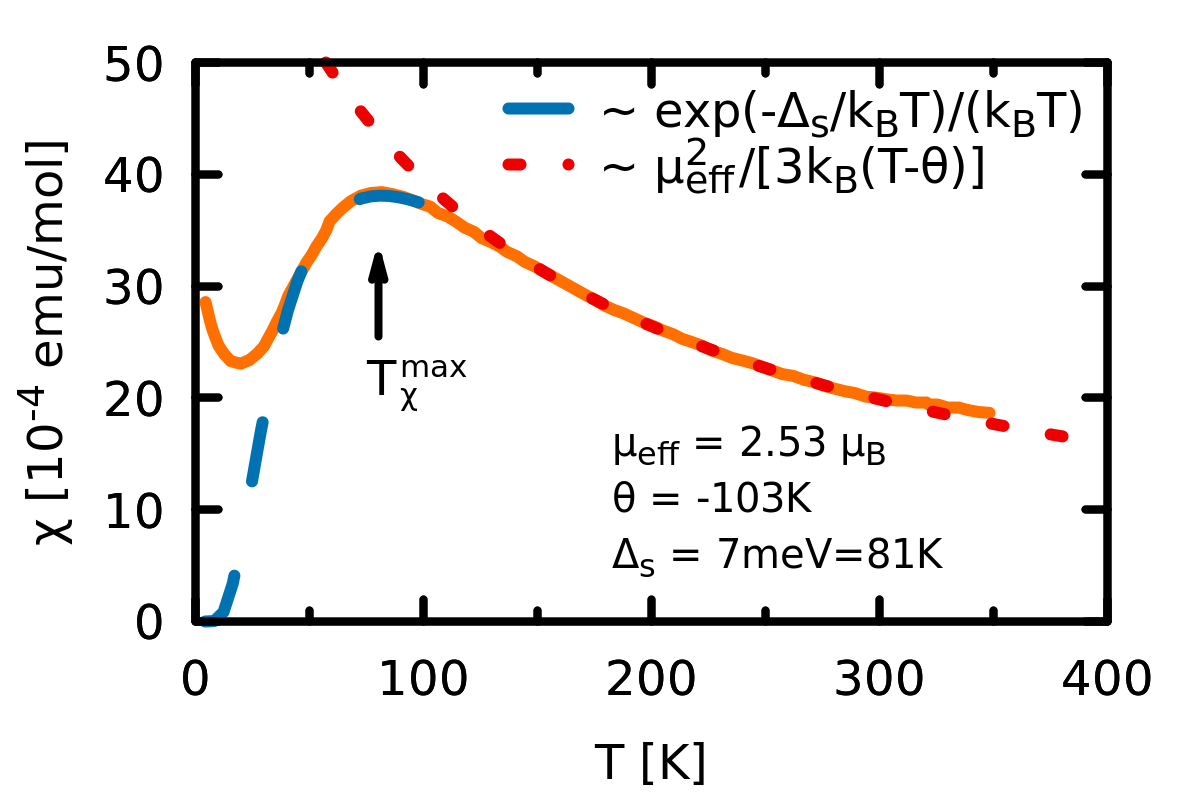
Still more intriguing is that the magnetic susceptibilities of FeSi, FeSb2, and CrSb2 reach a maximum—at a temperature that we shall call —beyond which they realize a Curie-Weiss-like decay.333The onset of a peculiar antiferromagnetic order in CrSb2 below 273KHolseth and Kjekshus (1980); Stone et al. (2012) has no visible signature in the susceptibility. Together with the insulator-to-metal crossover, this signature in the spin-response is the most salient and unexpected property of correlated semiconductors.
While all materials considered here444with the exception of CrSb2 below its Néel temperature K, and possibly FeGa3Gamża et al. (2014); Koo et al. (2018). are paramagnetic, many of them are situated in direct proximity to a spin-ordered phase. Magnetism can be induced by isoelectronic substitutions that expand the lattice, off-stoichiometry, as well as doping. Examples include:
I.1.2 Thermoelectricity.
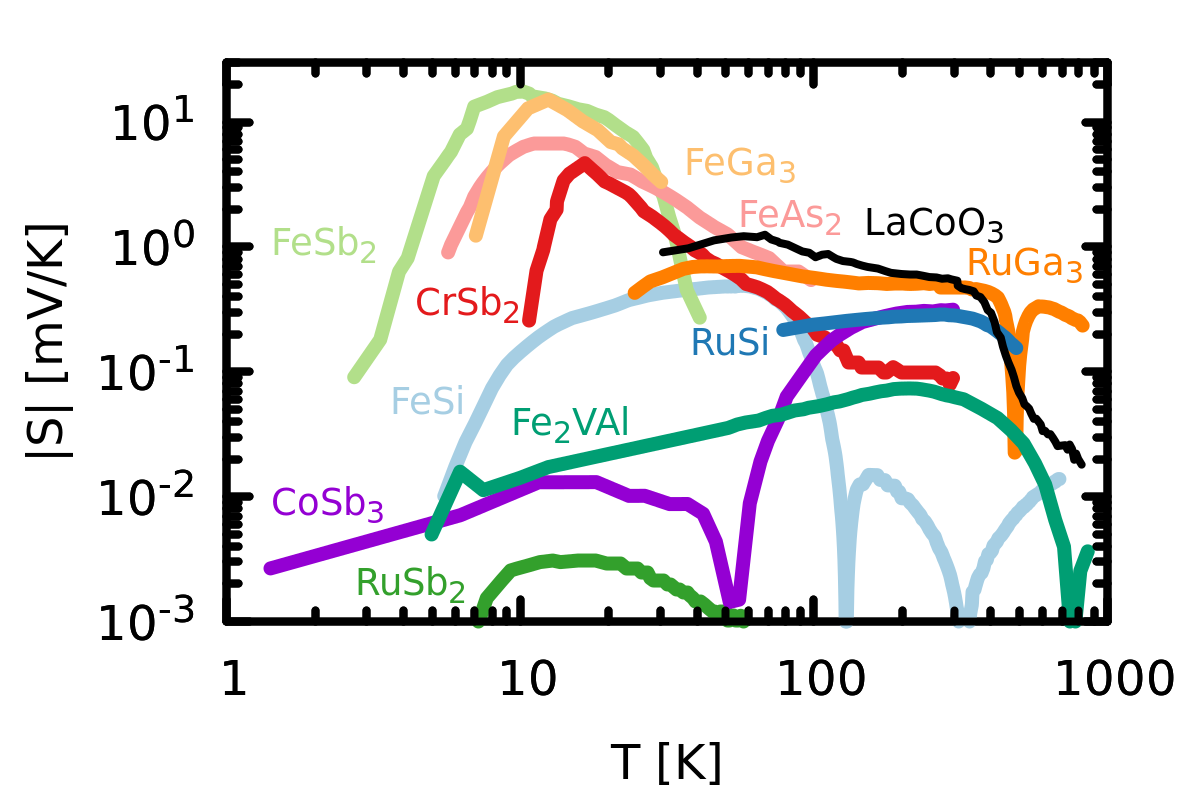
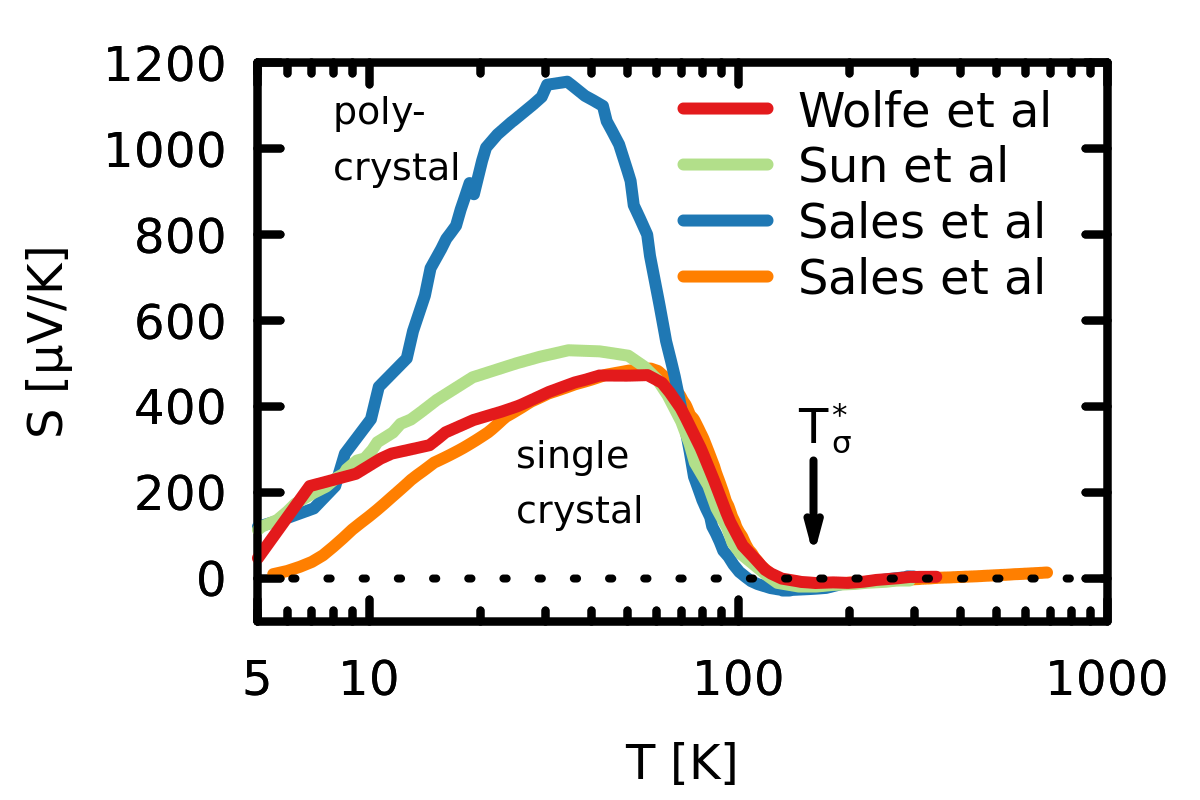
The observation that warrants the title of this review is that correlated narrow-gap semiconductors exhibit large thermopowers. For stoichiometric compositions, the largest response is usually achieved at rather low temperatures when these systems are in their insulating regime, see Fig. (3). Indeed, the typical temperature dependence of the thermopower is a -like shaped curve. The thermopower of a generic, coherent insulator behaves roughly as (cf. Section (III.1.3)). In our systems of interest, this decay with rising temperature is accelerated by the insulator-to-metal crossover (cf. Fig. (38) in Section (III.2) for the case of FeSi). On the low-temperature side, the thermopowers vanish towards absolute zero, as expected from the third law of thermodynamics (cf. Fig. (35) in Section (III.1.4) for the influence of finite lifetimes on this decay).
Some of the considered materials have competitive powerfactors in a temperature-range that is useful for Peltier-refrigeration, or even waste-heat recovery (cf. Section (III.4) and Section (III.5) for skutterudite and Heusler compounds, respectively). However, most of the correlated narrow-gap semiconductors discussed here (notably those which exhibit the most pronounced correlation effects), have large powerfactors only at very low temperatures (cf. Section (III.2) for FeSi and Section (III.3) for FeSb2). An application of these stoichiometric compounds in thermoelectric devices is thus only envisagable for sensor or cooling technologies at cryogenic temperaturesHeremans (2016). However, owing to large lattice thermal conductivities, no viable alternative for liquid-He-cooling is on the horizon. The impact of correlation effects onto thermoelectric properties, as well as individual materials will be discussed in Section (III).
I.1.3 Other applications.
Besides thermoelectricity, there are a number of proposals for the use and relevance of the unconventional physics of correlated narrow-gap semiconductors, both, in fundamental science as well as for technological applications. Examples include:
-
•
Spin transport electronics: the very large anomalous Hall effect in Fe1-xCoxSiManyala et al. (2004) is a harbinger for spintronic applications.
-
•
Astrophysics: from infrared absorption measurements, FeSi has been hinted to occur in circumstellar dust shellsFerrarotti, A. S. et al. (2000), as previously suggested by calculationsLodders and Fegley (1999). Ferrarotti et al. Ferrarotti, A. S. et al. (2000) proposed to exploit the strongly temperature-dependent properties of FeSi as a “thermometer” to probe environmental temperatures near distant stars.
-
•
Earth and planetary science: FeSi (B20 or B2 structure) is possibly a relevant composition in the core of the Earth and other terrestrial (rocky) planets Knittle and Williams (1995); Caracas and Wentzcovitch (2004); Lin et al. (2003). Its presence near the core-mantle boundary might explain the anomalously high electrical conductivity of this regionDubrovinsky et al. (2003).
- •
- •
I.1.4 Perspective.
From the above overview, we can extract some general tendencies for the signatures of correlation effects in our materials of interest. Both, the insulator-to-metal crossover and the Curie-Weiss-like susceptibility are more evident the smaller the semiconducting gap is. Typically, narrow gaps occur in the -transition metal compounds rather than their analogues. Indeed, dynamical correlations as well as spin-fluctuations are naturally expected to be of greater importance the more localized the orbitals that host them are: Larger effective masses in the materials cause more strongly renormalized gaps, as well as magnitudes of fluctuating moments that approach the values of the respective isolated ion. In all, the physics behind the correlation signatures in the charge and the spin sector, as well as their characteristic temperatures, and , are likely to be microscopically linked (see Section (II.4.2)). Pertinent energy scales are the charge and the spin gap, the strength of electron-electron interactions, in particular (see sections Section (II.4)) the Hund’s rule coupling. Depending on the interplay of these energies, manifestations of many-body effects will vary notably, as evidenced in the figures 1, 2, and 3.
Signatures of correlation effects in narrow-gap semiconductors
-
•
small upper bound for activation laws in the resistivity , and the magnetic susceptibility .
-
•
insulator-to-metal crossovers for .
-
•
enhanced paramagnetism at low , Curie-Weiss-like behaviour for
(if experimentally accessible). -
•
transfer of optical spectral weight over energies much larger than the gap .
-
•
proximity to (spin) ordered phases.
-
•
large effective masses under doping.
-
•
large thermopowers at low temperatures.
FeSi Ce3Bi4Pt3
I.2 Correlated narrow-gap semiconductors vs. Kondo insulators
Early on it has been noted G. Aeppli (1992); Fisk et al. (1995); Mandrus et al. (1995b); Petrovic et al. (2003, 2005); DiTusa et al. (1998); Lacerda et al. (1993); Schlesinger et al. (1997); Hunt et al. (1994); Spałek and Ślebarski (2011); Coleman (2007) that the anomalies observed in the most preeminent of -electron narrow-gap semiconductors are strikingly reminiscent of the physics of heavy-fermion semiconductors. The latter, also known as Kondo insulatorsG. Aeppli (1992), are systems with partially filled -shells that show insulating behaviour at low temperatures in the absence of any magnetic long-range order. In the standard (Doniach) picture Doniach (1977), the local moment of the -electrons fluctuates freely at high-temperatures, giving rise to a Curie-Weiss susceptibility. Concomitantly, light (, ) conduction states are decoupled from the localized () states and their density is finite at the Fermi level, causing metallic behaviour. Upon lowering the temperature the local moments get screened by the conduction electrons via the Kondo effect, and the resulting hybridization between - and conduction states leads to the liberation of mobile charges with large effective masses. In Kondo insulators, however, these heavy charges lead to a completely filled band, i.e., the chemical potential happens to fall into the hybridization gap, quenching spin and charge excitations at low temperatures.
In this section, we will detail empirical similarities and differences between such -electron heavy-fermion Kondo insulators and the -electron based correlated narrow-gap insulators that are the main subject of this review. We will focus the juxtaposition mainly on a direct comparison of two compounds prototypical for their class: FeSi and Ce3Bi4Pt3.555For a wider discussion of the family of Kondo insulating materials, including complications arising from the multiplet and crystal-field structure, as well as the interplay of electronic correlations and spin-orbit coupling, see the reviews in Refs. Fisk et al. (1995); Degiorgi (1999); Riseborough (2000); Dzero et al. (2016). Our survey of experimental and phenomenological observations will find a continuation in subsequent chapters: In Section (II.2), we discuss the electronic structures of FeSi and Ce3Bi4Pt3 within standard band theory. In Section (II.3), we present a survey of results for the minimal many-body setups that contain the salient features of correlated semiconductors and Kondo insulators—the two-covalent-band Hubbard model and the periodic Anderson model, respectively. This comparison in the context of reductionist models is extended in Section (II.6). Finally, we turn in Section (II.4) to realistic many-body electronic structure calculations: Results for FeSi are reviewed in Section (II.4.1) and Section (II.4.2), while Section (II.4.3) presents new findings for Ce3Bi4Pt3. The comparison on these two systems culminates in Section (II.5).
I.2.1 Charge degrees of freedom.
We begin our one-to-one comparison of FeSi and Ce3Bi4Pt3 with properties related to the charge degrees of freedom: the resistivity, the optical conductivity and photoemission spectra.
FeSi Ce3Bi4Pt3
Insulator-to-metal crossover.
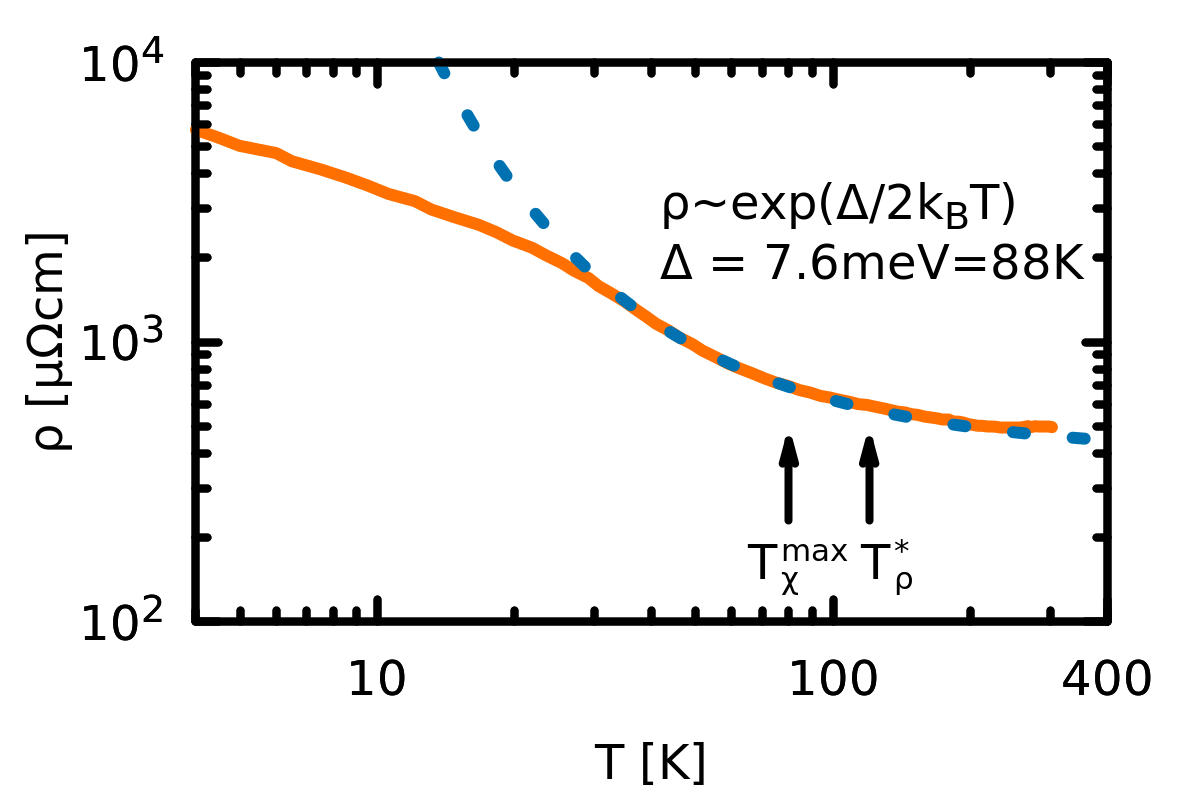
As shown in Fig. (4)(a) the resistivity of FeSi and Ce3Bi4Pt3 both follow activation laws at intermediate temperatures—60-120K for FeSi and 30-150K for Ce3Bi4Pt3—with charge gaps of about 59meV and 7.6meV, respectively. At lower temperatures, the resistivity of both compounds increases more slowly than expected from thermal activation. This tendency towards resistivity saturation is commonly interpreted as caused by impurities or other defects, but it can also be a sign for the presence of other residual bulk scattering mechanisms (cf. the discussion in Section (III.1.4)). More important in our context are the deviations at high temperatures, where the resistivity surpasses the activation law. In the case of FeSi, the slope in temperature, , even becomes positive, clearly indicative of metallic behaviour. This has led some authors to propose that the value of the charge gap in these systems is temperature-dependent. Indeed, it is common practice to collect deviations from activated behaviour into a non-constant . Doing this, e.g., Hundley et al. extracted for Ce3Bi4Pt3 a gap from the resistivity and the thermopower that halves in size when going from 50K up to 200KHundley et al. (1994b), in congruence with slave-boson calculations for the periodic Anderson modelSanchez-Castro et al. (1993). Without complementary observables, it is, however, difficult to ascertain whether this scenario is realized in Ce3Bi4Pt3 or FeSi.
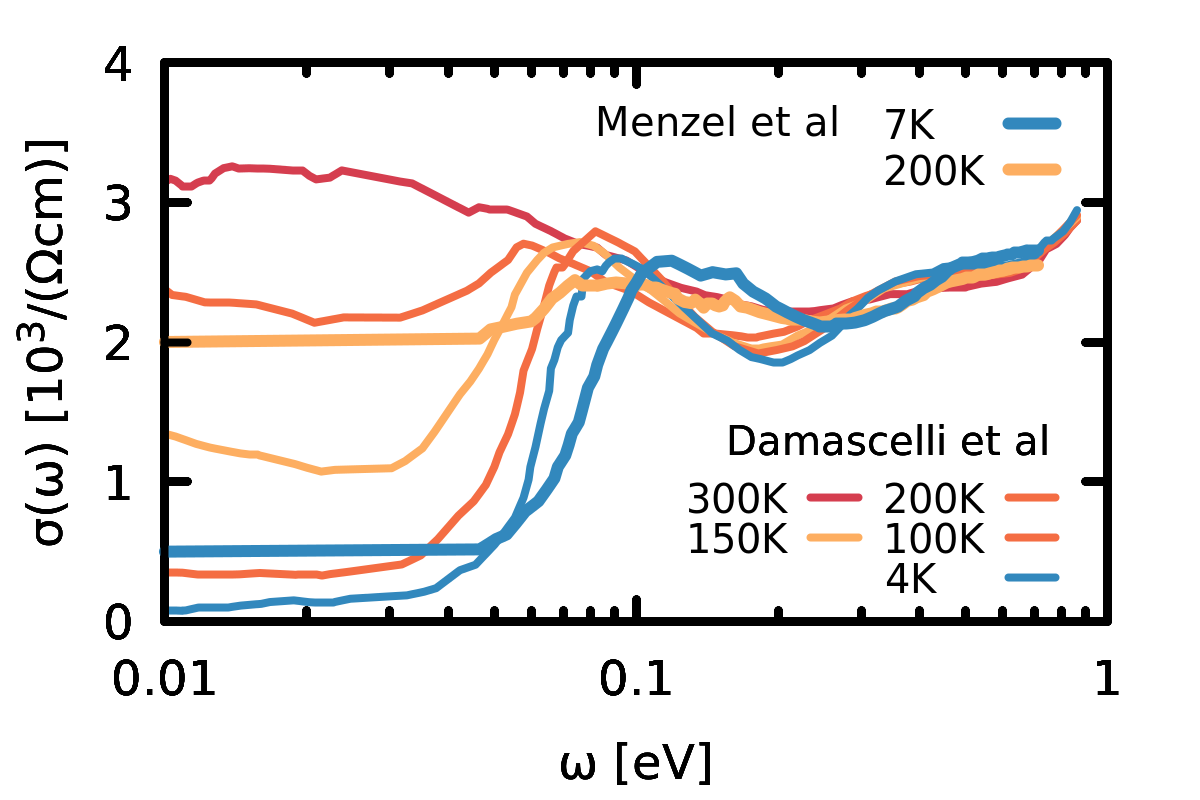
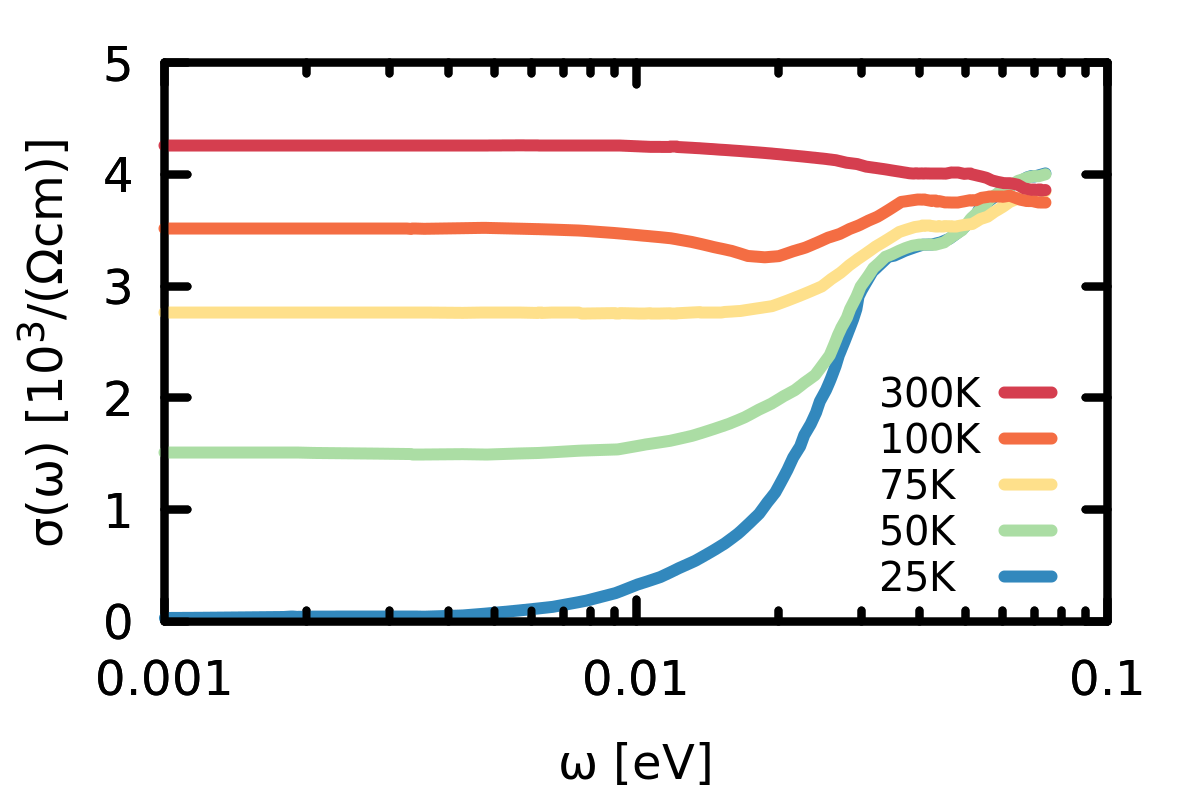
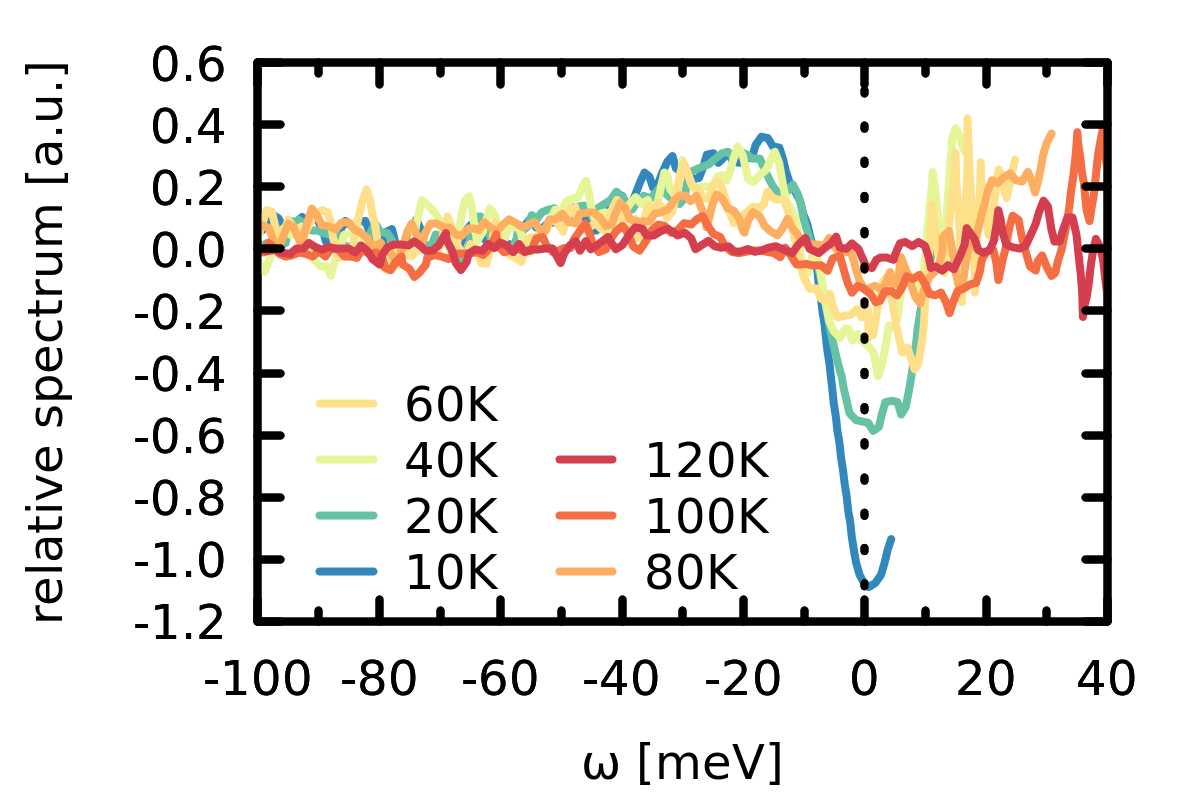
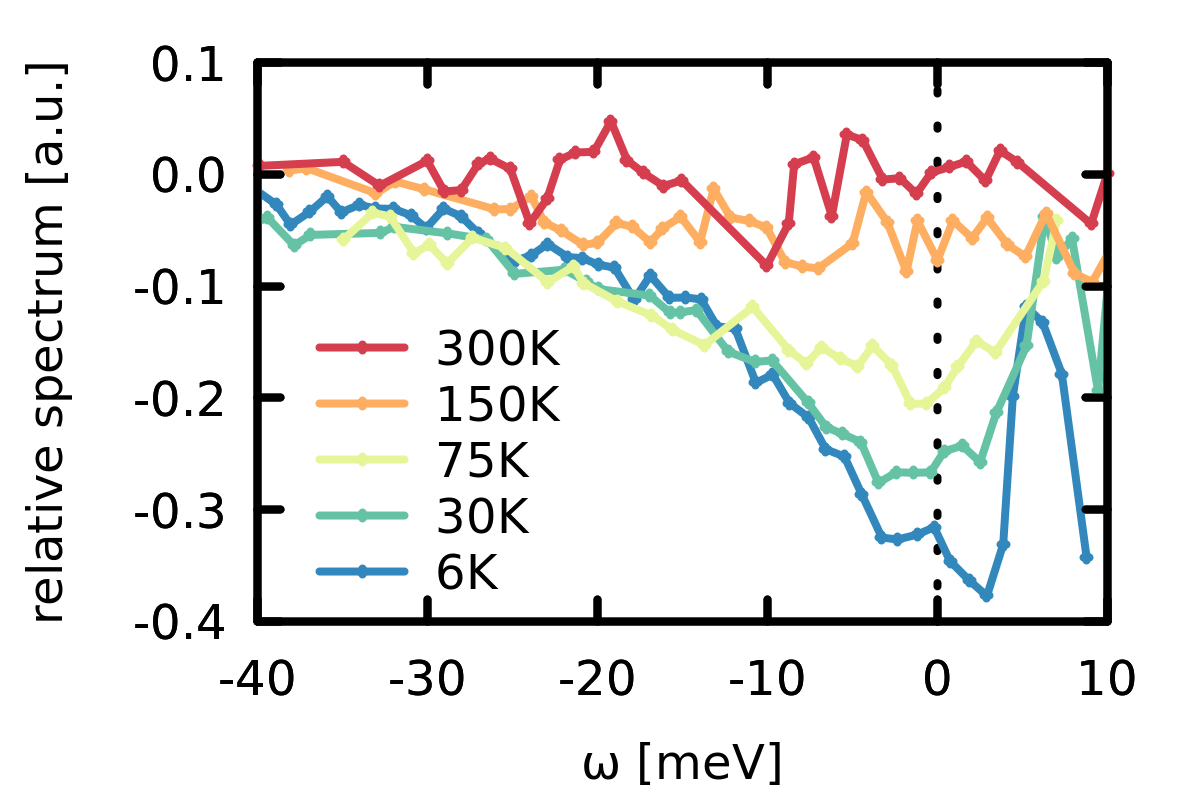
The metallization process is more pronounced in spectral and optical properties: Fig. (5)(a) displays the change in the FeSi photoemission intensity of Klein et al. Klein et al. (2009) relative to a high-temperature reference spectrum (see the figure caption for details, and Refs. Saitoh et al. (1995); Ishizaka et al. (2005); Park et al. (1995); Arita et al. (2008a) for other photoemission works). Panel (b) shows similarly processed data for Ce3Bi4Pt3 from Takeda et al. Takeda et al. (1999). At low temperature, both materials exhibit a pronounced depletion at the Fermi level. In the case of FeSi (left), this gap is flanked by notably sharp features in the valence band. These are particularly evident in angle-resolved spectraArita et al. (2008a); Park et al. (1995). For Ce3Bi4Pt3, changes are much less pronounced. Indeed, as seen in Fig. (24), also the valence part of the theoretical many-body spectrum of this -compound is rather broad at all temperatures.666Spectra obtained more recently for Kondo insulators with more -electrons feature much narrower valence-state peaks, see, e.g., the results for SmB6Yamaguchi et al. (2013); Min et al. (2014); Denlinger et al. (2014); Xu et al. (2016); Min et al. (2017).
The charge gap at low temperatures is equally visible in the optical conductivity of FeSi, shown in Fig. (5)(b,left). In the case of FeSi, the direct (optical) gap probed by dipolar transitions is comparable to the indirect gap extracted from the resistivity. In Ce3Bi4Pt3, Fig. (5)(b,right), the optical gap is notable bigger (meVK Bucher et al. (1994)) than the indirect gap (meV), as expected in a hybridization gap scenario in the spirit of the periodic Anderson model (cf. Section (II.6)).
With growing temperature the gap in the photoemission and the optical spectrum gets increasingly filled. Indeed, while the gap edges soften in FeSi, there is no discernible trend in the photoemission spectrum towards a gap closure by virtue of the valence peak moving towards the Fermi edge. In the optical conductivity, the absorption feature around 100meV does slightly move towards lower energiesMenzel et al. (2009); Damascelli et al. (1997b)777see also Fig. 2.5 in Ref. Damascelli (2002), and results for electronic Raman scattering in Ref. Nyhus et al. (1995)., but it is clearly not responsible for the rising conductivity in the dc limit. In the case of Ce3Bi4Pt3, the first shoulder in the optical spectrum even moves to slightly higher energies upon increasing temperature. In all, this suggests that in both materials, the gap does not close by the displacement of quasi-particle states, but instead it is filled by incoherent spectral weight as temperature rises. This picture is further supported by differential-conductance measurements from point-contact spectroscopy for Ce3Bi4Pt3Laube et al. (1999) and tunnelling spectroscopy for FeSiFäth et al. (1998), that also see practically temperature-independent peak positions.
At K FeSi reaches , the conductivity of a bad metal: FeSi metallizes at a temperature that is smaller than the low-temperature gap K by a factor of more than four. Ce3Bi4Pt3 surpasses the same value of the conductivity already around 60K, which is slightly smaller than the coherence temperature K that we defined above. These temperatures are comparable to the indirect gap K, but they are still much smaller than the direct gap K. Consequently, the crossover to a metallic state is, in both systems, qualitatively far beyond thermal excitations across a fundamental gap.
Spectral weight transfers.
One of the powers of optical spectroscopy is the existence of sum-rules that allow for a quantitative analysis of spectral weight transfers. Indeed, the integral over the optical conductivity,
| (1) |
yields, for , a value, , that is solely determined by the total density of carriers participating in optical absorption and the bare electron mass Millis (2004). Therewith, the integral of spectral weight is independent of external parameters, such as temperature, or pressure. In other words, the spectral weight that is lost in the low-energy optical conductivity, as FeSi and Ce3Bi4Pt3 become insulating upon cooling, must be shifted to higher energies. The frequency above which the integral becomes independent of the external parameter sets the energy scale over which the reshuffling of spectral weight occurs. This scale can give clues about the mechanisms that underlie the evolution of the system for changing conditions: In a conventional semiconductor, thermal activation leads to a finite electron(hole) population in the conduction(valence) band, that is however restricted to the direct vicinity of the band edges. Changes in inter-band transitions in the optical conductivity are thus limited to a few above the charge gap , implying . The same applies, e.g., for gap-opening phase transitions owing to density-waves (examples are CrBarker et al. (1968) or NdNiO3Katsufuji et al. (1995)).
In materials with strong electronic correlations, the energy scale required to reach a T-independent can be much larger. In Mott-Hubbard systems, for example, spectral weight transfers occur over a frequency range set by the Hubbard interactionRozenberg et al. (1995, 1996). The latter can be of the order of, or larger than, the bandwidth. In case it triggers a metal-insulator transition in a multi-orbital system, the fundamental gap can be much smaller than . Examples with are, e.g., the transition metal oxides VO2 and V2O3Okazaki et al. (2006); Qazilbash et al. (2008); Tomczak and Biermann (2009b).
In the case of FeSi, the energy needed to recover the transferred spectral weight with changing temperature was controversialSchlesinger et al. (1993); Damascelli et al. (1997b); Degiorgi et al. (1994); Chernikov et al. (1997), until accurate ellipsometry measurementsMenzel et al. (2009)888that do not require Kramers-Kronig transforms to be applied to reflectivity data obtained for a restricted frequency range. ruled in favour of a much larger than the charge gap. The situation is similar for the Kondo insulator Ce3Bi4Pt3: there, the reshuffling of spectral weight occurs over an energy range of meV Fisk et al. (1995) corresponding to more than six times the size of the optical gapBucher et al. (1994).
I.2.2 Spin degrees of freedom.
Magnetic susceptibility and magnetic neutron scattering.
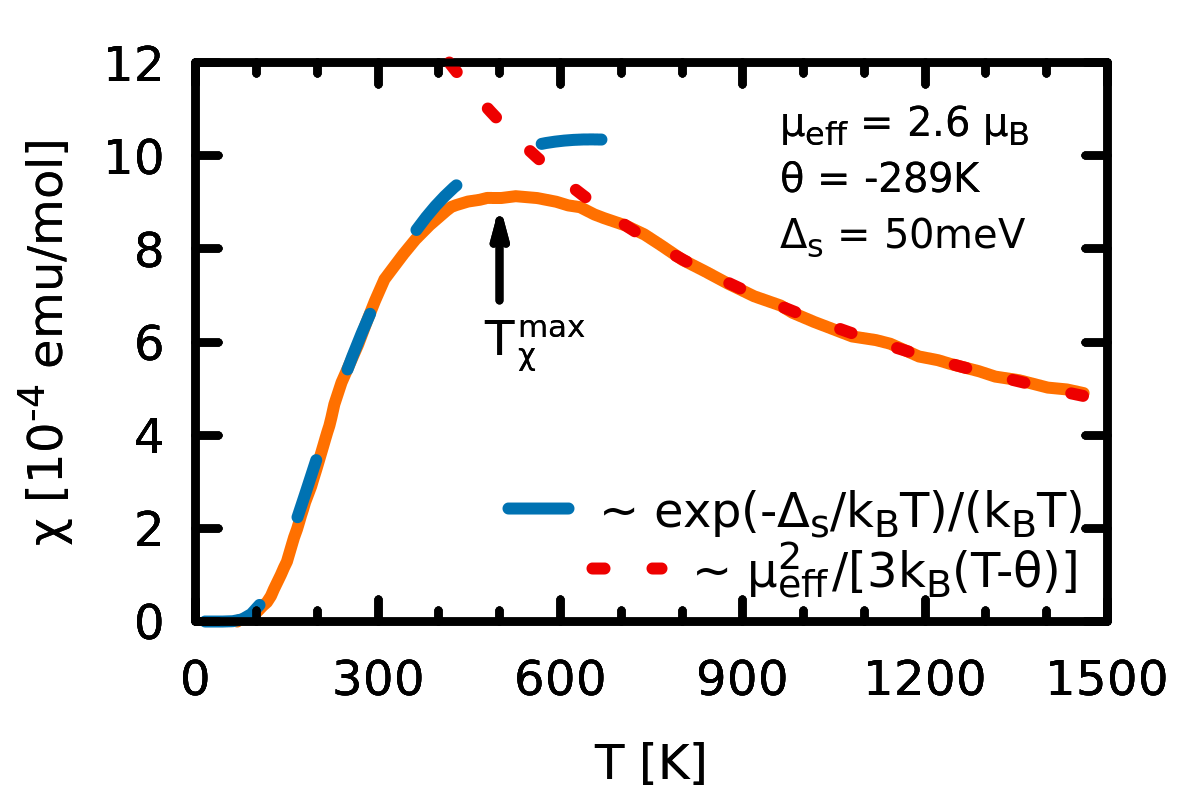
Fig. (4)(b) displays the uniform magnetic susceptibilities for FeSi Jaccarino et al. (1967); Takagi et al. (1981) (left) and Ce3Bi4Pt3 Hundley et al. (1990) (right). At low temperatures spin excitations in both compounds are gapped and the responses have an activation-type behaviour.999The low-T upturn in the susceptibility of Ce3Bi4Pt3 is not a property intrinsic to the bulk, as shown by neutron scattering measurementSevering et al. (1991). Also in the case of FeSb2 it has been clearly demonstrated that a residual susceptibility at low temperatures derives from defectsTakahashi et al. (2011). Without any further microscopic insight, it is however not obvious to deduce the origin of enhanced or temperature-induced paramagnetism from the experimental data. In Fig. (4)(b) we have deliberately fitted both low temperature susceptibilities with the same expression, , which corresponds to the behaviour of local moments. The applicability of this form and further details will be discussed in Section (II.1). Here, we only note that in this picture the extracted spin gap—meV for FeSi and meV for Ce3Bi4Pt3—is of similar magnitude than the indirect charge gap obtained from fitting the resistivity, yet much smaller than the direct, optical gap .101010Inelastic neutron spectra suggest a slightly larger spin gap of meVSevering et al. (1991) that is, however, also still much smaller than the optical gap. Using instead a simplified band picture to extract the spin-gap from the susceptibility yields, via a larger value meV for FeSi, advocating, in all, the hierarchy .
This finding suggest that a non-trivial electronic structure is realized in these systems. Indeed in a band insulator, activation of spin and charge excitation are governed by the same energy scale . In a Mott insulator, on the other hand, a finite charge gap is accompanied by gap-less spin fluctuations (). More insight will be discussed in the context of many-body models, see Section (II.3).
At larger temperatures, after going through a maximum at , see Fig. (4)(b), the activated behaviour in gives way to a crossover to Curie-Weiss-like decay
| (2) |
This crossover in the magnetic response is seen for Ce3Bi4Pt3 also in Knight shift Reyes et al. (1994). For FeSi we find , which is close to the behaviour expected for local moments with : (). In the case of Ce3Bi4Pt3, we extract . This value is very close to the fluctuating moment of isolated Ce3+ ions: (, ). The Curie-Weiss temperatures are negative in both cases, K (K) for FeSi (Ce3Bi4Pt3), suggestive of antiferromagnetic interactions. In the Kondo lattice picture, this is in line with the Ruderman-Kittel-Kasuya-Yosida (RKKY) coupling that competes with the Kondo screeningDoniach (1977). Ce3Bi4Pt3 (and other Kondo insulators) are believed to be in the strong -coupling regime, where the RKKY coupling fails to impose long range magnetic order because of a dominating Kondo effect.111111A mechanism as to why the RKKY interaction is most often of antiferromagnetic character has recently been proposed in Ref. Ahamad et al. (2017). In the case of FeSi, the negative Curie-Weiss temperature is contrasted with results from magnetic neutron spectroscopy results of Shirane et al. Shirane et al. (1987) and Tajima et al. Tajima et al. (1988) (see Fig. (20) and the discussion in Section (II.4.1)). These measurements revealed a strongly peaked magnetic cross section for at KShirane et al. (1987) and aboveTajima et al. (1988), indicative of ferromagnetic fluctuations.121212Indeed, a ferromagnetic state can also be reached by doping, Fe1-xCoxSiBeille et al. (1983a); Shimizu et al. (1990); Manyala et al. (2000); Onose et al. (2005), expansion of the lattice by chemical pressure, FeSi1-xGexBauer et al. (1998); Yeo et al. (2003), as well as ultra-high magnetic fieldsKudasov et al. (1998, 1999) (cf. the discussion below).
Magnetoresistance and high-field experiments.
In a Kondo insulator, the formation of Kondo singlets below the coherence temperature leads to the gapping of spin- and charge excitations. These singlets, formed by a strongly renormalized hybridization between conduction electrons and -levels, can be broken up by a large enough magnetic field . To do so, the Zeeman energy needs to be comparable to the spin gap, i.e., , where is the gyromagnetic ratio, and the electron’s total angular momentum. In the simplest picture, such a field will induce a phase transition from the Kondo phase to a light (conduction) metal with fully polarized -electrons.131313Note however, that numerical calculations for the Kondo lattice modelBeach et al. (2004) and the periodic Anderson modelOhashi et al. (2004) suggest that with an applied magnetic field the spin gap collapses and a transverse AF order develops, while the charge gap remains finite up to higher fields.
In Ce3Bi4Pt3 a partial polarization of the -states is signalled by a large negative magnetoresistance (MR), , measured below 50K in fields up to 10THundley et al. (1993). With a spin gap of about 12meVSevering et al. (1991), the critical field needed to metallize Ce3Bi4Pt3 (Ce3+: ) is however much larger. The estimate from the above formula is 40T. Reaching such fields, the insulator-to-metal transition has indeed been observed in measurements of the resistivityBoebinger et al. (1995)(T), as well as the specific heatJaime et al. (2000) (T). These findings support the Kondo picture for Ce3Bi4Pt3.
In -electron derived narrow-gap semiconductors, the much larger size of the spin gap prohibits a clear picture in magnetic fields of conventional size. In fields up to 9T experiments find a large positive MR for FeSb2Bentien et al. (2007); Petrovic et al. (2003); Sun et al. (2013). For FeSi, even the sign of the MR strongly depends on the experiment. The samples of highest quality—according to the residual-resistance ratio criterion—are those of Paschen et al. Paschen et al. (1997) that yield a negative magnetoresistance below 50K in a field of 7T.141414 The MR reported by Otha et al. Ohta et al. (1997) for FeSi is positive up to 16T for all temperatures, but samples with lower RRR show a less positive MR; Lisunov et al. Lisunov et al. (1996) found a positive signal up to 35T; more recently, Sun et al. Sun et al. (2014) reported for 8T a sign change from MR at low temperatures to MR above 70K that interestingly correlates with a maximum (minimum) in the Nernst (Hall) coefficient, while the absolute value of the magnetoresistance is much smaller than in older experiments. The notable sample dependence, as well as a positive contribution to the magnetoresistance could be linked to the presence of impurities. Alternatively, a positive MR could be due to the proximity to a ferromagnetic instability.151515While the size of the charge gap is insensitive to, e.g., dopings with up to 3% cobaltChernikov et al. (1997), dopings (T=Co, Rh) and also isoelectronic substitutions (T=Ru) of 10%, Fe0.9T0.1Si, induce itinerant ferromagnetismPaschen et al. (1999), concomitant with a large positive MRPaschen et al. (1999); Manyala et al. (2000); Samatham et al. (2012).
Using ultra-high magnetic fields of up to spectacular 450T as produced by an explosively pumped flux compression generator, Kudasov et al. Kudasov et al. (1998, 1999) found the resistivity of FeSi to continuously decrease by several orders of magnitude. While at K the semi-conductor to metal crossover was continuous also in the magnetic signal, a sample cooled to K displayed a jump to a magnetic moment of at a field of 355TKudasov et al. (1999), suggestive of a ferromagnetic metallic state. Moreover, the field-dependent resistivity was found to be strongly non-exponential, indicative of a Zeeman splitting beyond the rigid-band picture. Indeed, a conventional collapse of the experimental spin-gap of meV (see table (1)), is naively expected at 435T (using and ), i.e., for fields larger than found in experiment.
I.2.3 Interplay of charge and spin degrees of freedom
Correlation in the temperature dependence of charge and spin observables.
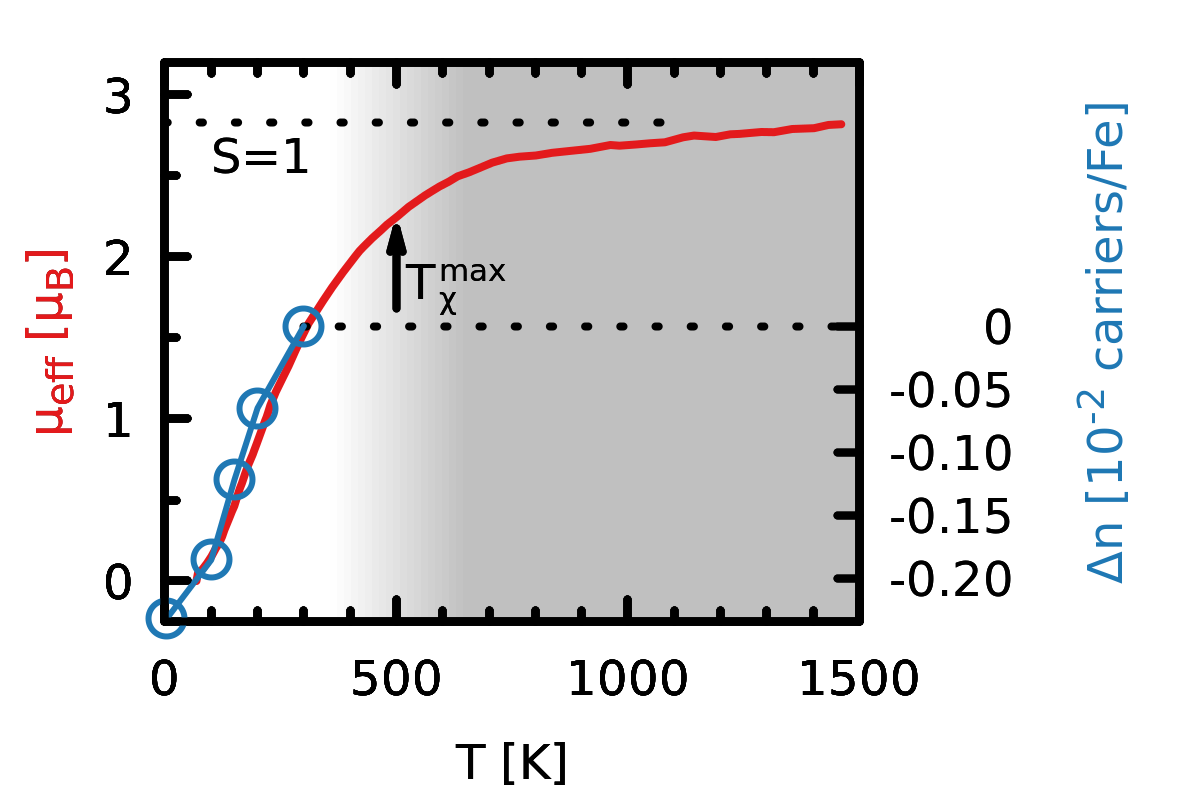
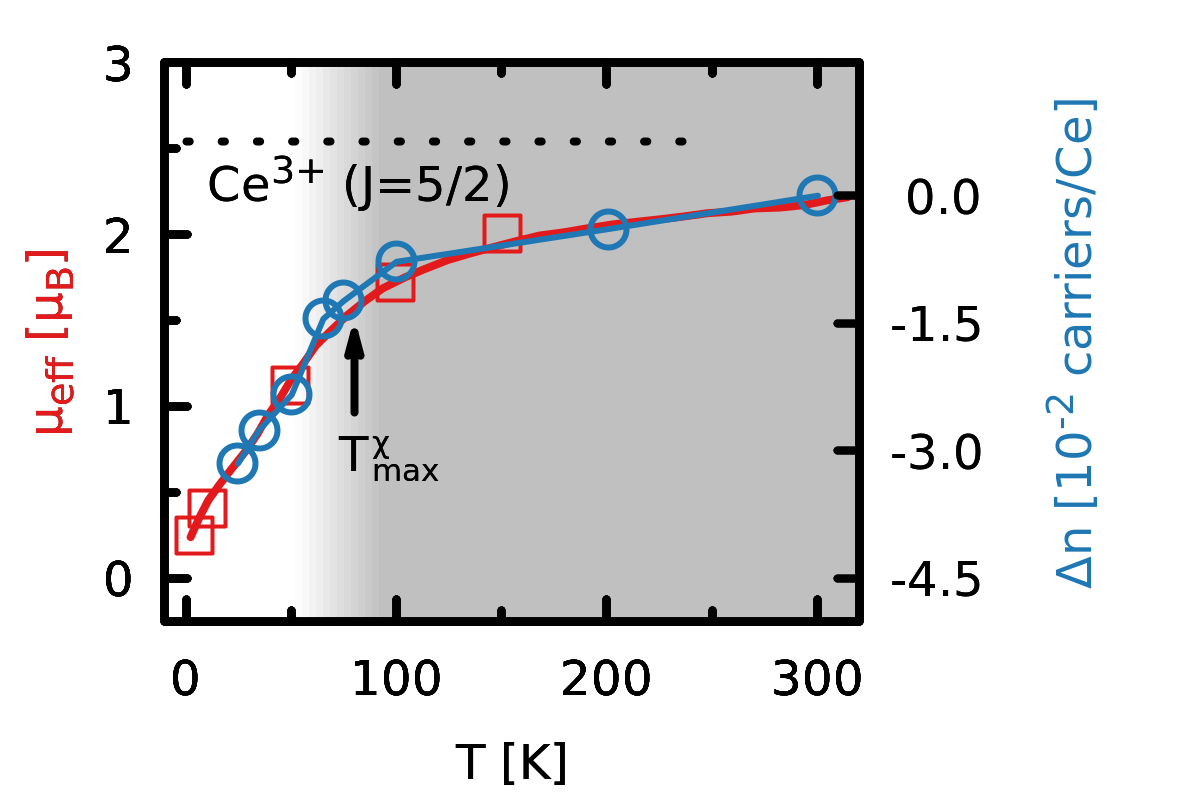
Despite different values for the charge and spin gap, electrical and magnetic properties are intimately linked in the Kondo picture: When Kondo coherence is destroyed as temperature rises, the -charge decouples from the conduction electrons and its moment begins to fluctuate freely. Concomitantly, conduction electron density transfers to lower energies and fills the hybridization gap. That both effects occur on the same temperature scale in Ce3Bi4Pt3 has been beautifully illustrated by Bucher et al. Bucher et al. (1994). In Fig. (6) we reproduce their analysis and extend it to FeSi.
Fitting the local moment expression, , to the experimental susceptibility, a temperature-dependent effective moment is extracted. At high temperature we recover, as mentioned before, for both compounds, values that are close to the respective single ion limit (cf. Section (I.2.2)). For Ce3Bi4Pt3: as expected for Ce3+ (, ); for FeSi supposing (). Upon lowering temperature, however, the magnitude of these effective moments decreases. In Ce3Bi4Pt3 this observation is associated with the Kondo effect: conduction electrons begin to screen the -moment. The concomitant gapping of the density of states is heralded by the loss of optical weight at low energy. The amount of charge participating in this transfer can be obtained from the spectral weight integral of Eq. (1). By tracking the integral for a cut-off frequency that roughly delimits the regime in which weight is lost, with respect to a base temperature , we can compute the amount of the charge transferred away from the Fermi level to energies above :
| (3) |
Using K and meV for Ce3Bi4Pt3Bucher et al. (1994), and meV for FeSi (cf. Fig. (5)), we see that the amount of charge that participates in conduction upon heating indeed correlates with the emergence of the effective local moment . Unfortunately, there are no results for the optical conductivity at high enough temperatures to reach the Curie-Weiss-like regime for FeSi. It would be interesting to see whether the ferromagnetic-like fluctuations evidenced in magnetic neutron scattering above 300KShirane et al. (1987); Tajima et al. (1988) induce, for FeSi, a deviation from the current analysis which is based on the local moment picture.
In fact, from our (admittedly somewhat arbitrary) definition of characteristic temperatures for the charge and spin response, and , we note a quantitative difference between FeSi and Ce3Bi4Pt3: In the latter, the temperature below which Kondo screening sets in, , is slightly smaller than the crossover temperature of the conductivity (cf. Fig. (4)(a-b), Fig. (5)(b)): . In FeSi, on the other hand, this ratio evaluates to five times as much: .
Nature of the low-temperature charge and spin gap and proximity to ordered states.
Information about the nature of the charge gap can be deduced from experimental measurements in which the electronic structure is perturbed.
Pressure.
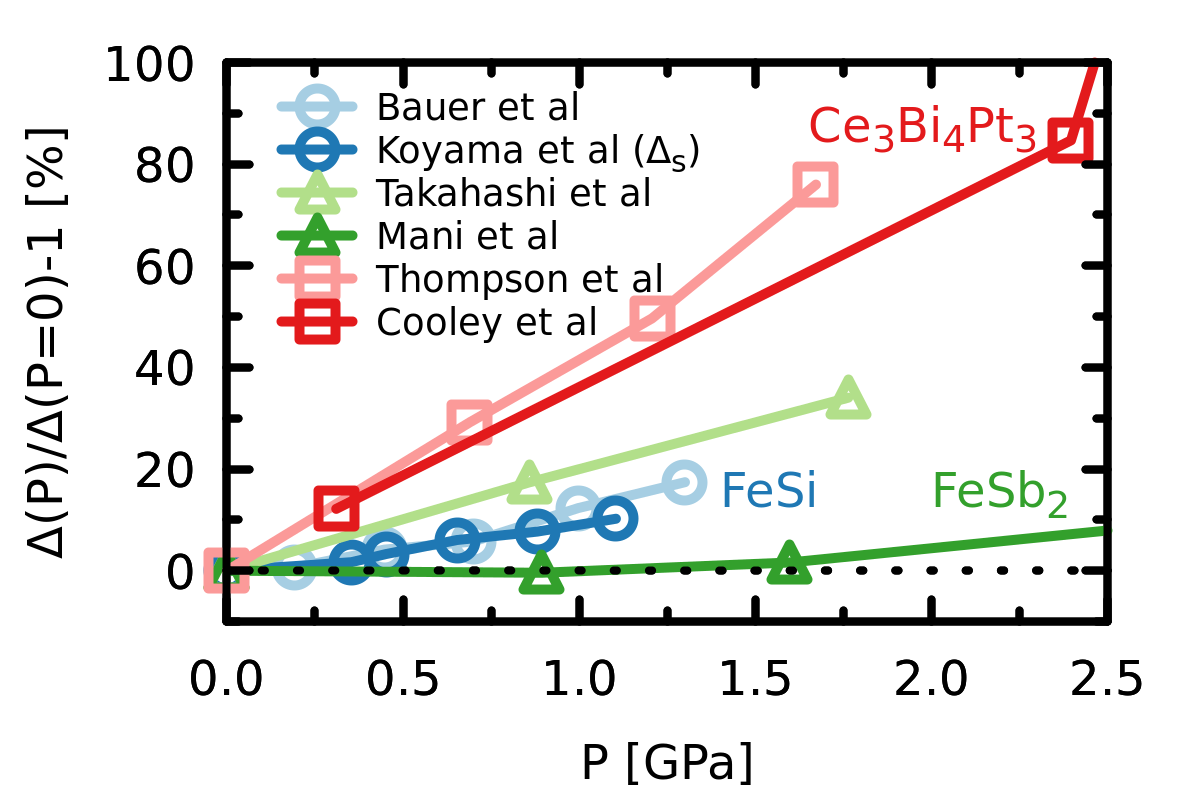
One such perturbation is external pressure. Commonly, compression increases orbital overlaps, causes a greater delocalization of charges and thus larger transfer integrals. In a typical band-insulator, this increase in bandwidths leads to a reduction of the gap. Also in most correlated systems, hydrostatic pressure is a control parameter to enhance or even induce metallicity. A famous example is the bandwidth-controlled Mott metal-insulator transition in V2O3Limelette et al. (2003); Imada et al. (1998).
If, however, the band-gap originates from hybridization, i.e., at least one side of the gap consists of bonding/anti-bonding states, the opposite tendency can be found. In fact, since also the transfer integrals at the origin of the bonding/anti-bonding splitting are enhanced by pressure, the gap typically increases. This behaviour is indeed found for, e.g., FeSiGrechnev et al. (1994); Mani et al. (2001); Bauer et al. (1998); Koyama et al. (1999); Pelzer et al. (2001), FeSb2Mani et al. (2012); Takahashi et al. (2013) and Ce3Bi4Pt3Cooley et al. (1997); J. D. Thompson and Severing (1993) as extracted from the activated behaviour of the resistivity and the magnetic susceptibility. As depicted in Fig. (7), the increase of the gap scales roughly linearly with the applied pressure and is notably larger (on a relative scale) for the Kondo insulator Ce3Bi4Pt3.161616 In view of other Kondo insulating systems, a word of caution is in order. While for Ce-based compounds, the above rationale holds, the gap in hole-like Kondo insulators is actually suppressed under pressure, as shown for SmB6Beille et al. (1983b) or YbB12Iga et al. (1993). Interestingly, a critical pressure of 6GPa suppresses the gap in SmB6 and magnetic long-range order with a saturated moment of develops below 12KBarla et al. (2005). It was suggested that the opposing trends in, e.g., Ce3Bi4Pt3 and SmB6 are rooted in the different signs for the change in unit-cell volume upon adding/removing an electron to the system (ion-size difference of the , configurations)Xu et al. (1996). 171717For a study of doped FeSi under pressure, see Refs. Onose et al. (2005); Forthaus et al. (2011).
It would be interesting to extend the above analysis of charge and spin gap—, —to the coherence scale : Is the dependence of on the value of the gap the same in both compounds? Or is the crossover to Curie-Weiss-like decay in the -electron compounds different, as it is proposed to be driven by Hund’s rather than Hubbard physics (cf. Section (II.6))? Answering these questions requires, however, measurements of FeSi under pressure up to temperatures above , currently unavailable.
Isoelectronic substitutions.
Another perturbation of the gap is achieved by isoelectronic substitutions. One route is the isoelectronic replacement of ligands.181818Another route of isoelectronic substitution is the replacment of the 3-transition metal(lanthanoid) in FeSi(Ce3Bi4Pt3) by their homologues one row down in the periodic table. The interesting case of Fe1-xRuxSi will be discussed in Section (III.2.4). Interchanging 4 orbitals with 5 ones is unfortunately not possible in Ce3Bi4Pt3, as the actinoid thorium prefers the 567 rather than the 567 configuration. Here, the most prominent example is the alloy FeSi1-xGex. While the end-member compounds of this series are isoelectronic as well as isostructural, their electronic and magnetic properties are very different. Contrary to FeSi, which is insulating at low temperature and does not show any signs of magnetic order, FeGe is metallic and shows spin helical long-range orderLundgren et al. (1968); Lebech et al. (1989). The latter roots in the noncentrosymmetric B20 crystal structure that allows for a chiral spin-spin Dzyaloshinskii-Moriya interaction, which is particularly strong in FeGe. In fact, FeGeLebech et al. (1989) has an ordering temperature (K) and a helix period length (Å) that are, both, much larger than in the prototypical helimagnet MnSiIshikawa et al. (1976) which also crystallizes in the B20 structure. Strong correlation effects manifest themselves in FeGe by notable effective masses extracted from both specific heat measurements (mJ/(molK2)) Marklund et al. (1974); Wilhelm et al. (2016); Yeo et al. (2003) and optical spectroscopyGuritanu et al. (2007). Also, transfers of optical spectral weight occur over an energy range of the order of 1eVGuritanu et al. (2007).
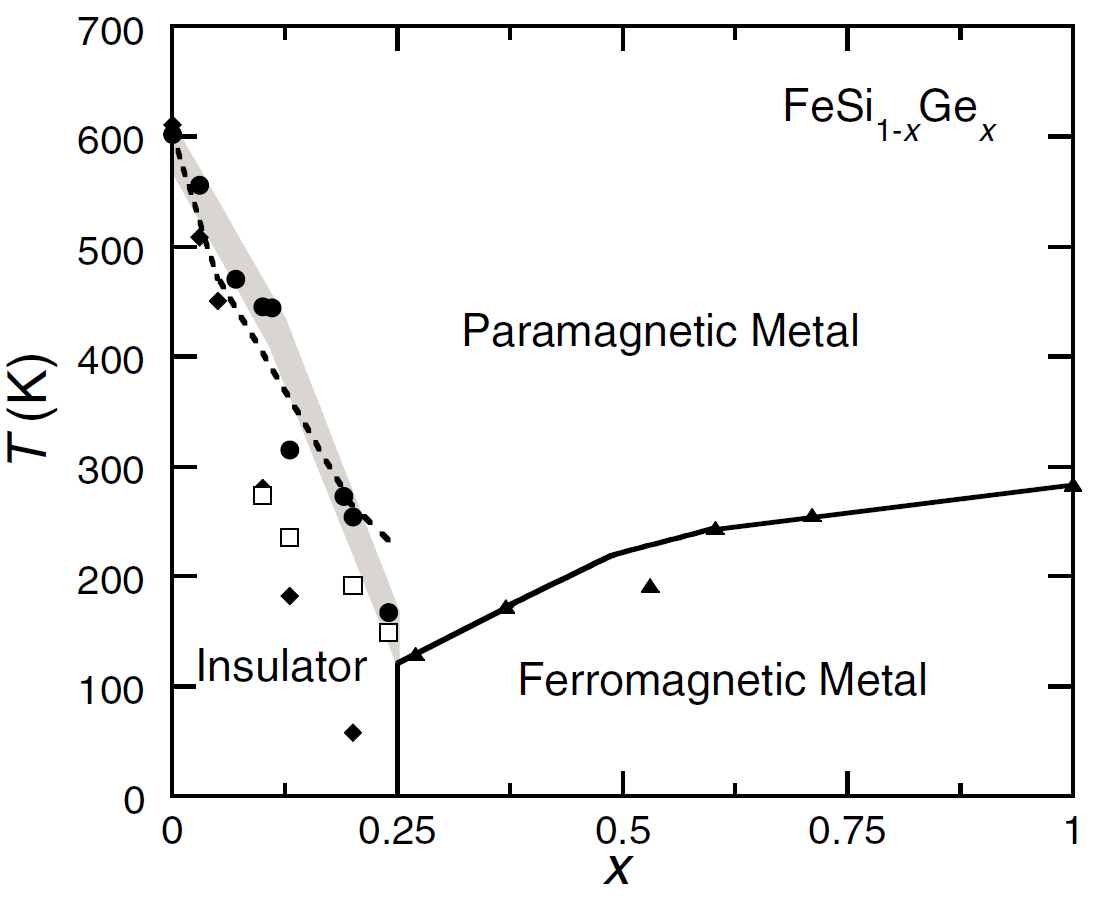
Starting at FeSi, already small concentrations of Ge in FeSi1-xGex have a large impact on electronic and magnetic properties. Activation law fits to the resistivity find a linear decrease of the gap with concentration , with the gap vanishing at Bauer et al. (1998). More recently, Yeo et al. Yeo et al. (2003) established the phase diagram shown in Fig. (8) based on resistivity (charge gap) and magnetic susceptibility (spin gap) measurements: Both charge and spin gap decrease with the Ge-concentration and the maximum in the magnetic susceptibility moves towards lower temperature. Interestingly, spin excitations are moving notably quicker towards gapless behaviour with than charge excitations, reminiscent of the above discussion on the non-equivalence of charge and spin gaps. Concomitantly, a Pauli-paramagnetic contribution appears in the magnetic susceptibilityTsujii (2017). At low temperatures, the introduction of Ge drives a first order transition from a non-magnetic semiconductor to a ferromagnetic metal at . The size of the charge gap in FeSi1-xGex correlates with the lattice constantBharathi et al. (1997), suggesting that the principal origin of the transition is chemical pressure, i.e., the volume expansion. Indeed, the unit-cell volume of FeGe 12.5% larger than that of FeSiWilhelm et al. (2007). Therefore, the (spin spiral) long-range order can be counteracted by external pressure: Magnetism in the end compound FeGe is suppressed by 19GPa, although metallicity is found to persistPedrazzini et al. (2007).
Again, it would be quite valuable to measure the magnetic susceptibility of FeSi1-xGex for up to higher temperatures so as to extract as well as the magnitude of the effective fluctuating moment in the Curie-Weiss-like regime.
According to Doniach’s phase diagramDoniach (1977), external parameters that reduce the Kondo coupling can drive also Kondo insulators through a phase transition to a magnetic metal. In fact, the quantum criticality associated with the crossover of dominant Kondo to preponderant RKKY interaction is a very active field of researchSchroder et al. (2000); Gegenwart et al. (2008); Wirth and Steglich (2016); Si and Paschen (2013). Some examples: Antiferromagnetism in the dense Kondo system CePdSn is suppressed above 6GPa while the resistivity develops an insulating slopeIga et al. (1993). A critical pressure GPa drives the Kondo insulator SmB6 through a transition (likely to be of first order) into a magnetically ordered metallic state Barla et al. (2005). Electron-doping CeRhSb via substitution of Pd for Rh drives a crossover from a paramagnetic insulator to an antiferromagnetic metalMenon and Malik (1997). Further, several experiments have found a crossover from an antiferromagnetic metal to a non-magnetic “insulator” for diverse alloyings in the CeNiSn system, e.g., CeNi1−xPtxSn Adroja et al. (1996); Sakurai et al. (1992); Nishigori et al. (1993); Kalvius et al. (2000), CeNi1-xPdxSnKasaya et al. (1991) and CeNi1−xCuxSnKalvius et al. (2000).191919Yet, CeNiSn is often referred to as a “failed Kondo insulator”. In fact, the system is thought to be rather a Kondo semimetalTakabatake et al. (1996); Nakamoto et al. (1995) owing to an anisotropic hybridization amplitudeIkeda and Miyake (1996); Stockert et al. (2016).
Hence, while -electron-based narrow-gap semiconductors and Kondo insulators may both exist in proximity to magnetically ordered phases, the nature of that ordering is typically different in both cases (FM vs. AF).
Doping.
Finally, charge and spin excitations can be altered by doping. We first discuss non-isoelectronic substitutions in FeSi. Substituting up to 3% of Fe with Co causes only a minute reduction of, both, the direct and indirect charge gapChernikov et al. (1997).202020Other transition metal substitutions that support the B20 crystal-structure (but will not be discussed here) include electron doping with NiA.S. Panfilov and Sidorenko (1975); Ackerbauer et al. (2009); Hunt et al. (2017), and hole doping by replacing Fe with MnManyala et al. (2008), or CrA.S. Panfilov and Sidorenko (1975); Yadam et al. (2016). Moreover no anomalies in thermodynamic and transport quantities have been observed, pointing towards the persistence of paramagnetism. The specific heat, however, was found to increase roughly linearly with doping, reaching 7.6mJ/(mol K2) at %. Assuming as origin an increased density of states at the Fermi level, Chernikov et al. Chernikov et al. (1997) extracted a surprisingly large effective mass ratio .
Co-concentrations beyond 5% lead to a transition to a ferromagnetic metallic stateBeille et al. (1983a); Shimizu et al. (1990); Manyala et al. (2000); Onose et al. (2005). This is quite notable, since the end compound, CoSi, is a diamagnetic semimetal. Indeed for , Fe1-xCoxSi becomes again paramagnetic.212121Additional electrons also induce metallic ferromagnetism in Fe2VAl (see Fig. (48)) and in FeSb2Hu et al. (2007b, 2006). Lacerda et al. Lacerda et al. (1993) showed that the magnetic susceptibility of electron doped Fe1-xCoxSi and FeSi1-xPx are qualitatively akin, prompting the authors to conclude that magnetism in the Co-substituted samples is not due to the moment of Co. By comparing Co-doping with Fe1-xRhxSi and Fe1-xRuxSi—which all become ferromagnetic above a critical doping—Paschen et al. Paschen et al. (1999) substantiated that magnetism in Fe1-xCoxSi does not arise from local moments on Co. Indeed the 4-orbitals orbitals of Rh have too large a radial extend to allow for local magnetism. That also isoelectronically substituted Fe1-xRuxSi orders ferrromagnetically points to an influence of the unit-cell volume onto magnetism (as in FeSi1-xGex, see above); that the ordered moment for insulating Ru-substituted samples is the smallest among the considered alloys indicats that (electron doping-induced) metallicity boosts magnetism in FeSiPaschen et al. (1999), further strengthening the itinerant picture. The effect of the unit-cell volume onto magnetism is corroborated by pressure experiments that see the disappearance of long-range order in doped samples above a critical pressureForthaus et al. (2011); also, epitaxially strained samples have a largely different critical doping level than the doped bulk Sinha et al. (2014)222222Note, however, a further complication: these thin films exhibit a rhombohedral distortion..
It is crucial to note the influence of cobalt-doping onto the spin-gap and the crossover temperature at which the magnetic susceptibility peaks before assuming a Curie-Weiss-like decay: The introduction of Co may affect the impurity-derived low-temperature upturn in . Otherwise, the magnetic susceptibility of Fe1-xCoxSi for concentrations up to % looks (above ) remarkably similar to that of FeSi, albeit with a constant upwards shiftLacerda et al. (1993). This means that both (as extracted from an activation-law fit) and, apparently, also are basically unaltered by doping. The added carriers only introduce a -independent Pauli-like contribution, congruent with the above findings from specific heat measurements. As will be discussed below, this is a marked difference to the behaviour of doped Ce3Bi4Pt3.
Alternatively also the ligand can be substituted. Hole doping can be achieved, e.g., in FeSi1-xAlxFriemelt et al. (1996); DiTusa et al. (1997, 1998); Delaire et al. (2013). DiTusa et al. DiTusa et al. (1997) interpreted their results such that FeSi is a renormalized realization of silicon, in the same sense as proposed for Kondo insulators: Doping the system leads to a (possibly disordered) Fermi liquid ground state, albeit with largely enhanced effective masses. Indeed, Al-doping causes the charge gap—as extracted from fitting the resistivity to an activation law above 100K—to rapidly decrease, while a metallic slope appears at lower temperatures already above about %Friemelt et al. (1996); DiTusa et al. (1998). From the specific heat coefficient, a considerable effective mass was extractedDiTusa et al. (1997). Concomitantly, as in the case of Co-doping, a Pauli-like contribution appears in the magnetic susceptibility. The electrons introduced by Al affect neither nor the (impurity-derived) Curie-Weiss upturn at very low temperatures. As a consequence, contrary to the charge gap, the spin gap remains roughly constant up to AlDiTusa et al. (1998), indicating a non-trivial interplay of charge and spin degrees of freedom.
Hole-doping the prototypical Kondo insulator Ce3Bi4Pt3 by substituting La for Ce notably suppresses the electrical resistivityHundley et al. (1990) and leads to a finite specific heat at low-temperatureHundley et al. (1990); Canfield et al. (1992). From the latter, much enhanced effective masses of up to at % have been extractedPietrus et al. (2008). However, doping also largely modifies the spin degrees of freedom: In fact the peak temperature, , consistently moves to lower temperatures with increasing doping Hundley et al. (1990); Pietrus et al. (2008). Indeed, as expected from, e.g., the Coqblin-Schrieffer modelRajan (1983), the linear coefficient of the specific heat scales with . This dependency is realized in (Ce1-xLax)3Bi4Pt3 above % La Canfield et al. (1992): Ce ions then behave as impurities in a metallic host. In polycrystalline samples, additionally, the overall magnitude of decreases Pietrus et al. (2008), contrary to the Pauli-like increase seen in doped FeSi (see above). Moreover, the spin-gap decreases notably with Severing et al. (1994). As discussed by Kwei et al. Kwei et al. (1992), there is a direct correlation between the magnetic response in the local moment regime and the change in lattice constant along the (Ce1-xLax)3Bi4Pt3 series: Indeed the square of the effective moment increases linearly with the shrinking lattice constant towards the Ce () end-member. This suggests that the change in lattice constant tracks the number of -electrons. Interestingly, also the metallic -compound Pr3Bi4Pt3 has a larger volume than its Ce cousinFisk et al. (1995). Also in other heavy fermion compounds, e.g., rare-earth chalcogenides, (mixed) valency and lattice constants are found to correlateVarma (1976). In Ce3Bi4Pt3 the valency that realizes Kondo insulating volume coincides with the lowest equilibrium volume.232323Also in some -electron narrow-gap semiconductors, the smallest lattice constant is found for insulating phases, see, e.g., Fig. (48) (top): the lattice constant of Fe2VAl is minimal for perfect stoichiometry. Deviations cause the volume to expand, while the system metallizes (see the specific heat in panel (c)) and develops long-range magnetic order (see panel (b)). In FeSi, off-stoichiometry Fe1-xSi1-x does not show any significant change in the lattice parameter for small Idl et al. (2002), while electron doping via Fe1-xCoxSi increases the latticeManyala et al. (2004). However, in the latter potential effects of the valency onto the unit-cell volume are masked by the contraction induced by the smaller atomic radius of Co.
I.2.4 Spin-orbit effects.
Lately, it was advocated that Kondo insulators might harbour topologically non-trivial band-structuresDzero et al. (2010, 2016). Crucially, Kondo insulators might be systems in which topological effects—derived from a one-particle description—are not severely encumbered by strong correlation physics. This is has to be contrasted to Mott-Hubbard physics, that is able to completely destroy any topological protection, see Di Sante et al. Di Sante et al. (2017). Indeed, the spin-orbit coupling has even been suggested to play a role in the stabilization of Kondo insulating behaviour. Recently, this question has been investigated for the prototypical Kondo insulator Ce3Bi4Pt3 by Dzsaber et al. Dzsaber et al. (2017): It was shown that—contrary to all the above cases—the unit-cell volume in the isoelectronic substitution series Ce3Bi4(Pt1-xPdx)3 is virtually constant for all compositions . Consequently, there are only two fundamental changes along the series: (i) a reduction of the spin-orbit coupling because Pd is a much lighter element than Pt, and (ii) a change in the Ce-4-to-noble-metal- hybridization caused by the different radial character of the 4 and 5 orbitals of Pd and Pt, respectively—an effect no considered in Ref. Dzsaber et al. (2017).
Dzsaber et al. Dzsaber et al. (2017) found a collapse of the charge gap for growing , with the end member Ce3Bi4Pd3 exhibiting a nearly temperature-independent resistivity. Concomitantly, , that marks the onset of Kondo screening (cf. Fig. (4)(b)), vanishes. Excluding antiferromagnetic ordering, it was suggested that Ce3Bi4Pd3 is a Weyl-Kondo semimetalDzsaber et al. (2017); Lai et al. (2018).
If a Kondo insulator can be destabilized by decreasing the spin-orbit coupling, this would be a large difference to systems like FeSi, that only involve elements light enough to safely neglect relativistic effects for all practical purposes.242424While spin-orbit coupling effects are certainly smaller in transition-metal-based narrow-gap semiconductors, let us mention that also FeSi, RuSi, FeGe, and other compounds crystallizing in the non-symmorphic B20 structure (cf. the discussion of their band-structures in Section (II.2.1)) allow for non-trivial topological effects, such as non-vanishing electronic Berry phasesKübler et al. (2013). Also, see the review by Martins et al. Martins et al. (2017) for the interplay of correlation effects and the spin-orbit coupling in and systems. In Section (II.2.3) we will discuss the electronic structure of Ce3Bi4Pt3 from the band-theory perspective and shed light onto the modifications caused by the substitution of Pt with Pd. In Section (II.4.3) we further present new realistic many-body calculations for Ce3Bi4Pt3.
I.2.5 Thermoelectricity.
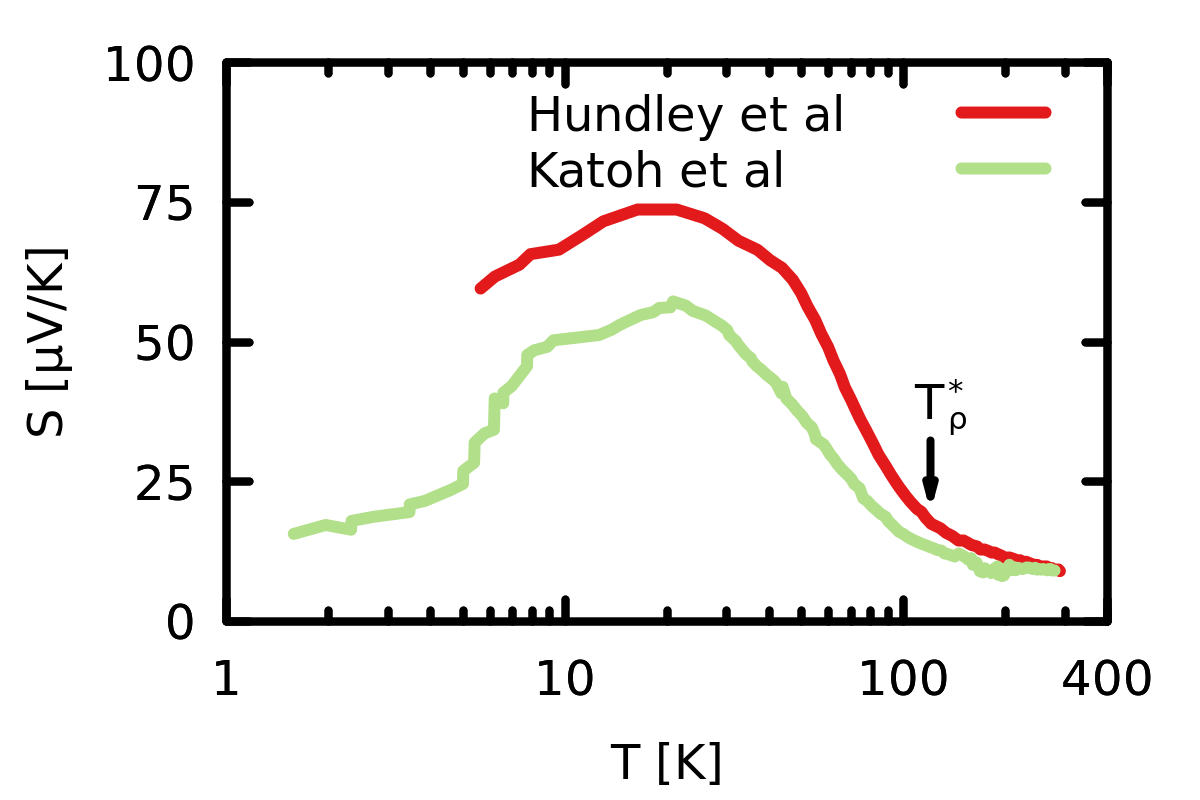
Finally, FeSi and Ce3Bi4Pt3 also exhibit empirical similarities in their thermoelectric response. As evident in Fig. (4)(c) both compounds develop large thermopowers at low temperatures. Combined with the resistivity data, Fig. (4)(a), these yield quite notable powerfactors, see table (1). This is expected for insulating systems which possess a significant particle-hole asymmetry. In an asymmetric, coherent semiconductor the thermopower roughly behaves as , cf. Section (III.1.3). Effects of incoherence or other mechanisms towards metallization will quench the thermopower. In the photoemission spectra of FeSi discussed above (cf. Fig. (5)(a)) notable spectral weight appears at the Fermi level starting at 100K. In this range, the thermopower is already below V/K. At (see Section (I.2) and, there, Fig. (5)(b)), the thermopower has already become negligible in FeSi. Using the same measure, the decay in Ce3Bi4Pt3 is slower: At its , the thermopower is still about a third of its maximum value.
While the insulator-to-metal crossover with rising temperature is antagonistic to a large thermoelectric response, it is difficult to assess, on the basis of the experimental data alone, whether the metallization causes the quenching of the thermopower. As will be discussed in Section (III.2) (see, in particular, Fig. (38)), theoretical calculations strongly suggest an affirmative answer.
Response of doped samples.
Besides the difference between a metallic and an insulating thermoelectric response, the thermopower—being a measure for particle-hole asymmetry—is extremely sensitive to doping. In the case of FeSi, Ce3Bi4Pt3, and other narrow-gap semiconductors both effects conspire: Introduced electrons or holes may not only change the character of preponderant charge carriers but they also suppress the insulating state. Indeed, the thermopower of the Kondo insulator Ce3Sb4Pt3 is extremely sensitive to doping both via ligand alloying (Ce3CuxPt3-xSb4Jones et al. (1999)), as well as lanthanoid substitution (Jones et al. (1998)). Both kinds of doping quickly suppress the thermopower. The same applies to FeSi: As seen in Fig. (39) (taken from Sakai et al. Sakai et al. (2007a, 2007)) stoichiometric FeSi sticks out as an island of large low-temperature thermopower among transition metal mono-silicides TMSi (TM=Cr, Mn, Fe, Co) and their alloys. Also doping FeSi on the ligand site, e.g., hole-doping via FeSi1-xAlxDiTusa et al. (1998), suppresses the thermopower. As will be explained in Section (III.1.3) electron-doping FeSi is expected to drive the thermopower through a sign-change and realize a negative response of a magnitude comparable to that of stoichiometric FeSi. Indeed, this is seen when substituting some Co for Fe, Fig. (39). Realizing electron-doping on the ligand site might have the advantage of less perturbing the low-energy electronic structure in terms of disorder. Since FeSi1-xPx can be synthesized in the B20 structureLacerda et al. (1993)252525FeP has, at ambient conditions, the regular MnP-type structure (space group Pnma) Gu et al. (2011)., it would be quite interesting to perform thermoelectric measurements on it.
I.2.6 Summary.
We end this section with a list of empirical similarities and differences of FeSi and Ce3Bi4Pt3, as well as some proposals for future experiments that could extend the presented comparison.
Empirical similarities of FeSi and Ce3Bi4Pt3.
-
•
absence of long-range order at all in stoichiometric samples.
-
•
charge and spin excitations are gapped at low- with activated behaviour in resistivity and magnetic susceptibility.
-
•
spin gap tends to be smaller than the direct charge gap: .
-
•
crossover to a metallic state for ; towards the metallization, the gap does not shrink in size, but it gets filled by incoherent weight.
-
•
spectral weight transfers in the optical conductivity over scales much larger than the direct charge gap .
-
•
crossover to a Curie-Weiss-like magnetic susceptibility above , with a magnitude of fluctuating moments close to the single ion limit.
-
•
pressure increases spin and charge gaps, indicative of a gap caused by hybridization.
-
•
large thermopowers at low- when the systems are coherent and insulating.
-
•
possibility to drive a paramagnetic-insulator to ferromagnetic-metal transition with magnetic fields that induce Zeeman-splittings of the order of the spin gap.
-
•
doping induces metallization; emerging quasi-particles have substantially enhanced effective masses .
-
•
proximity to ordered phases that can be reached by doping, isoelectronic substitutions (volume expansion and/or change of radial component of orbitals), or applied fields.
Empirical differences between FeSi and Ce3Bi4Pt3.
-
•
proximity to different spin-ordered phases: non-magnetic -electron narrow-gap semiconductors have a propensity for nearby ferromagnetic instabilities.262626One exception is Fe1-xCrxSb2 which is an antiferromagnetic insulator for Hu et al. (2007a). Long range order is likely of itinerant origin, with enhancements from the Hund’s-rule coupling (cf. Refs. Okabe (1996); Bünemann et al. (1998); Vollhardt et al. (1999); Sakai et al. (2007b), and the discussion in Section (II.6)), and can be reached under volume expansion or doping. Some Kondo insulators can instead be driven to an antiferromagnetic (RKKY-mediated) instability by (inverse) physical or chemical pressure, changes in the Kondo coupling by isoelectronic substitutions with different radial quantum number, or doping. Moment-carrying charges tend to be localized.
-
•
interplay of charge and spin degrees of freedom under doping: While doping largely changes the activated behaviour in the conductivity and induces a conducting state at low-temperatures in both FeSi and Ce3Bi4Pt3, the effect on the magnetic response is markedly different. Indeed doping only mildly affects the spin-gap and crossover temperature in FeSi, while in Ce3Bi4Pt3 both are quite sensitive to the introduction of holes.
Experiments to further the current understanding.
-
•
high temperature optical conductivity measurements of FeSi to access spectral weight transfers: Does the potentially different microscopic origin of Curie-Weiss-like decay in the susceptibility (local vs. itinerant fluctuations) result in a disparate interplay of charge and spin degrees of freedom above ?
-
•
dependence of in FeSi and Ce3Bi4Pt3 under pressure (or FeSi1-xGex): does quasi-particle coherence follow the same scaling with in both materials?
-
•
measurements of the magnetic susceptibility of Fe1-xCoxSi and FeSi1-xAlx up to and beyond: We stated that is seemingly unaffected by doping. However, this was a statement made by an educated extrapolation. Actual measurements of only extend to 400K, which is still slightly below .
-
•
electron-doped FeSi1-xPx: It would be interesting to extend the work of Lacerda et al. Lacerda et al. (1993) to magnetoresistance and thermopower measurements. The former could substantiate the claim of an itinerant nature of magnetism in Fe1-xCoxSi. The latter is motivated by the finding that Co-doping yields a large -type thermopowerSakai et al. (2007a) in Fe1-xCoxSi. Does FeSi1-xPx perform better (because the transition-metal site is less perturbed)?
- •
II Theories of correlated narrow-gap semiconductors
This chapter deals with theoretical efforts to understand the peculiar behaviour of correlated narrow-gap semiconductors. First (Section (II.1)) we will discuss early phenomenological scenarios that invoke electronic correlation effects of some sort to explain the experimental observations in the prototypical compounds FeSi and FeSb2. Next (Section (II.2)) we review the merits and failures of band-theory applied to several classes of relevant materials, and include new calculations for the Kondo insulator Ce3Bi4Pt3. Based on the insights of band-theory, solutions of many-body models have shed light onto the qualitative impact of correlation effects in these systems. These are recapitulated in Section (II.3). Building on this knowledge, realistic many-body calculations (Section (II.4)) were able to quantitatively reproduce, for the prototypical FeSi, the signatures of correlation effects in diverse experimental observables. Importantly, the congruence with experiments allowed for the deducing of microscopic insights (Section (II.4.2)) beyond what was included in the reductionist models studied before. Indeed, the emerging physical picture refutes some earlier scenarios, while reconciling others. Crucially, the Hund’s rule coupling was identified as a new key ingredient to the physics observed in FeSi. Further, new realistic many-body calculations for Ce3Bi4Pt3 (Section (II.4.3)) are used to discuss potential microscopic differences between -based narrow-gap semiconductors and Kondo insulators. With this insight, we performed new model calculations (Section (II.6)) that will put the essence of correlated narrow-gap semiconductors into a wider context. Finally (Section (II.7)), is devoted to the role played by lattice degrees of freedom and effects of the electron-phonon coupling in systems such as FeSi.
II.1 Early phenomenological scenarios
The endeavour to deduce a phenomenological scenario from experimental findings for FeSi was pioneered by Jaccarino et al. in their seminal work Jaccarino et al. (1967). There, they modelled in particular the intriguing magnetic susceptibility (see Fig. (4) (b)) with (i) a density-of-states model for itinerant spin paramagnetism, and (ii) a spin-model of localized moments. See also the extensive discussion of Tsujii et al. for FeGa3Tsujii et al. (2008b), as well as Petrovic et al. Petrovic et al. (2003, 2005) and Hu et al. Hu et al. (2006) for FeSb2.
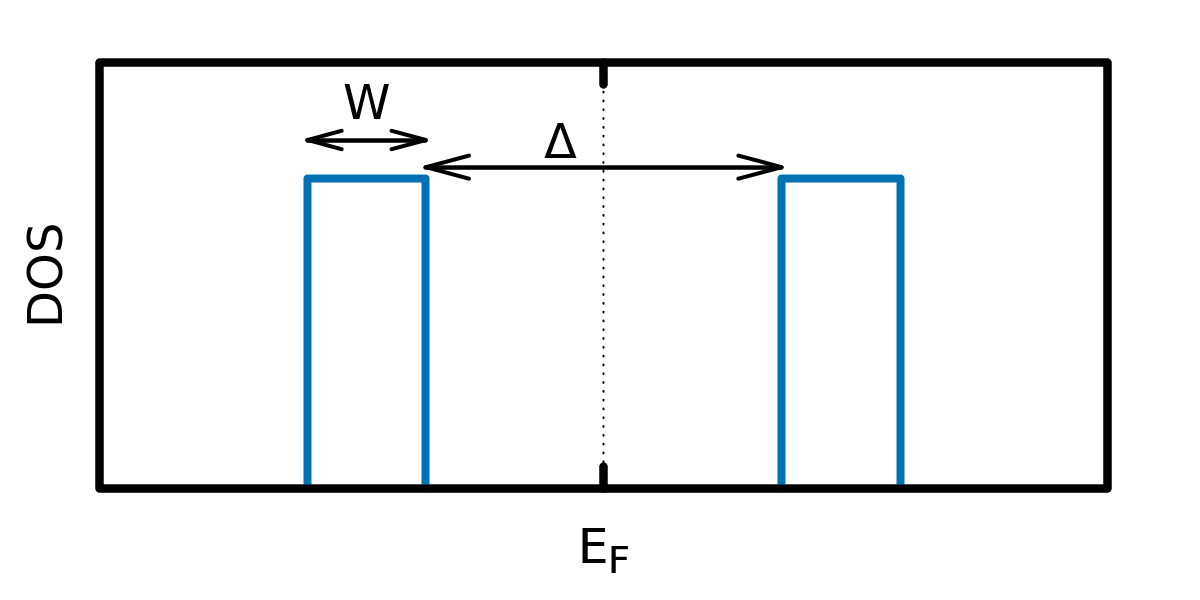
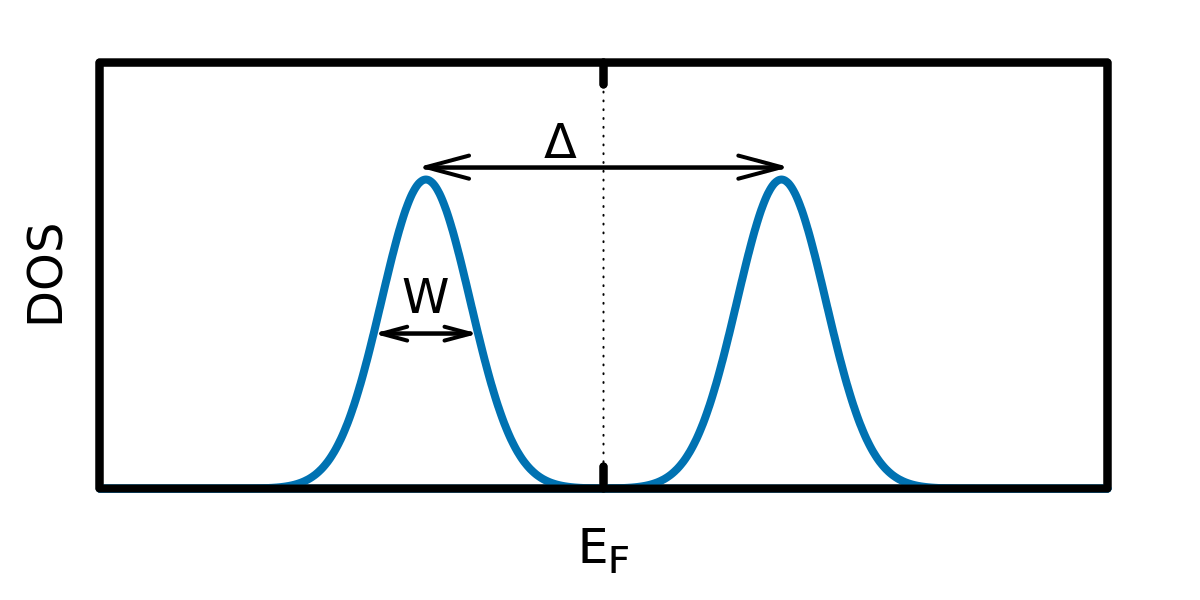
Density-of-states models.
A regular semiconductor has dispersive valence and conduction states, with a gapped density of states (DOS) as is schematically illustrated in Fig. (9) (top). In the one-particle picture, such a DOS will produce a Pauli spin-susceptibility ( is the Fermi function and is the Bohr magneton)
| (4) |
that results in activated behaviour of a form , where is the band-gap and a function that depends on the details of the electronic structure.272727For example, for a constant density of states , and for parabolic dispersions in three dimensions (as shown in Fig. (9) (top)), Tsujii et al. (2008b). Spin excitations are thus governed by the same energy scale, , as charge excitations, stating that in band-insulators the charge and the spin gap are equal. Using a constant density of states for the low-temperature susceptibility of FeSi, we find meV. However, the fit is of worse quality than the one shown in Fig. (4)(b,left) that uses a spin model (see paragraph below). In order to account for a maximum in at within the one-particle framework, Jaccarino et al. Jaccarino et al. (1967) and later Mandrus et al. Mandrus et al. (1995b) proposed a strong renormalization of the bandwidth, as schematically shown in Fig. (9)(middle). Indeed the finite bandwidth can lead to anomalies in thermodynamic and transport properties. Via Eq. (4) a good fit of the experimental susceptibility is achieved for meV and meVMandrus et al. (1995b). Also the electronic contributions to the specific heat and the thermal expansion coefficient were faithfully modelled with parameters of similar magnitudeMandrus et al. (1995b). In this picture, the DOS has to exhibit features that are narrower than the gap itself, , as realized, e.g., for the -electron density in Kondo insulators. It was however concluded that the renormalization effects necessary to reach such an electronic structure for FeSi are largely beyond conventional band-theory Mandrus et al. (1995b) and deemed rather unrealisticJaccarino et al. (1967). Finally, Mani Mani (2004) proposed a DOS-model with a Gaussian density, see Fig. (9) (bottom). The Gaussian tails of the excitations are supposed to describe a finite in-gap density arising from disorder-derived localized states, but could also, qualitatively, account for an incoherence-induced (yet temperature independent) broadening. This model was shown to yield a reliable fit to the conductivity under pressure for pristine FeSi, as well as for the FeSi1-xGex data of Ref. Mani et al. (2001), foreshadowing the influence of quasi-particle incoherence seen in more sophisticated approaches discussed later in this chapter.
Spin models.
A scenario opposite to the extended Bloch band picture is that of localized moments. For an excited state of spin separated from the ground state by a spin gap , one expects in the limit a magnetic susceptibility , where is Avogadro’s constant and the gyromagnetic ratio. Using the standard value , Jaccarino et al. Jaccarino et al. (1967) found a spin gap meVK for a spin state , while the best fit was achieved for , meVK, albeit with an enhanced . From the data in Fig. (4)(b) we find meV and , which yields for a value , to give a satisfactory description. Above 700K, as discussed in Section (I.2.2) (see again Fig. (4)(b,left)), a Curie-Weiss law, , gives a faithful representation of the experimental data, with a fluctuating moment that is actually close to the single-ion limit of iron for , where (). This good phenomenological description of the different temperature regimes in the susceptibility notwithstanding, further insights are needed to establish a conclusive microscopic picture. In fact the presented local-moment scenario is at odds with magnetism under doping or lattice expansion, established to be of itinerant origin (see the discussion in Section (I.2.2)). Also in the case of FeSb2, inelastic neutron spectra point towards an itinerant origin of magnetic fluctuationsZaliznyak et al. (2011).
Other scenarios.
Varma Varma (1994) stressed the importance of going beyond a description in terms of the Kondo-lattice model, to include effects of itinerancy and charge fluctuations for both FeSi and heavy-fermion materials. He proposed that a temperature-induced mixed valence could be at the origin of the anomalous behaviour of FeSi.
Misawa and Tate Misawa and Tate (1996) reproduced the experimental susceptibility of FeSi in an itinerant model when going beyond the Pauli expression, Eq. (4), by including a scattering amplitude in the Fermi-liquid picture. The inclusion of scattering effects allowed to employ the model density-of-states of Refs. Jaccarino et al. (1967); Mandrus et al. (1995b) and shown in Fig. (9)(middle), albeit in a more realistic parameter regime, namely .
Finally, different variants of spin-fluctuation theory were invoked to explain magnetic and thermal properties of FeSi: Takahashi and Moriya Takahashi and Moriya (1979) discussed FeSi as a nearly itinerant ferromagnetic semiconductor with a temperature-induced local moment; Evangelou and Edwards Evangelou and Edwards (1983) moreover included important effects of a temperature-dependent density-of-states self-consistently and found qualitative agreement with experiment.
II.2 Band-structures and many-body perturbation theory
| 0% “NaCl” | 50% | 75% | 100% FeSi (B20) |
|---|---|---|---|
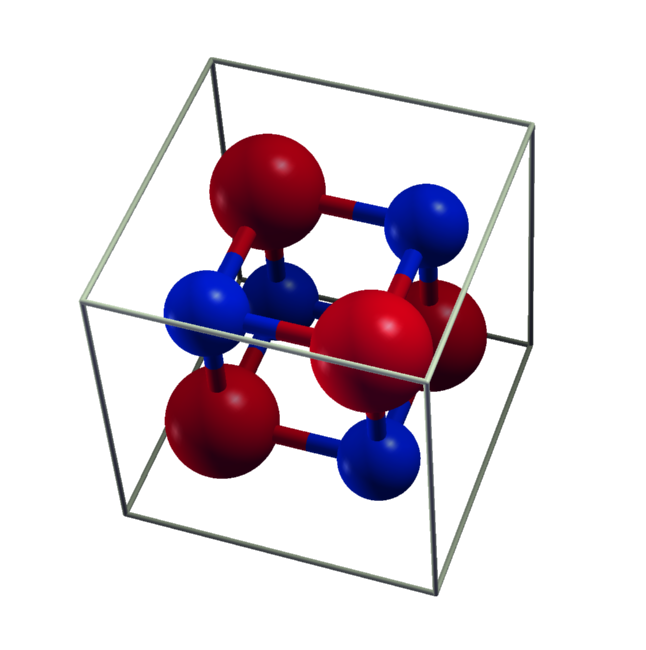
|
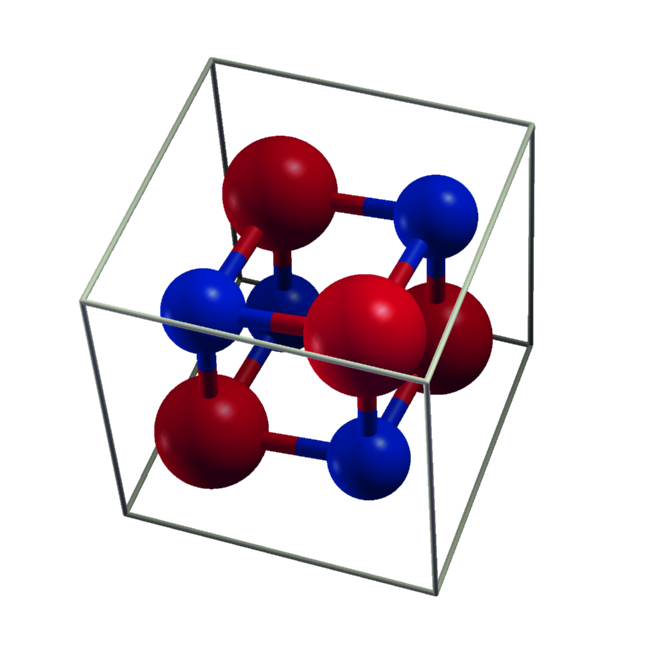
|
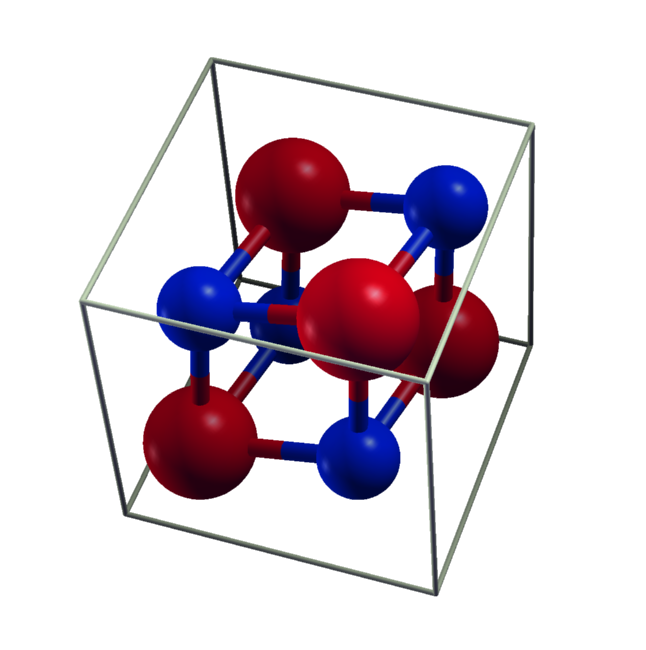
|
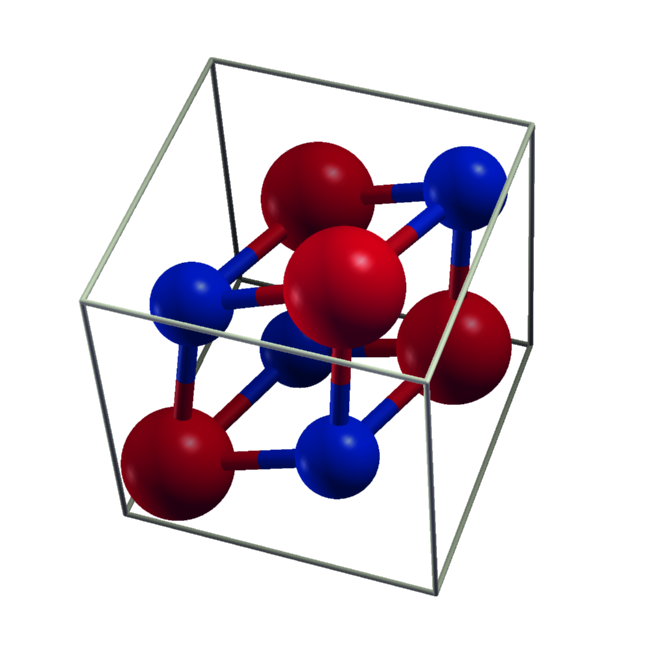
|

|

|

|

|
In this section, we will review applications of ab initio electronic structure methods to correlated narrow-gap semiconductors, as well as to the prototypical Kondo insulator Ce3Bi4Pt3. We will discuss results from effective one-particle theories, such as density functional theory (DFTKohn (1999); Jones and Gunnarsson (1989)), hybrid functionals, and static mean-field DFT+Anisimov et al. (1991). These methods provide very valuable insights into the complexities and chemistry of real materials, such as the nature of bonding (ionic vs. covalent), crystal-field splittings, multi-orbital effects, as well as qualitative information on instabilities towards (itinerant) magnetism. Such results are instrumental for constructing effective low-energy many-body models, that will be discussed in Section (II.3). Going beyond density functional based methods, we also include here some results from Hedin’s GW methodHedin (1965); Aryasetiawan and Gunnarsson (1998); Onida et al. (2002), a many-body perturbation theory, as well as constrained random phase approximation (cRPA) Aryasetiawan et al. (2004) estimates of local (Hubbard , Hund’s ) interactions for use in low-energy many-body models.
II.2.1 FeSi, other B20 compounds, and a comparison to oxides.
FeSi and FeGe as well as their 4 homologues RuSi and RuGe crystallize in the so-called B20 structure. Despite being cubic (space group P213) the compounds’ crystal-structure is quite complex: There are four formula units per unit-cell, each Ru (Fe) has seven Si (Ge) neighbours, and the absence of inversion symmetry causes a Dzyaloshinskii-Moriya-derived spin spiral structure in the magnetically ordered phase of FeGeLebech et al. (1989). Indeed these compounds have the same atomic arrangement as the prototypical itinerant helimagnet MnSiWilliams et al. (1966); Ishikawa et al. (1976). As suggested by Mattheiss and HamannMattheiss and Hamann (1993), the B20 structure can be seen as a simple cubic rock-salt structure (space group Fm3m) with a considerable distortion along the [111] direction. Nonetheless FeSi shows no signs of any long-range orderWatanabe et al. (1963) and is paramagnetic down to 40mKHunt et al. (1994), while RuSi is diamagnetic with a temperature-independent susceptibilityBuschinger et al. (1997b); Hohl et al. (1998).
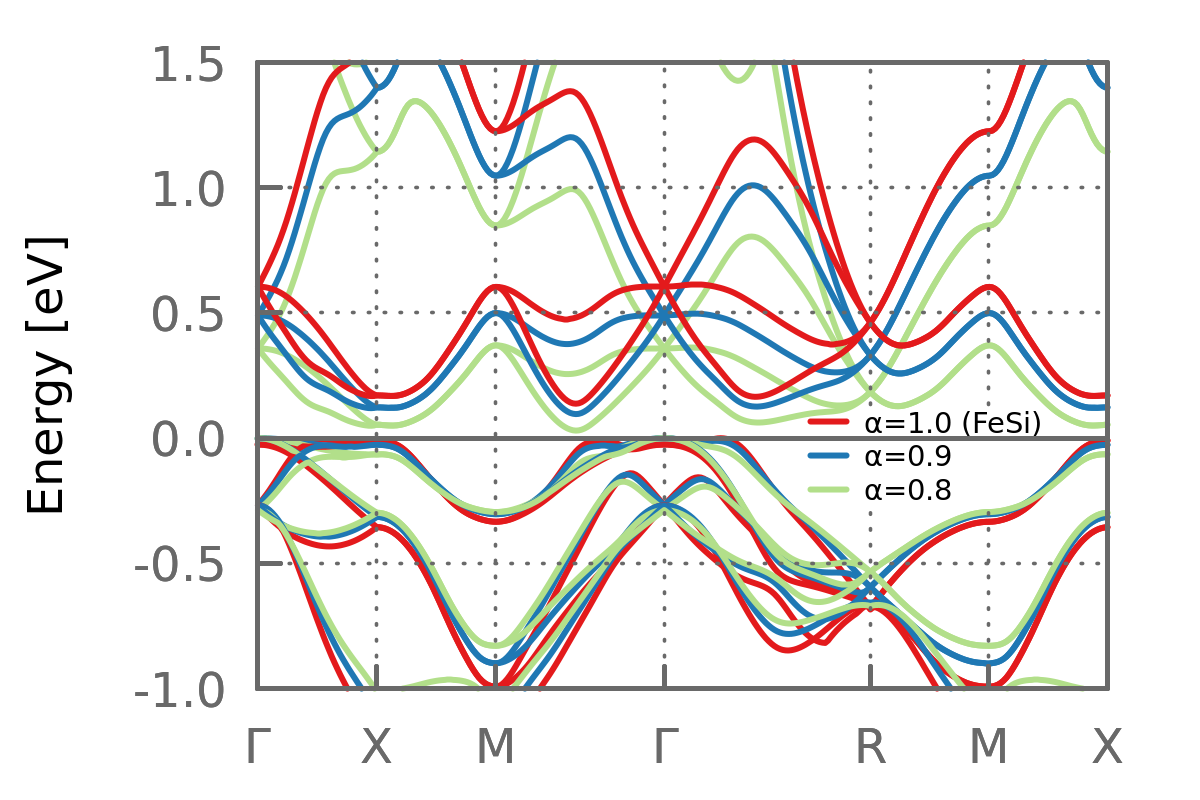
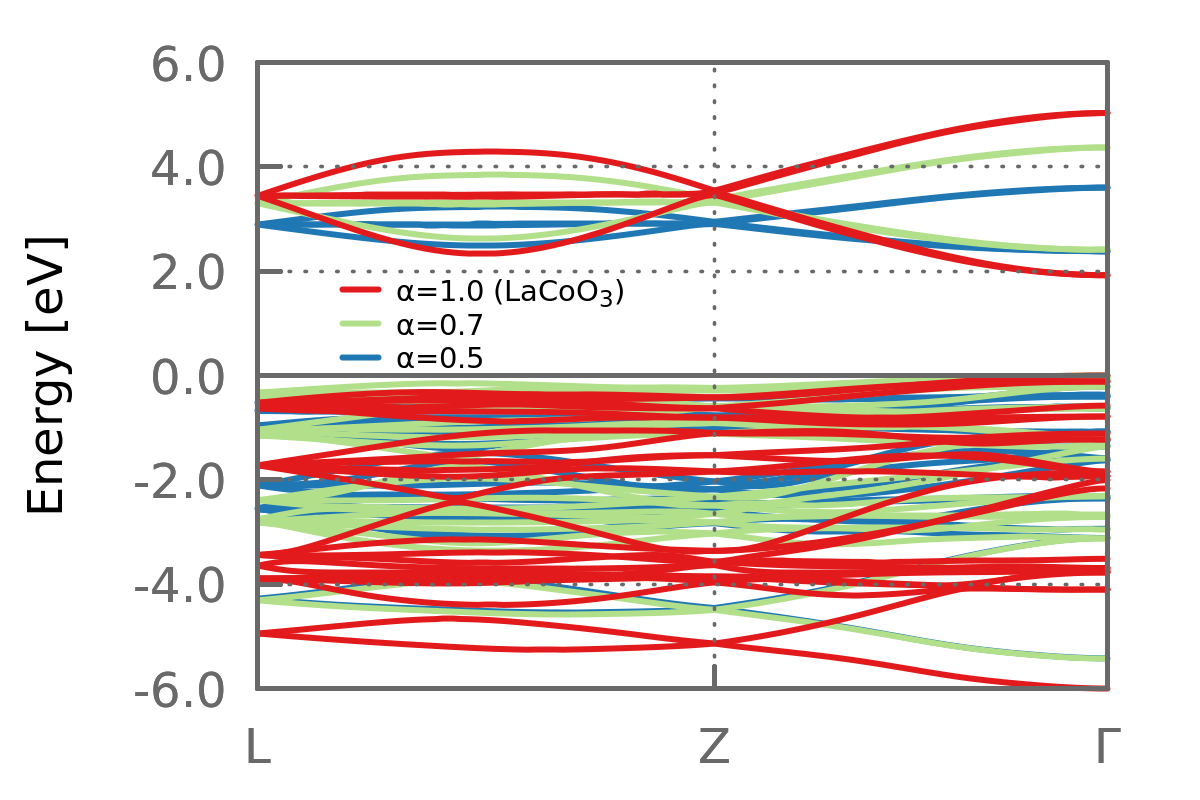
FeSi and FeGe: insights from band theory.
The described distortion is crucial for the insulating ground-state in the silicides: Indeed, as shown in Fig. (10) (left), rock-salt FeSi is metallic within DFT. Nonetheless the density of states (DOS) at low energies is quite small, as the bands that cross the Fermi level are quite dispersive. With increasing distortion the Fermi level crossings are avoided and an indirect gap of 100-130meV is openedMattheiss and Hamann (1993); Fu et al. (1994); Mazurenko et al. (2010); Tomczak et al. (2013b). The atomic displacements of the distortion conserve the cubic Bravais lattice but reduce the point group to tetrahedral. As a consequence the transition metal 3-orbitals split into a low-lying and two doublets -, and , . The latter two are sufficiently separated in energy so that—for a 3 configuration for Fe/Ru—the three lowest orbitals are completely filled and the paramagnetic DFT solutions become insulating.
For the silicides, DFT correctly finds this paramagnetic insulator to be the ground-state. As discussed by Mazurenko et al. Mazurenko et al. (2010) for FeSi, the band-gap does not primarily originate from crystal-fields, but from distortion-induced changes in the hybridization between the iron atoms and their environment. To illustrate this, we have constructed maximally localized Wannier functions for a subspace consisting of the Fe-3 and Si-3 and 3 orbitals of a GGA band-structure calculation. The use of this atom-centred local basis allows to empirically study the influence of inter-atomic hybridizations onto the electronic structure. Indeed, we can scale all hybridizations between each iron atom and all other atoms in the unit-cell with a factor . Fig. (11)(a) displays the results: Akin to the (direct gap of the) periodic Anderson model, the gap in FeSi changes linearly with the strength of the hybridization. In fact, below the system becomes metallic. Hence FeSi can be categorized as a covalent hybridization-gap semiconductorMattheiss and Hamann (1993); Jarlborg (1999); Kuneš and Anisimov (2008); Mazurenko et al. (2010); Tomczak et al. (2012a). However, there are qualitative differences to the case of canonical Kondo insulators: An individual scaling of inter-atomic hybridizations in FeSi (results not shown) divulges that the gap is mainly driven by inter-iron hybridization—as opposed to hybridizations between localized orbitals and conduction-electron bands as in, e.g., Ce3Bi4Pt3 (see Section (II.2.3)). In fact, Mazurenko et al. Mazurenko et al. (2010) investigated the spread of their Wannier functions and found that the ones centred on the iron atoms have substantial weight at neighbouring iron sites—in stark contrast to localized -orbitals in Kondo insulators. As a consequence the highest valence and lowest conduction bands have different orbital characters. Instead, we will see in Section (II.2.3) that in DFT calculations for Ce3Bi4Pt3, the dominant character is the same on both sides of the gap. This distinction between these two systems will be further discussed in Section (II.6) for prototypical many-body models, and in Section (II.5.4) in the context of realistic many-body calculations.
At this point, we find it instructive to compare the covalently bonded hybridization-gap insulator FeSi to the oxide LaCoO3. Both compounds share, at first glance, several empirical similarities, such as the insulator-to-metal transitions with rising temperature and a strongly non-monotonous magnetic susceptibility (see Fig. (2)). Here, we limit the comparison to the ground-state as described within band-structure methods. To obtain an insulating Kohn-Sham spectrum for LaCoO3, the inclusion of exchange effects beyond the LDA or GGA functionals is required. Fig. (11)(b) displays the band-structure obtained using the mBJ functionalTran and Blaha (2009). There, the gap, eV vastly overestimates the experimental finding of 100meV282828QSGW results (unpublished) exhibit an even larger gap of 2.4eV. (see table (1)). In the shown DFT solution, the nominal six -electrons of cobalt fully populate the orbitals that are well separated from the thus empty states, resulting in a low-spin configuration. In order to elucidate the dominant origin of the - splitting, we have performed the same analysis as for FeSi, i.e., we have constructed a local Wannier basis and scaled down the hybridizations of the cobalt atoms with their environment. Contrary to FeSi, this procedure causes the gap to in LaCoO3 to increase. Indeed the visible shrinking of the -dispersion trumps the slight downshift of its centre-of-mass. Therefore, the gap-formation in this setup is dominated by local crystal-fields, as previously observed by Křápek et al. Křápek et al. (2012). For a discussion of how the covalent vs. ionic gap-formation impacts finite-temperature properties, including electronic correlation effect, see Section (II.4.2) for a sequel of the FeSi-LaCoO3 comparison and Section (II.5) for a discussion of the bigger picture.
We now return to band-theory results for FeSi: Incorporating Hubbard--like interactions via static mean-field LDA+ calculations, Anisimov et al. Anisimov et al. (1996) proposed that FeSi could be driven through a first-order transition to a ferromagnetic metal by applying a magnetic field of T. The field would induce a low-spin (paramagnetic insulator) to high-spin (ferromagnetic metal with a moment of /Fe) transition. They further argued that the anomalous behaviour of FeSi in the absence of any field could be propelled by the proximity (in total energy) to the critical end point, K, of that transition. This interpretation gives ab initio support to the early theory that FeSi is a nearly ferromagnetic system (see Refs. Takahashi and Moriya (1979); Evangelou and Edwards (1983) and Section (II.1) above). Subsequently, measurements in ultra-high fields (cf. the discussion in Section (I.2.2)) confirmed the existence of a discontinuous metamagnetic semiconductor-to-metal transition with T and KKudasov et al. (1998, 1999).
Allowing for spin-polarization, iron germanide, FeGe, is predicted to be a ferromagnetic metal with an ordered moment of within DFTYamada et al. (2003); Neef et al. (2009); Pulikkotil et al. (2012); Pedrazzini et al. (2007), DFT+UAnisimov et al. (2002), or hybrid functional methodsNeef et al. (2009), in congruence with experimentWäppling and Häggström (1968); Lundgren et al. (1968); Lebech et al. (1989). Also some of the observations of the substitutional series FeSi1-xGex (see Section (I.2.3) for details of experimental findings) are qualitatively captured within band-theory: Yamada et al. Yamada et al. (2003) found a transition from a non-magnetic-insulator to ferromagnetic-metal for in DFT. Using DFT supercell calculations, JarlborgPedrazzini et al. (2007) found ferromagnetism above , suggested to arise from a combination of an increased volume and substitutional disorder. Within LDA+, Anisimov et al. Anisimov et al. (2002) found a first order transition to a ferromagnetic metal at for a reasonable value of . These findings are in rough agreement with the experimental critical substitution Yeo et al. (2003).
If the dominant control parameter in the FeSi1-xGex series was the unit-cell volume, applying pressure to FeGe should suppress magnetism and drive the system insulating. Indeed, FeSi has a 12.5% smaller unit-cell than FeGe, which can roughly be reached at 25GPaWilhelm et al. (2007). In experimentPedrazzini et al. (2007) the Curie temperature is indeed suppressed at a critical pressure of GPa. However, even above this pressure a residual conductivity persists, so that it was suggested to arise from zero-point motionPedrazzini et al. (2007). Neglecting the latter effect, band theory finds a pressure-driven phase transition from a ferromagnetic-metal to a non-magnetic-insulator. The critical pressure varies however by a factor of at least four, depending on the functional used in DFT (LDA: GPa, PW91: GPa) Neef et al. (2009). Best agreement with experiment is found when optimising the crystal structure with GGA and use LDA for the electronic structure (GPa)Pulikkotil et al. (2012).
Also some aspects of the non-isoelectronic substitution series Fe1-xCoxSiBeille et al. (1983a); Shimizu et al. (1990) are qualitatively captured within band-theory. Using the virtual crystal approximation in DFT, Morozumi and YamadaMorozumi and Yamada (2007) found a transition to a half-metallic ferromagnet for finite dopings up to 50%. These results are consistent with the experimentally evidenced linear increase of the magnetic moment with up to 30%. Indeed, as was proven experimentally by Paschen et al. Paschen et al. (1999), the spontaneous moment in Fe1-xCoxSi does not originate from moments localized on the Co-dopants, but is of itinerant origin, and thus, in principle, amenable to band-theory via Stoner physics.
At higher dopings, the theoretical momentMorozumi and Yamada (2007) in Fe1-xCoxSi decreases less quickly than the experimental oneShimizu et al. (1990), probably for lack of treating the randomness of the alloy properly. Indeed, the theoretical magnetic structure is very sensitive to disorderPunkkinen et al. (2006), before the diamagnetic metallic state of the end member CoSi is reached.
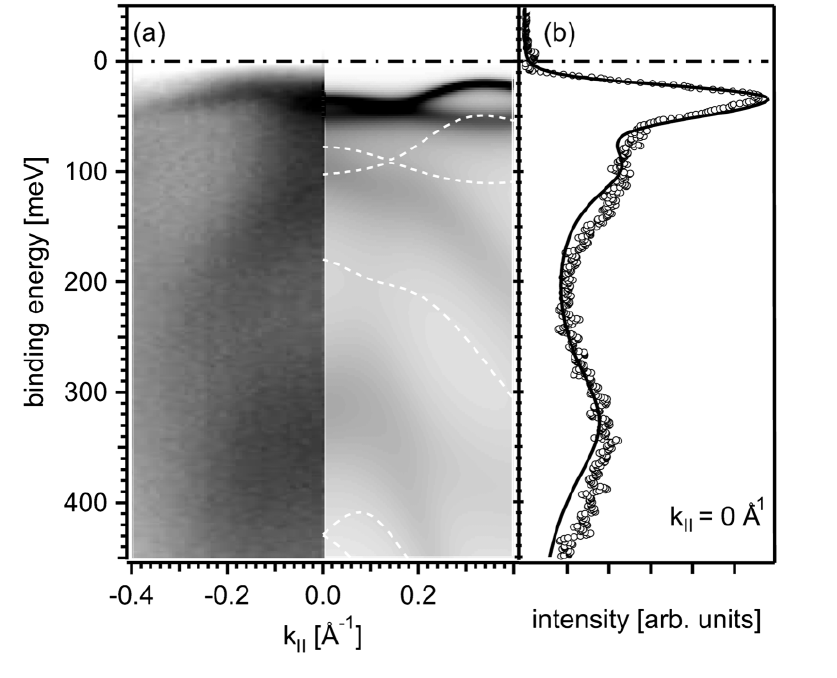
Finally, other band-structure intricacies of B20-compounds include the recent findings of Kübler et al. Kübler et al. (2013) of a non-vanishing electronic Berry phase in the insulating silicides FeSi, RuSi, and OsSi, corresponding to a crystalline chirality that heralds the possibility of realizing a macroscopic electric polarization in these systems.
In all, for the discussed properties, band-structure methods give very valuable information, as well as an often semi-quantitative description. We now turn to physical properties where this is not the case.
FeSi: failures of band-theory.
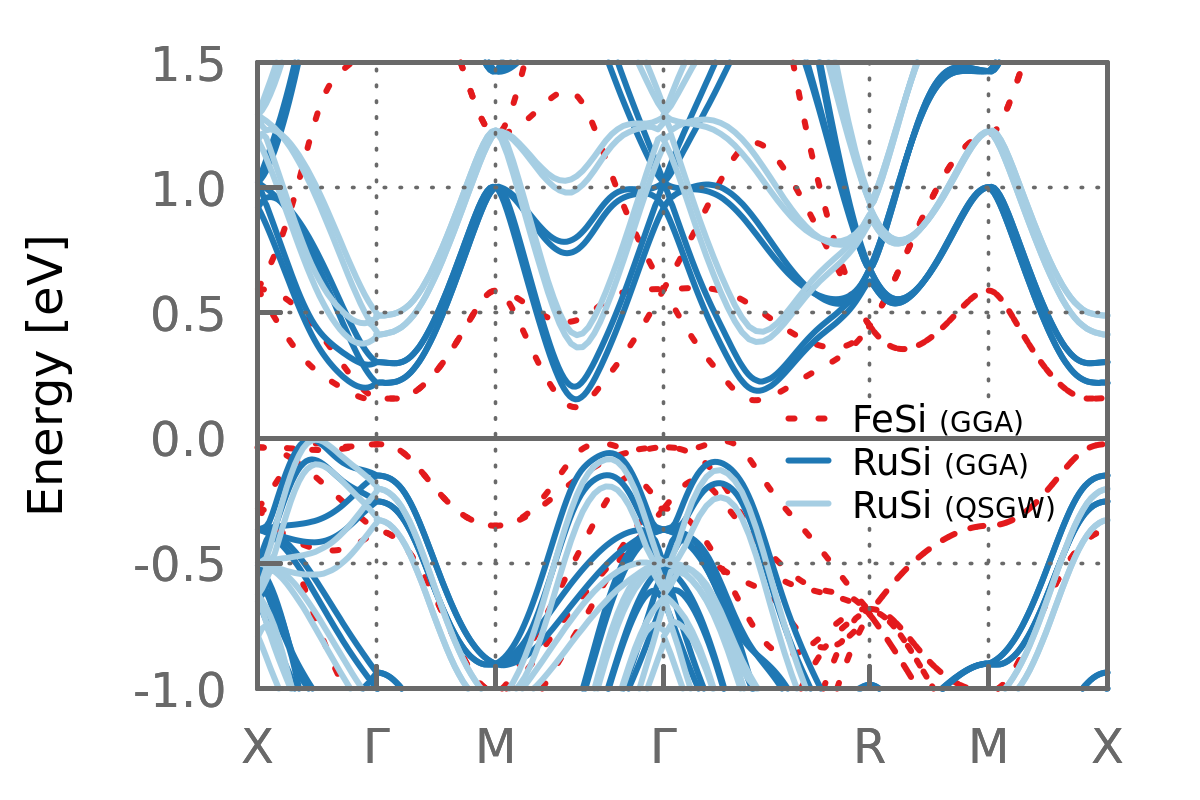
Standard band-structure methods work at zero temperature. Therefore, they cannot access the unusual spectral and magnetic behaviour of FeSi at finite temperatures. Yet, we can compare band-theory results to the experimental properties at low-temperatures.
Spectral properties.
While DFT-related methods in principle only produce an auxiliary Kohn-Sham spectrum, it has become common practice to compare the latter to the excitation spectrum of the solid. In the case of FeSi, the Kohn-Sham band-gap is notably overestimated, which is in stark contrast to the usual underestimation of band-gaps in conventional semiconductors. Indeed while activation law fits e.g., to the resistivity extract meV (see Fig. (4)(a,left)), DFT finds a value about twice as large: meVMattheiss and Hamann (1993); Fu et al. (1994); Jarlborg (1999); Mazurenko et al. (2010); Tomczak et al. (2013b).292929Nonetheless, DFT calculations give good estimates for the change of the gap with the unit-cell volume, , see Refs. Grechnev et al. (1994). Also note, that there is a non-negligible dependence of the charge gap on the exchange-correlation potential used, e.g., meV, congruent with the gap originating from hybridization effects, cf. below.
As will be discussed in the theory Section (II.4.1), the discrepancy between band-theory and experiment is rooted in dynamical electronic correlation effects that renormalize the excitation spectrum. On an empirical level, this physics can be particularly well illustrated on the basis of photoemissionSaitoh et al. (1995) and angle-resolved photoemission spectroscopy (ARPES)Park et al. (1995); Arita et al. (2008a); Klein et al. (2008, 2009) experiments. Comparing the photoemission intensity with band-structure results, see Fig. (12), one witnesses (i) a notable shrinking of the charge gap, and (ii) a narrowing of the bands near the Fermi level. This renormalization of bands has been analysed in terms of phenomenological self-energies Saitoh et al. (1995); Park et al. (1995); Arita et al. (2008a); Klein et al. (2008, 2009) that allow for a Brinkman-Rice-like bandwidth-narrowing but neglect orbital- and momentum dependencies. Performing a low-energy expansion, , of the self-energy form used by Klein et al. Klein et al. (2008) yields at K a substantially reduced quasi-particle weight and a scattering coefficient /eV. Despite the simplicity of the Ansatz, the resulting effective mass is quite close to the value found in realistic many-body approaches (discussed in Section (II.4.1)).
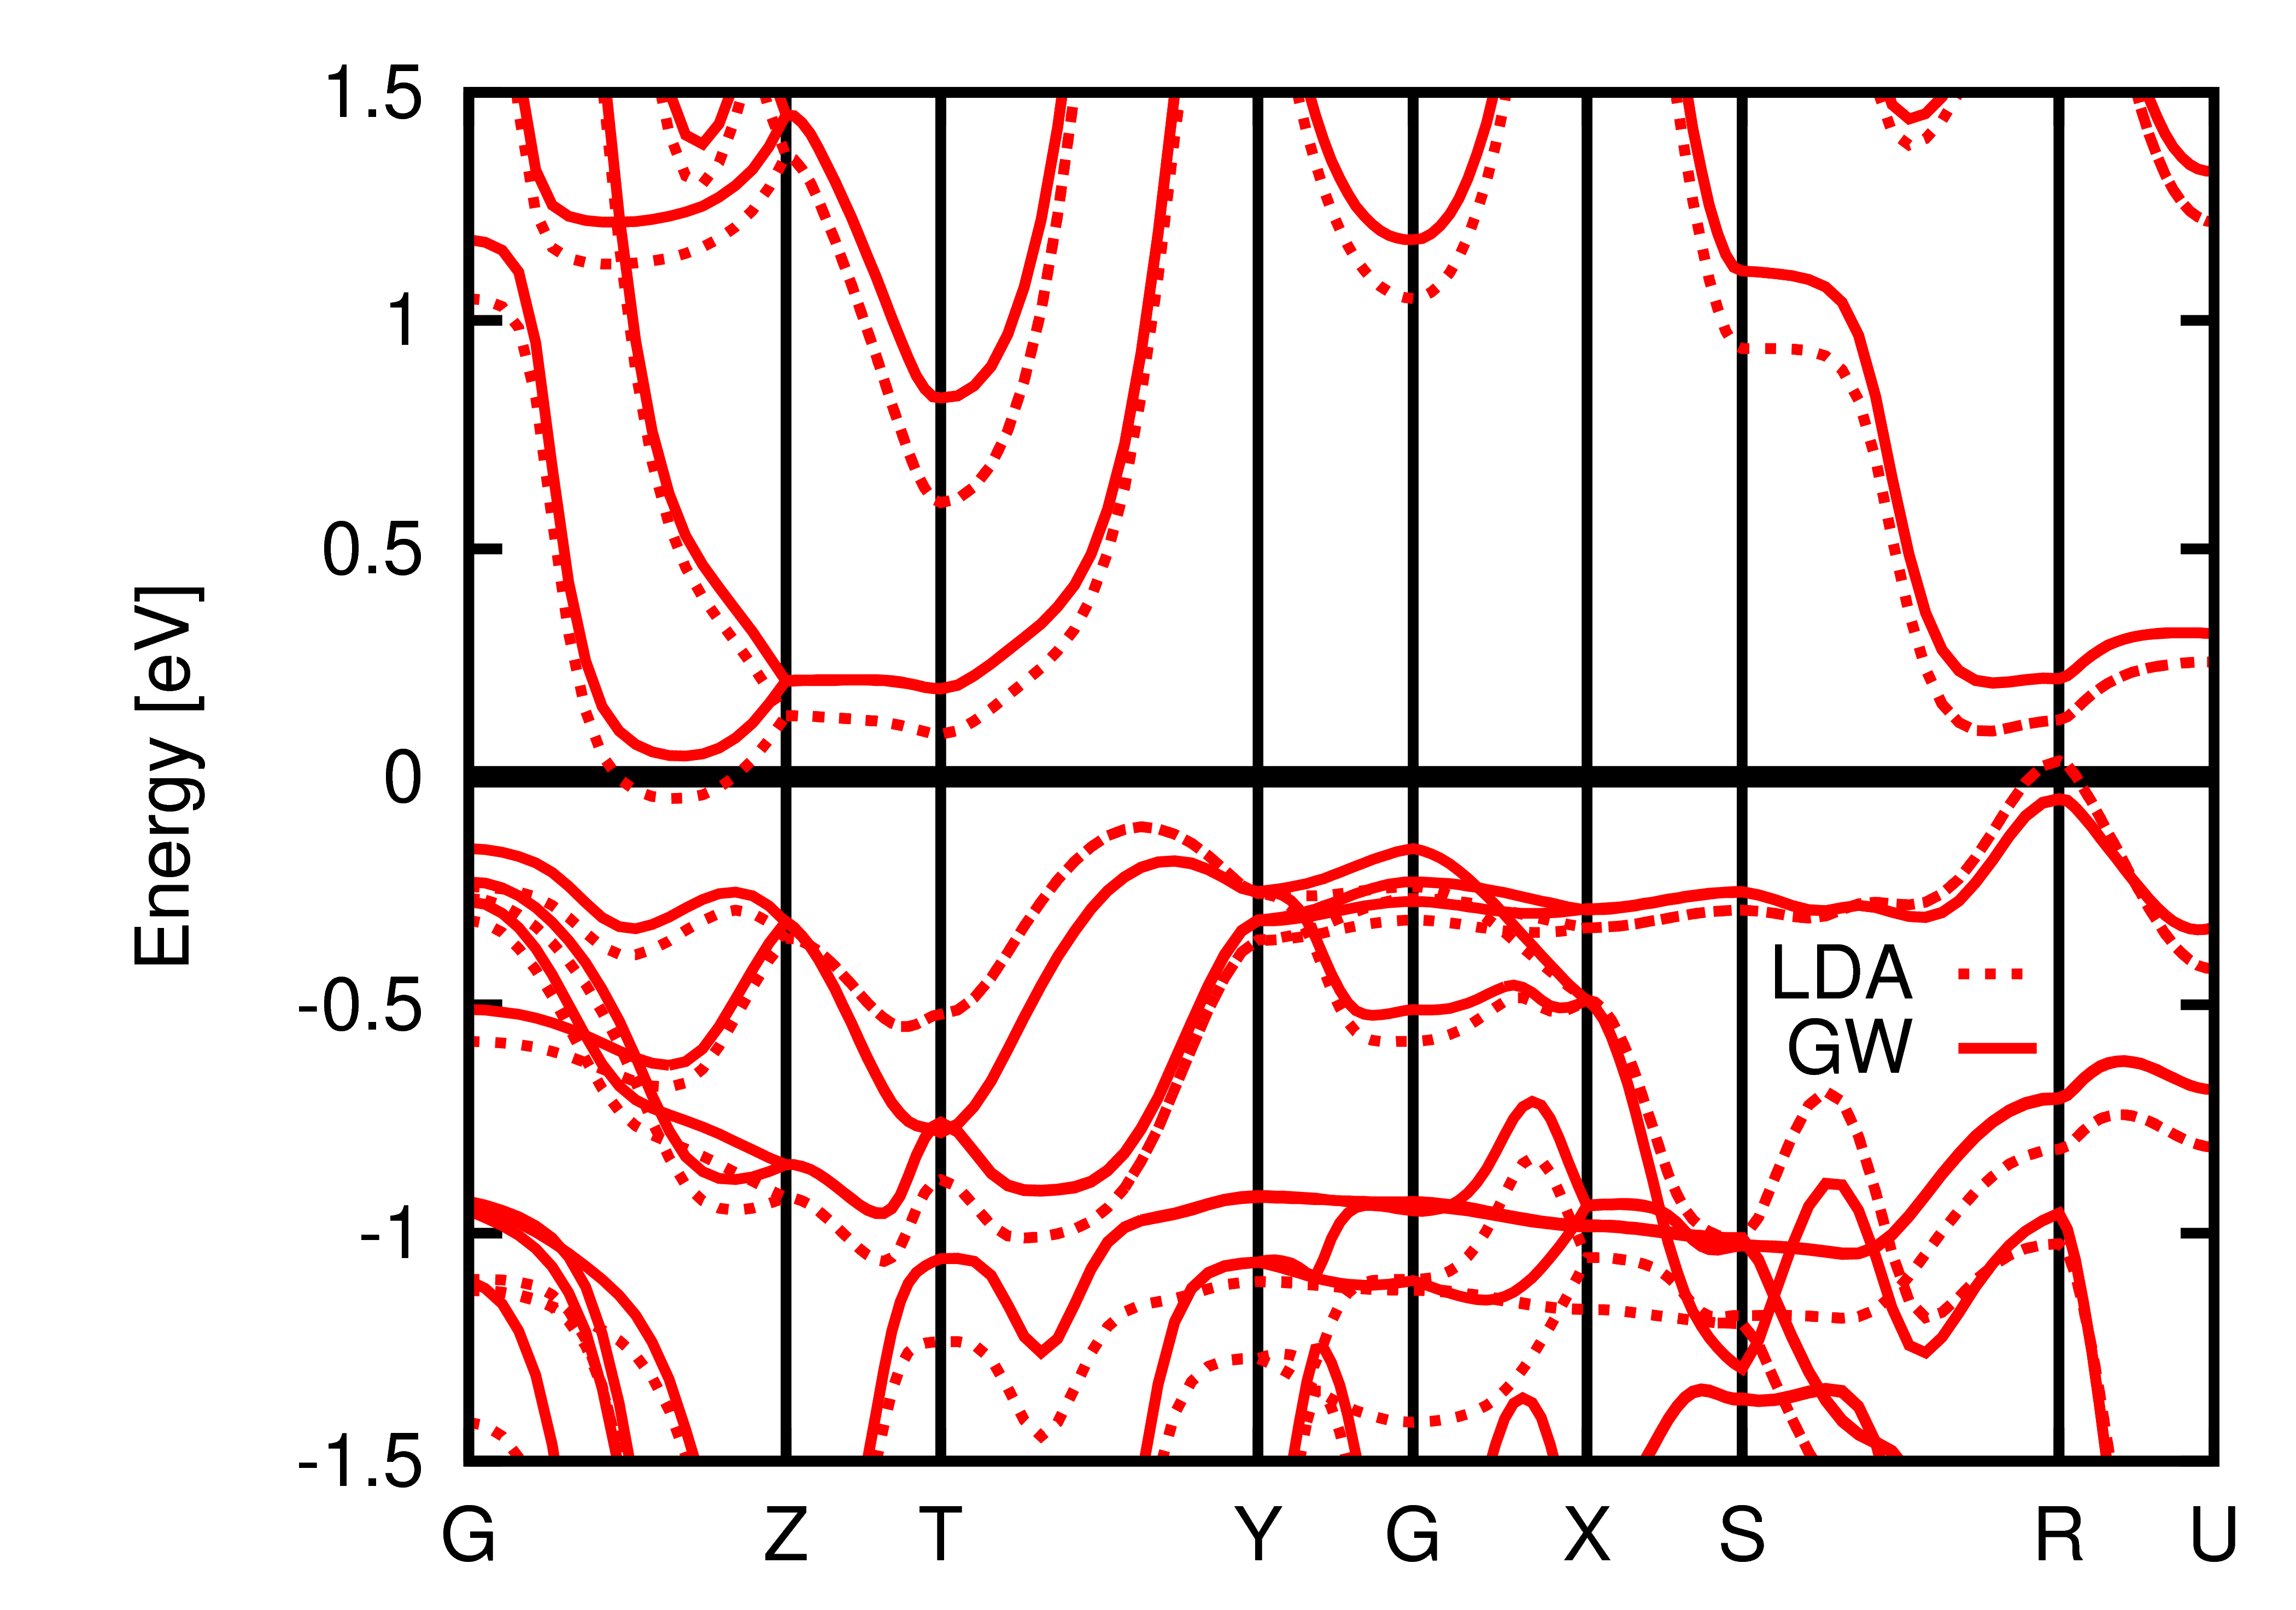
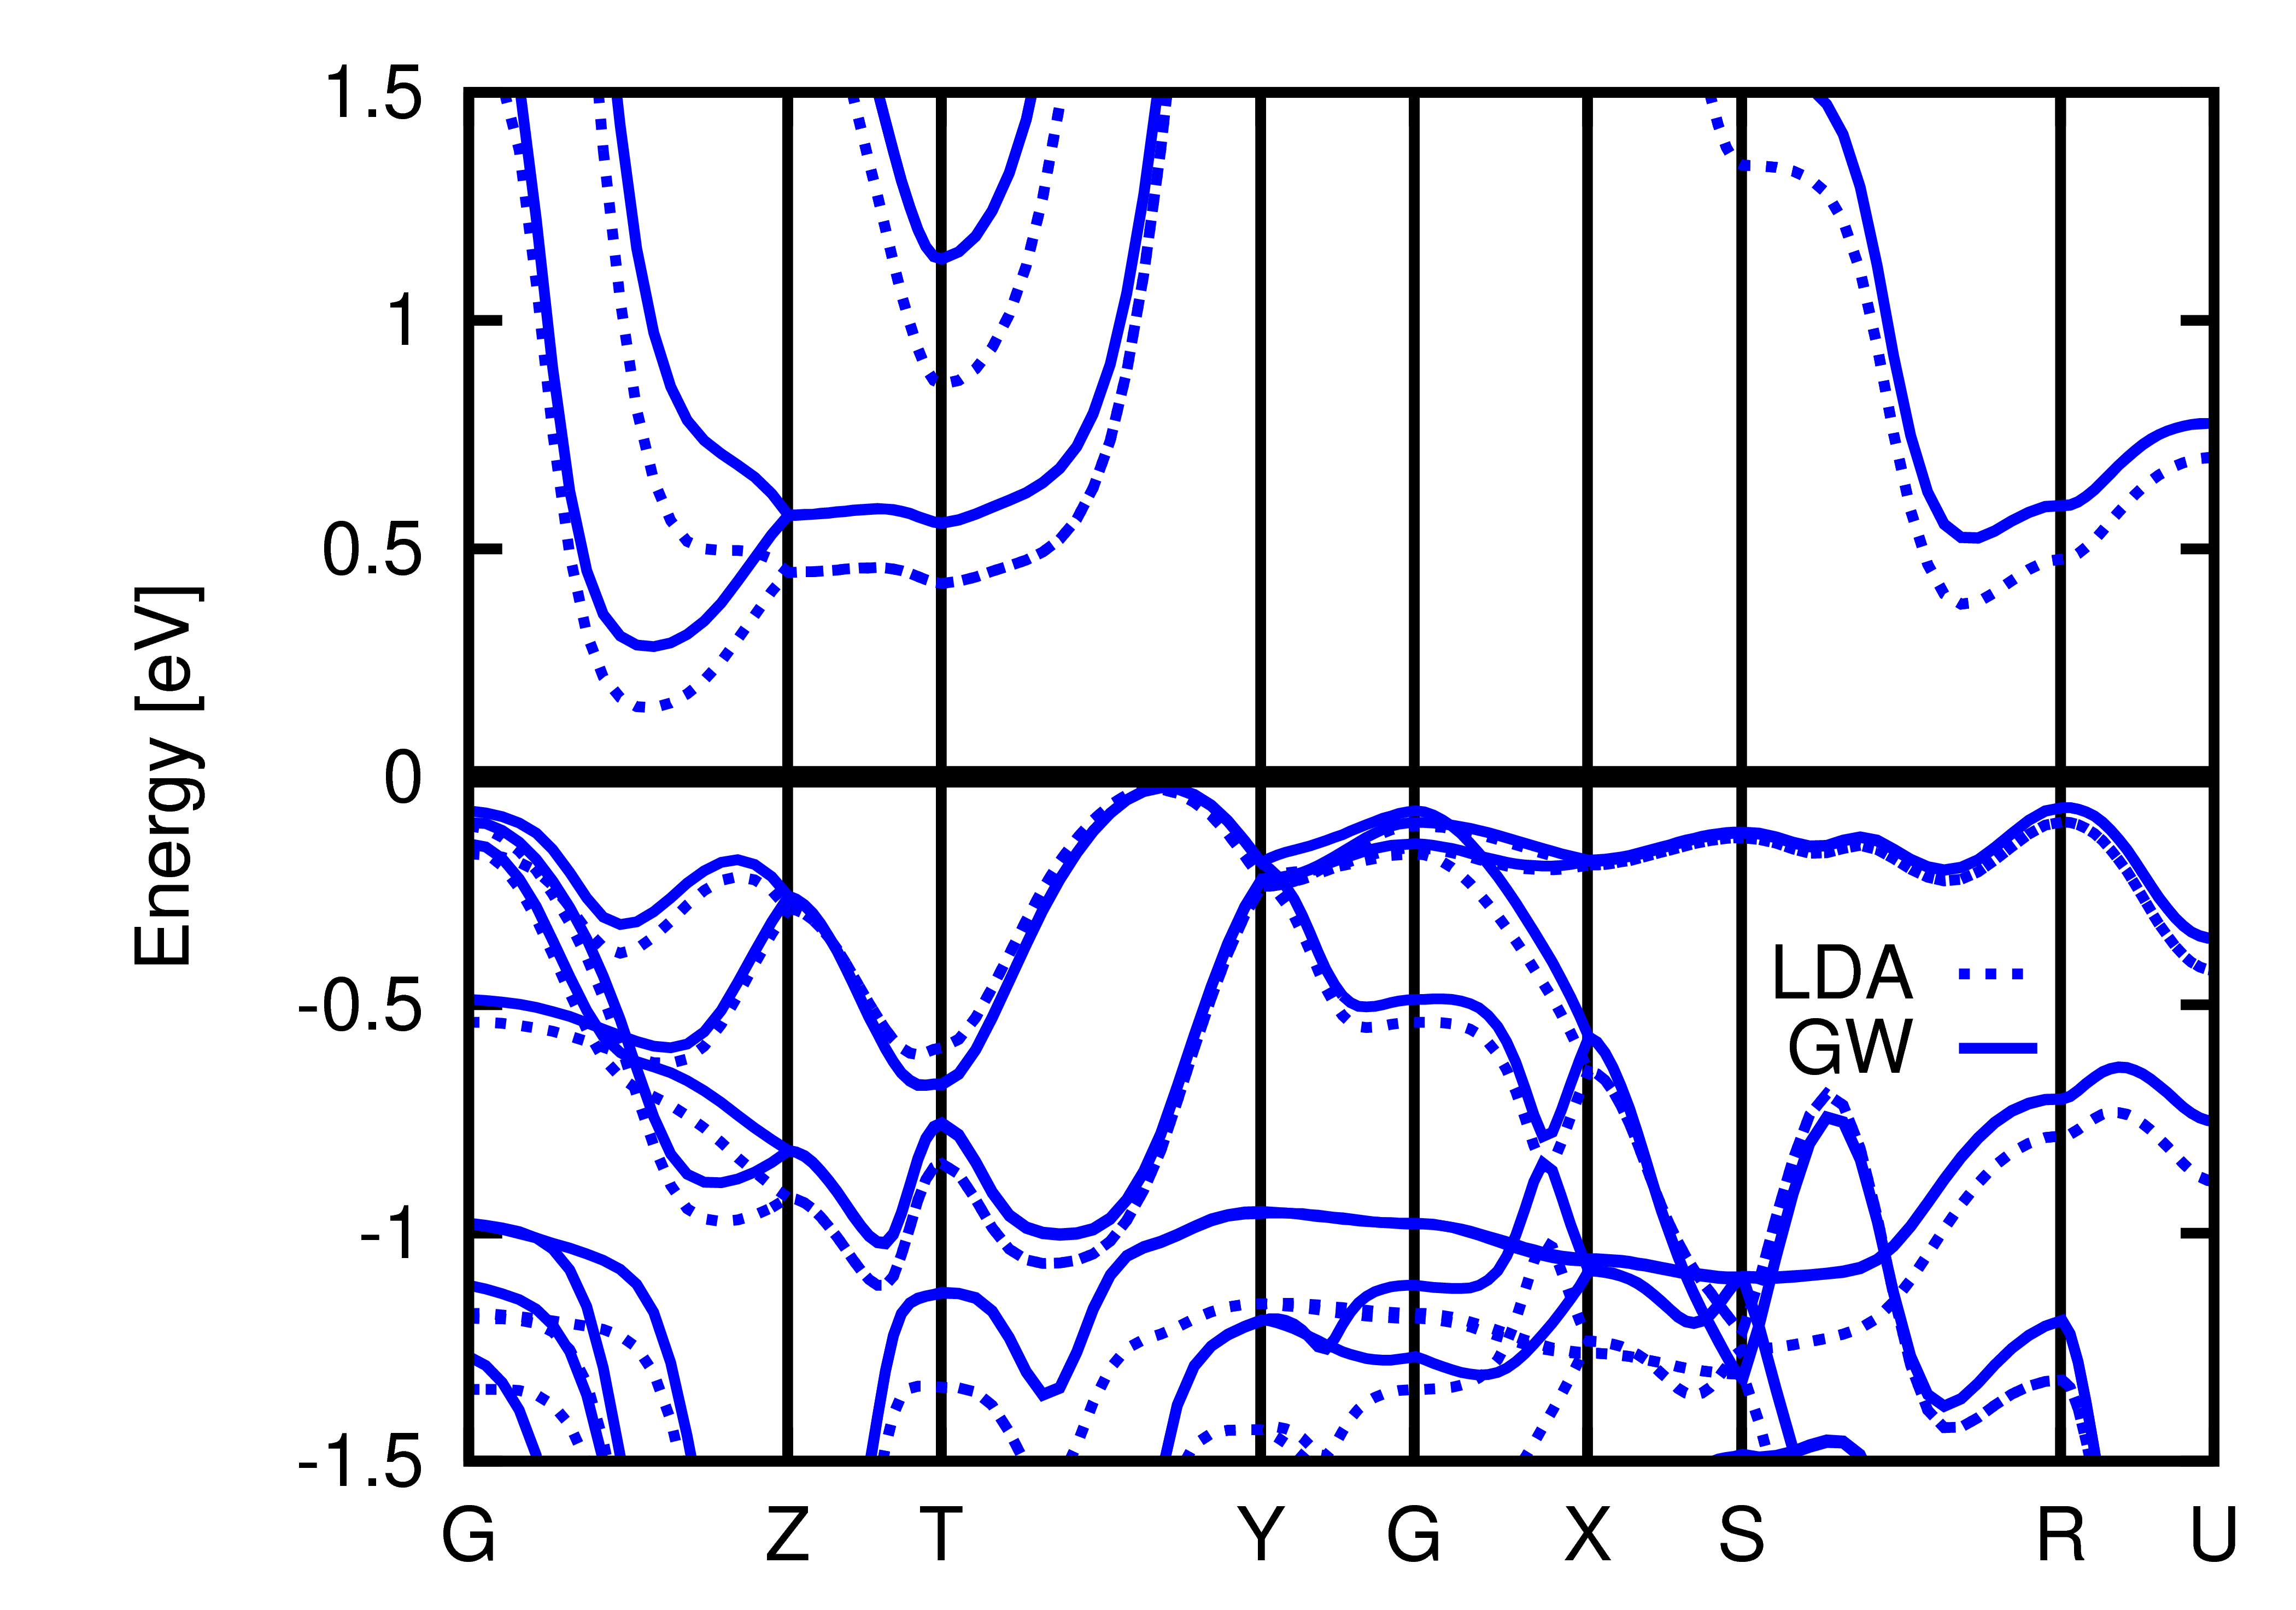
Ground-state properties.
Also in the true realm of DFT, ground-state properties, there are findings that are at odds with experiment, or are at least quite unusual: The equilibrium unit-cell volume of FeSi (experimentally: Å3Zinoveva et al. (1974); Vočadlo et al. (2002)) comes out slightly too small in DFT. While overbinding is expected for the LDA functional (Å3Moroni et al. (1999)), surprisingly also the typically underbinding GGA underestimates the volume (Å3Moroni et al. (1999), Å3Stern and Madsen (2016)). More dramatically are the discrepancies in the bulk modulus: While DFT yields values above 200GPa (LDA: GPa, GGA: GPaMoroni et al. (1999)), the experimental values scatter in the range GPaWood et al. (1995); Zinoveva et al. (1974); Wood et al. (1996); Guyot et al. (1997); Lin et al. (2003) with, however, a single outlier of 209GPaKnittle and Williams (1995). These findings may be interpreted as arising from electronic correlation effects that decrease participation of charges in the bonding. More electron-lattice properties will be discussed in Section (II.7).
The 4 homologue: RuSi.
The 4-analogue of FeSi, RuSi, is a semiconductor with a medium-sized gap of meV as inferred from resistivity measurementsBuschinger et al. (1997a); Hohl et al. (1998) and meV from optical spectroscopyBuschinger et al. (1997a); Vescoli et al. (1998). As mentioned in the introduction, there are no anomalies in the temperature dependence of spectroscopic or magnetic observables of RuSi.
It is plausible that the extended 4-orbitals of Ru make for a less correlated electronic structure that is, then, more amenable to band-theory. In fact, density functional theory yields a band-structure similar in shape to FeSi, see Fig. (13) for a comparison within GGA. Yet the dispersions are enhanced and a larger indirect gap is present: 230meVImai and Watanabe (2006); Zhao et al. (2009); Shaposhnikov et al. (2009); Tomczak et al. (2013b) without, 170meV with the inclusion of spin-orbit coupling. Thus, contrary to FeSi, the gap is smaller within band theory than in experiment, as is usually the case for uncorrelated semiconductors. The origin of the gap-underestimation is typically attributed to an insufficient treatment of the exchange partBecke (1993a) of the DFT exchange-correlation functional. An ab initio many-body approach that excels, among others, at describing band-gaps is Hedin’s GW methodHedin (1965); Aryasetiawan and Gunnarsson (1998); Onida et al. (2002). Here, we employ the so-called quasi-particle self-consistent variant QSGWFaleev et al. (2004) to RuSi303030In QSGW a hermitianized self-energy is fed back into the band-structure code. Here we use a full-potential linearized muffin-tin orbital (FPLMTO) methodMethfessel et al. (2000) so as to eliminate any dependence on the DFT starting point.. QSGW was shown to yield improved band-gapsvan Schilfgaarde et al. (2006), particularly for -semiconductors, while it overestimates gaps in some -electron systemsvan Schilfgaarde et al. (2006) (see also the discussion of FeSb2 and related materials below). As can be seen in Fig. (13), the screened exchange self-energy from the GW indeed widens the band-gap; we find a value of about 370meV, slightly above experimental values. We will discuss the thermopower of RuSi and the substitution series Fe1-xRuxSi in Section (III.2). Model calculations in Section (II.6) will be used to rationalize the different behaviours of FeSi and RuSi.
II.2.2 The marcasites: FeSb2, FeAs2 & Co.
The family of FeSb2Holseth and Kjekshus (1969, 1980); Fan et al. (1972), FeAs2Fan et al. (1972), FeP2Hulliger (1959); Boda et al. (1971) , CrSb2Holseth and Kjekshus (1980), their 4-analogues RuSb2Holseth and Kjekshus (1968), RuAs2Hulliger (1963), as well as their 5 osmium-based membersKjekshus et al. (1977) crystallize in the regular FeS2 marcasite structure (orthorhombic space group Pnnm) with two formula units per unit cell.
In this structure, the transition metal ions are surrounded by distorted pnictogen octahedra, that share corners along the -axis. According to ligand field theory, the transition metal 3-orbitals split into the lower and higher-lying orbitals. The existence of two different transition metal–pnictogen distances causes the to further split into a lower doublet and a higher single orbital . In the ionic picture, the transition metal would be in a low-spin configuration, with an empty orbitalGoodenough (1972); Petrovic et al. (2005). From this point of view, a (thermal) population of the orbital may cause the metallizationGoodenough (1972), as well as—via a spin-state transitionPetrovic et al. (2003, 2005)—the enhanced paramagnetism in FeSb2. As will be briefly discussed in Section (II.4.2), such a scenario was shown to be realized in LaCoO3.
Density functional theory.
Subsequent band-structure calculations by Madsen et al. Madsen et al. (2006), however, suggested a more covalent rather than ionic picture of bonding in the marcasites. Indeed a stabilization of those -orbitals pointing towards the ligands was evidenced, which in particular causes a lowering of the bands. As a consequence the transition metal configuration of all iron-, ruthenium-, and osmium-based marcasites from above is close to rather than (see also the discussion surrounding Fig. (25)).
In FeSb2 and RuSb2 the stabilization of the orbitals with respect to ligand field theory occurs to the extent that density functional theory in fact yields a metallic ground-state Madsen et al. (2006); Lukoyanov et al. (2006); Bentien et al. (2006); Tomczak et al. (2010a), with small electron pockets halfway between the and high symmetry points, and corresponding hole pockets at all corners, , of the orthorhombic Brillouin zone, see Fig. (14)(a) for FeSb2.
It is important to notice that these pockets are of different orbital charactersLukoyanov et al. (2006); Madsen et al. (2006) (cf. also the discussion for FeSi): In the global coordinate system, the electron pocket is dominantly of and the hole of characterLukoyanov et al. (2006)313131In a local coordinate system in which the local projection of the -block of the Hamiltonian is as diagonal as possible (see Ref. Tomczak et al. (2010a) for details), the electron pocket is mainly of character, and the hole pocket is formed by the now degenerate and orbitals..
| [eV-1] | FeSb2 | FeAs2 |
|---|---|---|
| 0.15 | 0.08 | |
| 0.02-0.05 | 0.02-0.03 |
With FeSb2 and RuSb2 being insulators at low temperatures, band-structure methods fail qualitatively to give the correct ground-state spectrum (contrary to the case of FeSi). This shortcoming notwithstanding, conventional band-theory does reproduce some experimental findings for iron antimonide even on a quantitative level: The unit-cell volume and bulk-modulus Petrovic et al. (2005) are indeed well capturedWu et al. (2009).
It is instructive to further compare FeSb2 to its isostructural, isoelectronic relatives FeAs2 and FeP2. The LDA band-structure of the former is shown in Fig. (14)(b), for the latter compound, see Refs. Wu et al. (2009); Brahmia et al. (2013). With respect to FeSb2, the chemical pressure of the larger As atoms is almost isotropic, and the ratio remains virtually constant323232We use Å, Å, ÅFan et al. (1972); as a function of external pressure, the ratio slightly decreasesPetrovic et al. (2005).. Consequently, the bands of FeAs2 are similar to those of FeSb2, albeit a finite gap opens at the Fermi level. We find meV within LDA and meV in GGATomczak et al. (2010a), only slightly larger than the experimental 200-220meVFan et al. (1972); Sun et al. (2009a). Below, we will discuss why—in moderately correlated materials—such good agreement for band-gaps is often fortuitous. First, however, we will review works in which methodologies beyond DFT were employed to yield an insulating ground-state for FeSb2.
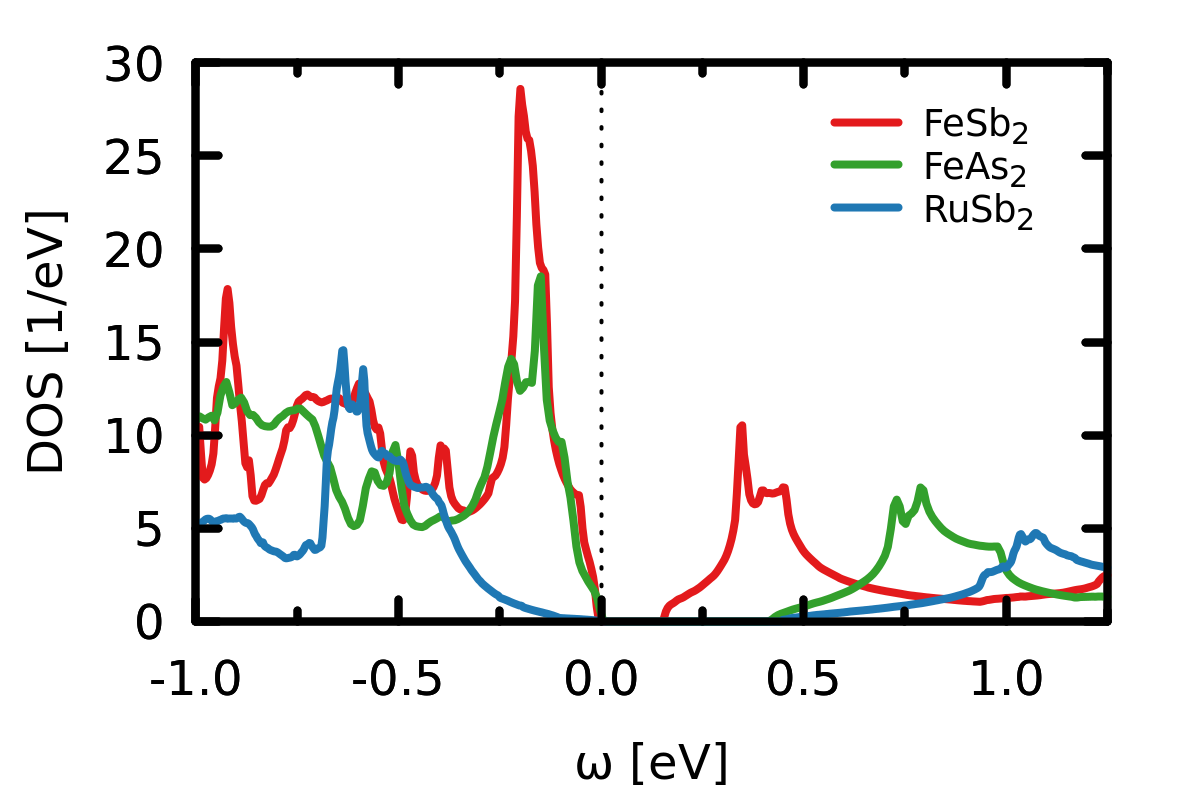
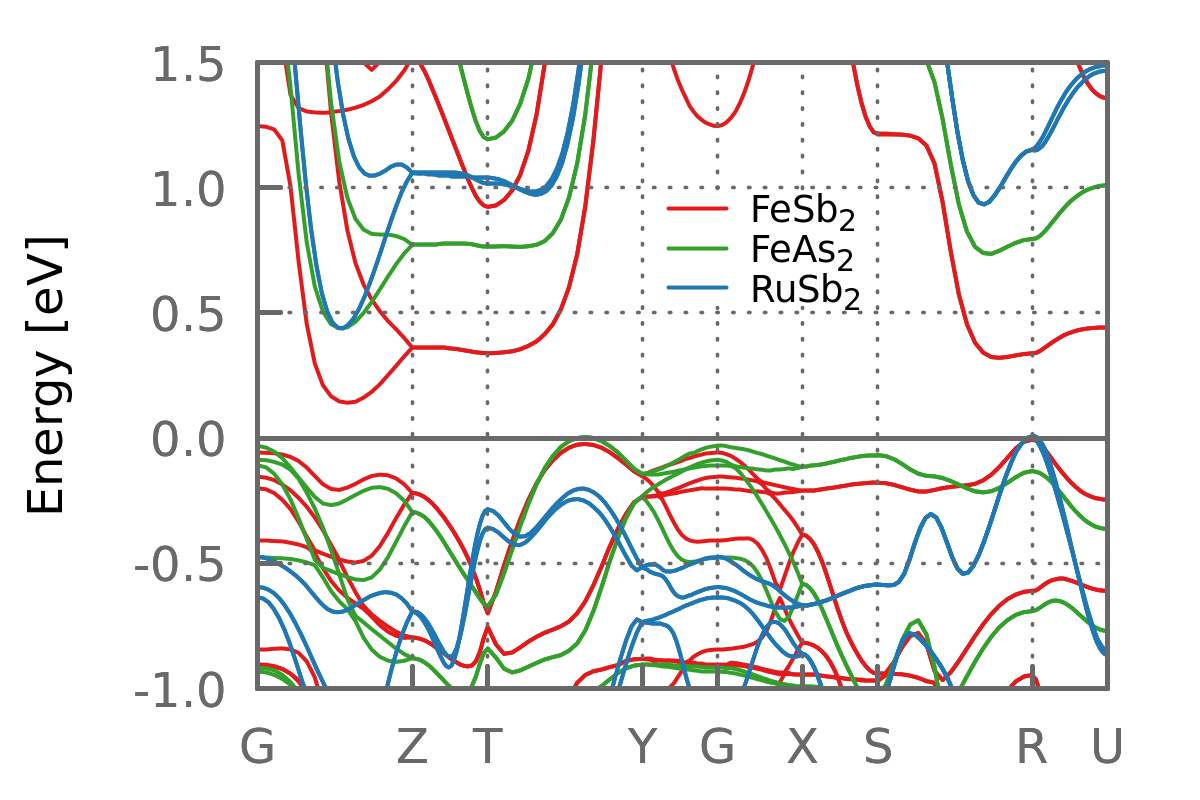
DFT+U.
Lukoyanov et al. applied the static mean-field LDA+U scheme to FeSb2 and found strong similarities to FeSi. In particular, they found the paramagnetic state to be stable up to a critical eV above which ferromagnetism with an ordered moment of 1 becomes energetically favourable. In analogy to claims on FeSiAnisimov et al. (1996), these findings may suggest that FeSb2 is a nearly ferromagnetic semiconductor whose properties are strongly influenced by the proximity to a critical end point of a magnetic transition. Weak ferromagnetism was indeed subsequently found experimentally under doping in Fe1-xCoxSb2Hu et al. (2007b, 2006).
Hybrid functional methods.
That band-gaps are underestimated in DFT methods is owing to an insufficient treatment of exchange effects. One way to improve upon this, is to include fractions of exact exchange via so-called hybrid functionalsBecke (1993b). Using the B3PW91 functionalBecke (1993a) for the -orbitals of the iron atoms, a paramagnetic solution with a much too large gap of 600meV (900meV) was found for FeSb2 (FeAs2)Tomczak et al. (2010a). See also Fig. (45) that shows the electronic structure of FeSb2 in the presence of an antisite defect, using the modified Becke-Johnson exchange potentialTran and Blaha (2009).
GW approximation.
To put the latter findings as well as dynamical effects of electronic correlations into context, Hedin’s (non-self-consistent) GW approximation Hedin (1965) was applied to FeSb2 and FeAs2Tomczak et al. (2010a). The resulting one-particle dispersions—computed from the GW self-energy via with —are shown in Fig. (14) in comparison to LDA results: In FeSb2 a small gap opens, in agreement with experiment, while GW mildly increases the gap in FeAs2, slightly deteriorating the congruence with experiment.
To analyse the GW band-structures, we note that, quite generally, there are two competing effectsTomczak et al. (2012b) in electronic structures beyond DFT: (i) the inclusion of exchange contributions to the self-energy widens gaps and bandwidthsHedin (1965); Becke (1993a), and (ii) dynamical renormalizations, that (to linear order) give rise to the quasi-particle weight , reduce gaps and band-widthsKuneš and Anisimov (2008); Sentef et al. (2009).
When applying GW to FeSb2 the competition of both effects is noticeable: While occupied bands are visibly narrowed and renormalized towards the Fermi level, unoccupied states are moved up in energy, resulting in the opening of a gap. Turning off dynamical renormalizations, i.e., setting the quasi-particle weight to unity , yields a larger gap of about 200meV. From this observation, one can learn two things: (i) the ab initio screened exchange (SEX) included in the GW approach yields a smaller gap-enhancement than the ad hoc admixtures of bare exchange in hybrid functional approaches; (ii) effects of dynamical renormalizations substantially shrink the band-gapKuneš and Anisimov (2008); Sentef et al. (2009) with respect to a (screened) Hartree-Fock-like reference. Within GW, values of () are found for FeSb2 (FeAs)Tomczak et al. (2010a). For the case of FeAs2 one could thus claim that, LDA finds a good value for the indirect gap merely because of an error cancellation, namely the joint neglecting of both exchange and dynamical correlations.
Concomitant with the linear slope of the real-part giving rise to , also the imaginary part of the self-energy is Fermi-liquid-like, i.e., quadratic in frequency. Interestingly, however, the scattering rate is notably asymmetric with respect to the Fermi level, see table (2).
| FeSb2 | FeAs2 | RuSb2 | |
| [meV] | 30 | 200-220 | 290-330 |
| [meV] | – | 220 | – |
| [meV] | 150 | 430 | 430 |
| [eV] | 3.9 | 3.4 | 2.6 |
| [eV] | 0.63 | 0.63 | 0.44 |
QSGW and cRPA.
For a more in-depth comparison of FeSb2, FeAs2, and RuSb2 we performed new QSGWFaleev et al. (2004) and cRPAAryasetiawan et al. (2004) calculations. The QSGW DOS and band-structures are shown in Fig. (15)(a) and (b), respectively, while Table (3) summarizes key results. There, we also include estimates for the values of the Hubbard and Hund’s interactions (see caption for computational details).
In all marcasites studied here, the self-consistency increases the gap with respect to the above one-shot GW calculations. In FeSb2 reaches 150meV—a value five-times as large as in experiment. Also in the case of FeAs2, the gap is significantly overestimated, while QSGW yields a more reasonably sized gap for RuSb2.
The tendency to overestimate band-gaps (see also the case of RuSi above) is rooted in two deficiencies: (i) insufficient screening of the Coulomb interaction within RPAvan Schilfgaarde et al. (2006); Shishkin et al. (2007) (e.g., neglecting particle-hole correlations), (ii) an underestimation of dynamical self-energy effects in the perturbative (first order) GW approximation. Both problems can be addressed by combining GW with dynamical-mean field theory (DMFT)Georges et al. (1996); Kotliar and Vollhardt (2004) in so-called GW+DMFTBiermann et al. (2003) methods (see Refs. Biermann (2014); Werner and Casula (2016); Tomczak et al. (2017) for recent reviews, and Ref. Tomczak (2015); Choi et al. (2016) for the QSGW+DMFT variant).
These sources of error notwithstanding, we can still analyse the trends in our results and speculate about the reasons why these three materials behave very differently in experiment (see Fig. (1) and Fig. (2) for the resistivities and magnetic susceptibilities, respectively). To do so, we further compute interaction matrix elements within cRPA, see table (3). Our estimates for the Hubbard and Hund’s are quite similar for FeSb2 and FeAs2, while significantly smaller for RuSb2.333333The bare (i.e., unscreened) interaction is slightly larger in the arsenide than the antimonideTomczak et al. (2010a), in line with trends of the Coulomb interaction under external pressureTomczak et al. (2009); Tomczak et al. (2010b). Indeed the ionic radius of As is larger than Sb and causes chemical pressure. The slightly smaller value of for FeAs2, on the other hand, is mostly owing to using the same energy window for which screening is eliminated. Since the band-width of FeAs2 is larger than that of FeSb2 there are more excitations outside that window and contribute to the screening. In RuSb2 the dominant change with respect to the iron compounds is the larger extend of the 4-orbitals, resulting in smaller interaction matrix elements. From the point of view of the charge gap, however, FeAs2 and RuSb2 can be loosely grouped together, while FeSb2 is the odd one out.
Therefore it can be speculated that the difference in physics between FeSb2 and FeAs2 is mainly controlled by the different sizes of the gaps. This is congruent with the observation that observables, such as the resistivity and the magnetic susceptibility, are akin in shape, albeit their characteristic temperature scales differ by the ratio of the respective gaps, . In this scenario one would expect that the activated behaviour of the magnetic susceptibility of FeAs2Sun et al. (2009a) crosses over to a Curie-Weiss-like decay at K—which is, however above the melting point of the material.
The susceptibility of RuSb2, on the other hand, does not exhibit any signs of activated behaviourSun et al. (2009a) (see Fig. (2)), despite having a gap comparable in size to that of FeAs2. Here the difference lies in the vastly disparate interactions. Given the propensity for ferromagnetic order in these systems, one can surmise that the dominant control parameter of spin-fluctuations is the Hund’s rule coupling . Since the latter is smaller by one third in ruthenium antimonide, the prefactor of the activated behaviour is expected to be significantly smaller. Model calculations presented in Section (II.6) substantiate these claims (see also Section (II.4.2) for the influence of the onto the mass enhancement of FeSi).
II.2.3 The Kondo insulator Ce3Bi4Pt3.
The treatment of 4-states in effective one-particle theories such as density functional theory is very poor: strongly localized states contribute too much to the bonding as their hybridization with valence and conduction electrons is largely overestimated. Moreover, interaction-driven multiplet effects are completely neglected. Nonetheless, even for Ce3Bi4Pt3, we can gain some interesting qualitative insights from band theory.
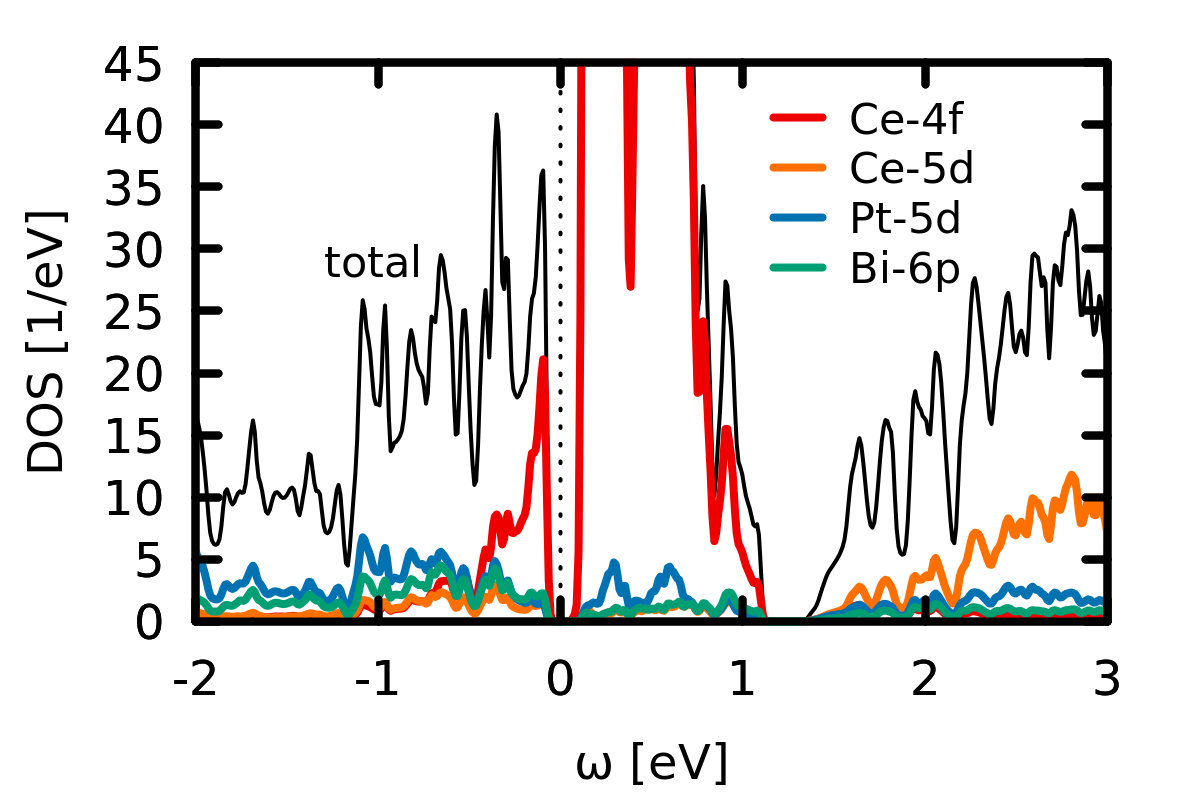
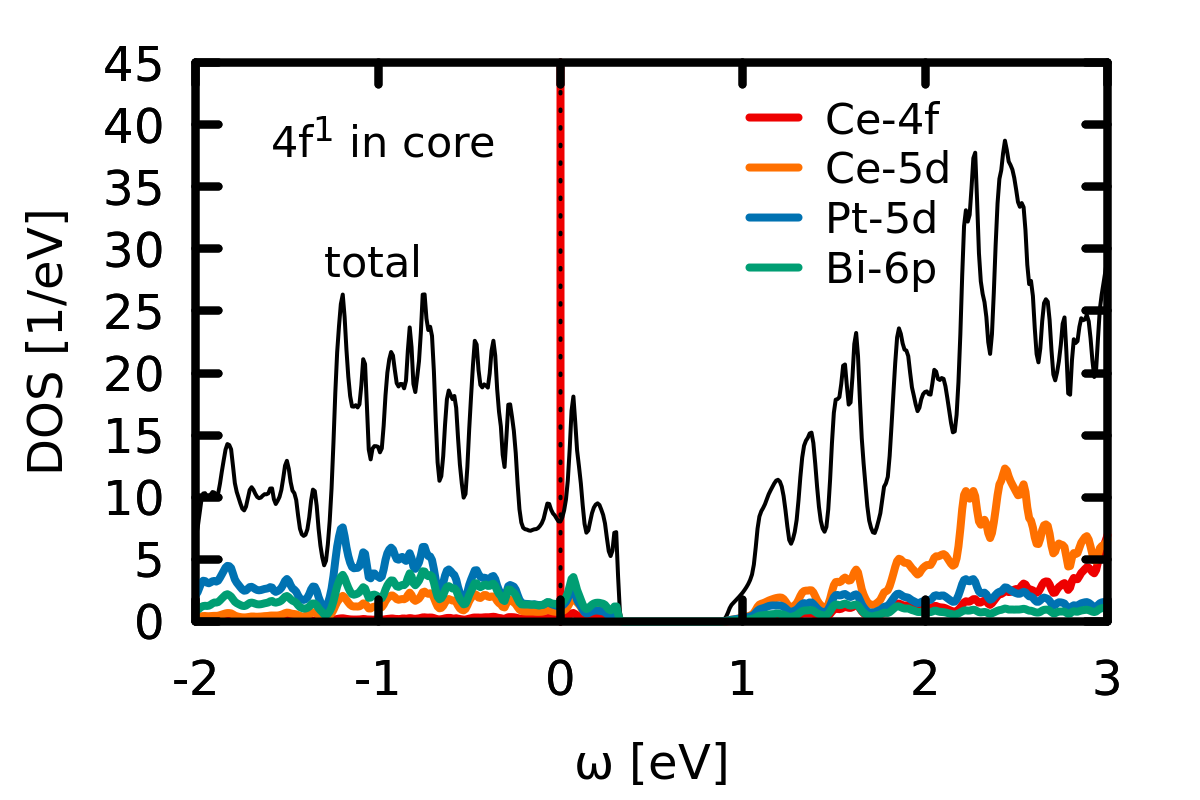
Ce3Bi4Pt3 is a cubic intermetallic that crystallizes in the body-centred Y3Sb4Au3 structureDwight (1977) with non-symmorphic space-group I-43d, two formula units per unit-cell of lattice constant ÅHundley et al. (1990); Kwei et al. (1992). Ce atoms sit in the Wyckoff position 12a (, 0, ), Pt occupies site 12b (, 0, ), and Bi is located at (,,). Since no value for has been reported in the literature, we follow Ref. Takegahara et al. (1993) and use the ideal position, .
Density functional calculations for this compound were pioneered by Takegahara et al. Takegahara et al. (1993) within the local density approximation. This work established that Ce3Bi4Pt3 has an insulating ground-state within band theory. In the data shown here, we employed the generalized gradient approximation (GGA) with the PBE functional, and include (unless otherwise specified) spin-orbit coupling for all atoms within the wien2kBlaha et al. (2001) implementation.
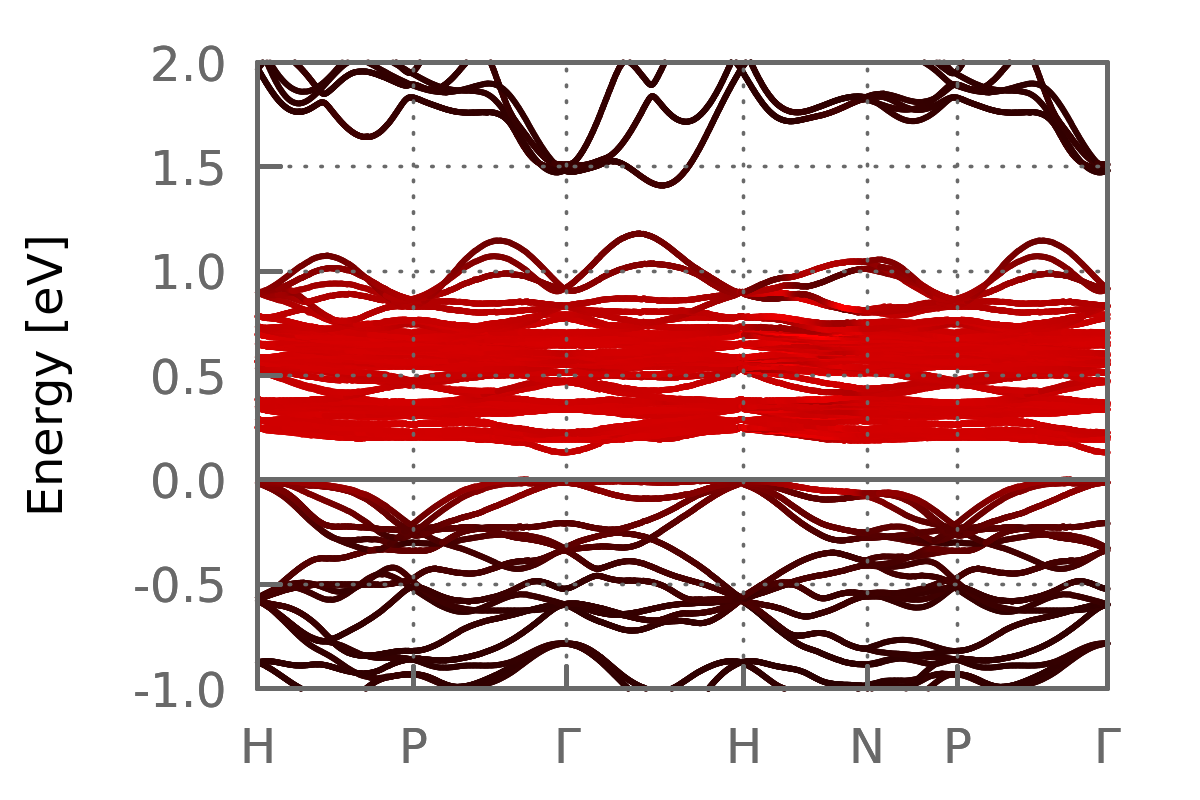
As seen from the density of states in Fig. (16) and the band-structure in Fig. (17), Ce3Bi4Pt3 is insulating within DFT, with a weakly indirect gap: We find meV, meV.343434the gap within LDA is slightly smaller, we find meV, while legacy calculationsTakegahara et al. (1993) gave only 30meV. On the conduction state side the gap is delimited by a single, rather dispersive band that dips down through the bulk of unoccupied -states around the -point (see also Fig. (18)(b)). Among the valence states, there is roughly one charge carrier of -character per Ce-atom. As will be illustrated below, in a purely atomic scenario the 4 configuration would lead to a half-filled level, and thus a metallic band-structure. Hybridizations with other orbitals—most notably the Pt- and Bi- (see Fig. (16)(a))—lead to the formation of dispersive bonding/anti-bonding states, separated by a hybridization gap. The total number of valence electrons in Ce3Bi4Pt3 is even and thus allows for an insulating solution. Indeed, the valence -electrons of Ce then reside in the bonding bands filling them completely, causing the chemical potential to fall inside the gap. As an illustration, we performed a calculation in which the 4 configuration of each Ce-atom was moved from the valence into the core sector, i.e., it was treated as completely localized. As a consequence, the total number of electrons treated as valence states becomes odd, and the system is necessarily metallic, as shown in Fig. (16)(b). The situation is thus qualitatively akin to the generic case of the periodic Anderson model (PAM, see Section (II.6)) with the - hybridization being finite (Ce3Bi4Pt3 Fig. (16)(a)) and zero ( in core, Fig. (16)(b)), respectively. Our and previousTakegahara et al. (1993) DFT results can be interpreted as providing the bare, i.e., non-interacting, dispersions of the materials. Including many-body renormalizations, e.g., via dynamical mean-field theory in DFT+DMFTKotliar et al. (2006), strongly decreases the hybridization and thus the gap by virtue of dynamical self-energy effects (see Fig. (24) in Section (II.4.3) for the DFT+DMFT spectral function of Ce3Bi4Pt3).
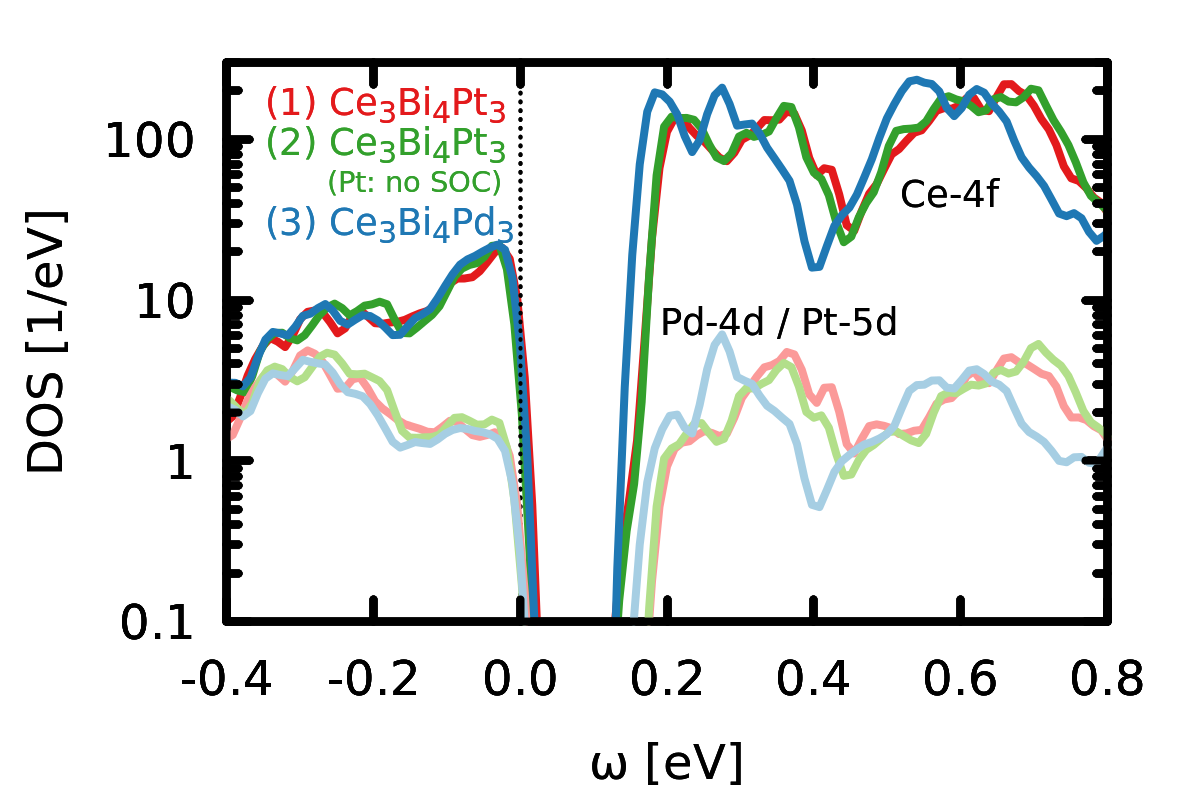
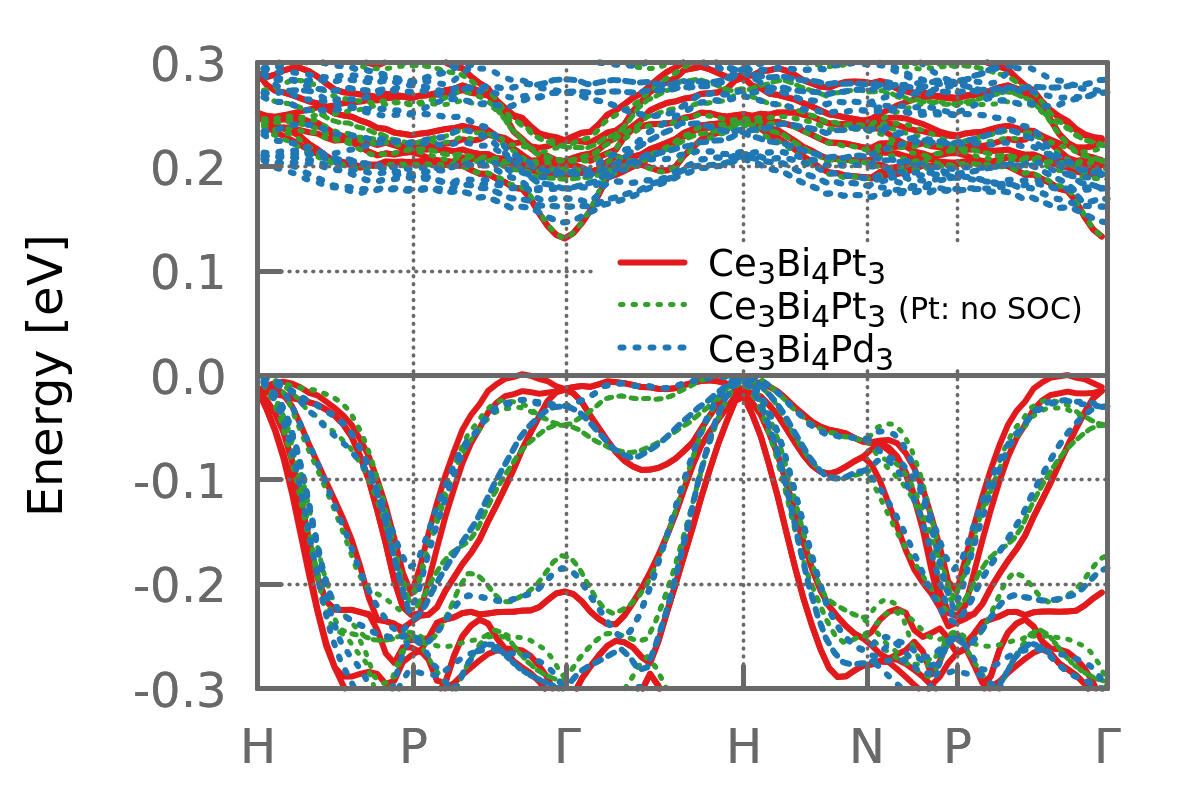
Remaining on the level of DFT, we can comment on the recent study of Dzsaber et al. Dzsaber et al. (2017) who advocate the importance of the spin-orbit coupling (SOC) for the stabilization of Kondo insulating behaviour in Ce3Bi4Pt3 (see also Section (I.2.4)). Tracking the physical properties along the isoelectronic, isostructural, and isovolume substitution series, Ce3Bi4(Pt1-xPdx)3, a Kondo insulator to Kondo semi-metal transition was evidencedDzsaber et al. (2017). It was argued that the consequence of replacing Pt with Pd is a change in the strength of the noble-metal spin-orbit coupling. Hence the latter was identified as a control parameter to destabilize Kondo insulating behaviour.
To investigate this from the band-structure perspective, we show in Fig. (18)(a) the DOS of (1) Ce3Bi4Pt3, (2) fictitious Ce3Bi4Pt3 where the spin-orbit coupling of the Pt atoms is turned off, and (3) the fully substituted compound (): Ce3Bi4Pd3. These calculations allow to disentangle the two major changes when substituting Pd for Pt: (i) the change in mass of the noble metal ion (which controls the strength of the spin-orbit coupling), and (ii) the change in the radial character in the isoelectronic substitution (4 vs. 5 electrons of Pd and Pt, respectively).
We find that (i) spin-orbit coupling of platinum affects the valence bands: When turning off the SOC for Pt, the gap becomes strongly indirect, as the valence band maximum moves from near the -point to the -point. As far as the valence states are concerned the electronic structure of this fictitious Ce3Bi4Pt3 indeed strongly resembles that of Ce3Bi4Pd3. These considerations identify the spin-orbit coupling as the major control parameter for valence states along the Ce3Bi4(Pt1-xPdx)3 series. Moreover, we find the (bare) hybridization gap—that is the one-particle ingredient to the Kondo coupling—to be insensitive to the spin-orbit coupling of Pt.
For conduction electrons the spin-orbit coupling of Pt plays, however, no appreciable role: The dispersions in Fig. (18)(b) are virtually the same with or without SOC on Pt. The conduction bands are however significantly modified by (ii) the change in the radial character of the noble-metal -orbitals ( for Pt, for Pd): In fact, the charge gap of Ce3Bi4Pd3, meV, is larger than for Ce3Bi4Pt3 (with or without SOC, cf. Fig. (18)(b)). Yet, the hybridization gap as seen in the DOS, Fig. (18)(a), is dominated by the flat 4-derived bands at around 200meV. These states move down for growing along the substitution series, engulfing the dispersive band that forms the conduction band minimum in Ce3Bi4Pt3. As a consequence, the edge feature in the DOS—that is dominated by the Ce-4 and Pt-/Pd-—is displaced towards the Fermi level; the gap as apparent in the DOS shrinks, while the actual gap value increases. The relative stabilization of the noble-metal states is mirrored also in their filling: Within atomic spheres of the same radius (2.5Å), Pt in Ce3Bi4Pt3 harbours 7.6 -electrons, while in Ce3Bi4Pd3 there are in fact 8.2. Thus, for conduction states the relevant change along the substitution series is the radial character of the noble metal orbitals.
In all, these band-structure considerations suggest that, the bare (i.e., unrenormalized) electronic structure in the substitution series Ce3Bi4(Pt1-xPdx)3 is not only controlled by the spin-orbit coupling but also by the radial character of ligand orbitals. As far as the - hybridization is concerned, the effect of the latter is in fact dominating and, as a consequence, the Kondo coupling is not constant along the series. Future many-body studies for this system therefore need to go beyond model calculations and include the interplay of both these realistic ingredients. For realistic many-body calculations for stoichiometric Ce3Bi4Pt3, see Section (II.4.3).
II.3 Many-body models
The above band-structures account for the structural and multi-orbital complexity of the materials under consideration. From them, one can constructAryasetiawan et al. (2004, 2009); Miyake et al. (2009)—or at least take inspiration for—reductionist many-body models that are to be solved with more sophisticated techniques, allowing for a more proper treatment of electronic correlation effects and finite temperatures.
The models that have hitherto been used to describe correlation effects in FeSi can be grouped into two classes: Those based on the periodic Anderson model (PAM), and those related to Hubbard models.353535We shall not discuss the Kondo lattice model that is often invoked for heavy-fermion intermetallics, since effects of itinerancy are certainly of importance in FeSi. We certainly do not aim for completeness in this section and strictly focus on studies and parameter regimes that are directly linked to either FeSi or Ce3Bi4Pt3. Beyond the literature reviewed here, a contrasting juxtaposition of the two quintessential models will be presented in Section (II.6).
II.3.1 Periodic Anderson model (PAM).
The PAM is believed to contain the essence of the physics relevant in heavy-fermion materials. It describes a periodic array of atomic levels (-states) subjected to a local Coulomb interaction and a hybridization to a dispersive band of non-interacting conduction () electrons:
| (5) |
Here , (, ) are the creation and annihilation operators of the conduction (atomic) states, and we have used a mixed representation where labels the momentum in the Brillouin zone, while indexes a lattice site; the spin is denoted by ; is the dispersion of the decoupled -electrons, the location of the -level, the hybridization between the two electron species. Finally, is the local number operator of the -electrons, and their on-site Coulomb repulsion. In the non-interacting limit, , the symmetric PAM (, particle-hole symmetric, e.g., hyper-cubic lattice with only nearest neighbour hopping, ) with local hybridization , is gapped for finite . The direct gap is proportional to the hybridization, , while the indirect gap can be much smaller, one finds , where is half the bandwidth of the (unhybridized) -electron (see Fig. (27) for a specific case).
In the context of Ce3Bi4Pt3, Riseborough Riseborough (1992) studied the PAM within mean-field theory and found a renormalization of the hybridization , that leads—in the symmetric, half-filled case—to a shrinking of the low-temperature gap. Further he obtained spin susceptibilities in good qualitative agreement with experimental findings for Ce3Bi4Pt3. Sanchez-Castro et al. Sanchez-Castro et al. (1993) used a slave boson technique in the strong coupling limit, and applied it to the PAM with a parabolic conduction band. Owing to the particle-hole asymmetry of their model, the authors could in particular study the temperature dependence of the thermopower and the Hall coefficient. It was found that these quantities had opposite signs at low temperatures, congruent with experimental findings for Ce3Bi4Pt3 (thermopower hole-likeHundley et al. (1994a), Hall coefficient electron-likeFisk et al. (1995)363636See however Ref. Katoh and Takabatake (1998) where a positive Hall signal was found.) as commonly found also in other heavy-fermion materials, e.g., CeCu2Si2Sun and Steglich (2013).
Dynamical mean-field theory (DMFT)Georges et al. (1996); Kotliar and Vollhardt (2004) was first applied to the symmetric PAM by Jarrell et al. Jarrell et al. (1993); Jarrell (1995). They evidenced that spectra, susceptibilities and thermodynamic quantities behave like heavy-fermion metals at high temperatures (large masses, Curie-Weiss law), and like insulators at low temperatures (activated behaviours). The DMFT approach was in particular shown to capture the competition between the Kondo effect and the magnetic RKKY interactionJarrell (1995). Indeed, the DMFT phase-diagram of the half-filled symmetric PAM on the infinite Bethe lattice (see Sun et al. Sun et al. (1993) and Rozenberg Rozenberg (1995)) exhibits antiferromagnetic long-range order above a second order critical line given by for large . These findings extend Doniach’s ideas Doniach (1977) for the Kondo lattice to the PAM.
Subsequently, also Rozenberg et al. Rozenberg et al. (1996) followed the Kondo insulator route and interpreted experimental findings for FeSi and Ce3Bi4Pt3 in terms of DMFT calculations for the PAM. They showed that the PAM yields, for , the same hierarchy of energy scales, , that was evidenced for FeSi and Ce3Bi4Pt3 (see Section (I.2)). Rozenberg et al. in particular modelled the optical conductivity: Congruent with experiments for both compounds [see Section (5)(b)], the direct gap is virtually independent of temperature, yet, with rising temperature, it is filled with incoherent spectral weight as the local moment of the -states begin to fluctuate freely.373737See also Ref. Franco et al. (2009) for optical conductivities, and Ref. Foglio and Figueira (1999) for susceptibilities in the strong coupling limit. A similar observation was made by Mutou and Hirashima Mutou and Hirashima (1995) for the (-contribution to the) spin-excitation spectrum.
Having in mind FeSi, Figueira et al. Figueira et al. (2012) studied the PAM with a slave-boson approach and computed transport observables. The authors found good qualitative agreement with experimental measurements at low temperatures, when using an ad hoc scattering rate. This finding advocates the presence of sizable many-body renormalizations for the dispersion near the Fermi level.
That dynamical mean-field theory provides an accurate picture of the symmetric PAM was motivated by Tanasković et al.Tanasković et al. (2011): Employing cellular DMFT, they demonstrated the absence of non-local (yet short-range) correlations in regimes sufficiently above the model’s Néel temperature. This dominance of local correlation physics also serves to motivate the accurateness of, e.g., our realistic calculations for the Kondo insulator Ce3Bi4Pt3 in Section (II.4.3).
Having in mind anisotropic Kondo insulators, Yamada and OnoYamada and Ōno (2012) studied the PAM with non-local hybridizations. They evidenced, among others, that the uniform and the local magnetic susceptibility virtually coincide down to . Further, they studied how interaction effects suppress fluctuations of charge, while enhancing spin fluctuations with respect to the spin and charge susceptibilities that coincide in the non-interacting (limit).
A model that goes beyond the PAM in that it allows for the correlated band to have finite dispersions was introduced by Continentino, Japiassu and Troper Continentino et al. (1994). Indeed the model was designed to encompass both, systems like Ce3Bi4Pt3 (in which the correlated states are close to atomic-like) and compounds such as FeSi (in which -orbital-derived bands have a finite dispersion), through a scalable hopping amplitude. The model was solved using an equation-of-motion technique in the strong coupling limit. The authors found that, contrary to the symmetric PAM, a critical hybridization was needed to yield an insulating spectrum. It was speculated that this is the reason why covalent insulators are not that common among -electron systems.
While the PAM exhibits notable similarities to the one-band Hubbard modelHeld et al. (2000); Held and Bulla (2000), the band-structure results from the preceding section motivate that narrow-gap semiconductors, such as FeSi and FeSb2, require a description in terms of a multi-band Hubbard model. These are the subject of the next section.
II.3.2 Hubbard models.
The first multi-band Hubbard model
| (6) |
devised for studying FeSi is owing to Fu and Doniach Fu and Doniach (1995). They considered two bands () on a hyper-cubic lattice that hybridize locally (). This setup yields an insulating density of states in the non-interacting limit with a gap that is direct, . Turning on the Hubbard interaction (i) renormalizes downwards the bare gap and (ii) introduces a scattering rate. The latter rises with temperature and causes one-particle excitations to broaden, to the extend that incoherent spectral weight appears at the Fermi level. Using an approximate expression for the magnetic susceptibility, good agreement was found with experiment. The model of Fu and Doniach Fu and Doniach (1995) contains the minimal ingredients to describe the essence of correlated narrow-gap semiconductors.
Using a density-of-states inspired from ab initio calculations, Kuneš and Anisimov Kuneš and Anisimov (2008) solved a one-band Hubbard model with DMFT and stressed the importance of the covalent nature of the hybridization gap in systems like FeSi and FeSb2. Further, they computed optical conductivities and obtained a resistivity that accounts for the non-monotonous temperature dependence shown in Fig. (4)(a,left). Finally, the authors also computed within DMFT the local and uniform magnetic susceptibilities of their model with and without doping. It was found that susceptibilities were much enhanced with respect to the non-interacting system, with a Curie-Weiss-like tail emerging at high temperatures, or, in the doped case, throughout the considered temperature range. Interestingly, the effective fluctuating moment was shown to be notably momentum-dependent—indicating that a picture of spatially localized moments (which is at the origin of Curie-Weiss behaviour) is not appropriate in this setting. Notably, the local susceptibility was found to be much larger than the uniform one (we will come back to this point in Section (II.4.1)).
Sentef et al. Sentef et al. (2009) studied within DMFT a half-filled two-band model similar to that of Doniach and Fu Fu and Doniach (1995) and investigated the interaction-temperature phase diagram as well as more formal aspects of correlation effects in covalent insulators. The Hubbard was found to drive the system through a first order transition from a correlated covalent insulator to a Mott insulator. The coexistence region terminates in a critical end point at finite temperatures, above which the hybridization insulator and the Mott insulator are continuously connected via a crossover through a bad-metal phase. While in the non-interacting limit, spin and charge gap coincide, their degeneracy was found to be lifted at finite , with the spin gap decreasing faster than the charge gap upon approaching the insulator-to-insulator transition, in congruence with the experimental gaps of FeSi and Ce3Bi4Pt3 (see Section (I.2)).
The effect of correlation effects on the optical conductivity of FeSi was also studied by Urasaki and Saso Urasaki and Saso (1999) using perturbation theory for a two-band Hubbard model, finding qualitative agreement with the experimental temperature-dependence. They also found remarkable agreement for the thermopower when using a realistic density-of-statesSaso and Urasaki (2002).
Inspired from their band-structure results (see Section (II.2)), Mazurenko et al. Mazurenko et al. (2010) constructed an effective three-band model to mimic FeSi, and performed one-band DMFT calculations for its density-of-states. In agreement with previous works and experimental observations, they found an effective mass enhancement of about two. In particular, however, Mazurenko et al. studied the doped system and rationalized the appearance of ferromagnetism in Fe1-xCoxSi in terms of the Stoner criterion, arriving at the conclusion that magnetism is of itinerant origin. Later, Yang et al. Yang et al. (2011) solved the full three-band model of Mazurenko et al., and made the important observation that the Hund’s rule coupling plays a significant role in stabilizing ferromagnetism.383838For the importance of the Hund’s rule coupling for metallic ferromagnetism, see, e.g., Refs. Okabe (1996); Bünemann et al. (1998); Vollhardt et al. (1999); Sakai et al. (2007b).
Thus, as for experimental observables, also the minimal models for FeSi (two-band Hubbard model) and Ce3Bi4Pt3 (PAM) are exhibiting a quite similar behaviour. This begs the questions whether the physics underlying both the models and the actual compounds is in fact akin, or whether the microscopic origin can be distinguished. We will try to answer this question in the following sections using available and new realistic many-body calculations.
II.4 Many-body electronic-structure theory
While many-body models have enlightened our understanding about many physical phenomena in correlated systems, they cannot account for all the complexity encountered in real materials. This concerns in particular multi-band effects, such as crystal-fields, multiplet structures, ligand hybridizations, spin-orbit coupling, etc. Given the enormous sensitivity of even fundamental properties of correlated materials, such details do matter. Hence, at times, it is advantageous to turn around the usual modus operandi in which reductionist models are solved before using state-of-the-art methods for realistic many-body calculations. In fact, realistic calculations could serve instead as a guide to which control parameters should be included in pertinent many-body models. Indeed, most model setups for FeSi and others have used rather unspecific dispersions, at times even particle-hole symmetric ones (that result in a vanishing thermopower). Also for Kondo insulators, the importance of realistic electronic structures was noted already early onDoniach et al. (1994). In particular, the influence of the Hund’s rule coupling—a genuine multi-orbital effect—was mentioned only in very few works.
In this section we will discuss recent ab initio DFT+DMFT calculations for FeSi that build on realistic band-structures and Coulomb interactions. We will first show (Section (II.4.1)) that for a considerable panoply of physical observables which probe different (yet interlinked) degrees of freedom, excellent agreement is found with respect to experiment. With this validation of the theoretical setup, the microscopic ingredients of the theory can be analysed (Section (II.4.2)), allowing for a better fundamental understanding of the physics relevant to correlated narrow-gap semiconductors. In Section (II.4.3), we will complement these results for FeSi with new calculations for Ce3Bi4Pt3 to highlight microscopic similarities and differences. In Section (II.6) the thus gained insight will be used to go back to model-setups and scan relevant parameter regimes so as to put FeSi and Ce3Bi4Pt3 into the wider context of related compounds.
II.4.1 Theoretical description of experimental observables of FeSi.
In this section, we will review results from realistic many-body (DFT+DMFT) calculations for FeSi for spectral and optical observables, as well as magnetic susceptibilitiesTomczak et al. (2012a). These theoretical findings compare favourably with experimental results from photoemission and optical spectroscopies, as well as neutron spectroscopy and other magnetic probes. A discussion of transport observables (resistivity, thermopower, etc.) can be found in the thermoelectricity chapter in Section (III.2). The methodology employed for the following results is the realistic extension of DMFTGeorges et al. (1996); Kotliar and Vollhardt (2004), dubbed DFT+DMFTKotliar et al. (2006), as implemented by Haule et al. Haule et al. (2010). We refer to the original worksTomczak et al. (2012a, 2013b) for technical details.
Spectral properties.
Fig. (19) (top left) displays the DFT+DMFT spectral function for various temperatures. At low temperatures (blue) FeSi is gapped, with a charge gap of meV that is narrowed by about a factor of two as compared to band-theory (cf. Fig. (13)), in congruence with photoemission spectroscopy (cf. Fig. (12) and Fig. (5)(a)). As temperature rises, peaks in the spectral function broaden and incoherent spectral weight spills into the gap and the system increasingly metallizes. Similar spectra have subsequently been obtained by Yanagi and UedaYanagi and Ueda (2016) using a perturbative approach.
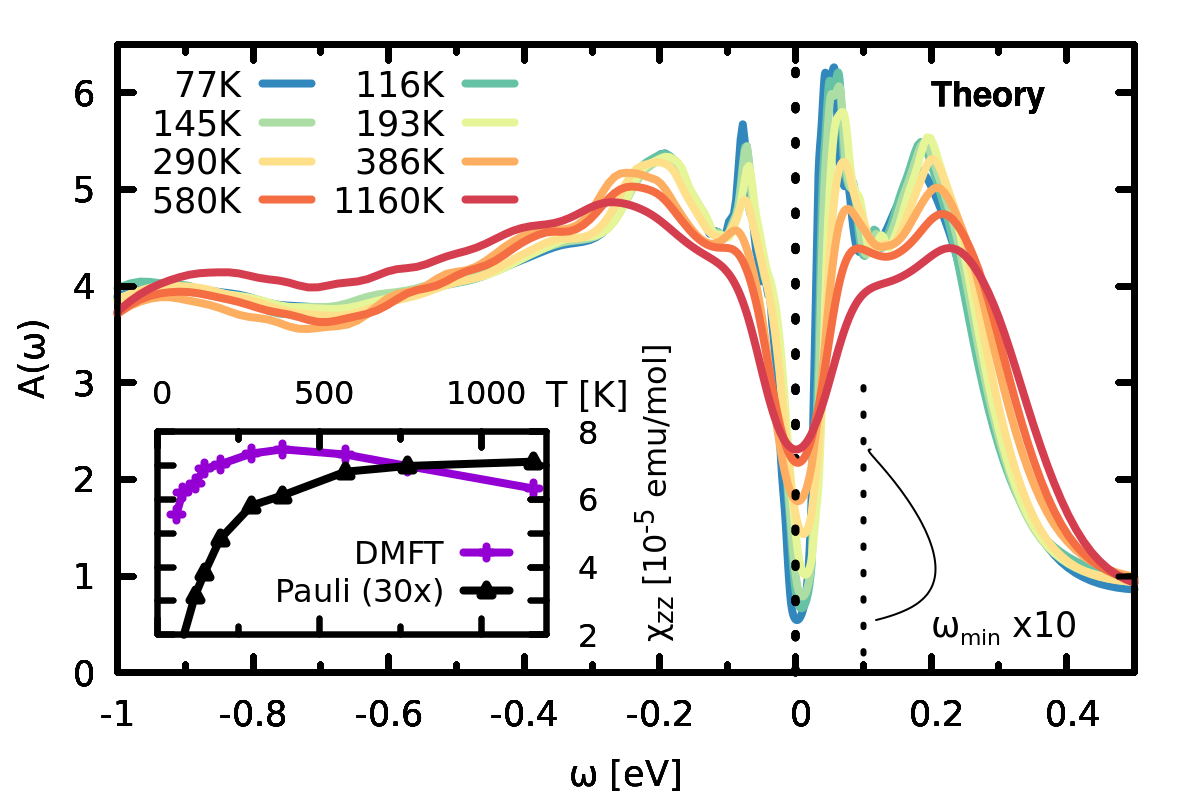
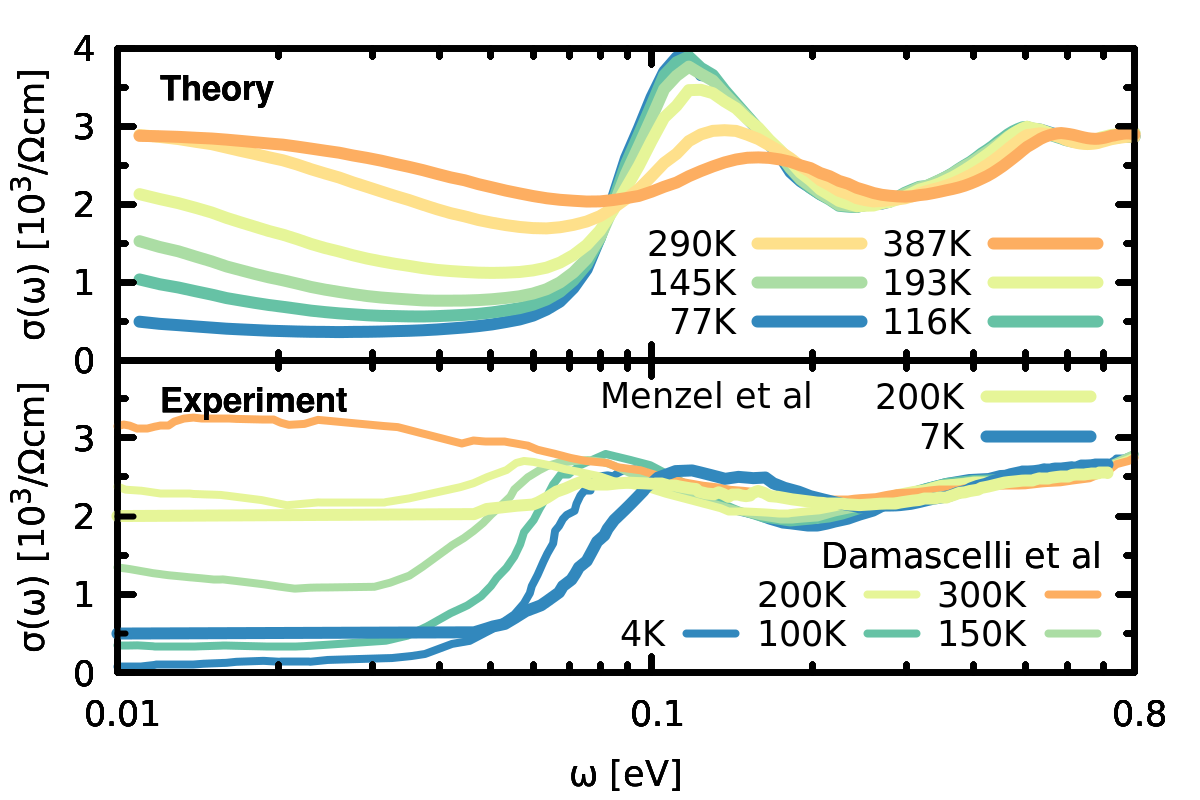
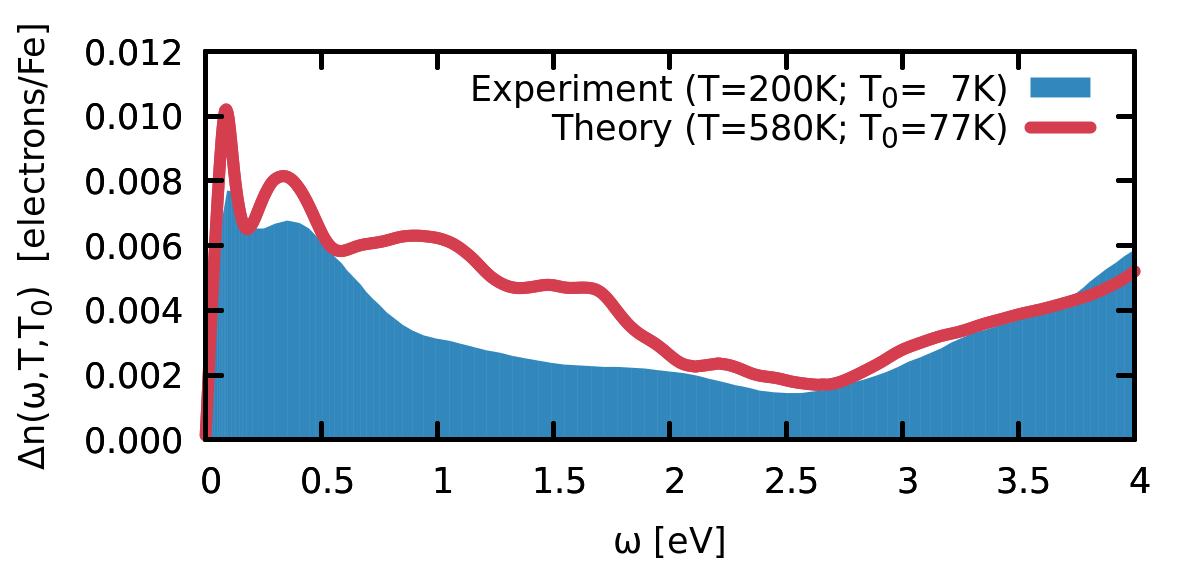
Optical properties.
The crossover to a (badly) metallic state is also quantitatively reproduced in the optical conductivity, as shown in Fig. (19) (right). As noted already in Section (I.2), the metallic response is not caused by the gap edges shifting to the Fermi level. Indeed, the first maximum in the absorption does not move substantially with temperature.393939We note, however, that the trend in experiment and theory is opposite: The peak moves up with in theory, while it moves down in experiment. We attribute this the expansion of the lattice with increasing temperature, which tends to reduce the hybridization gap. The calculations were done at constant volume. Instead the intensity of that peak diminishes as spectral weight is transferred to lower energies. This transfer of spectral weight is analysed in more detail in Fig. (19) (bottom). According to Eq. (3) describes the redistribution of spectral weight up to the energy with respect to a base temperature . A positive value of thus indicates that, for , there is a net transfer of spectral weight to energies lower than . An intersection of with the -axis would correspond to a full recovery of spectral weight as imposed by the -sum rule, Eq. (1). First, we note that the theoretical results closely trace the experimental temperature dependence. Second, there are several isosbectic pointsGreger et al. (2013) in the optical conductivity——which translate into extrema in . The first of these peaks is at 80meV, the scale of the semiconducting gap, above which spectral weight aggregates at low temperatures. The first minimum in occurs at the second isosbectic point of at meV. There, the theoretical curve reaches a compensation of only of the excess carriers from the first feature. In fact, does not vanish up to 4eV, indicating that a total compensation according to the sum-rule is not achieved below the scale of the screened Coulomb repulsion of eV used here.
Magnetic properties.
The inset of Fig. (19) (top left) shows a comparison of the local spin-susceptibility as obtained from DFT+DMFT and the Pauli susceptibility according to Eq. (4). The local susceptibility has the expected characteristic temperature dependence as seen in experiment (growing with at low-, Curie-Weiss-like decay above K, cf. Fig. (4)(b)). The Pauli expression, as computed from the DFT+DMFT spectral function is very low in magnitude404040note that the latter has been multiplied by a factor of 30. and is, moreover, a monotonously increasing function of temperature, and thus does not account for the observed physics. We further note, that the local susceptibility has a magnitude smaller by a factor of as compared to the measured uniform magnetic susceptibility (cf. Fig. (4)(b)). To make things worse, previous (one-band) model calculationsKuneš and Anisimov (2008) found that the local susceptibility is actually larger than the uniform susceptibility, potentially aggravating congruency with experiment. In the periodic Anderson model, the local and uniform susceptibility coincide above Yamada and Ōno (2012). This impasse is solved as follows: (i) experimentally: As mentioned before, magnetic neutron spectroscopy experimentsTajima et al. (1988); Shirane et al. (1987) evidenced a ferromagnetic-like susceptibility, i.e., a that is peaked at and equivalent points.414141Interestingly, extracted fluctuating moments and linewidths of FeSi are reminiscent of results for the metallic ferromagnetic Heusler compound Pd2MnSn well above its Curie temperatureKohgi et al. (1986). This finding strongly suggests that the uniform susceptibility should instead be much larger than the -averaged (=local) susceptibility. (ii) theoretically: Using the formalism of Park et al. Park et al. (2011), we compute the structure factor from our DFT+DMFT data.424242Details will be published elsewhere. Note that the same formalism has recently also been successfully applied to another intermediate valence compound, namely CePd3Goremychkin et al. (2018). The agreement with the experimental neutron results as shown in Fig. (20) is excellent and clearly evidences an enhancement of the susceptibility at ferromagnetic wavevectors. Krannich et al. Krannich et al. (2015) analysed the shown elastic structure factor of Tajima et al. Tajima et al. (1988) with a phenomenological paramagnetic scattering function, , with the static susceptibility , a damping factor , and a correlation length . Our theoretical simulation reproduces their finding of Å. This is a quite remarkable result, since the correlation length is therewith larger than the distance 2.75Å between neighbouring iron atoms. This ferromagnetic enhancement in particular implies a uniform susceptibility that is significantly larger than the local one. This qualitative change as compared to previous single-band calculations (see Section (II.3)) advocates the importance of genuine multi-band effects in FeSi. It is in particular the influence of the Hund’s rule coupling that favours tendencies towards ferromagnetism.


Indeed, using realistic many-body setups solved with a perturbative technique, Yanagi and UedaYanagi and Ueda (2016) discussed the different magnetic ground-states of the isostructural and isoelectronic Fesi and FeGe (cf. Section (II.2.1)). In particular they evidenced a strong dependence of the magnetic ordering temperature and moment in FeGe on the strength of the Hund’s rule coupling . The important influence of for spectral properties is discussed in the next paragraph.
II.4.2 A microscopic understanding: spin fluctuations and Hund’s physics
Having validated the theoretical setup through quantitative congruence with experiments, one can take a step back, and analyze the microscopic origin of the evidenced behaviour.
The self-energy and the Hund’s rule coupling.
As evident from the spectral function and the optical conductivity, the metallization crossover in FeSi within DFT+DMFT is not caused by a temperature-induced narrowing of the charge gap. Instead the latter is filled with incoherent weight as spectral features broaden substantially with increasing temperature. Information on the coherence of one-particle excitations is encoded in the imaginary parts of the self-energy. As displayed in Fig. (21), follows—for orbital components that account for the majority of spectral weight near the Fermi level—a Fermi liquid-like behaviour. While the overall magnitude of the scattering rate remains small in comparison e.g., to some metallic transition metal oxidesPoteryaev et al. (2007); Byczuk et al. (2007), it reaches values of meV that are comparable to half the size of the charge gap at around 400K. Indeed at this temperature only a pseudo gap remains in the spectral function (Fig. (19)(a)) and spectral weight at the Fermi level is finite. The fact that such moderate correlation effects play a significant role in FeSi is thus rooted in the proximity of energy scales: .
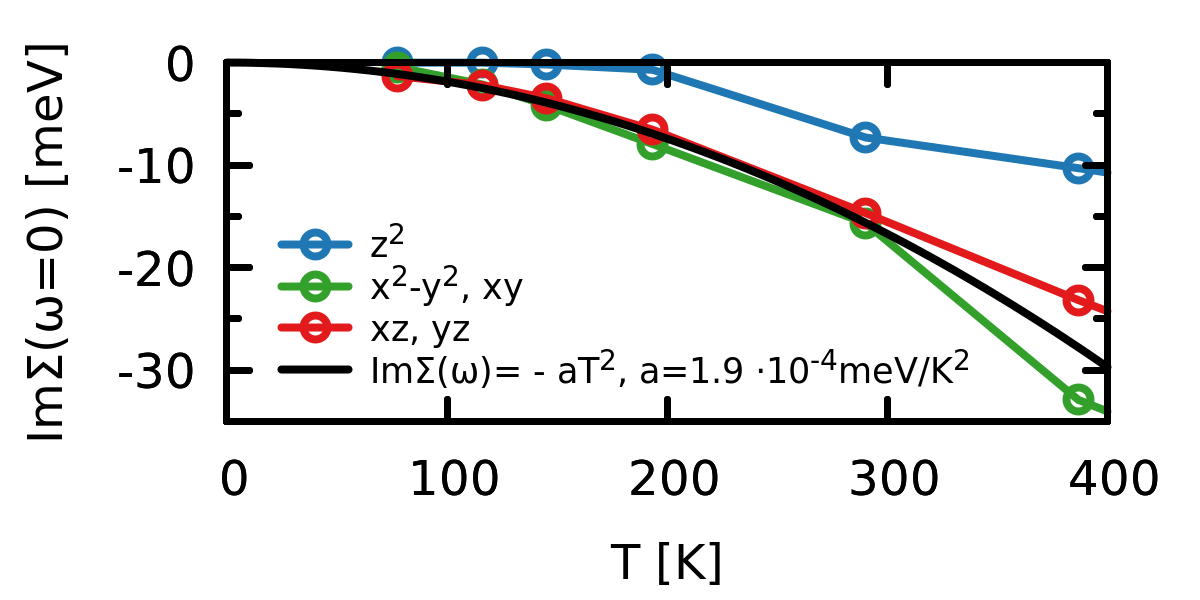
What controls the strength of quasi-particle incoherence in FeSi? In the many-body model of Fu and DoniachFu and Doniach (1995) and others, see Section (II.3), the local Coulomb interaction—the Hubbard —was identified as the driving force behind the metallization crossover. In the realistic calculations (that use eV and eV434343in rough accordance with constrained DFT resultsDutta and Pandey (2018).), however, changes in do not yield substantial modifications of the spectral function. Indeed, the large bandwidth (eV) of the Fe-3 and Si-3,3 conglomerate dominates the Hubbard for reasonable values of the latter. However, a significant dependence of many-body renormalizations on the Hund’s coupling was evidencedTomczak et al. (2012a): As seen in Fig. (22)(a) the scattering rate at K dramatically changes with . In fact, when going from the realistic value eV of iron compoundsKutepov et al. (2010) up to only eV, more than doubles. Decreasing to 0.6eV, on the other hand, causes to almost vanish.


Concomitantly, also renormalizations encoded in the real-parts of the self-energy strongly depend on : The mass enhancement—in DMFT: —increases notably with , see Fig. (22)(b), while remaining at a moderate magnitude ().444444 The mass enhancement is albeit larger than in other Fe-Si binary compounds, e.g., metallic -FeSi2Miiller et al. (2015). Combined, the effects of in the self-energy cause largely different spectra: As seen in panel (c) of Fig. (22) both the width of the pseudogap at K as well as the amount of spectral weight at the Fermi level is drastically dependent on the Hund’s rule coupling.
What is the origin of this sensitivity? First, in FeSi there is no direct competition between the Hund’s coupling eV and crystal-field splittings . That indicates that a high-spin state is always favoured. This clear hierarchy also rules out that a spin-state transition is at the origin of FeSi’s anomalous behaviour (see also below). Second, such a strong impact of was previously found also for other iron-based materialsHaule and Kotliar (2009a); Yin et al. (2011); Hansmann et al. (2010), adatomsKhajetoorians et al. (2015), as well as for some 4-systemsMravlje et al. (2011) (see also the recent Refs. Hausoel et al. (2017); Hariki et al. (2017)). The general mechanism is investigated in Refs.Okada and Yosida (1973); Nevidomskyy and Coleman (2009); Mravlje et al. (2011); Yin et al. (2011); Mravlje et al. (2011); de’ Medici (2011); de’ Medici et al. (2011); Georges et al. (2013): A large Hund’s constrains electrons in different orbitals towards having the same spin, therewith “orbitally blocking”Yin et al. (2011) the Kondo interaction. As a consequence the coherence temperature is shown to be suppressed exponentiallyOkada and Yosida (1973), resulting in a larger at a given temperature. For these systems the name Hund’s metal has been coinedYin et al. (2011). Besides the effective mass enhancement, also spin- and charge fluctuations in these Hund’s systems have genuine characteristics, as discussed for FeSi in the next section.
The spin and charge state.
Above, we have discussed the momentum-structure of the magnetic susceptibility, and explained the reasons why the local component is smaller than the measured uniform susceptibility. Besides the differentiation in momentum-space, the spin response also has an interesting structure in the time domain: The static local spin susceptibility, , displays, as discussed above, a strong and non-monotonous temperature dependence (see inset of Fig. (19) top left). describes the time-averaged response. Complementarity, we can compute the instantaneous response . Interestingly, the latter is found to be virtually independent of temperature: It yields, for all temperatures, an effective moment (), which is consistent with the Curie-Weiss-like decay manifest in the experimental uniform susceptibility at high temperatures. Indeed we find good agreement with for which is close to the single-ion limit in case of a configuration (see discussion in Section (I.2)).
We can analyse this in more detail: Fig. (23) shows the quantum Monte Carlo histogramHaule (2007); Werner and Millis (2007) for the DFT+DMFT calculation at low (left) and high (right) temperature. The bars indicate the probability distribution of the many-body wave-function for being in an eigenstate of the effective iron atom, decomposed into the number of particles and the spin state . We observe that:


-
1.
the decomposition onto and is almost independent of temperature. The scenario of a temperature-induced momentShirane et al. (1987) is hence not realized in our theory. Also, as anticipated above, a spin-state-transition does not occur. This situation has to be contrasted with systems in which the crystal-field splitting and the Hund’s rule coupling are of comparable sizeWerner and Millis (2007): For example, spin-state crossovers have been identified to underlie the pressure-induced (low-spin)insulator-to-(high-spin)metal transition in (the B8 phase of) MnOKunes et al. (2008), or the anomalous behaviour in the magnetic susceptibility of LaCoO3Knížek et al. (2009); Eder (2010); Křápek et al. (2012); Kuneš and Křápek (2011); Augustinský et al. (2013) (see Fig. (2) or Refs. Señarı́s-Rodrı́guez and Goodenough (1995); Yamaguchi et al. (1996)). Indeed, in LaCoO3 X-ray absorption spectroscopy estimates a crystal-field splitting between (at low- fully occupied) and (empty) orbitals of eV. This value corresponds to typical estimates of the Hund’s in transition-metal based compounds. In LaCoO3, the competition between and is tipped by a thermal activation of the high-spin state (in cooperation with the expansion of the lattice). As shown by Křápek et al. Křápek et al. (2012) this leads to a pronounced temperature-dependence of the DMFT histogram for both charge- and spin-resolved probabilities—in qualitative difference to the case of FeSi. An important factor that distinguishes FeSi from LaCoO3—the degree of ionic vs. covalent bonding—will be discussed in a broader context in Section (II.5).
- 2.
-
3.
the spin state has the overall largest probability at all temperatures, consistent with the above discussed effective moment.
-
4.
the probability distribution is not dominated by only few configurations of and . This indicates strong fluctuations at short time-scales. In fact, the system has a strongly intermediate valence, as the charge variance is of order 1 : . However, as the variance is insensitive to temperature, a thermally induced mixed valence Varma (1994) can be excluded. Also spin fluctuations at short time-scales, , are large.
The above analysis shows that the physics of correlations in FeSi is very different from the Mott-Hubbard physics in, say, transition metal oxidesImada et al. (1998). There, the Hubbard quenches charge fluctuations and reduces the time-scale associated with them, while the time averaged local spin susceptibility is strongly enhanced. In fact, in a Mott insulator, charge fluctuations are basically absent, while the local moment of charge carriers fluctuates freely, giving rise to a Curie-Weiss susceptibility. In FeSi, on the contrary, spin fluctuations are short-lived: The (time-averaged) local spin susceptibility is only moderate enhanced, while the short-time (energy-averaged) fluctuating magnetic moment is strongly enhanced. Contrary to Mott insulators, fluctuating magnetic moments in systems like FeSi do not require the quenching of charge fluctuations. This is indeed a hallmark of Hund’s metals (see the preceding section). Still, FeSi is an example where the Hund’s metal concept exists for an only poorly metallic state, in which the hybridization of the iron atoms with their surrounding is weak (see also the discussion of the DMFT hybridization function in Section (II.4.3)).
The physical picture.
With the above details of the realistic many-body simulations, one can address the fundamental picture of FeSi: (a) What is the microscopic origin of the crossover in the magnetic susceptibility? (b) How is the latter linked to the emergence of incoherent spectral weight. In other words, what is the relation between the crossovers for the spin and charge degrees of freedom? (c) What is the difference, if any, to the physics of Kondo insulators?
At low temperatures, FeSi is a band-like semiconductor: The band gap in the one-particle spectrum inhibits, both, spin and charge fluctuations at finite time-scales. This results in (i) a small, activated (uniform) spin susceptibility, and (ii) a lack of phase-space available for electronic scattering, resulting in only a small imaginary part of the self-energy. As such, the system can be approximately described by an effective one-particle Hamiltonian that is diagonalizable in momentum space, stating that is a good quantum number.
With increasing temperature (beyond ) a fluctuating moment develops at the iron sites, which is a manifestation of the single-ion physics that dominates at large temperatures when spatial correlations become short-rangedGeorges (2011). In this limit, the index conjugate to the momentum, the lattice site , becomes a good quantum number. The fluctuating moment thus provides a link to the real-space lattice, and the description in terms of Bloch-bands breaks down as is no longer a good quantum number. As a consequence, the one-particle spectrum decomposes over many momenta, or, equivalently acquires a finite lifetime for a given momentum. This lifetime is encoded in the imaginary parts of the self-energy and leads to the appearance of incoherent spectral weight that eventually fills the gap. We stress that despite the notion of locality of the moments on the iron sites, magnetic fluctuations are ferromagnetic (see Fig. (20)) due to the strong on-site Hund’s rule coupling.
This scenario qualitatively reconciles the behaviour seen for spectral properties in the pioneering model of Fu and DoniachFu and Doniach (1995) with the seminal spin-fluctuation theory of Takahashi and MoriyaTakahashi and Moriya (1979): In the DFT+DMFT picture, the crossovers in the spin and charge response in FeSi are intimately linked to each other. In the microscopic details, however, the realistic many-body calculationsTomczak et al. (2012a, 2013b) revealed notable differences to previous model calculationsFu and Doniach (1995); Mazurenko et al. (2010); Kuneš and Anisimov (2008). It is likely that the scenario for FeSi reviewed here is also relevant for other narrow-gap intermetallics. For example, it can be expected that—once issues related to exchange contributions to the self-energy (see Section (II.2.2)) are overcome—the microscopic behaviour of FeSb2 is qualitatively akin to that of FeSi.
The above discussions answers the first two questions, (a) and (b), raised at the beginning of this paragraph. In order to answer—in Section (II.5)—the third question, (c), we performed realistic many-body calculations for Ce3Bi4Pt3 that are discussed below.
II.4.3 Realistic many-body calculations for Ce3Bi4Pt3.
For a direct comparison of FeSi to heavy-fermion-based Kondo insulators, we performed DFT+DMFT calculations for the prototypical compound Ce3Bi4Pt3.454545We employed DFT+DMFT with a CTQMC solver as implemented in Ref. Haule et al. (2010) with rotationally invariant interactions parametrized by eV and eV (similar to what was used previously for elemental CeZölfl et al. (2001); Haule et al. (2010); Chakrabarti et al. (2014); Bieder and Amadon (2014) and other Ce-based compoundsHaule et al. (2010); Tomczak et al. (2013a); Goremychkin et al. (2018)), spin-orbit coupling, charge self-consistency, and nominal double-counting. Details will be published elsewhere. Fig. (24) displays the spectral function obtained for different temperatures. As was the case in FeSi, lowering temperature results in a depletion of spectral weight at the Fermi level. The width of the emerging gap, meV, is consistent with the experimental indirect charge gap of 8-12meV (see Fig. (4)(a), Fig. (5)(a), and table (1)). With respect to band-structure results (see Section (II.2.3)) the renormalization of the gap corresponds to an effective mass-enhancement of about a factor of 10. Also the temperature scale, K, around which the metallization occurs in the spectral function is congruent with both photoemission Takeda et al. (1999) and optical spectra Bucher et al. (1994) (see Fig. (5)). This coherence-incoherence crossover is encoded in the imaginary parts of the self-energy (not shown). As was the case for FeSi (see Fig. (21)), for orbitals relevant for spectral weight near the Fermi level. These changes in spectral properties are accompanied by a rearrangement of the spin degrees of freedom. Indeed, an analysis of the DMFT magnetic susceptibility (not shown) is compatible with the standard picture of the unlocking of local moments above a coherence temperature .
The next section will put these results into a broader context by discussing differences between FeSi, Ce3Bi4Pt3, and LaCoO3.
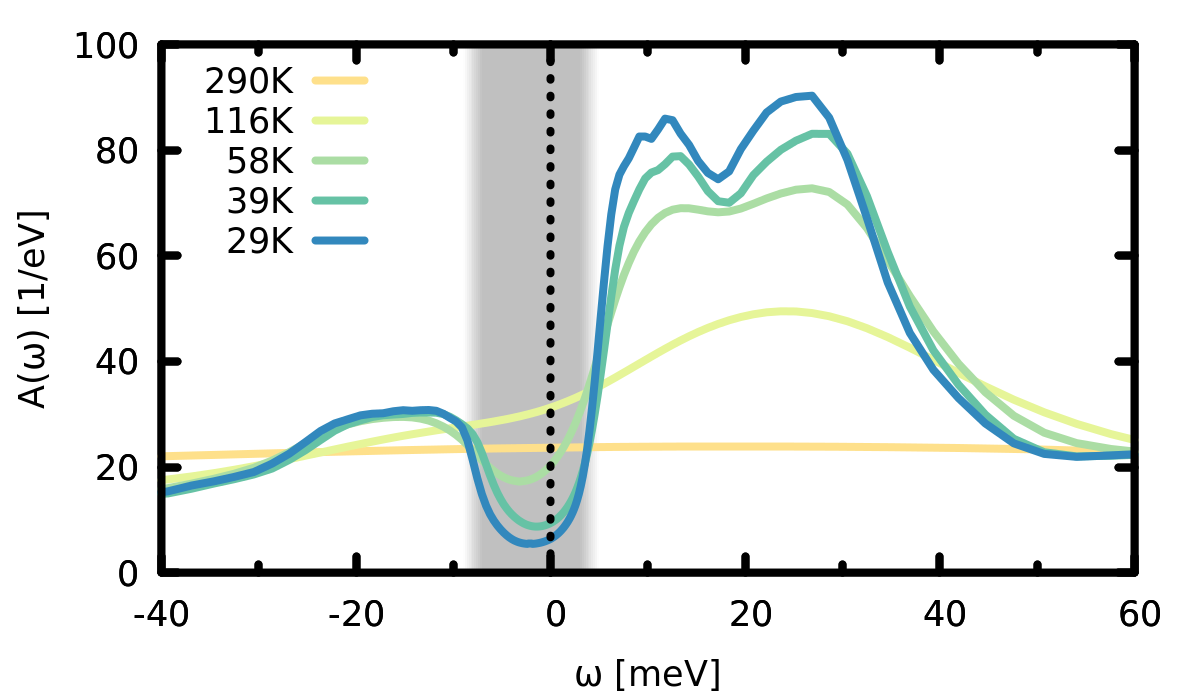
II.5 Kondo insulators, transition-metal intermetallics and oxides: A categorization
II.5.1 The DMFT perspective on insulators
In order to illustrate qualitative differences in narrow-gap semiconductors with partially-filled correlated orbitals, it is convenient to take a look under hood of the DMFT methodGeorges et al. (1996); Kotliar and Vollhardt (2004). There, the periodic solid is mapped onto an effective (e.g., iron or cerium) atom (called an “impurity”) which is coupled to a reservoir (“bath”) with which it can exchange particles. Translational invariance is restored through a self-consistency condition which identifies the impurity Green’s function with the local Green’s function of the lattice for the subset “” of correlated orbitals, , i.e.,
| (7) |
Here, the chemical potential, the one-particle Hamiltonian, and its local (-summed) component in the correlated -subspace that encodes local crystal-fields. is the lattice self-energy which is approximated as the impurity self-energy in the -subspace, , and is zero otherwise. Finally, is the so-called hybridization function that describes the coupling of the effective correlated atom to the bath.
Using Eq. (7), we can characterize the origin of an insulating state, i.e., a vanishing of , through its manifestations in , , , and . In this DMFT perspective, we can distinguish:464646Note that, here, we limit the discussion to paramagnetic insulators without spin, charge, or structural orders.
Three prototypes of paramagnetic insulators (see also table (4))
-
1.
Mott insulators: diverges at low energies (at least for some orbitals), while is metallic. This is the Brinkmann-RiceBrinkman and Rice (1970) scenario of a Mott insulator: spectral weight is destroyed () by diverging effective masses, as realized e.g., in YTiO3Pavarini et al. (2004), V2O3Held et al. (2001); Poteryaev et al. (2007), or thin films of SrVO3Zhong et al. (2015).
-
2.
(ionic) band insulators: Here, both and vanish at the Fermi level at low , while is finite for all orbitals. In other words, it is local crystal-fields encoded in (possibly enhanced by the static renormalizations , ) that are responsible for the gapping. This is the case of LaCoO3 where the chemical potential falls between the (at low temperatures) filled and the empty orbitals (see Section (II.2.1) and below). Also the dimerized M1 phase of VO2, a correlation-enhanced Peierls insulatorTomczak et al. (2008), will fall into this category.
-
3.
Kondo insulators (covalent band insulators): In these systems diverges at low energies to suppress spectral weight, while is benign and crystal-fields in are mostly irrelevant for realizing the insulator. This is the case of Ce3Bi4Pt3, see below.
Since at least the last two scenarios do not exclude each-other, it may be difficult to provide a clean-cut categorization for a given material. Before looking at ab initio results for FeSi and Ce3Bi4Pt3, let us thus illustrate some characteristics of Kondo insulators, as well as the grey area between purely covalent and ionic insulators first for a toy model, then from the DFT perspective.
| type / property | examples | ||||
|---|---|---|---|---|---|
| band insulator | gapped | 0 | large | 0 | LaCoO3, FeSi (,,) |
| Kondo insulator | gapped | 0 | small | Ce3Bi4Pt3, FeSi (,) | |
| Mott insulator | metallic | small | 0 | YTiO3, thin films SrVO3 |
II.5.2 A toy-model.
Let us first focus on the left side of Eq. (7): From the lattice point of view the difference between ionic and covalent insulators is hidden in . This is seen in a simple toy model in the quasi-particle picture. Consider:
| (8) |
i.e., one correlated band coupled to a ligand state via a hybridization , that for simplicity we have assumed to be local. Many-body renormalizations are described by a self-energy, for which we take a Fermi-liquid-like form that neglects lifetime effects.
The first goal is to illustrate generic behaviours of the hybridization function for Kondo insulators. To this end, we consider a setup in the spirit of the periodic Anderson model to mimic Ce3Bi4Pt3: is an atomic-like -level, renormalized by , and are the non-interacting conduction electrons of atoms other than Ce. Assuming particle-hole symmetry yields and , implying the absence of any crystal-fields. The bare one-particle spectrum is then gapped, with the direct gap determined by . The interacting dispersions are then given by , stating that only the inter-atomic hybridization (hence also the direct gap) is renormalized by electron-electron interactions. Equivalently, this can be seen in the hybridization function : For the left side of Eq. (7) we have with a momentum-dependent quantity . in particular diverges at the conduction-electron positions. In order to match the right-hand side of Eq. (7), , the DMFT hybridization function has to diverge, here—because of particle-hole symmetry—at the Fermi level. Consequently, the divergence of is a pure one-particle effect. Instead of being a signature of the Kondo effect, here merely encodes inter-atomic hybridizations that couple the effective correlated site to the DMFT bath. From this band-structure perspective, the influence of many-body effects is to renormalize down the strength of hybridization . Further, effects of incoherence (neglected here) will, when iterating to self-consistency, mitigate the divergence above a coherence temperature (see the ab initio results in Section (II.5.4)).
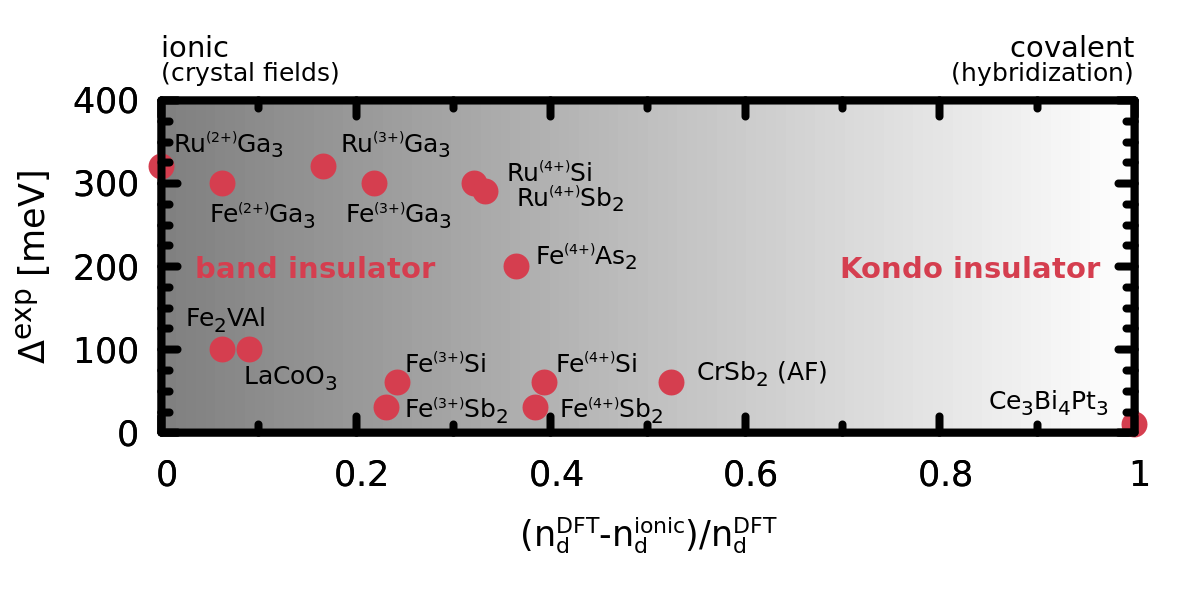
The model can also shed some insights onto the differences of FeSi and LaCoO3. We model both compounds by two decoupled copies of the above model: the first copy describes a high-lying valence -band and a ligand band lowered by a crystal-field , both of which are coupled via a local hybridization . In the second copy, and switch places, e.g., describes a correlated conduction band. Then, not the individual but the sum of both systems is particle-hole symmetric for . For the first copy, we then obtain for the left side of Eq. (7) with . Now, there are two degrees of freedom that can cause insulating behaviour: For small crystal-fields, , insulating behaviour requires the same mechanism as in the above model for Ce3Bi4Pt3: a pole-like structure in (and, correspondingly, in the DMFT hybridization function ). Indeed, for the band-gap is proportional to (at least for ). Empirically this situation corresponds to FeSi within DFT, as illustrated by Fig. (11)(a). In the opposite limit, i.e., a vanishing hybridization , insulating behaviour requires that the crystal-field exceeds the half-bandwidth of . This is the prevailing mechanism in LaCoO3, as shown within DFT in Fig. (11)(b). From this point of view, one can call LaCoO3 a mainly ionic insulator, and FeSi a dominantly covalent, i.e., Kondo-like insulator. Naturally, there exists a continuous spectrum between the pure prototypes of Kondo-like and (ionic) band insulators. Also, the hybridization function of an ionic system can still be strongly peaked outside the charge-gap, encoding charge-fluctuations at higher energies.
II.5.3 a DFT-based proxy to distinguish ionic from covalent insulators.
As motivated by the preceding model as well as Section (II.2), interesting insights can be gained from one-particle band-structures even in the case of Kondo systems. Indeed, DFT-based hybridization functions can divulge trends in gap-sizes or Kondo temperatures among families of compounds. For a recent discussion of band-structure-derived hybridization functions for Ce-compounds, see Ref. Herper et al. (2017).
Here, we are interested in determining—without performing costly many-body calculations—whether an insulating material is rather a Kondo or a (ionic) band insulator. For paramagnetic insulators with partially filled /-shells we propose—as a crude indicator for Kondo insulating behaviour—the relative deviation of DFT-occupancies with respect to nominal expectations in a purely ionic picture: . This proxy can hence be seen as a measure for charges of correlated orbitals to participate in covalent bonding. In Fig. (25) we have collected a number of relevant compounds. The Kondo insulator Ce3Bi4Pt3 appears on the right-most side, as it does not donate all of its Ce- electron to more electronegative atoms. The oxide LaCoO3, on the other hand, is found much towards the left. Indeed the Co-valence within DFT is rather close to that of a Co3+ ion. The intermetallic semiconductors FeSi and FeSb2 rank in the middle of the diagram, pointing to the influence of, both, covalent and ionic characteristics.
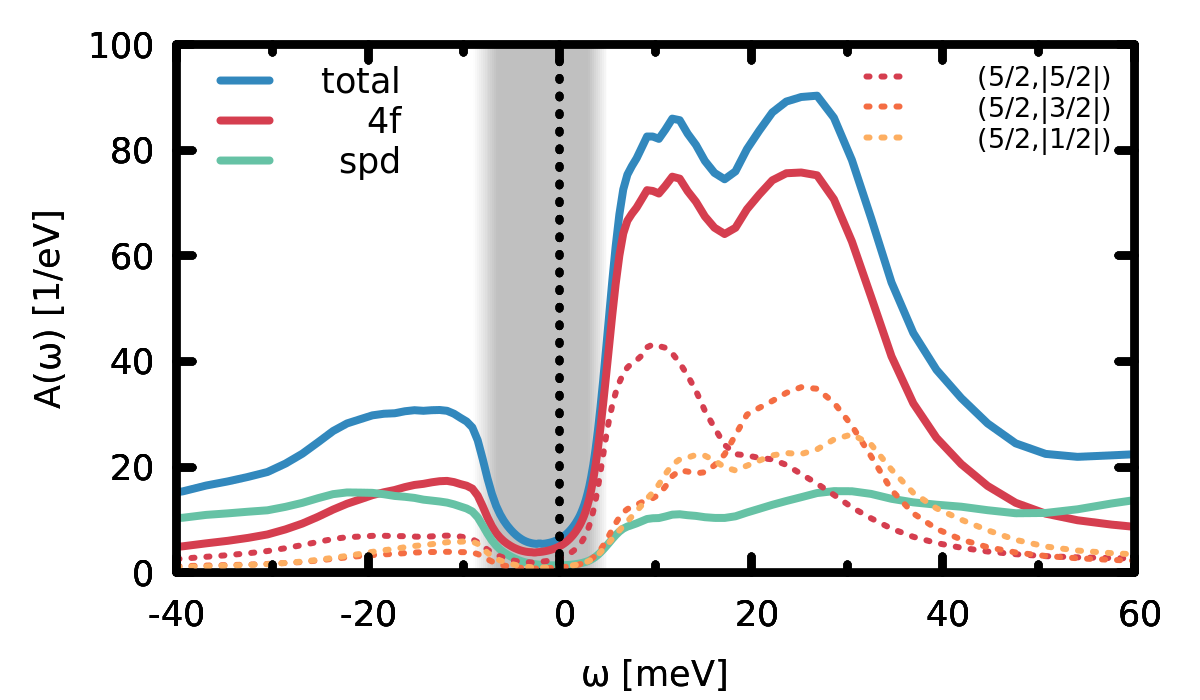
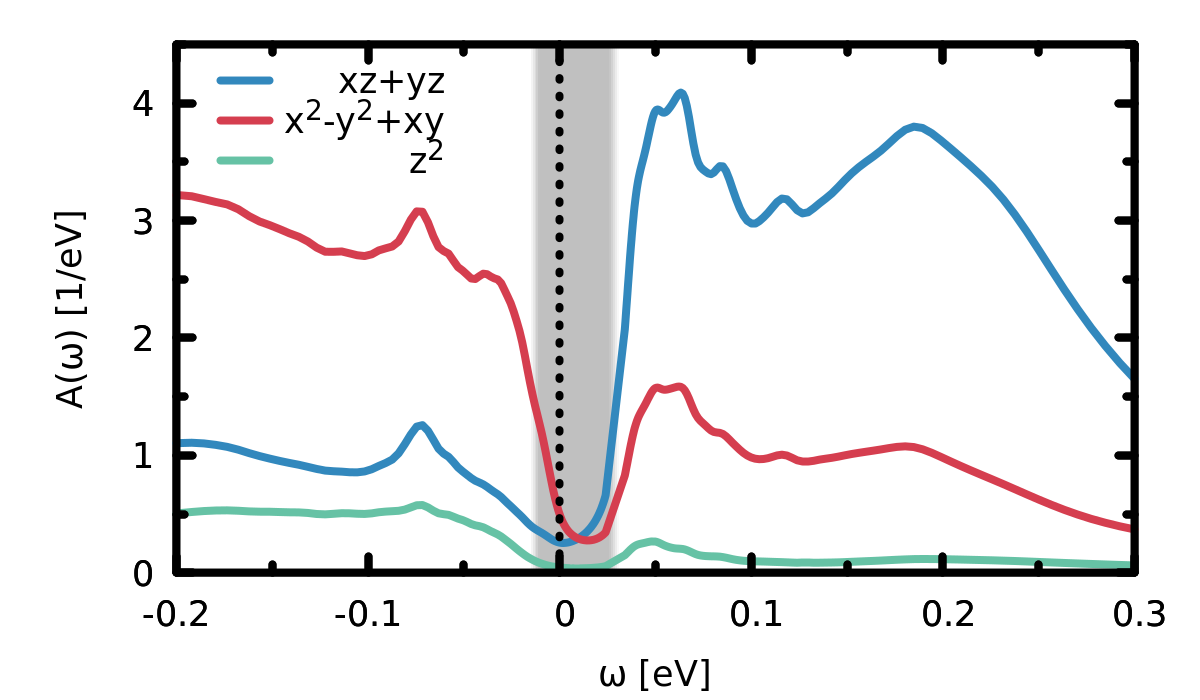
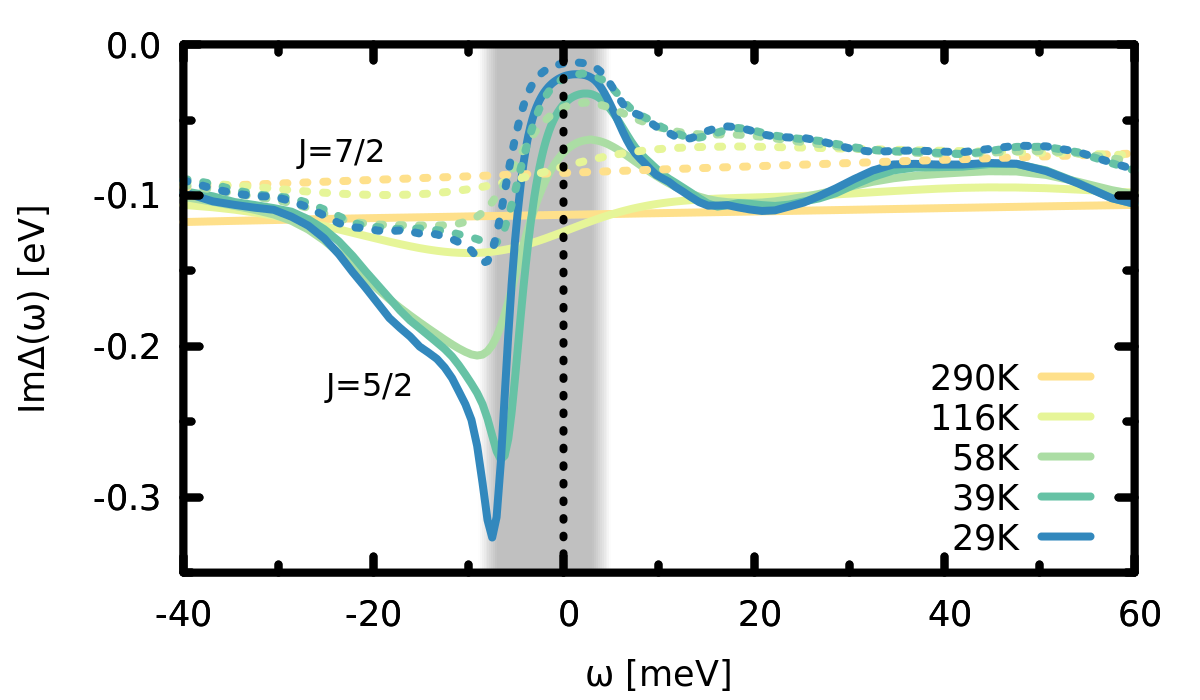
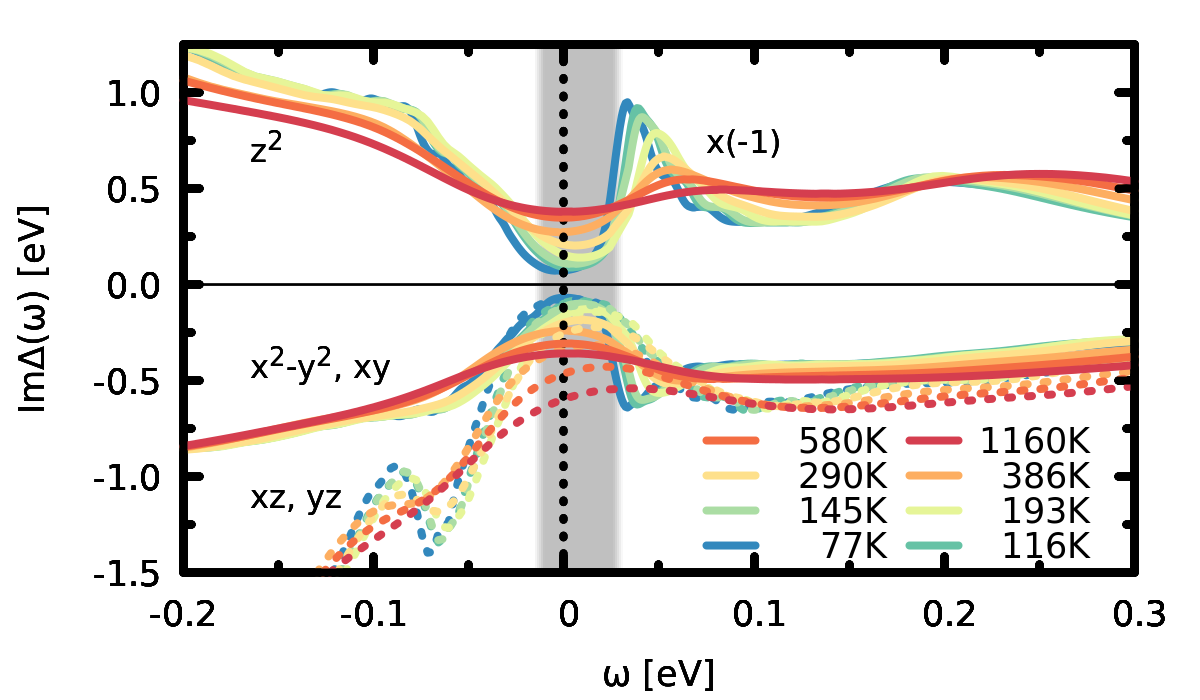
II.5.4 Comparison of the ab initio results of FeSi and Ce3Bi4Pt3.
We are now in the position to analyse and compare the realistic many-body simulations for FeSi and Ce3Bi4Pt3: Fig. (26) (a) & (b) display the respective DFT+DMFT spectral functions, , at low temperatures, resolved into relevant orbital contributions. Panels (c) & (d) show how the imaginary parts of the corresponding hybridization functions, , evolve with temperature.
In the local spectral function, we see a pronounced difference between Ce3Bi4Pt3 (left) and FeSi (right): In the heavy-fermion material, there is no orbital polarization. Indeed, both, the valence and the conduction side of the low-temperature gap are dominated by the correlated -orbitals. Furthermore, the multiplets are basically degenerate in what concerns the gap-formation. In particular, all of them have their centre of mass above the Fermi level. The gapping thus occurs similarly for all multiplets.
From the DMFT perspective, this situation is described by the development of a strong peak in the hybridization function for the components. In the many-body language, this is the building up of the Kondo effect. It restores band-like coherence below a characteristic temperature through the formation of singlet states between -electrons of the effective Ce-atom and conduction electrons from its surrounding. Seen from the low temperature (band-structure) perspective, the large is merely a way to encode—within the single-site impurity construction—the effect of inter-atomic (i.e., out-of-impurity) hybridizations, that, with growing temperature, are rendered ineffective through the emergence of local spin-fluctuations. Note that, unlike for the simple model in Section (II.5.2), the enhancement of occurs at the lower edge of the charge gap since Ce3Bi4Pt3 is strongly particle-hole asymmetric.
Contrary to Ce3Bi4Pt3, the orbital character of the valence and conduction states are not the same in FeSi. Indeed, the occupied spectrum is dominated by the Fe- orbitals, while unoccupied states derive mainly from Fe- weight. Still, all orbital components are individually gapped. We can analyse the origin of for the different orbitals from the DMFT perspective: We see that insulating behaviour of the components is realized by a hybridization function that increasingly vanishes inside the gap: There is (averaged over time) no spontaneous exchange of particles of these orbitals with the surrounding of the effective iron atom. Feature in that mark charge fluctuations only appear for energies well above gap. In the categorization of Section (II.5.1), these orbitals are hence trivially band-insulating.
The situation for the components that account for most of the valence electrons, as well as the components is more intricate. In fact, upon lowering temperature, a feature emerges in just outside the upper edge of the charge gap for both these kind of orbitals. It can be shown, that the orbitals are gapped out, meaning that the denominator of the impurity Greens function, , is finite for energies inside the gap (see Figure S1B in the supplementary material of Ref. Tomczak et al. (2012a)). While hybridizations gain coherence upon cooling, they are not responsible for the gap formation. According to our classification, Section (II.5.1), also the -orbitals are hence band-insulating. The , components, however, bear all the marks of a Kondo-insulator, as seen in Ce3Bi4Pt3: These orbitals’ spectral weight accumulates to the most part of one side of the Fermi-level, while on the other side a sharp low-energy feature develops in that suppresses states and opens a gap. In conclusion, we can call FeSi an orbital-selective Kondo insulator.
In the light of this discussion, there are three main differences between FeSi and Ce3Bi4Pt3: (1) the low-temperature gap in Ce3Bi4Pt3 is purely of Kondo-insulating nature, whereas in FeSi the origin of the gapping depends on the orbital character. (2) for orbitals in FeSi that suppress quantum fluctuations through the Kondo effect, the relevant non-local hybridization dominantly links these orbitals to other iron atoms. In Ce3Bi4Pt3, the gap-inducing hybridization connects the “impurity” Ce-- orbitals to uncorrelated, dispersive states of Bi and Pt. (3) in the case of FeSi, the origin of the destruction of asymptotic freedom with rising temperature has multi-orbital (Hund’s rule) characteristics.
II.6 Covalent insulators vs. Kondo insulators: Hubbard vs. Anderson
periodic Anderson model 2-band Hubbard model
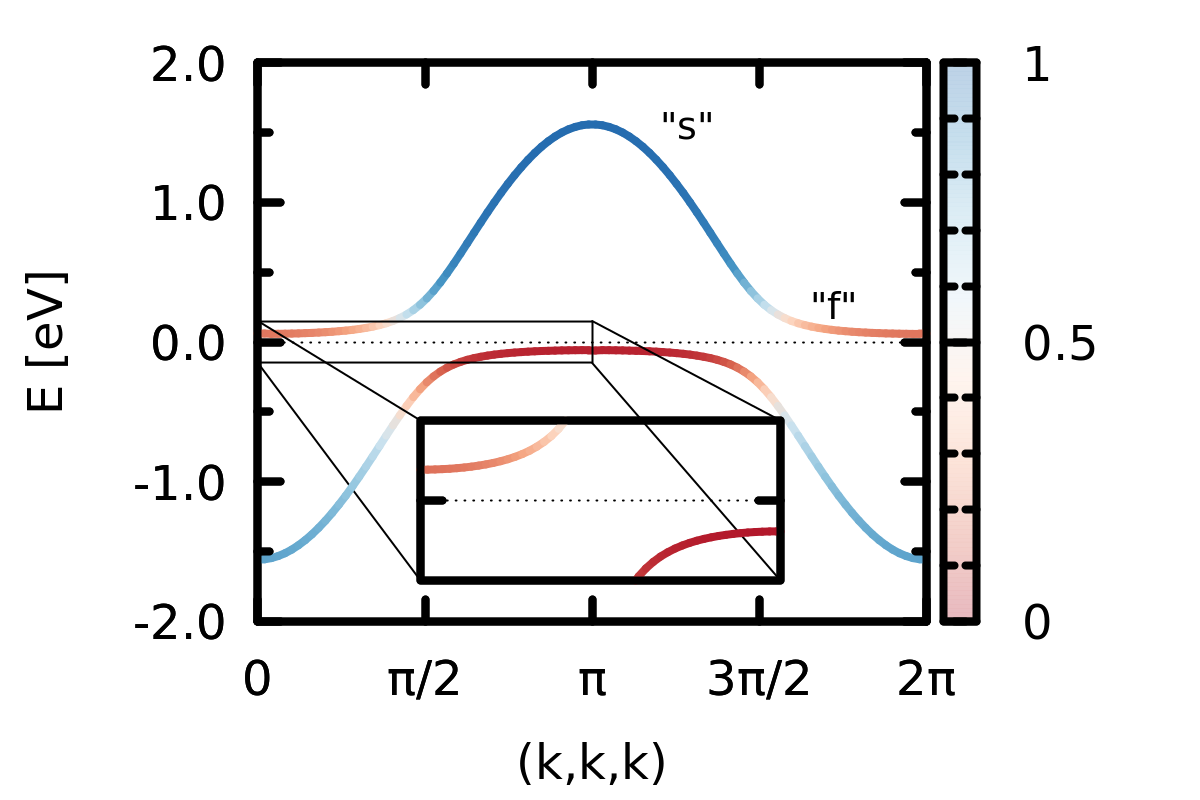
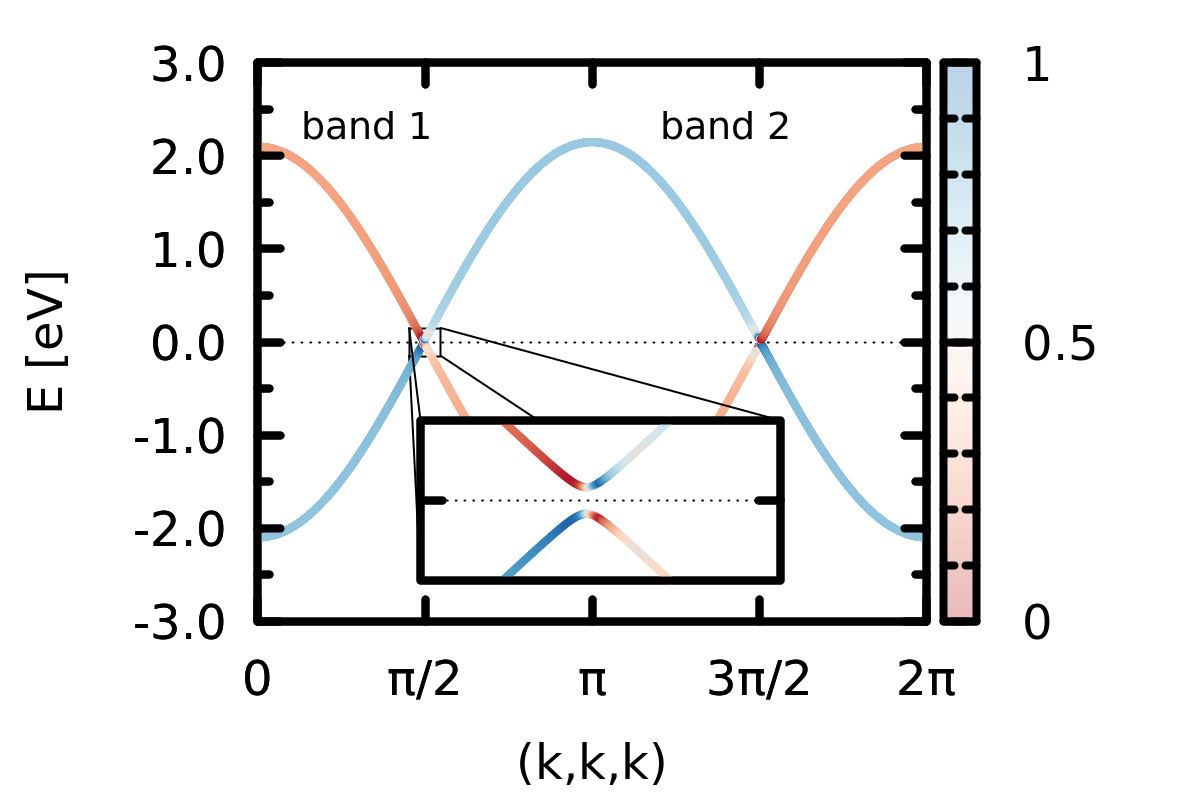
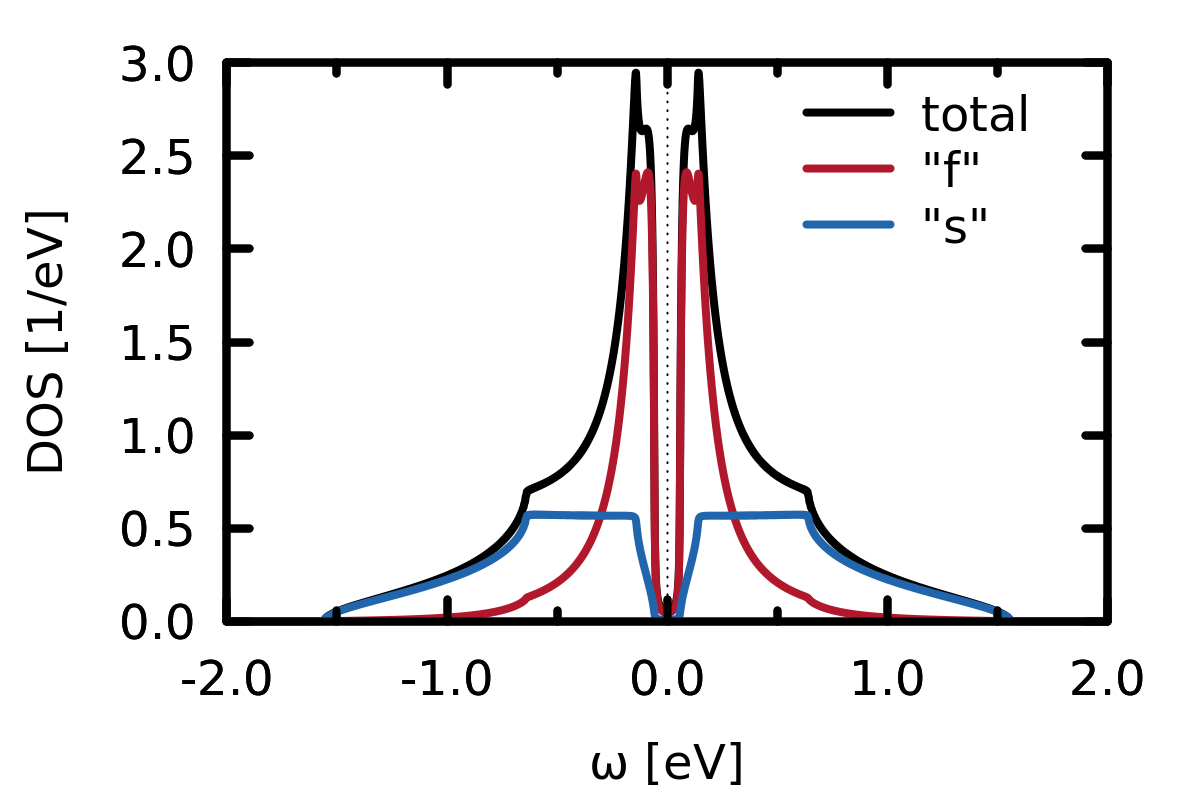
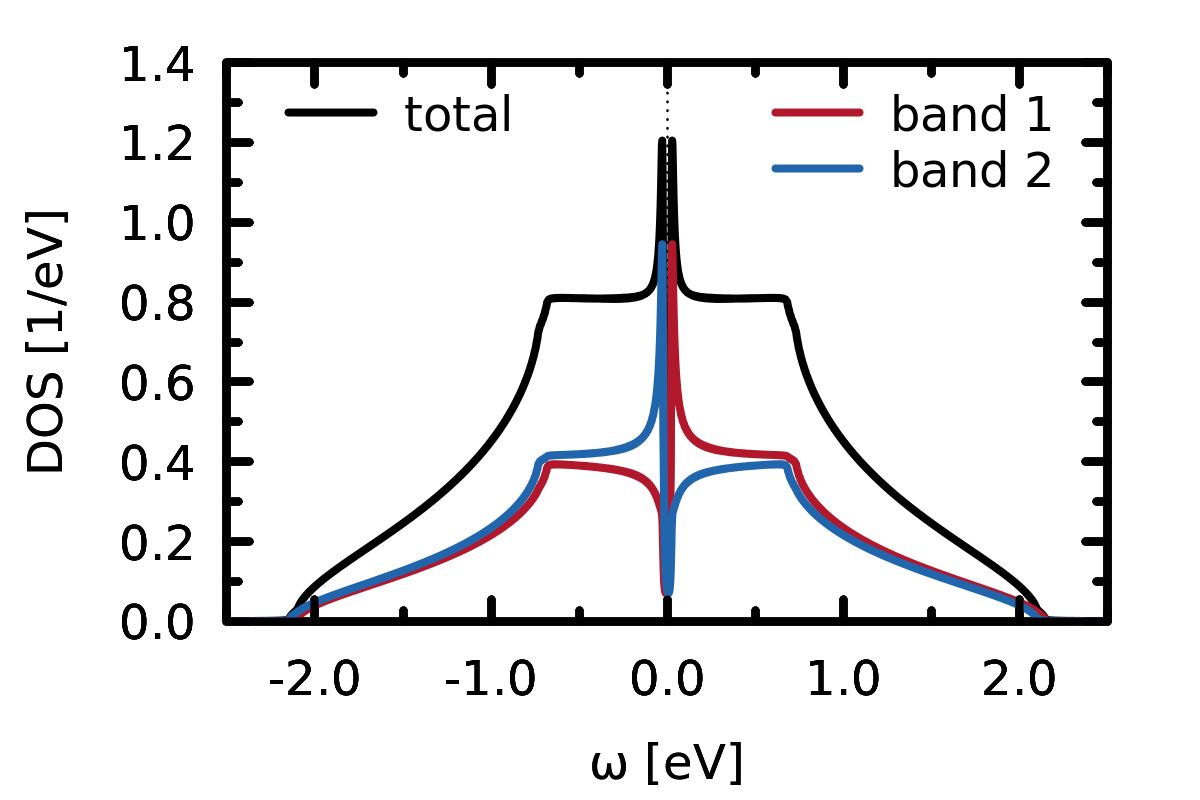
The above discussed ab initio many-body results for prototype materials of correlated narrow-gap semiconductors and Kondo insulators allowed for a quantitative description of diverse experimental observables, and helped elucidating the microscopic origin of the observed anomalous behaviour, and identified crucial parameters that control the prominence of electronic correlation effects in these system. Here, we shall briefly return to the realm of reductionist models, with the goal to put the obtained realistic results for individual compounds into a wider perspective. We will focus the discussion on a single issue, namely the crossover temperature in the susceptibility . We want to answer the question why, among correlated intermetallic semiconductors only FeSi, FeSb2, and CrSb2 display a crossover from activated behaviour to a Curie-Weiss-like decay at experimentally accessible temperatures. In Section (II.2) we already surmised why closely related compounds such as FeAs2 or RuSb2 and RuSi display less or no signatures of correlation effects. Here, we will put this analysis on a firmer footing, by studying the tendencies in both the crossover temperature and the peak value of the susceptibility for varying parameters. The models we consider are (i) a variant of a 2-band Hubbard model, and (ii) the periodic Anderson model.
II.6.1 The model Hamiltonians
(i) the 2-band Hubbard model.
We employ the Hamiltonian
| (9) | |||||
at half-filling, using a cubic lattice with nearest neighbour hopping, , a local crystal-field , and a purely non-local inter-band hybridization , . The interaction is limited to density-density terms, and we use the cubic parametrization with the Hubbard and the Hund’s rule coupling . In the non-interacting limit () the system has a direct charge gap : See Fig. (27)(a-b,right) for the dispersion and the density of states, respectively. We note that the orbital characters of the valence and conductions states at a given momentum are different, as was found for FeSi and FeSb2 within band-theory, see Section (II.2).474747See, e.g., Refs. Budich et al. (2013); Amaricci et al. (2015) for related two-band Hubbard models that explore topological effects via the inclusion of effective spin-orbit couplings.
(ii) the periodic Anderson model.
We study the PAM, Eq. (5), in its particle-hole symmetric ()484848For the interesting physics of incoherence in the asymmetric PAM see, e.g., Ref. Amaricci et al. (2012). variant with local hybridization, :
| (10) |
on the 3d cubic lattice, , at half-filling. The non-interacting dispersion and density of states are displayed in Fig. (27)(a-b, left), for a choice of parameters as indicated in the caption. While the bare direct gap is given by , the bare indirect gap is much smaller, , with the half-bandwidth of the (unhybridized) -electrons.
Note that the orbitally resolved DOS of the above defined Hubbard (periodic Anderson) model neatly captures the qualitative aspects of the gap in FeSi (Ce3Bi4Pt3). As in Ce3Bi4Pt3, both, valence and conduction states in the PAM are dominated by the -contribution. In the 2-band Hubbard model, valence and conduction bands are instead of different orbital character, akin to FeSi—compare Fig. (27)(a) to Fig. (26) (a,b).
II.6.2 Dynamical mean-field theory results.
We solve both models within DMFT, using the w2dynamics packageWallerberger et al. (2018). Here, we do not allow for any long-range order, and leave the study of ordered phase for future work. As a proxy for the experimental crossover in the spin response, we consider the maximum, , in the local (DMFT) susceptibility 494949 In the PAM the uniform and the local magnetic susceptibility practically coincide down to Yamada and Ōno (2012). For a discussion of local vs. uniform susceptibility for the Hubbard model, see Section (II.3) and Section (II.4.1).. We limit the sum over indices , to correlated orbitals and use . Fig. (28) displays (a) and (b) as a function of the Hubbard interaction for the PAM (left) and the Hubbard model (right), for different values of the bare gap .
periodic Anderson model 2-band Hubbard model
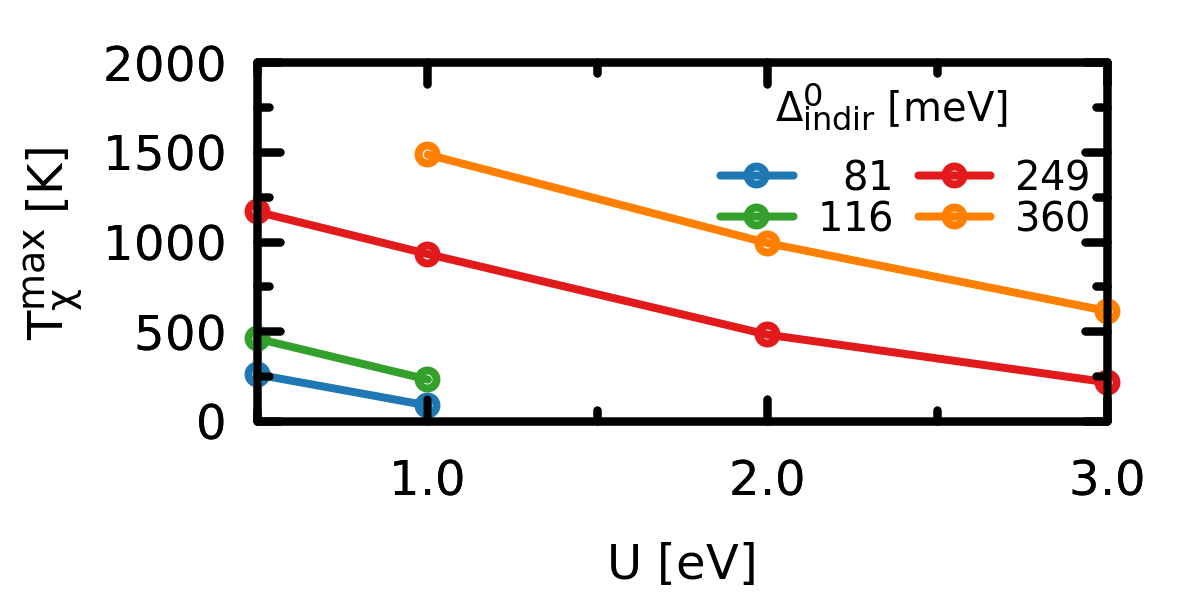
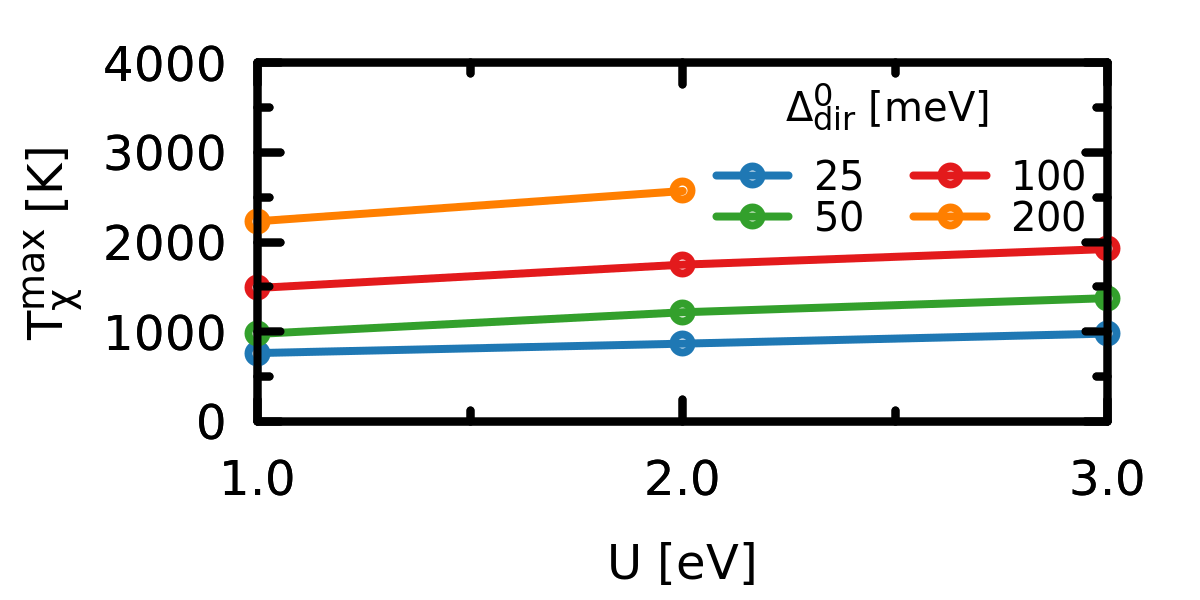
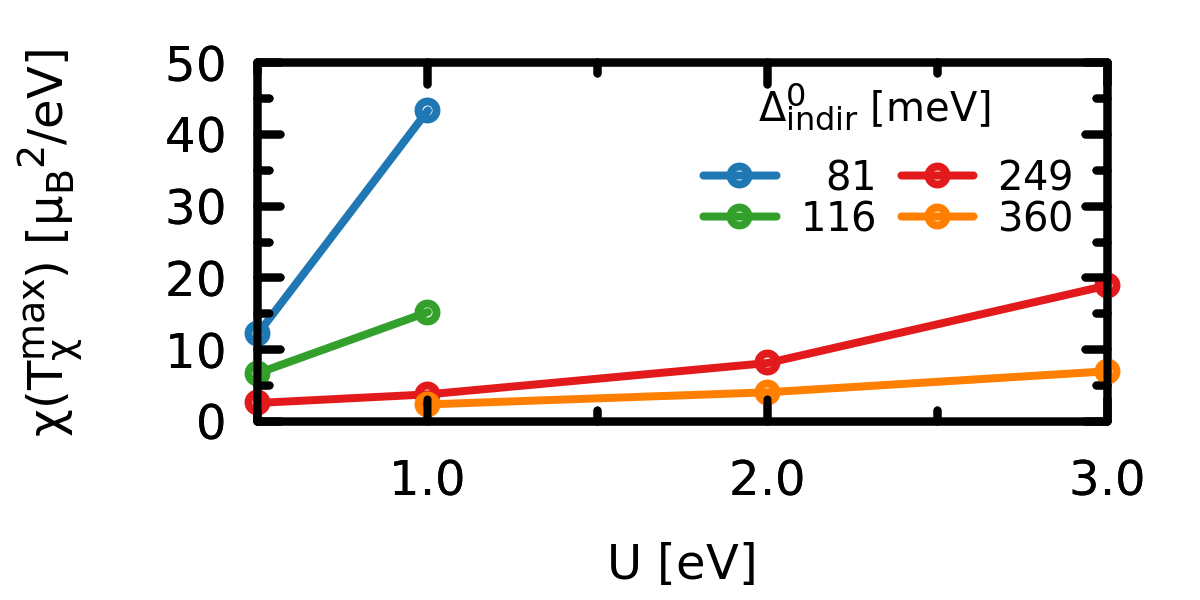
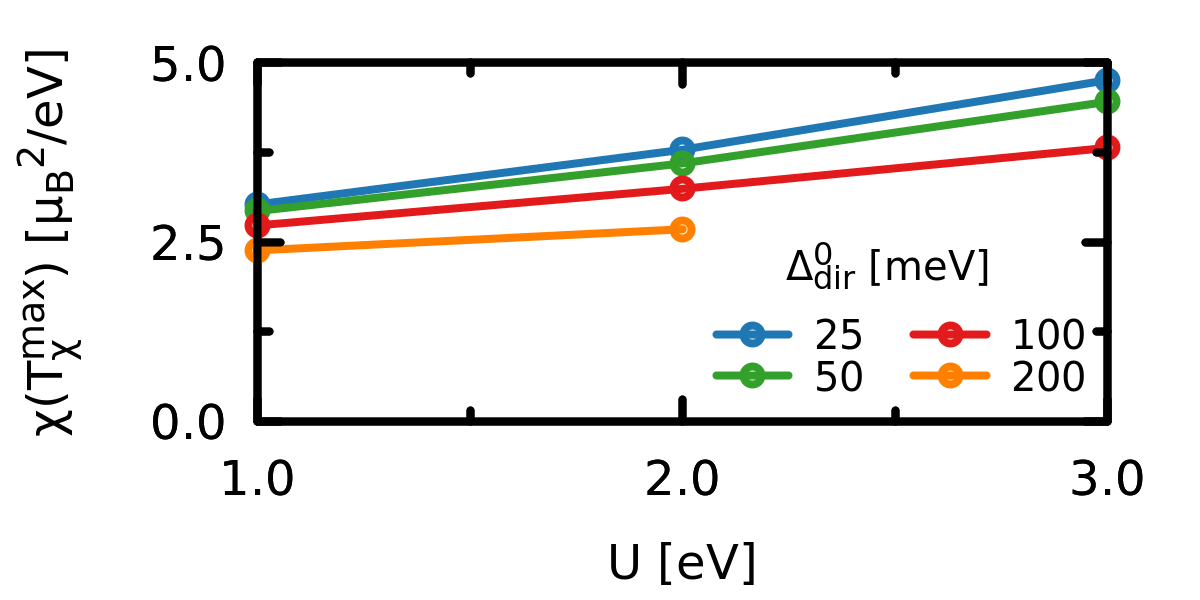
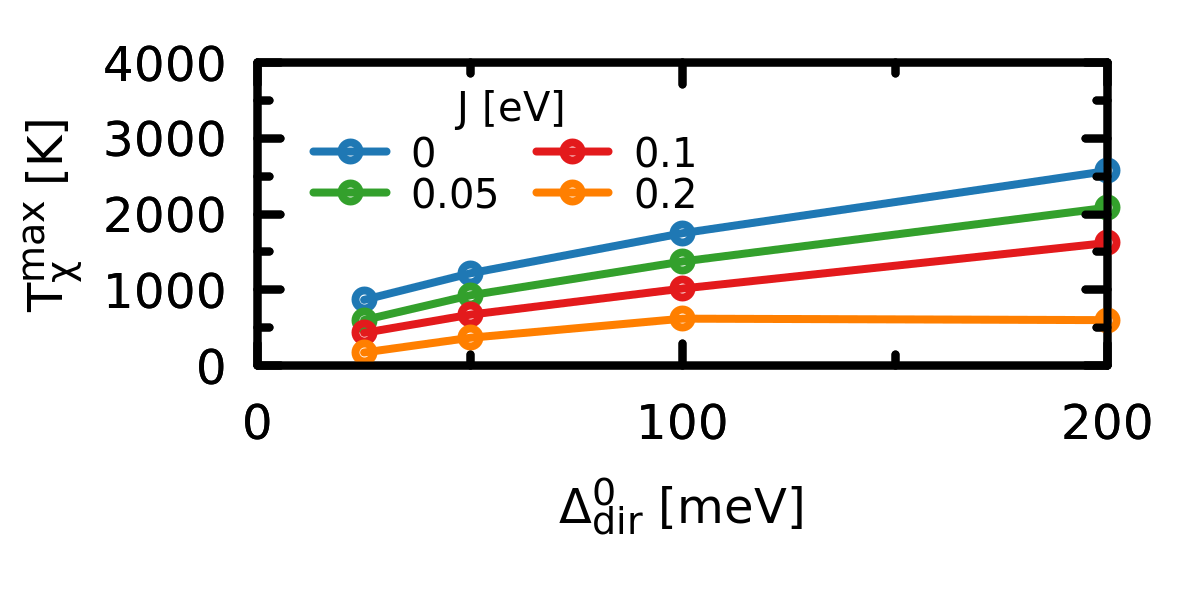
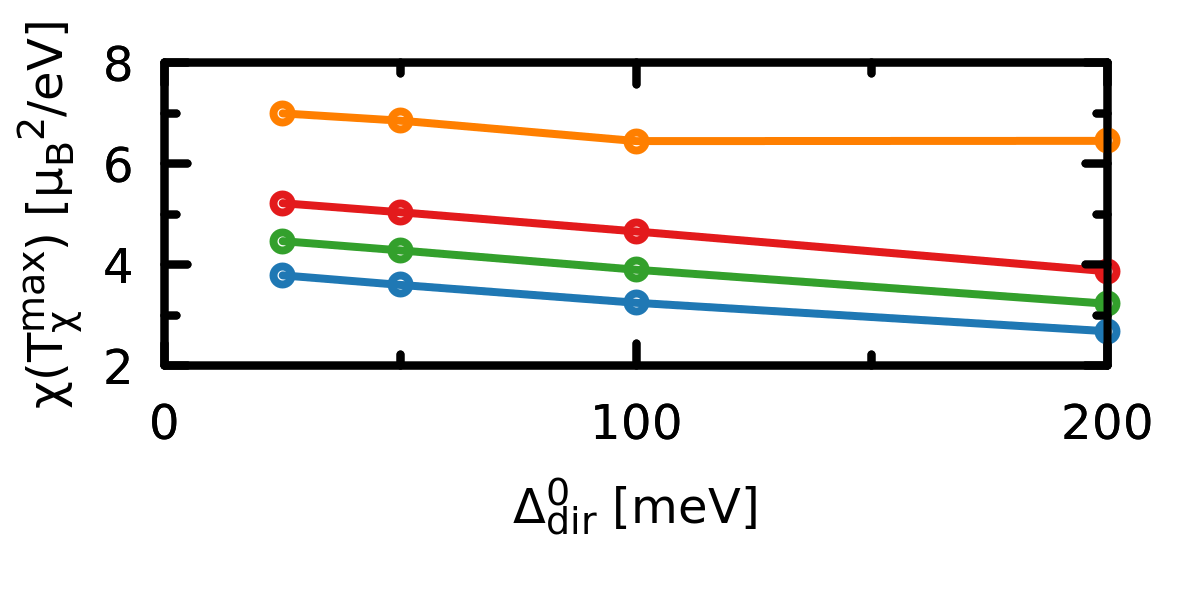
For both models, quickly becomes inaccessibly high to experiments as the gap size grows. This rationalizes, why enhanced susceptibilities cannot be seen in experiments for, e.g., FeAs2 (meV meV).
As to the influence of an increased Hubbard onto the crossover temperature, it grows slightly for the Hubbard model, while it decreases strongly for the PAM. In the Hubbard model, also the peak values of the susceptibility are quite insensitive to the Hubbard , as well as to the gap size. In the PAM, on the other hand, strongly depends on both and . This finding is congruent with the observation that the physics of Kondo insulators is more sensitive to external pressures than that of correlated narrow-gap semiconductors (see Fig. (7)). Further, as was the case in the comparison between FeSi and Ce3Bi4Pt3 in Fig. (4)(b), the susceptibility of the -levels of the PAM is much larger than for the Hubbard model. Note, however, the propensity of correlated narrow-gap semiconductors to exhibit ferromagnetic fluctuations rather than local-moment behaviour implying a uniform susceptibility larger than the local one (see, e.g., the discussion in Section (II.4.1)).
For the case of FeSi, realistic many-body calculationsTomczak et al. (2012a) evidenced, as discussed in Section (II.4.2), a strong dependence of the effective mass and the lifetime of excitations on the Hund’s rule coupling . Here we study—in the Hubbard model context—the dependence of the magnetic response on . As displayed in Fig. (29), both the crossover temperature and the peak value of the (local) susceptibility strongly depend on the Hund’s coupling. Indeed the sensitivity on is notably more pronounced than the dependence on (see above). The role of the Hund’s coupling is to strongly enhance the susceptibility and to push the Curie-Weiss-like decay to much lower temperatures. This tendency explains that while strong signatures of correlation effects are visible in the 3-compound FeSi, the 4-compounds RuSi and RuSb2 with their much smaller Hund’s rule (see table (3)), exhibit neither enhanced paramagnetism, nor Curie-Weiss-like behaviour.
Interestingly, in the Hubbard model, the magnitude (but not the crossover temperature) depends strongly on the strength of the hybridization: For a constant gap , is larger for smaller (and thus larger ), i.e., for weaker (and less dispersive) hybridizations. This is congruent with the observation that is much larger in the case of the PAM than for the 2-band Hubbard model.
In all, strong signatures of correlation effects in the magnetic response of narrow-gap semiconductors is favoured by a small gap, weak hybridizations, and a large Hund’s rule coupling. These prerequisites may explain why the discussed anomalous paramagnetic response is relatively rare. Indeed, contrary to, e.g., ubiquitous mass enhancements, the occurrence of Curie-Weiss-like susceptibilities in -electron based semiconductors has so far only been established for FeSi, FeSb2, and CrSb2.
II.7 Electron-lattice effects
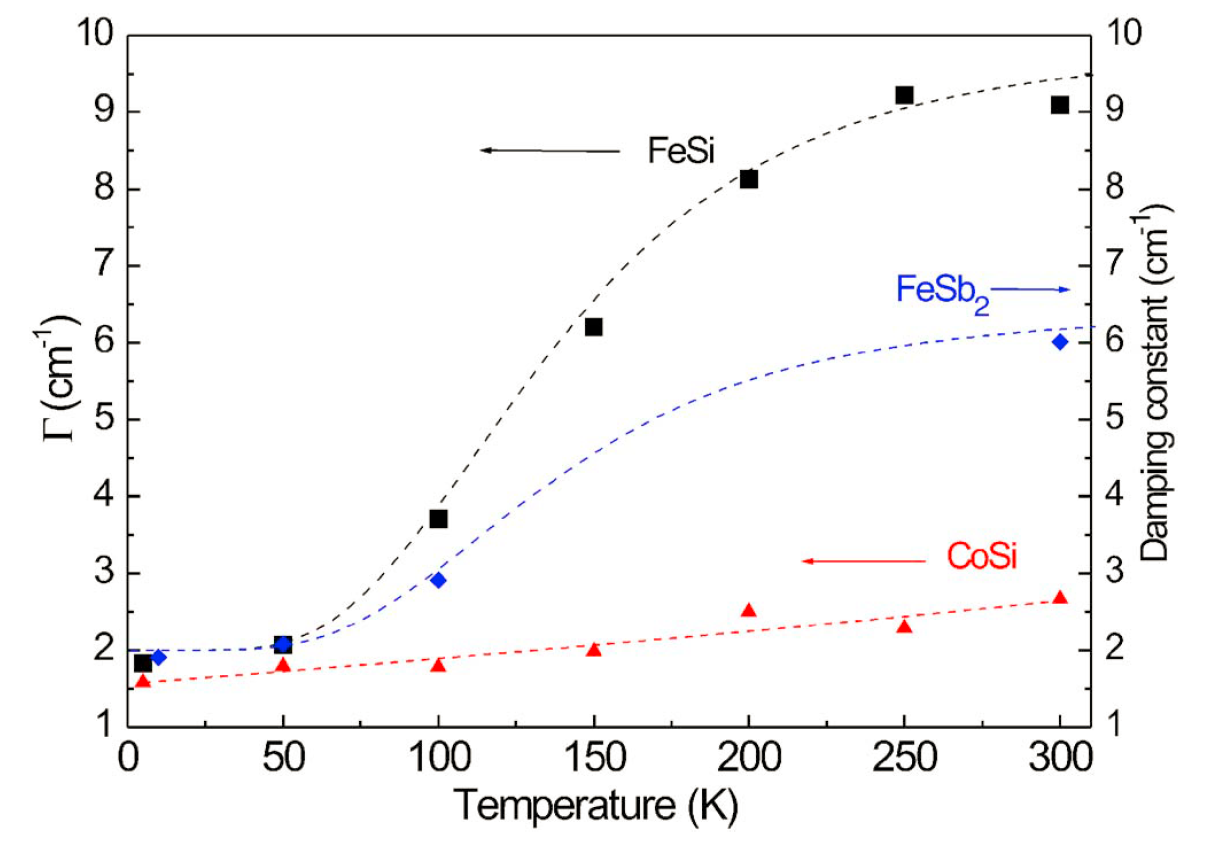
The realistic many-body calculations reviewed in the preceding sections were based on the Born-Oppenheimer approximation, i.e., there was no interplay between electronic and phononic degrees of freedom. Computations were even done for a fixed, temperature-independent lattice constant. Given the sensitivity of correlated materials to minute changes in conditions, accounting for the volume expansion in FeSi Vočadlo et al. (2002) might have noticeable results. In fact, its omission was blamed for slight discrepancies between the experimental and theoretical optical conductivity (see Section (II.4.1)). This section is devoted to such electron-lattice effects: We will review experimental evidence for large electron-phonon couplings in FeSi and FeSb2, discuss proposals for the consequences thereof for the electronic and phononic subsystems, as well as parse related ab initio calculations. The influence of phonons onto the thermopower via the phonon-drag effect will be discussed in Section (III.3) for the case of FeSb2. Let us also note in passing that phononic properties in their own right are quite interesting for some of the systems considered hereZhang et al. (2018).
II.7.1 Thermal conductivity.
Let us briefly discuss the thermal conductivity of FeSiHunt et al. (1994); Sales et al. (2011); Buschinger et al. (1997c); Ou-Yang et al. (2017) and FeSb2Bentien et al. (2007); Sun et al. (2010a, 2009a); Wang et al. (2012), both of which—according to a Wiedemann-Franz analysis—are dominated by the lattice contribution for all measured temperatures (K). Interestingly, ab initio lattice dynamics calculations of the stoichiometric materials largely overestimate the thermal conductivity for, both, FeSb2Liao et al. (2014) and FeSi, while simulations for semimetallic CoSiPshenay-Severin et al. (2017) compare well to experimentsLue et al. (2004); Pshenay-Severin et al. (2017). Even more striking is the observation that in FeSi the thermal conductivity is larger in polycrystalline samples than for single crystals by a factor of two below 100K. This is rather counter-intuitive, considering that boundary scattering is expected to suppress phonon-driven heat-conduction. Finding smaller carrier densities in polycrystalline samples, Sales et al. Sales et al. (2011) suggested that strong electron-phonon scattering is at the origin of the suppression of thermal conduction in single crystals. In the case of FeSb2, the behaviour is more conventional with thermal conduction significantly increasing for larger granularitiesZhao et al. (2011); Pokharel et al. (2013) or sample sizesTakahashi et al. (2016), see also Fig. (42).
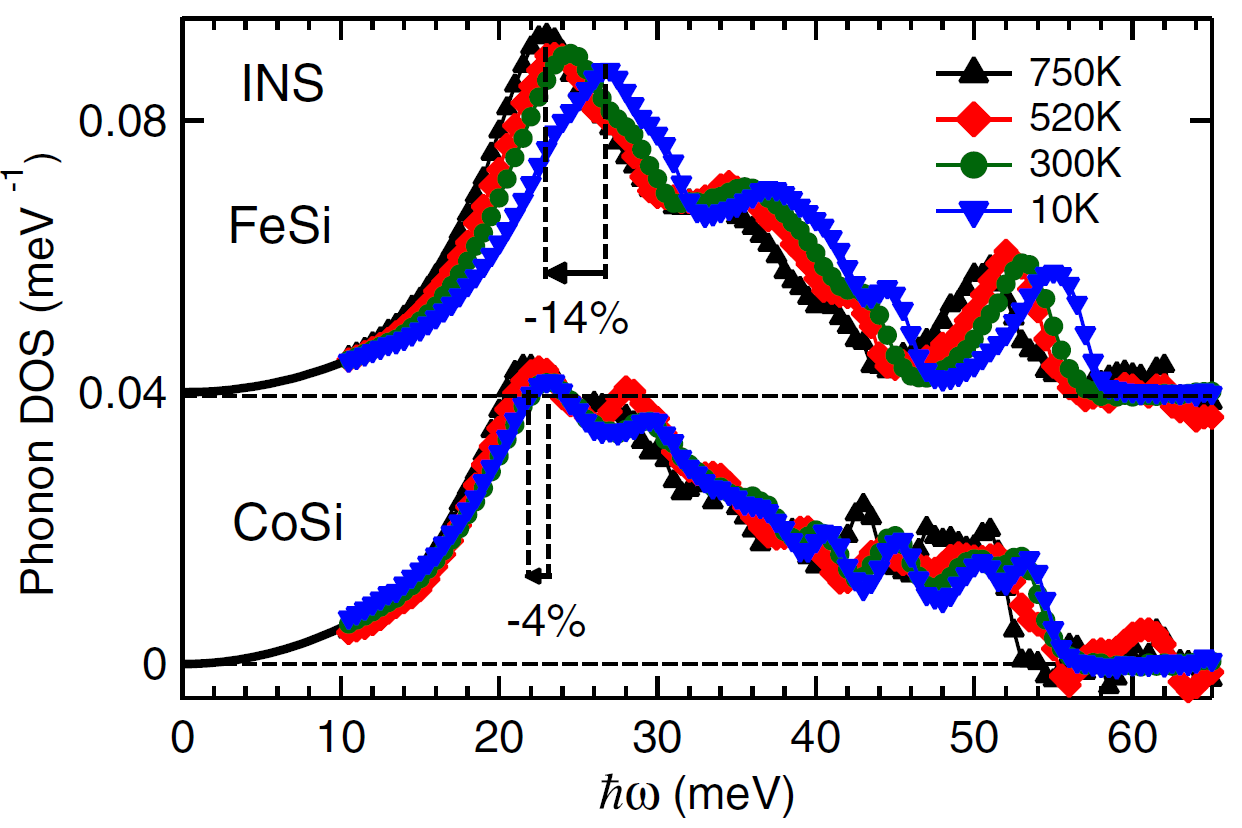
II.7.2 Phonon structure and electron-phonon coupling.
Some lattice properties such as the bulk modulus have already been discussed in conjunction with failures of band-theory for FeSi in Section (II.2.1). In that compound, unusual behaviour is also seen in other static lattice properties, such as elastic constants that exhibit an anomalous softening above Petrova et al. (2010).
We now turn to dynamical lattice properties. Individual phonon modes can be studied by Raman and infrared spectroscopy. Results for FeSiDamascelli et al. (1997b); Menzel et al. (2006); Racu et al. (2007, 2008); Menzel et al. (2009); Ponosov et al. (2016) and FeSb2Racu et al. (2008) indicate a notable softening of phonon modes and a strongly increasing phonon-linewidth (shown in Fig. (30)) upon heating above K. These effects were interpreted as arising—via the electron-phonon coupling—from the metallization of FeSi above K. This crossover provides for electron-phonon scattering events—absent in an insulator—and reduce the lifetime of phonons. An analysis of the phonon lineshapes in Raman spectra by Racu et al. Racu et al. (2007) indeed pinpointed electron-phonon and not phonon-phonon interactions to be at the origin of the temperature-induced broadening.
The phonon density of states can be accessed from inelastic neutron scattering (INS) and nuclear resonant inelastic scattering (NRIS) experiments. In a seminal workDelaire et al. (2011a), Delaire et al. presented a comprehensive INS study for FeSi in comparison to CoSi: They found that the phonon softening in the metallic CoSi, which is of moderate 4% (in the range of 10-750K), can be fully accounted for by the temperature-induced volume expansion. Indeed, using experimental thermal expansion data, the experimental softening is congruent with computations in the quasi-harmonic approximation, and more sophisticated ab initio molecular dynamics simulations give similar results. In the case of FeSi, an inspection of the thermal expansion would suggest a phonon softening of a magnitude, 5%, comparable to CoSi. Instead, Delaire et al.Delaire et al. (2011a) found in FeSi a softening three times as large: 14%. At low temperatures, the phonon dispersions of FeSi are in reasonable agreement with DFT calculations Delaire et al. (2011a); Sales et al. (2011). Above K, molecular dynamics simulations still give a good description, while the quasi-harmonic approximation now fails to account for the observed softening of phononic dispersions, strongly suggesting a mechanism linked to the electronic degrees of freedom.
Parshin et al. Parshin et al. (2014) used the NRIS technique and resolved the fine structure of the partial phonon DOS associated with the vibration of iron atoms. Moreover, they were able to extract phonon linewidths: Congruent with the Raman and optical spectroscopy, these increase notably above 150K.
The empirical connection between phonon energies and temperature-induced changes in the electronic dispersion has been illustrated by Delaire et al., see Fig. (32):
-
1.
If there is no notable rearrangement of the electronic density of states at the Fermi level, phonon energies are modified only through the thermal volume expansion, and the quasi-harmonic (QH) approximation captures the associated mode softening.
-
2.
If the system evolves from a gapped electronic spectrum at low temperature to a state with finite weight at the Fermi level at high , an anomalous softening beyond the QH approximation occurs, in conjunction with a broadening of phonon linewidths. The former is caused by electronic screening of inter-atomic potentials, while the latter originates from electron-phonon scattering. This behaviour is seen in FeSi (see above) and FeSb2Zaliznyak et al. (2014), as well as Nb3Sn where the low-temperature gap is owing to superconductivityAxe and Shirane (1973). Similar effects are also seen when metallizing FeSi through dopingDelaire et al. (2015).
-
3.
Conversely, if the electronic density at the Fermi level decreases with temperature, e.g., as a consequence of a (heavy) Fermi liquid losing coherence, a stiffening of phonons is expected as force constants get unscreened. This phenomenon was indeed observed in V-based A15 compounds Delaire et al. (2008a), as well as bcc V-based alloysDelaire et al. (2008b).
II.7.3 Influence of vibrations onto the electronic structure.
While these scenarios suggest a large influence of the electronic structure onto the phonons, lattice vibrations may conversely modify the electronic structure. Indeed, via the electron-phonon coupling, the thermal activation of phonons provides scattering channels that may decrease the lifetime of electronic excitations. Given that FeSi metallizes through the occurrence of incoherent spectral weight at the Fermi level, lattice vibrations can at least accelerate the crossover to the metallic state.
Looking at the literature of FeSi, the interplay of electrons and phonons could be interpreted as a chicken-and-egg questions: Does the phonon system merely react to the (correlation-induced) evolution of the electronic and magnetic degrees of freedom, or are lattice vibrations themselves a major driver of the metallization? Both standpoints have been forwarded on the basis of experimental and theoretical studies:
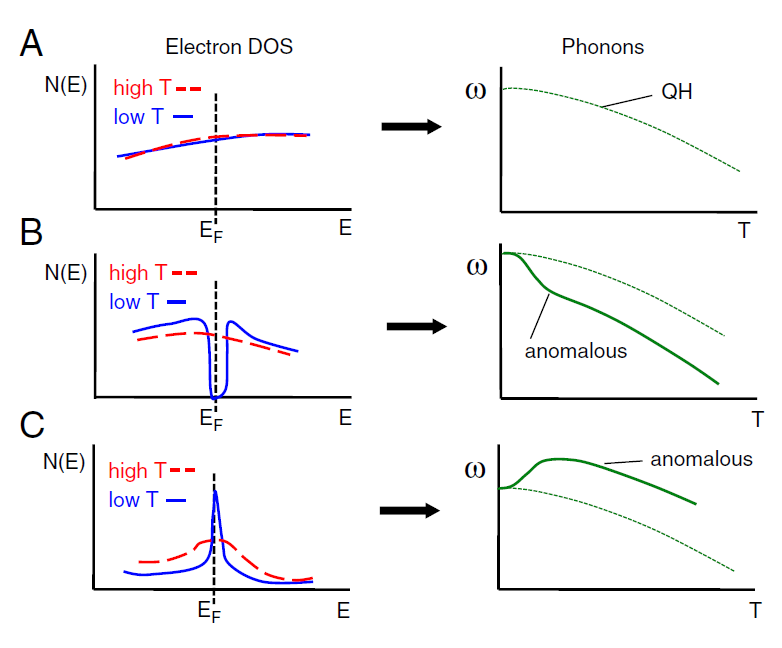
Thermal disorder.
Jarlborg Jarlborg (1999, 1997a, 2007, 1997b) pioneered the view that lattice properties are predominantly responsible for the insulator-to-metal crossover in FeSi.505050The metallization of a Kondo insulator via the electron-phonon coupling was studied theoretically e.g., in the Holstein-Kondo lattice model by Nourafkan and NafariNourafkan and Nafari (2009). Using a static supercell approach with a Gaussian distribution of atomic displacements, he evidenced a gap closure at around 300K, found an increasing magnetic susceptibility of reasonable magnitude (at least when including exchange enhancement factors of 3.5-6), a sensible specific heat, as well as spectral weight transfers in the optical conductivity over a range of more than 3.5eV. This thermal disorder picture was later supported by the molecular dynamics (MD) simulations of Delaire et al. Delaire et al. (2011a). Moreover, investigating the effect of thermal disorder on inter-atomic force constants, Stern and Madsen Stern and Madsen (2016) concluded that thermal disorder in conjunction with the thermal expansion can explain most of the anomalous softening of acoustic phonon branches.
A few comments are in order: (i) in the MD calculationsDelaire et al. (2011a) FeSi metallizes only for temperatures reaching the order of , congruent with the mean-square average of atomic displacements being controlled by . Experimentally, FeSi already metallizes for temperatures corresponding to a much smaller fraction of the gap. (ii) the thermal disorder induces changes in the electronic structure on all energy scales, explaining why, in this scenario, optical weight is redistributed over large energy scales. However, the optical spectral weight redistribution (cf. Section (II.4.1)) is, in the thermal disorder picture, a monotonously increasing function of energy up to 3.5eVJarlborg (2007), contrary to experimental findings (cf. Fig. (19)).515151See also Ref. Tomczak and Biermann (2009b) for a system with large electron-phonon coupling, where optical spectral weight transfers have been quantitatively described without accounting for thermal disorder. (iii) the thermal disorder picture is unlikely to explain the occurrence of the Curie-Weiss-like decay in the magnetic susceptibility at high temperatures.
Magneto-elastic coupling.
An interesting proposal comes from Krannich et al. Krannich et al. (2015): Using inelastic neutron and neutron resonant spin-echo spectroscopy, the authors evidence that in FeSi the relative change with temperature of both the phonon linewidth and the phonon intensity neatly tracks the relative evolution of , with being the uniform magnetic susceptibility. The latter can be interpreted—in a local moment picture—as the square of an effective fluctuating magnetic moment (cf. the discussion in Section (I.2.2) and Section (II.1)). This empirical observation strongly suggests a direct link between the emergence of (ferro)magnetic fluctuations and the phonon self-energy.525252Note that also in the Kondo insulator YbB12 a coupling between magnetic and phononic properties was suggestedRybina et al. (2007); Alekseev et al. (2012): While no perceptible phonon softening occurs above the system’s coherence temperature K, the phonon intensity of modes (whose symmetry is thought to be commensurate with that of relevant magnetic excitationsAlekseev et al. (2012)) significantly drops around . Using density functional perturbation theory in conjunction with a phenomenological broadening of the electronic DOS to mimic an incoherence-driven metallization the authors computed phonon linewidths. Finding a significantly too small scattering rates (1meV vs. the experimental 3-5meV), they concluded that a metallization in the absence of magnetic fluctuations cannot account for the observed phonon line-broadening. As far as the phonon energies are concerned, Krannich et al. Krannich et al. (2015) found that the softening (of phonons at the R point in the phonon Brillouin zone) can be grouped into three temperature regimes: (i) at low temperatures the quasi-harmonic approximation applies, (ii) above 100K a regime of substantially increased softening occurs, (iii) above 300K the softening resumes a rate similar to regime (i). This behaviour is shown schematically in Fig. (32) (B, right) and suggestively coincides with the insulating, crossover, and metallic regime witnessed in spectroscopies probing charge degrees of freedom as well as transport properties.
The phonon spectator picture.
Parshin et al. Parshin et al. (2016a, b) performed nuclear inelastic scattering experiments of FeSi as a function of temperature and under pressure. The rational behind this experiment is to disentangle the effects of (i) an increasing amplitude of atomic vibrations with raising temperature from (ii) the thermally induced volume expansion. Loosely speaking, pressure is used to reduce the volume to a value that is otherwise realized at lower temperatures.
As previously evidenced Parshin et al. (2016b) the lowest peak in the phonon DOS has a sudden increase when heating above K. Parshin et al. interpret as the critical temperature of the electronic subsystem, i.e., the characteristic scale for which the metallization occurs. Applying pressure to FeSi at room temperature, a phonon DOS comparable to that at K (and ambient pressure) is obtained at GPaParshin et al. (2016a). Comparing the two cases—(i) K, GPa and (ii) K, GPa—the crucial observation is that what is similar at both conditions is the unit-cell volume, while the mean-square amplitude of atomic vibrations, , is largely different. This finding has led Parshin et al. to dismiss the thermal disorder picture (which is driven by ) and to assign the change in unit-cell volume (instead of the phonons) as the dominant lattice contribution to the insulator-to-metal crossover in FeSi. In that sense, the influence of the lattice is a static one, while phonons are mere spectators, not actors, to the metallization crossover. It should be noted, however, that the electronic degrees of freedom in the cases (i) and (ii) are not quite identical: While pressure reduces the magnetic susceptibility, it is unlikely that the value of at K and ambient pressure is reached by applying 2GPa at KKoyama et al. (1999). Moreover, while pressure increases the gap in activation-law fitsBauer et al. (1997); Mani et al. (2001), pressure does not undo the effects of increasing temperature from 180 to 300K in the resistivityMani et al. (2001). Also, it should be noted that from the electronic point of view (see the optical conductivity in Fig. (5)(b)), as well as the Raman linewidth (see Fig. (30)), the reference temperature K is already far above the metallization threshold.
Synthesis.
In most of this chapter we have described theories that focus on the aspect of electronic correlation effects to describe the anomalous electronic, optical and magnetic properties of certain narrow-gap semiconductors. In this section we have instead reviewed experimental evidence, as well as some theoretical investigations that point to strong signatures of the electronic crossover in the phonon subsystem. To which degree the changes in the lattice degrees of freedom are a consequence of the electronic crossover, or vice versa, is an unresolved issue. It is the author’s opinion that effects of electronic correlations and the electron-phonon coupling, to an extent, conspire in causing the insulator-to-metal crossover. Yet, the anomalous magnetic behaviour in FeSi and related systems may signal that the prevailing role is played by electronic correlation effects. A full description of the coupled electron-phonon system is, however, still lacking. Indeed the interplay of electronic correlations and lattice degrees of freedom beyond the Born-Oppenheimer approximation is a challenging avenue for future research.
Theories of correlated narrow-gap semiconductors: key points
-
•
signatures of correlation effects in diverse observables can be quantitatively captured with realistic many-body simulations.
-
•
insulator-to-metal crossovers are linked to incoherence induced by (ferromagnetic) spin fluctuations.
-
•
lifetimes and effective masses in -electron-based insulators are propelled by Hund’s physics.
-
•
Kondo-insulating (covalent) behaviour can coexist with the suppression of quantum fluctuations by local crystal-field (ionic) physics. Indeed, we propose an orbital-selective Kondo insulator scenario for FeSi.
-
•
important interplay of electronic and lattice degrees of freedom.
III Thermoelectricity
The topic of this chapter is thermoelectricity in correlated narrow-gap semiconductors. We begin Section (III.1) with a brief general introduction into the field of thermoelectrics: We introduce relevant quantities, and review in Section (III.1.1) current efforts to improve thermoelectric performance. More details can be found in excellent books, e.g., Refs. Zlatic and Monnier (2014); Behnia (2015), or review articlesPichanusakorn and Bandaru (2010); Shakouri (2011); Behnia and Aubin (2016); Shi et al. (2016); Tan et al. (2016); Zhu et al. (2017); He and Tritt (2017). section (III.1.2) then gives an overview over potential impacts of electronic correlations onto thermoelectricity. To explore the effects of simple many-body renormalizations onto the thermopower of a semiconductors, Section (III.1.3) discusses an instructive analytical model. As a by product of the latter, it is recapitulated that the thermopower owing to electronic diffusion has an upper bound in a coherent semiconductor. Including effects of incoherence—ubiquitous in correlated materials—is shown to dramatically change transport properties, to the effect that semi-classical Boltzmann approaches fail to describe them, as discussed in Section (III.1.4).
This prelude sets the stage for the discussion of thermoelectric effects in the material classes that are the subject of this review. As in the previous chapters, we shall pick representative materials for each class and review experimental findings and theoretical efforts to describe them. Each subsection will discuss and highlight different aspects of electronic correlations and their impact on thermoelectricity:
-
•
Silicides, Section (III.2): effects of incoherence and effective masses onto the thermopower.
-
•
Marcasites, Section (III.3): limits of a purely electronic picture of thermoelectricity, the phonon-drag effect, couplings of phonons to charge carriers with large effective masses.
-
•
Skutterudites, Section (III.4): large consequences of unreliable electronic structure calculations.
-
•
Heuslers, Section (III.5): materials on the verge of thermoelectric particle-hole symmetry, impact of defects and disorder.
Besides the materials discussed here, there are numerous other classes of compounds that are of interest from the thermoelectric point of view, while at the same time probably hosting at least moderate correlation effects. Among these materials are half-HeuslersBos and Downie (2014), other 4 transition-metal intermetallics, pnictides, and chalcogenidesGonçalves, Antonio P. and Godart, Claude (2014) not covered here, complex oxides, sulfides, and selenidesHébert et al. (2016).
III.1 General considerations
Thermoelectricity is the effect of a voltage drop occurring across a sample that is subjected to a temperature gradient —or vice versa. The most common mechanism of thermoelectricity is the net diffusion of electrons (or holes) from the hot toward the cold regions of the sample. The displaced charges build up an electrical field that counteracts the diffusion, which defines, at equilibrium, the Seebeck coefficient , also known as the thermopower. The materials’ properties that govern the efficiency of a thermoelectric conversion process—leading to electricity generation, or refrigeration—can be gathered into the so-called dimensionless figure of merit . Besides the thermopower , relevant quantities are the conductivity and the thermal conductivity .535353The minimal realization of an actual thermoelectric device consists of a thermocouple made of two materials. Then the overall figure of merit becomes for the average temperature Ioffe (1960). Nonetheless, an individual material’s still gives a good indication as to its potential thermoelectric performance. As a rough guide, needs to be above unity—roughly corresponding to a conversion efficiency of 10-15% at high temperatures—to be of any technological interest. The combination that enters is referred to as the power factor. It is apparent that an optimization of the latter requires satisfying conflicting demands. This dilemma is illustrated in Fig. (33) where we display the typical dependency of relevant quantities on the carrier concentration: The thermopower is typically large in insulators ( with the gap , see also below, Eq. (17)) and small in metals (where, at low T, ). The conductivity, on the other hand, is large in metals and exponentially suppressed in insulators. Hence, the power factor is largest in between, at densities corresponding to degenerate semiconductors. The thermal conductivity, , consists of an electronic and a phononic part. While in metals the electronic contribution is preponderant, in the doped semiconductor regime the lattice contribution by far dominates the detrimental thermal conduction and severely limits .
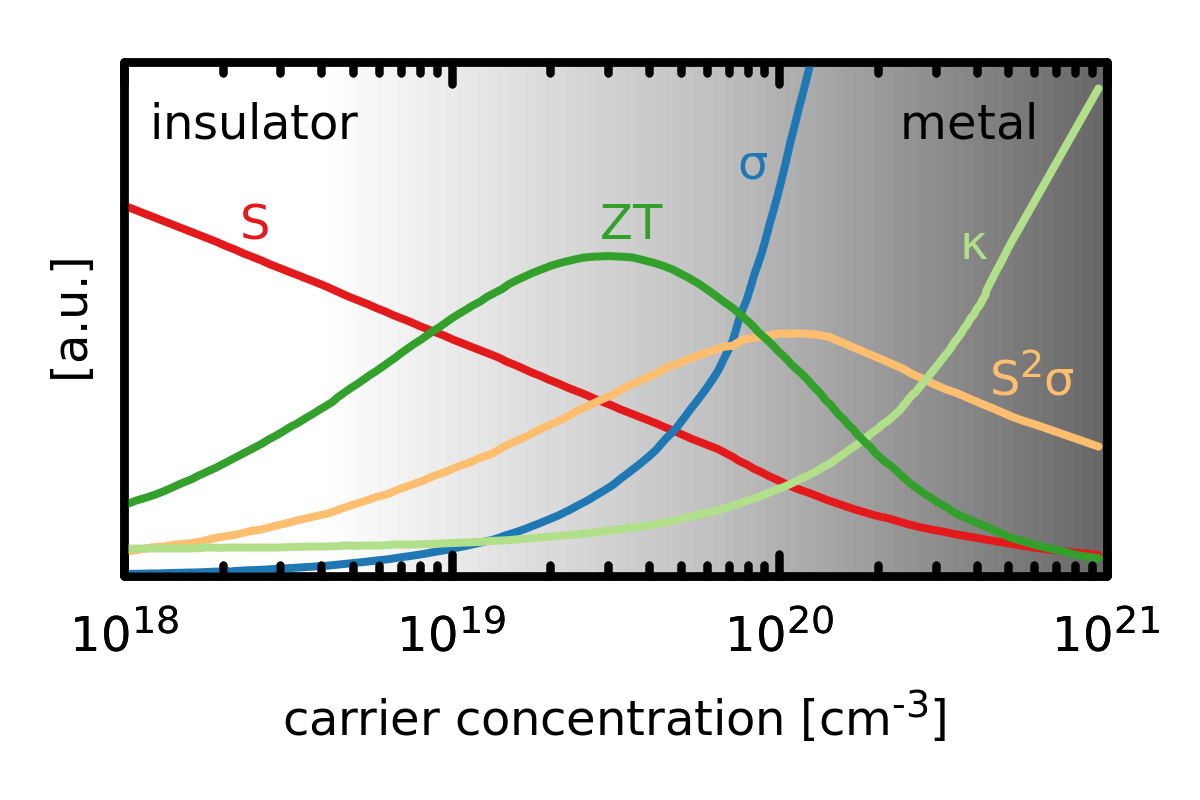
The conductivity and the thermopower can be expressed, e.g., in the Kubo linear response formalism. One findsPálsson and Kotliar (1998); Pruschke et al. (1995); Oudovenko and Kotliar (2002); Tomczak et al. (2010a)
| (11) |
where545454if neglecting electron-hole interactions, so-called vertex-corrections. the response functions are
| (12) |
Here, is the Boltzmann constant, the inverse temperature, the Fermi function, and the chemical potential. The trace goes over orbital indices and the Fermi velocities, , and the spectral functions, , are matrices in orbital space. Further, has an orientational -dependence, which turns both and into tensors, whose elements depend on the Cartesian directions , of the temperature gradient and the electrical field, respectively.
III.1.1 Optimizing thermoelectric performance.
To increase thermoelectric efficiencies two main avenues are currently pursuedDresselhaus et al. (2007); Snyder and Toberer (2008); Yang et al. (2016); Gayner and Kar (2016):555555For interesting proposals that are beyond this classification see, e.g., the recent Refs. Sun et al. (2015); Zhao et al. (2017).
Phonon engineering.
Following the “phonon-glass, electron crystal” paradigmSlack (1995), the dominant lattice thermal conduction is sought to be limited by disordered unit-cellsSnyder and Toberer (2008), structuring samples on the nanoDresselhaus et al. (2007); Pichanusakorn and Bandaru (2010) and the mesoscaleBiswas et al. (2012), introducing geometric constraints via superlattices Hicks and Dresselhaus (1993a); Touzelbaev et al. (2001); Beyer et al. (2002); Heremans et al. (2013) or nanowiresHochbaum et al. (2008); Boukai et al. (2008), or including loosely bound “rattling” atoms/modesSlack and Tsoukala (1994); Nolas et al. (1996); Sales et al. (1997); Nolas et al. (1998); Voneshen et al. (2013). The global rationale is to introduce phonon scattering channels on length scales that are long compared to the electronic mean-free path. Therewith, while reducing detrimental thermal conduction, the electronic powerfactor ideally is unhampered. This strategy of phonon engineering is bounded by the physics of the amorphous limit, yet it has led to significant progress, yielding values in excess of 2. A further route to reduce are enhanced phonon-phonon scatterings owing to anharmonicitiesShiga et al. (2012); Zhao et al. (2014) linked to, e.g., ferroelectric lattice instabilitiesDelaire et al. (2011b); Li et al. (2015); Hong and Delaire (2016); Ribeiro et al. (2018).
Band engineering.
The second major strategy is the enhancement of the power factor, i.e., an optimization of the electronic degrees of freedom.565656See, however, Section (III.3) and e.g., Refs. Battiato et al. (2015); Zhou et al. (2015) for a phonon-mediated contribution to the thermopower. Besides reaching an optimal compromise between the thermopower and the conductivity (see Fig. (33)), the crucial observation is that the thermopower (somewhat akin to the Hall coefficient) is sensitive to the type of charge carriers. Indeed vanishes for particle-hole symmetric systems and increases the more asymmetric the electronic spectrum is. A large particle-hole asymmetry can be achieved by a variety of mechanisms, e.g.,
- •
- •
- •
- •
The first three points advocate a large asymmetry of the excitation spectrum , while the latter emphasizes the role of transition matrix elements . In the simplest picture there is, however, a compensation between the spectral and the velocity route towards large : Commonly the Fermi velocity is approximated by the group velocity, 575757this is known as the Peierls approximation, see, e.g., Refs. Paul and Kotliar (2003); Tomczak and Biermann (2009b).. Then it is apparent that flat bands, that create sharp spectral features, have a small velocity (at least in some direction), which in turn hampers the response functions (in that direction).585858 As a nice illustration let us mention the red pigments -HgS (vermillion) and CeSF. While the good absorption properties of the former owe to transitions of large amplitude between dispersive bands, in the latter relevant transitions have low transition matrix elements but large non-dispersive spectral weight to transition intoTomczak et al. (2013a).
The above mechanisms have been evidenced and/or studied for current state-of-the-art thermoelectrics, all of which are doped intermetallic narrow-gap semiconductors, such as Pb(Se,Te), Sn(Se,Te), and Bi2Te3. These materials combine good powerfactors with reasonably low thermal conductivities to reach a favourable thermoelectric conversion efficiency. Moreover, the intrinsically low thermal conduction in, e.g., lead tellurideDelaire et al. (2011b) alloysLaLonde et al. (2011) could be combined with the above mentioned band-convergence Pei et al. (2011), mesoscale phonon engineering Biswas et al. (2012), as well as with impurity states Heremans et al. (2008).
III.1.2 Electronic correlations and thermoelectricity: friends or foes?
The propensity of correlated materials to exhibit large response functions begs the question whether electronic correlation effects could provide means to improve upon the conventional thermoelectric materials just mentioned—all of which are uncorrelated narrow-gap semiconductors. Several scenarios suggest an affirmative answerZlatic and Monnier (2014); Hébert et al. (2016):
On a model level Schweitzer and Czycholl (1991); Pálsson and Kotliar (1998); Oudovenko and Kotliar (2002); Grenzebach et al. (2006); Arsenault et al. (2013); Zlatić and Freericks (2012), as well as for realistic calculations of metallic compoundsOudovenko et al. (2006); Haule and Kotliar (2009b); Boehnke and Lechermann (2014); Mravlje and Georges (2016), correlation effects were shown to enhance the thermopower. In fact, the low-temperature thermopower in correlated metals is boosted by , with the quasi-particle weight Behnia et al. (2004). However, since the conductivity scales with Tomczak et al. (2010a), the powerfactor is actually independent of .595959In fact, this is different from the semi-classical picture, where , i.e., for a momentum-independent self-energy.
Noting that the thermopower is a measure for the entropy per carrierIoffe (1960); Pálsson and Kotliar (1998); Mukerjee (2005); Zlatić et al. (2007); Mravlje and Georges (2016); Arsenault et al. (2013), there are further sources of a large thermoelectric response: Indeed, in the limit of large temperatures, the thermopower is entirely determined by the number of possible microstates (degeneracy) ,
| (13) |
where is the entropy of the system, the number of particles, and and indicate that the derivative is taken at constant energy and volume. Eq. (13) is called Heikes formula Chaikin and Beni (1976). In correlated materials, the degeneracy is enhanced by the typically large number of spin- and orbital degrees of freedom. In fact, the large thermopower in cobaltates has been proposed to originate from such entropic contributionsKoshibae et al. (2000); Wang et al. (2003). Heikes-type formulae were demonstrated to also hold for other oxides Uchida et al. (2011).
Large effects of entropy are also expected near phase transitions. Indeed, large thermopower enhancements have been evidenced near structural instabilities. The prime example is copper selenide, Cu2Se, a compound whose transition from a low-temperature semi-conducting -phase to a superionic -phase is accompanied by a lambda-shaped thermopower anomaly Liu et al. (2013); Brown et al. (2013). Similar effects have been evidenced also in other semiconductors with mixed ionic and electronic conduction, e.g., Ag10Te4Br3Nilges et al. (2009) or AgCuS Guin et al. (2014), where structural phase transitions induce sudden changes in the ionic mobility. In this context let us highlight the recent work of Sun et al. Sun et al. (2015), who evidenced that a large temperature-dependence in electronic mobilities induces pronounced features in the thermopower as well as in the Nernst coefficient. A strong variation of the electronic mobility could be engineered by fabricating a junction between materials of vastly different mobilities. Large mobility gradients could, however, also be realized in individual correlated materials in the vicinity of ordering instabilities, metal-insulator transitions or other phenomena that cause abrupt changes in electronic relaxation rates. This mechanism of mobility gradients was suggested to be active for Ni-doped skutterudite CoSb3 Sun et al. (2015) (cf. Section (III.4)), as well as heavy-fermion compounds such as CeRu2Al10Sun et al. (2015) and CeCu2Si2Sun and Steglich (2013). Also the recent observation of colossal thermopower anomalies in doped double perovskitesRoy and Maiti (2018) could be interpreted in this vein. Whether critical phenomena in the multifarious structural, magnetic, and electronic phase transitions in correlated materials may lead more generally to useful behaviours in the thermopower is yet an open question.
Further, large thermopowers occur when the excitation spectrum is strongly peaked. Indeed as suggested by Mahan and Sofo Mahan and Sofo (1996), “the best thermoelectric” has a very narrow peak within a couple of around the Fermi level. Besides the paths of band-structure engineering on the one-particle level mentioned above, weakly dispersive, narrow features can be generated by many-body enhancements of effective masses. Particle-hole selective renormalizations can moreover result in an increased asymmetry, benefiting thermoelectricity, as suggested by Haule and Kotliar Haule and Kotliar (2009b). See, e.g., table (15) for the notable particle-hole asymmetric scattering rate in FeSb2 and FeAs2.
Many correlated narrow-gap semiconductors do indeed exhibit large thermoelectric effects: FeSi, FeSb2, CrSb2, and Fe2VAl all have intrinsically large thermopowers and powerfactors (see table (1)). Yet, being insulators, this large response occurs at rather low temperatures (cf. the next section). The same applies to Kondo insulators, (cf. Section (I.2)). Although the undoped materials are hence unsuited for standard thermoelectric applications, such as waste-heat recovery at elevated temperatures or Peltier refrigeration down from ambient conditions, they do have potential for cooling applications or sensors at cryogenic temperaturesHeremans (2016), and could significantly reduce the need for liquid helium. The figure of merit of correlated narrow-gap semiconductors and Kondo insulators, are however minuscules, because of their strong lattice thermal conductivity. To address this issue, it has been suggestedZhang et al. (2011b) to combine the aspect of correlation effects with that of geometric constraints mentioned earlier.
Conventional thermoelectrics are degenerate narrow-gap semiconductors. For correlated narrow-gap semiconductors, however, doping typically does not help achieving high powerfactors at larger, more generally useful temperatures (see however sections III.4, III.5). A likely reason for this drawback are the reduced electronic lifetimes that accompany the beneficial mass enhancements. In fact, the scattering rate is often not small compared to the gap, . Ss discussed in Section (II.4.1) for FeSi, this leads to an incoherence-induced metallization at intermediate temperatures, and doping yields a full metal rather than a degenerate semiconductors.
III.1.3 Limits of a purely electronic picture of thermoelectricity.
We find it instructive to discuss here a simple analytical modelTomczak et al. (2010a) of a correlated but coherent narrow-gap semiconductor. By this we mean a system in which effective masses are renormalized and quasi-particle weights reduced, while excitations remain coherent (scattering rate ). The model serves several purposes: (i) it provides a minimal understanding of the coherent low-temperature regimes of systems such as FeSi, (ii) it shows the limits of applicability of band-like transport calculations, and (iii) it establishes an upper bound for the purely electronic thermopower in insulators.
Our starting point is Eq. (11) and Eq. (12). We consider a half-filled system of two bands, whose non-interacting dispersions are electron gas-like (quadratic in three dimensions), , for both (v)alence and (c)onduction states, and separated by a crystal-field gap . Using the Peierls approximationPaul and Kotliar (2003); Tomczak and Biermann (2009b) yields Fermi velocities . Correlation effects shall be encoded in a momentum-independent self-energy of the form . Then the interacting dispersions will be given by
| (14) |
where is the renormalized charge gap, the effective mass of the carriers, and the origin of the chemical potential is chosen as the mid-gap point. Each excitation carries the reduced spectral weight , and has an inverse lifetime/scattering rate .
In the limit of a coherent system () and a large gap (), Eq. (12) can be solved analytically to give
| (15) |
where all carrier specific parameters have been collected in
| (16) |
Then, the thermopower acquires the form
| (17) |
where we have defined the asymmetry parameter by
| (18) |
which itself depends on and . Hence, a large thermopower is achieved by an interplay of the gap, , the chemical potential, , and the particle-hole asymmetry, . The latter is itself influenced by the bare masses (), the chemical potential (), and by the many-body effects of encoded in mass enhancements (), scattering amplitudes (), and quasiparticle weights ().
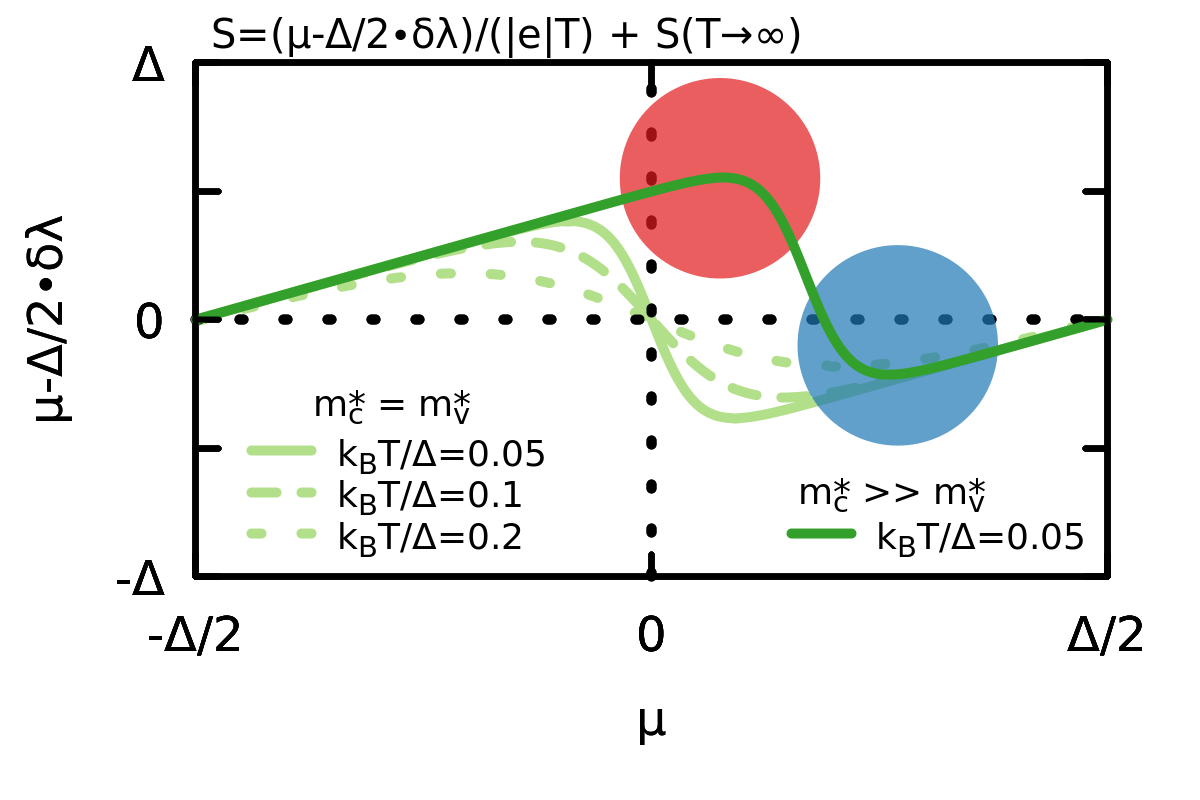
Low-temperature behaviour.
Let us have a look at the typical behaviour at low temperatures, where in systems such as FeSi or FeSb2, coherent transport is expected. In Fig. (34) we display the coefficient of the term, namely , as a function of the chemical potential inside the gap, , for different temperatures .
In the particle-hole symmetric case, parameters for the valence and the conduction band are equal, i.e., , and the asymmetry parameter becomes . Then, the thermopower vanishes for all temperatures, since . However, small deviations from particle-hole symmetry, that could, e.g., be caused by impurity states pinning the chemical potential, can result in large thermopowers. In fact, the thermopower in narrow-gap semiconductors is quite sensitive to defects or off-stoichiometries, as also indicated by oftentimes notable sample dependencies (cf., e.g., sections III.4 and III.5).
Larger thermopowers are possible in case the electronic structure is strongly particle-hole asymmetric. Fig. (34) displays a case, where the effective mass of the conduction electrons is much higher than that of holes in the valence band. Then, a large positive thermopower is attainable. This situation is for example realized in FeSi. Doping the system with electrons—i.e., moving to the right in Fig. (34)—will drive the system through a sign change in , to realize a negative thermopower albeit of smaller absolute magnitude. Experimentally this is seen, e.g., for Co-doped FeSi, see Fig. (39). There, undoped (, red) FeSi has a large positive thermopower at low temperatures. Adding electrons (, blue) switches the sign and yields an overall smaller .
As seen in Fig. (36) and Fig. (39)(right), the thermopower falls off quicker than above its peak value. This is potentially indicative of a breakdown of the simplifications made in the current, simple model. Most notably, assuming the scattering rate to be vanishingly small might no longer be a viable approximation. This issue will be discussed more in the next Section (III.1.4), as well as for FeSi in Section (III.2).
An upper bound for the diffusive thermopower in semiconductors.
Within the framework considered here, the thermopower cannot be arbitrarily large. Indeed, the asymmetry parameter in Eq. (18) is bounded: . With the further constraint of the chemical potential remaining inside the gap, , the thermopower of the coherent semiconductor thus obeys
| (19) |
In the coherent regime, correlation effects can hence enhance the thermopower by selective renormalizations (of, e.g., the effective mass). The fundamental limit Eq. (19), which simply corresponds to fully eliminating either the electron or hole contribution to thermoelectric transport, can, however, not be surmounted. While derived for a two-band model, also effects of degeneracies cannot change this fact. Through similar considerations, Goldschmid and SharpGoldsmid and Sharp (1999) actually suggested that the charge gap of an insulating system could be read off from the peak value of the thermopower for which they assessed: .
In Section (III.3) (see in particular Fig. (41)) we will encounter systems that violate the upper bound Eq. (19). As discussed there, it is believed that in these materials a major part of the thermopower comes from the so-called phonon-drag effect that allows to circumvent the bound of the purely electronic thermopower considered here.
III.1.4 Electronic correlations: a challenge for ab initio transport methodologies.
In currently used thermoelectric materials electronic correlations do not play a significant role.606060This does not mean that all these materials are well-described by DFT. Indeed band-gaps in the undoped parent compounds are consistently underestimated. This allowed the successful use of band-structure methods to describe their electronic structure, and Boltzmann-derived methodologiesBattiato et al. (2017) to compute their transport properties. Applications of Boltzmann codes—such as those of Refs. Madsen and Singh (2006); Pizzi et al. (2014)—are diverse and include theoretical studies of individual materialsScheidemantel et al. (2003); Singh (2007, 2010), theoretical support for experimental studiesAn et al. (2009); Rhyee et al. (2009), and even high-throughput studies for thermoelectricsMadsen (2006); Wang et al. (2011a); Opahle et al. (2012); Bhattacharya and Madsen (2015); Garrity (2016); Gorai et al. (2017); van Roekeghem et al. (2016). These simulations indeed reach predictive character: It was, e.g., suggested that PbSe could be a low-cost alternative to the commonly used, but expensive PbTeParker and Singh (2010). This proposal was supported by subsequent experimentsWang et al. (2011b).
In materials with sizable electronic correlation effects, however, both band-theory and the standard Boltzmann approach become inaccurate. While we discussed the implications of many-body effects onto the electronic structure in Section (II), we focus here on the challenges that correlation effects pose for transport methodologies. For this, we compare the Kubo approach (see Eq. (11)) with the commonly used semi-classical Boltzmann approach in the relaxation time approximation. The latter can be obtained from the Kubo formalism in the limit of a vanishing scattering rate, . Then, e.g., the conductivity and the thermopower of Eq. (11) simplify to
| (20) |
and
| (21) |
where, for simplicity, we assumed a momentum- and band-independent scattering rate and have omitted inter-band contributions. Then, the Boltzmann thermopower becomes independent of the scattering rate .
As an illustration of the importance of finite lifetime effects, we show in Fig. (35) a comparison for a generic case of a renormalized narrow-gap semiconductor supplemented with a temperature-independent scattering rate. At large temperature the Kubo and the Boltzmann approach yield similar resistivities, that follow activation laws, characteristic of coherent insulators. However, already below 200-400K (for the given parameters), strong deviations between the two approaches occur: While the Boltzmann resistivities continue to grow exponentially, the rise in the Kubo result slows down and tends to level off. Trends toward resistivity saturation are commonly witnessed experimentally in correlated narrow-gap semiconductors (see Fig. (1) for some examples). Usually this situation is interpreted as indicative of impurity or defect derived in-gap states. Here, we propose that a finite (residual) scattering rate for intrinsic charge carriers provides an alternative scenario for resistivity saturation in semiconductors.616161In Kondo insulators, resistivity saturation has been suggested to be linked to topological effectsChang et al. (2017). This suggestion is supported by experimental results for Ru-substituted FeSi: Indeed, Paschen et al. Paschen et al. (1999) found the resistivity of Fe0.9Ru0.1Si to be similar to that of pristine FeSiPaschen et al. (1997), saturating, in particular, to approximately the same value at low temperatures. The authors interpret this finding as strong evidence for an intrinsic origin of resistivity saturation in FeSi. Moreover, in FeSi, nuclear magnetic resonance measurementsCorti et al. (2000) do not show (at least down to 50K) any clear characteristics that would be expected from in-gap states (contrary to the cases of FeSb2 and FeGa3, cf. Section (III.3.7)).626262See, however, the discussion of possible donor levels in Ref. Paschen et al. (1997), as well as their interpretation in terms of spin polaronsSluchanko et al. (2000); Glushkov et al. (2011).
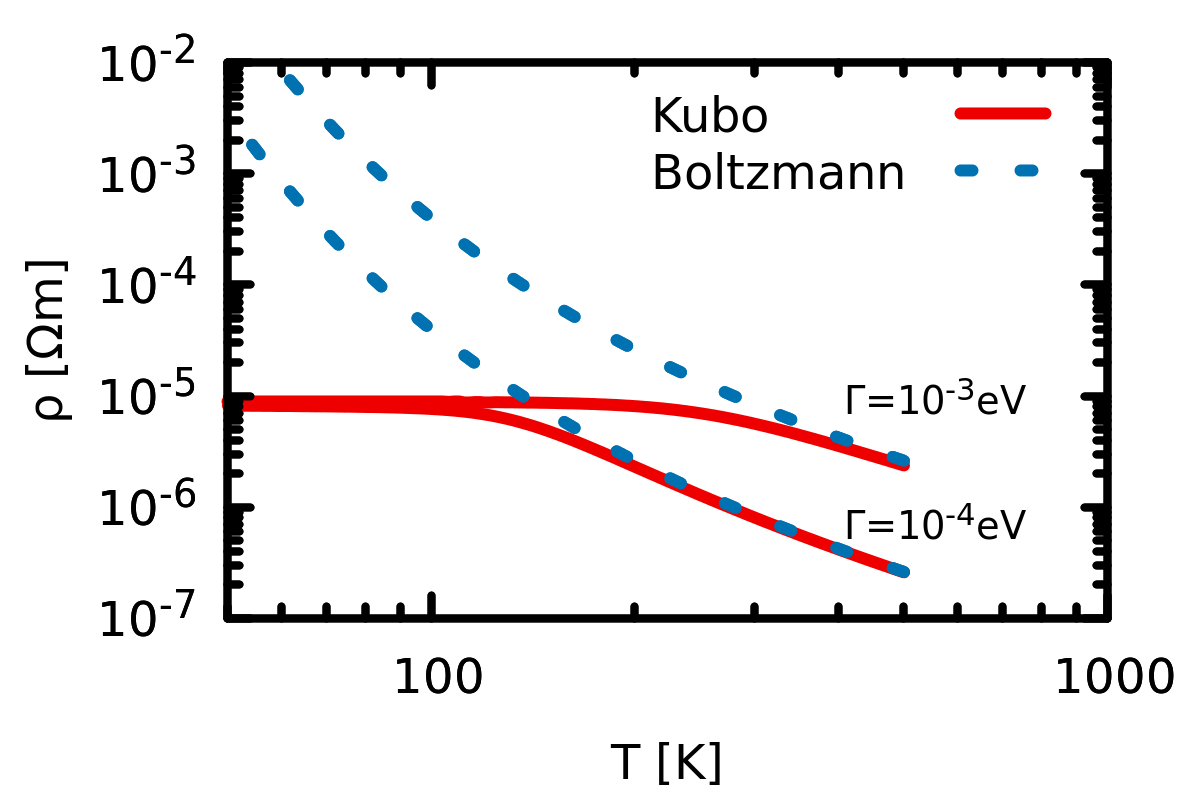
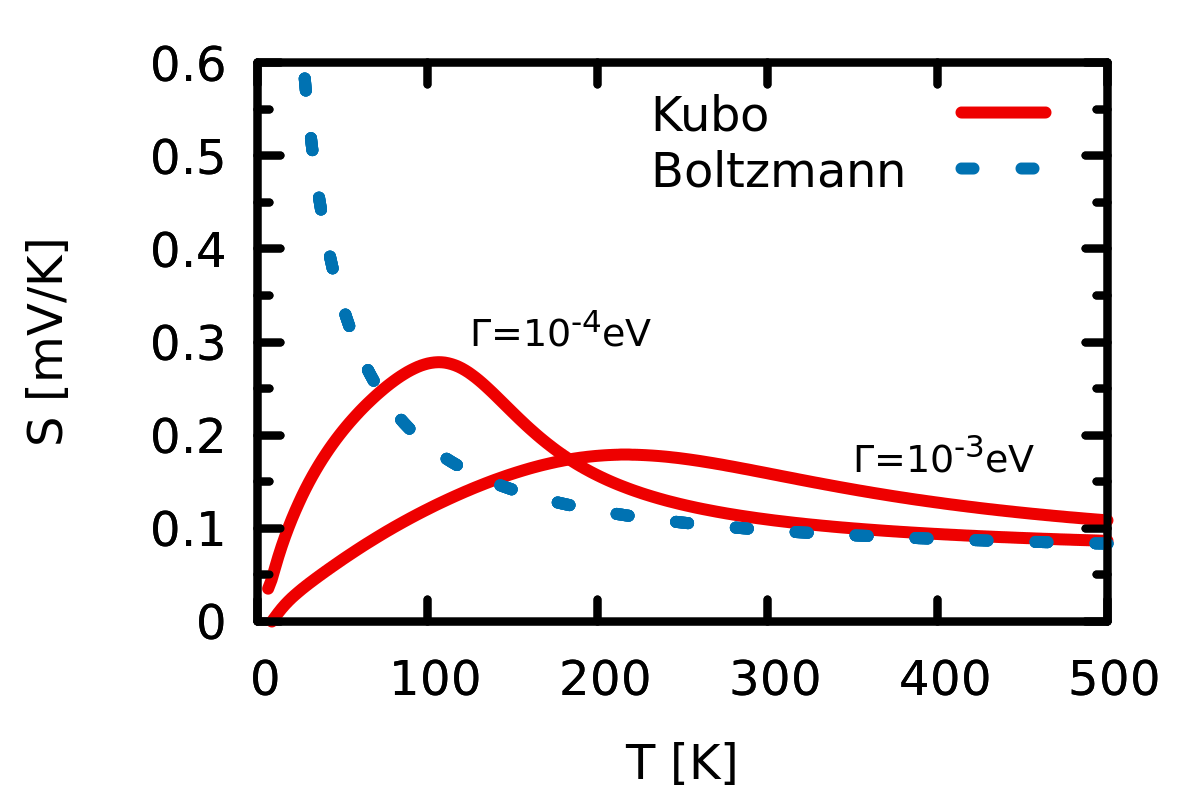
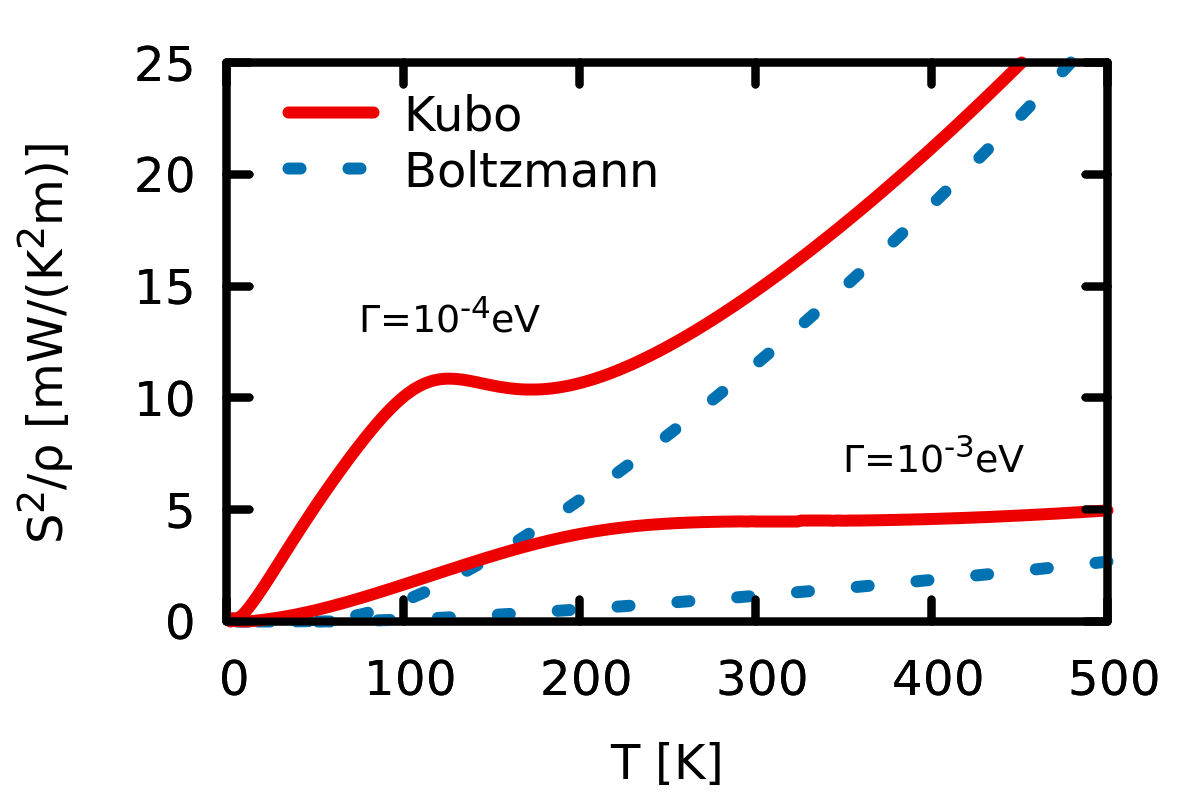
Turning to the thermopowers of the model, Fig. (35)(middle), we see large differences between the two approaches: The Boltzmann result is independent of the scattering rate, see Eq. (21), and diverges inverse proportional to , as expected for a fully coherent semiconductor (see also Section (III.1.3)). The Kubo result, on the other hand, largely depends on the scattering rate. Towards absolute zero, vanishes as required by the third law of thermodynamics. At intermediate temperatures, the thermopower is non-monotonous in temperature and assumes a shape common to that seen in experiments, see Fig. (3). Interestingly, for some temperatures, the Kubo thermopower can be larger than the Boltzmann result. Peak values of the thermopower, however, increase with growing coherence (smaller scattering rate ).
The resulting powerfactors are shown in Fig. (35)(right). While is larger for small scattering rates, it is interesting to note that properly accounting for effects of finite lifetimes via the Kubo formalism yields larger values than the semi-classical Boltzmann approach.
This model calculations thus show: (i) a quantitative description of transport properties in regimes of non-negligible lifetime effect requires going beyond the Boltzmann approach (for metallic systems in which accounting for correlation effects proved crucial, see, e.g., Refs. Held et al. (2009); Arita et al. (2008c); Boehnke and Lechermann (2014); Mravlje and Georges (2016)), (ii) finite lifetime effects can actually yield a better thermoelectric performance than would be anticipated from semi-classical approaches. Consequently, high-throughput screeningsMadsen (2006); Wang et al. (2011a); Opahle et al. (2012); Garrity (2016); Gorai et al. (2017) based on DFT and Boltzmann approaches might overlook promising thermoelectric materials.
Impact of many-body renormalizations on transport quantities
-
•
(selective) mass enhancements can boost thermopowers.
-
•
in a coherent regime, the thermopower of a semiconductor has as upper bound.
-
•
describing incoherent transport is beyond semi-classical Boltzmann theory.
-
•
residual scattering of intrinsic charge carriers can cause a saturation of the resistivity at low , and causes a decay of the thermopower for .
III.2 Silicides: FeSi, RuSi and their alloys.
The electronic structure of the prototypical correlated narrow-gap semiconductor FeSi was discussed in Section (II), and its properties compared to Kondo insulators in Section (I.2). Here, we focus on the thermopower of the material, that was already shown in Fig. (3) and Fig. (4)(c). In Fig. (36) we again display the experimental results, now in comparison to theoretical simulations.
III.2.1 Simulations of the thermopower.
At temperatures below 100K, i.e., when FeSi is in its coherent regime (cf. Section (II.4.1)), its thermopower can be reproduced by a slightly hole-doped and renormalized band-structure. This is illustrated in Fig. (36), where we plot a thermopower obtained from band-theory doped with 0.1% holes per iron (see also the work of Jarlborg Jarlborg (1999)),636363That tiny amounts of holes improves congruence might not be a question of introducing charge, but simply of changing the particle-hole asymmetry. and supplementing the dispersions with an effective mass of two so as to narrow the band-gap to the experimental value (cf. Section (II.4.1)). The agreement of this band-theory-derived thermopower with experiment, however, worsens significantly when temperature rises. Indeed, above 100K the experimental thermopower decreases quickly in absolute magnitude and changes sign twice. Good agreement with experimental results is found, when computing the thermopower of FeSi within Kubo’s linear response formalism (see Section (III.1.4)) from the realistic many-body electronic structure discussed in Section (II.4.1). In particular, the sign changes as a function of temperature, which indicate the transition between hole () and electron () dominated transport, are captured. This non-monotonousness in the thermopower was already heralded by the moving of the chemical potential, as seen in the right inset of Fig. (19) (top left): Starting from low temperatures, the chemical potential moves down, therewith reducing the hole contributions to the thermopower, before passing, at around 120K, the point of thermoelectric particle-hole symmetry, below which the thermopower becomes negative. At higher temperatures yet, the trend reverses and the thermopower changes sign again. Besides the thermopower, also for the resistivity, and the powerfactor derived from both of them, there is good agreement between experiment and the many-body simulations, see Fig. (37). Whether the many-body picture for FeSiTomczak et al. (2012a) also accounts for the compound’s HallSluchanko et al. (1998); DiTusa et al. (1998); Sun et al. (2013) and its intriguing Nernst coefficientSun et al. (2013), is an open question.
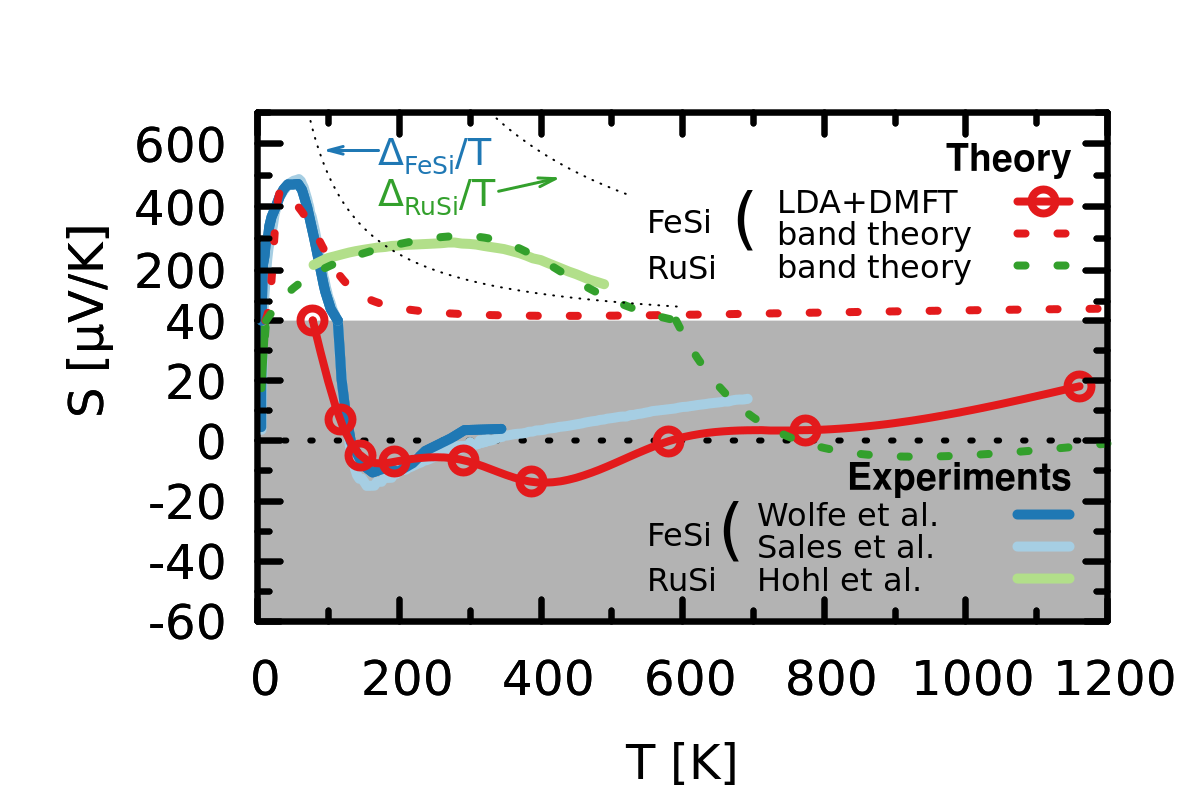
III.2.2 Influence of correlation-induced incoherence.
Having validated the accuracy of transport simulation in the many-body framework, we can elucidate the origin of the quenching of the thermopower above 100K. Is it a consequence of the chemical potential moving, or does the onset of incoherent conduction destroy the voltage drop across the sample? In Fig. (38) we therefore compare the original DFT+DMFT thermopower (from Fig. (36)) with a calculation in which lifetime effects, i.e., , are frozen to their values at K. We see that the resulting thermopower still switches sign, but remains much larger on an absolute scale. Hence, the moving of the chemical potential has a large influence on what is the dominant type of carriers (electrons or holes), but it is the onset of incoherent spectral weight at the Fermi level above 100K (cf. the spectral function in Fig. (5)(a)) that is the main culprit for the substantial decrease in the thermoelectric signal. In that sense, short lifetimes, i.e., a substantial , are antagonistic to thermoelectric performance in semiconductors.


III.2.3 Doped FeSi.
If incoherent spectral weight at the Fermi level kills the thermopower, than so does doping. Indeed, while the thermopower of FeSi is robust with respect to different samples and preparation techniques, any disturbance away from stoichiometry vastly decreases the response.
The uniqueness of pure FeSi was impressively illustrated by Sakai et al. Sakai et al. (2007a) who studied the thermopower of monosilicides and their alloys: In the continuous phase-diagram of temperature vs. composition, see Fig. (39), FeSi sticks out as an island of largely enhanced thermoelectricity. The above discussed effects of incoherence explain why the narrow (red) strip of large and positive thermopower is restricted to low temperatures. Its confinement with respect to doping (the chemical potential) can be understood from the simple model, presented in Section (III.1.3): Indeed, in an insulator with conduction electrons heavier than valence holes, large positive thermopowers are possible, as indicated in Fig. (34) that shows the coefficient of the behaviour. Moving the chemical potential to the left (hole doping) continuously decreases the thermopower which, however, remains positive. A trend similar to that shown here for Fe1-xMnxSi, is realized in ligand-substituted FeSi1-xAlx DiTusa et al. (1998); Sharath Chandra et al. (2008).
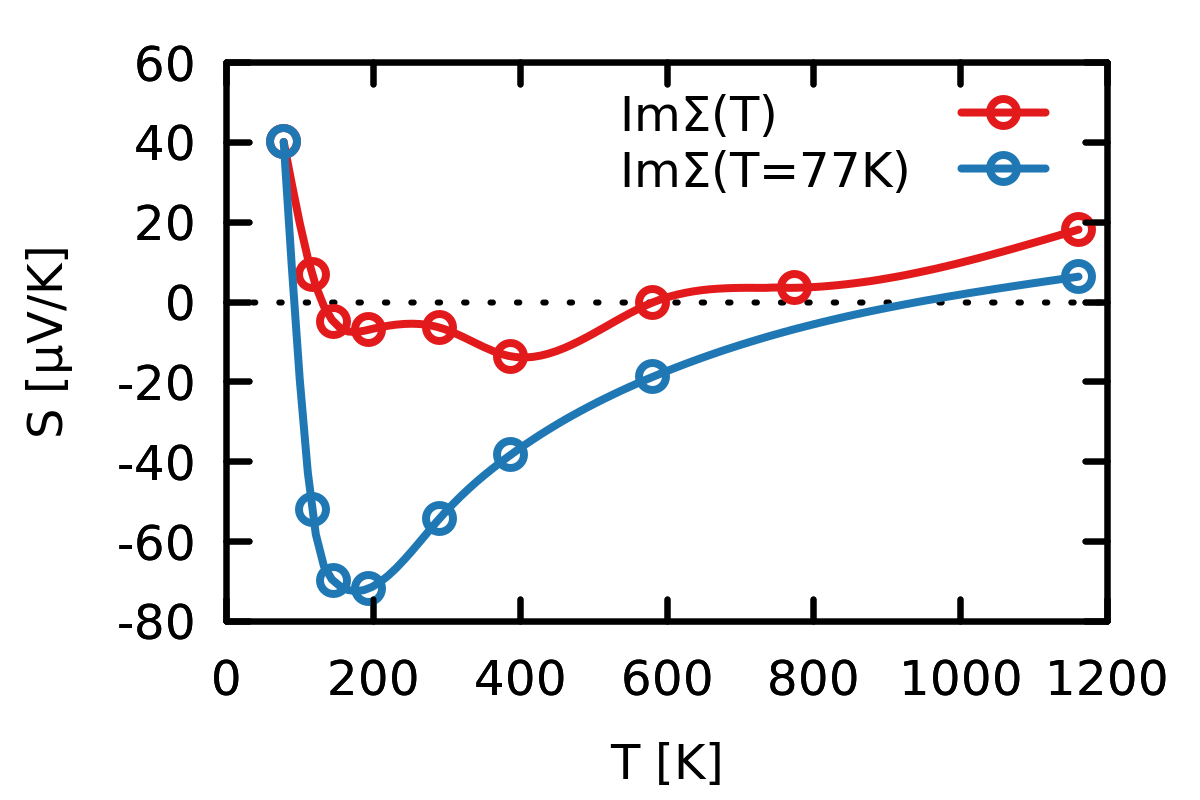
Increasing (electron doping) beyond the maximum in Fig. (34) causes the thermopower to decrease abruptly, change sign, and realize negative values of smaller magnitude. This is indeed, what is found experimentally, as can be inferred from Fig. (39) and Refs. Ou-Yang et al. (2017) for Co-doping, and is seen in Ref. Sales et al. (1994) also for Ir-doping.


III.2.4 A comparison of FeSi with RuSi.
We find it instructive to compare FeSi to its isostructural and isoelectronic 4 homologue RuSi, and discuss the series Fe1-xRuxSi in view of its thermopower646464For a comparison of the related couple FeSb2 and RuSb2, see Refs. Sun et al. (2009a); Herzog et al. (2010b); Fuccillo et al. (2013), and for the pair FeGa3 and RuGa3, see Ref. Gamża et al. (2014).. As discussed in Section (II.2.1) in conjunction with band-structure results, ruthenium silicide, RuSi, is a semiconductor with an indirect gap of meV (obtained from resistivity measurementsBuschinger et al. (1997a); Hohl et al. (1998)) and an optical gap of meVBuschinger et al. (1997a); Vescoli et al. (1998). Interestingly, the trend in the size of the gap in the alloy series Fe1-xRuxSi is not monotonous with Mani et al. (2002), see Fig. (40): In fact up to a ruthenium concentration of 6% the charge gap is found to decrease with respect to FeSi. At higher concentrations the gap then starts to grow, passes the initial value of FeSi at around 15% ruthenium, and augments further up to the value of stoichiometric RuSi.
With the insight into FeSi (Section (II.4.1), Fig. (38), and Section (II.6)), this behaviour was understood as followsTomczak et al. (2013b). In fact, there are, in Fe1-xRuxSi, two opposing tendencies: (i) ruthenium has a larger atomic radius than iron. Thus, with increasing Ru content, the hybridization gap will shrink as the lattice expands. This effect is immediateMani et al. (2002), and wins for low ruthenium concentrations. (ii) with there is a crossover in the dominant orbital character of low-energy excitations, namely from a 3 to a 4 radial distribution (cf. also the discussion in Ce3Bi4Pt3-xPdx in Section (II.2.3)). As a consequence of the greater extension of the latter, interaction matrix elements, such as the Hubbard and the Hund’s , will have smaller values (see Refs. Tomczak et al. (2009); Tomczak et al. (2010b), as well as the comparison of and of FeSb2 and RuSb2 in table (3) in Section (II.2)). As discussed in Section (II.4.1), and elaborated on in the model calculations of Section (II.6), the Hund’s rule coupling drives the strong correlation physics in FeSi. This is the reason why correlation effects are near absent in RuSi, in congruence with the fact that band-structure theory underestimates its gap—instead of the large overestimation for FeSi, cf. Section (II.2.1). The effect of diluting the Hund’s rule coupling in Fe1-xRuxSi with growing becomes preponderant for larger ruthenium concentrations, diminishes effects of band-narrowings, and, thus, causes the gap to increase.
The thermopower of RuSi, see Fig. (36), while not achieving the very large values of FeSi at low temperatures, is noteworthy in size over an extended temperature regime, with V/K from 100 to 500K: As discussed in Section (III.1.3), the thermopower of a coherent insulator is controlled by the size of the gap and the particle-hole asymmetry, while it cannot exceed . RuSi, having a larger gap than FeSi, exhibits a thermopower that indeed surpasses the envelope function, , of FeSi, for K, as indicated in Fig. (36). However, RuSi obeys its own boundary, , and the distance between the largest possible and the actual thermopower is in fact much larger than is the case for FeSi. Hence, the particle-hole asymmetry (called in Section (III.1.3)) is smaller in the 4 compound.
The dilution of the Hund’s rule coupling upon replacing Fe with Ru will, besides the decrease in effective masses, also diminish effects of incoherence. This should push the quenching of the thermopower (cf. Fig. (38)) to higher temperatures. Therefore, isovalent, yet non-isoazimuthal and non-isovolume substitutions in correlated narrow-gap semiconductors might produce larger thermopowers in the temperature regime of 100 to 300K. Besides the greater coherence, the loss of thermoelectric particle-hole asymmetry () when departing from pure FeSi, is partly compensated by the enlarged gap (for ). While the power factor of stoichiometric FeSi reaches favourable 40 W/(K2cm) at around 60K, see Fig. (37), a notable improvement beyond 100K can be expected in Fe1-xRuxSi for . Finally, the substitution will also reduce the thermal lattice conductivity , yielding a better figure of merit. Nonetheless, it is unlikely that Ru-substitution alone will result in a useful , let alone a good price-performance ratio.
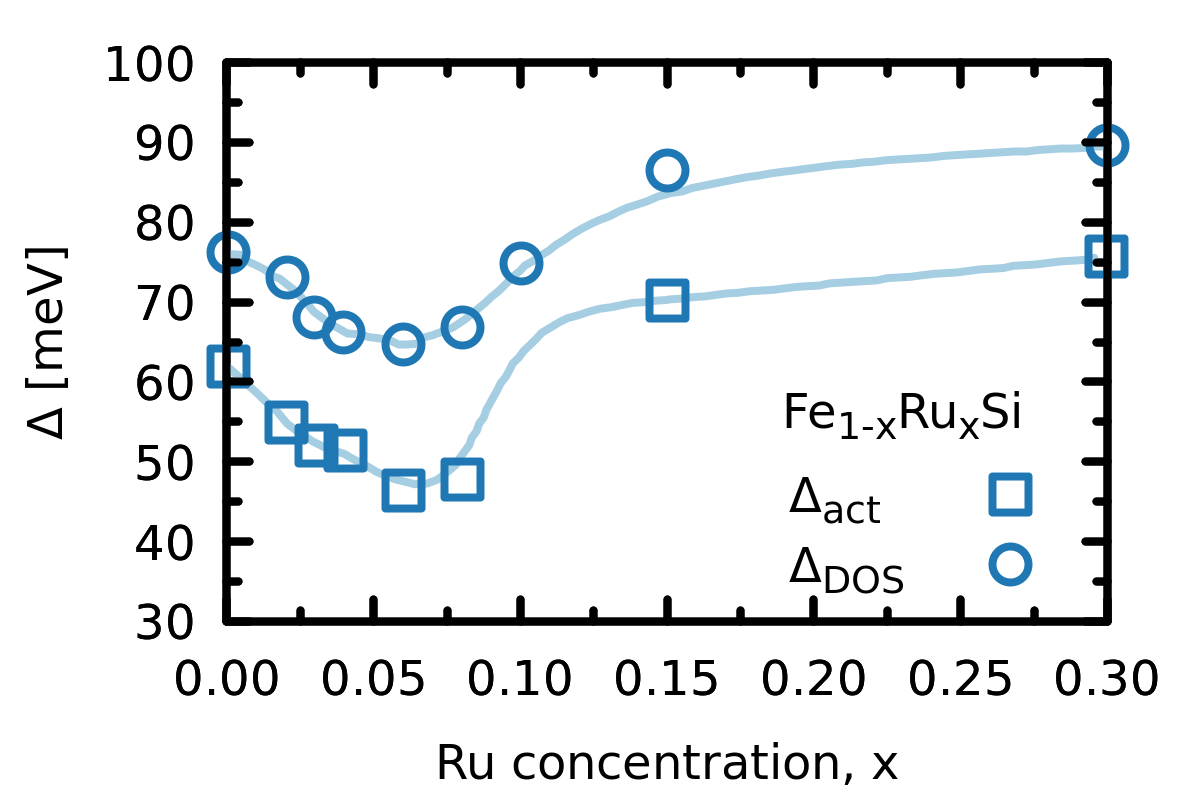
FeSi: lessons for thermoelectricity
-
•
effective masses enhance peak thermopowers at low : correlations beneficial
-
•
incoherence (finite lifetimes) quenches the thermopower: correlations detrimental
-
•
in the presence of lifetime effects transport properties cannot be captured with semi-classical Boltzmann approaches
-
•
potential path to extend regime of large thermopowers: partial isoelectronic substitution of for transition metals (dilution of Hund’s rule coupling)
III.3 Marcasite di-Antimonides: FeSb2, CrSb2 & Co.
The material that has particularly fuelled the interest in thermoelectric effects in correlated narrow-gap semiconductors is FeSb2. Indeed, its thermopower has rightly been called “colossal” by Bentien et al. Bentien et al. (2007), who found values up to -45mV/K at around 10K, and the powerfactor is the largest ever measured656565With the possible exception of elemental bismuth, where, when combining results from different experiments (see data compiled in Ref. Issi and Luyckx (1966)), can reach spectacular 81mW/K2cm at 3K. with up to 8mW/K2cm at 28KJie et al. (2012). While basic transport, optical and magnetic properties of FeSb2 have been discussed in Section (I.1) and its electronic structure in Section (II.2.2), we here make the connection to its thermoelectric properties, and review works that try to explain the unusual behaviour. Here, one has to make a clear distinction between polycrystalline samples and single crystals. Indeed, while the temperature dependence of the thermopower is qualitatively similar for both cases, the colossal magnitude of occurs only in single crystals. The thermopower measured for polycrystalline samplesBentien et al. (2006); Sun et al. (2009b, 2010b, 2011) instead never exceeds 1mV/K, see, e.g., Fig. (42) (left).
III.3.1 Polycrystalline samples—physics akin to FeSi?
Where it peaks, the thermopower of FeSb2 is negative, indicative of preponderant contributions from electrons. This is opposite to the hole-like, positive thermopower of FeSi, discussed above. This finding is in line with the particle-hole asymmetry evidenced in electronic structure calculations (see, e.g., the DOS in Fig. (15)). Indeed spectral features are much sharper and of higher density for states below the Fermi level than above it. When described in terms of an effective model in the spirit of Section (III.1.3), this asymmetry translates into effective masses that are larger for valence than for conduction bands. Assuming long electronic lifetimes at low temperatures, the qualitative behaviour of the thermopower of FeSb2 can be discussed in terms of Fig. (34). There, to account for the hierarchy of masses, instead of the shown , the figure needs to be mirrored with respect to both, the x- and the y-axis. Then it is expected that electron-doping leads to a gradual decrease of the thermopower that however remains negative. This is indeed what is found experimentally, see, e.g., the case of FeSb2-xTex in Refs. Sun et al. (2011); Wang et al. (2012). Hole-doping, on the other hand, quenches the thermopower more rapidly and leads to a sign change already at very low doping, see, e.g., Ref. Bentien et al. (2006) for the case of FeSb2-xSnx. A quantitative simulation of thermoelectric effects in polycrystalline samples of FeSb2 is still outstanding. However, it can be expected that once the obstacles to describe the electronic structure of the compound (discussed in Section (II.2.2)) are overcome, a computation of (intrinsic) transport properties will come into reach.
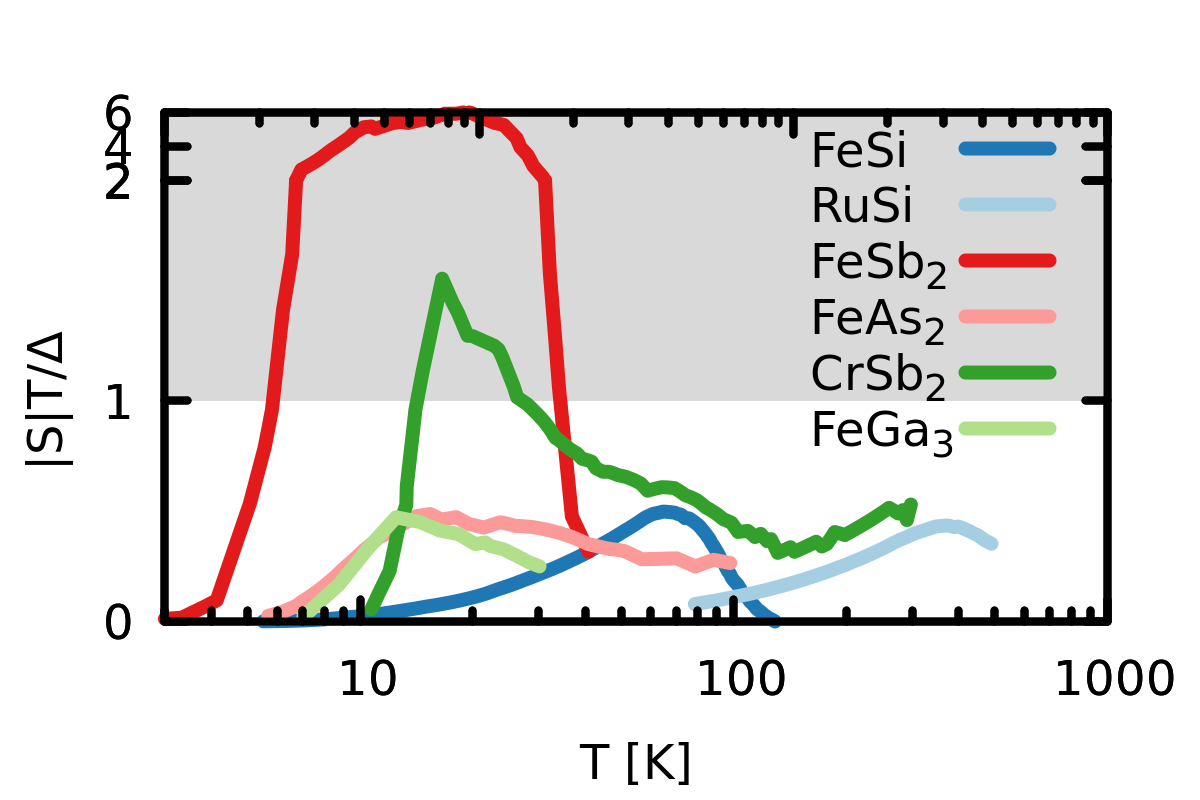
III.3.2 Single crystals—do correlations cause the large thermopower?
It is in single crystalsBentien et al. (2007); Sun et al. (2010a); Jie et al. (2012); Takahashi et al. (2016) that the thermopower of FeSb2 was found to be unusually large, indeed “colossal”, with, however, notable variations on the qualityTakahashi et al. (2011) and sizePokharel et al. (2013); Takahashi et al. (2016) of samples (see also below). Given the pronounced effects of electronic correlation effects in this system (discussed in Section (I.1)), it was proposed that also the thermoelectric response owes to many-body effects.
Indeed, extending the comparison of FeSb2 with its isostructural homologues FeAs2 and RuSb2 (see the discussion in Section (II.2.2) and also Section (II.6)) to thermoelectric properties, one notes that only the strongly correlated FeSb2 boosts an unusually large thermopowerSun et al. (2009c, a, 2010a). Also, the thermoelectric properties of doped FeSb2, e.g., the mentioned FeSb2-xTex are indeed that of a correlated metal, i.e., the low-temperature thermopower is linear in , with an enhancement factor, via the effective mass, of the order of 15 Sun et al. (2010a). Moreover, the shape of the thermopower of FeSb2 can actually be modelledSun et al. (2009c); Jie et al. (2012) with phenomenological expressions that include many-body renormalizationsTomczak et al. (2010a). However, the modelling failed to account for the colossal magnitude of the thermopower. Here, it is instructive to examine the experimental results in terms of the model that was discussed in Section (III.1.3). Since, at low temperatures, FeSb2 is a coherent semiconductor (cf. Section (I.1)), the conditions to apply the band-like model are met. In this coherent, purely electronic picture—which, on top, neglects so-called vertex corrections—the thermopower cannot exceed , where is the charge gap. In Fig. (41) we plot the experimental thermopowers of several narrow-gap semiconductors, scaled with . Any value of in excess of unity indicates a violation of the theoretical upper bound of the thermopower. The antimonides FeSb2 and CrSb2, subject of this section, indeed defy the constraint. In the case of FeSb2 the violation amounts to almost one order of magnitude.666666Note that in Fig. (41) we have used the thermopower from Ref. Sun et al. (2013), where the peak-value is -18meV/K, which is less than half of the record -45meV/K found in Ref. Bentien et al. (2007). Hence, to explain the large thermopower in the antimonides, either the omitted vertex corrections (describing, e.g., excitonic effects) somehow strongly boost the response, or, alternatively, an additional not electron-diffusive mechanism is at work in these materials.
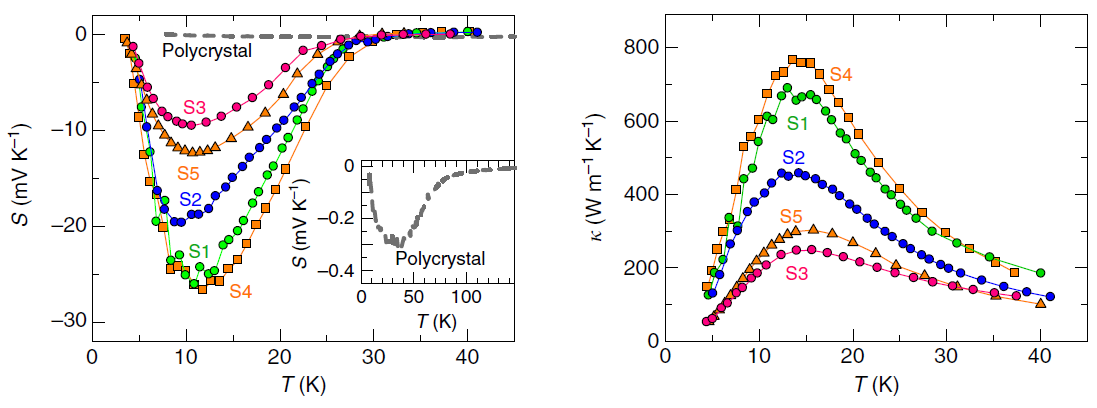
III.3.3 Empirical evidence for a phonon-drag thermopower.
As a potential candidate the so-called phonon-drag effectFrederikse (1953); Herring (1954) has been suggested for FeSb2Tomczak et al. (2010a). This electron-phonon scattering mediated enhanced electron-drift has been evidenced in pure, conventional semiconductors, such as p-type GermaniumGeballe and Hull (1954), or Indium AntimonideFrederikse and Mielczarek (1955), but also in pure metals and dilute alloysF.J. Blatt and Greigr (1976). In the following we will summarize empirical evidence that motivates the presence of the phonon-drag in FeSb2 and hints at why it is negligible in FeAs2 which obeys the -rule.
When cooling FeSb2 below its insulator-to-metal crossover, optical spectroscopy witnesses a large change in phonon lifetimes, suggesting an important electron-lattice coupling Perucchi et al. (2006); Herzog et al. (2010a) (cf. the discussion for FeSi in Section (II.7)). Also polarized Raman scattering experiments indicate notable electron-phonon couplings, that are strongly temperature dependent below 40KLazarević et al. (2010) (see Fig. (30)). Further, we note that, as can be expected for a non-electronic mechanism of the thermopower, the magneto-thermopower of FeSb2, is very low for samples with large Bentien et al. (2007). Interestingly, the large low-temperature thermopower in FeSb2 is also accompanied by a notable increase in the nuclear spin-lattice relaxation rateGippius et al. (2009).
Also, the mentioned dependence of the thermopower onto the type of samples can be consistently interpreted in favour of the phonon-drag scenario. Indeed, a decrease in the phonon mean-free path by scatterings of non-electronic origin is expected to lower phonon-drag contributions to the thermopower, as well as lattice contributions to the thermal conductivity. This naturally explains why the low-temperature thermopower found in polycrystalline samples Bentien et al. (2006), polycrystalline thin films Sun et al. (2009b) and nano-particular samplesKieslich et al. (2014) is significantly lower than in single crystals. That all types of samples yield a comparable response at higher temperaturesGippius et al. (2009) suggests that the phonon-drag contribution to the thermopower decreases with the emergence of phonon-phonon or umklapp scattering, as does the lattice thermal conductivity (cf. Fig. (42)).
The trend of the thermopower with the phonon mean-free path has been put onto a much firmer footing by studies in which the granularity or size of samples was varied in a controlled fashion: Pokharel et al. Pokharel et al. (2013) found that the thermopower of nano-composites roughly grows logarithmically with the average grain size. Takahashi et al. Takahashi et al. (2016) studied rod-shaped single crystals of varying dimension, see Fig. (42). They established a clear proportionality between the phonon mean-free path extracted from the thermal conductivity and that determined from the thermopower—assuming a simple phonon-drag modelHerring (1954).
III.3.4 Comparison to FeAs2
At first glance, phonon related properties, including the phonon-drag effect, might be expected to be important also for the isoelectronic and isostructural FeAs2. Indeed, the thermal conductivity is found to be even larger in the arsenideSun et al. (2009a). Yet, the maximal thermopower of FeAs2 is much smaller than that of Fesb2, and, in particular, compatible with a purely electronic picture (cf. Fig. (41)). The following might explain this disparity: The thermopower is a measure for the entropy per carrier. Hence the phonon contribution to the thermopower will roughly scale with the lattice specific heat times the electron-phonon coupling constant , divided by the electron density: . With Debye temperatures of K for FeSb2Bentien et al. (2006); Sun et al. (2009a), and K for FeAs2Sun et al. (2009a), the specific heat of FeSb2 will be larger than that of FeAs2. The charge carrier concentration at temperatures where the thermopower is maximal, on the other hand, is larger for FeSb2, /cm3 for the sample with largest in Ref. Sun et al. (2010a), whereas /cm3 for FeAs2. Also the electron-phonon coupling—the least accessible quantity (see Diakhate et al. Diakhate et al. (2011) for a computational study) is likely to be larger in the antimonide: The electronic contribution to the specific heat of FeSb2 exhibits a notable feature below 50KSun et al. (2009a).676767However, the unlocking of spins in FeSb2 becomes appreciable only beyond this regime at around 150K, where the entropy reaches , owing to a second and larger hump in the specific heat, and in congruity with the susceptibilityKoyama et al. (2007); Petrovic et al. (2003). Indeed FeSb2 becomes paramagnetic above 100K Petrovic et al. (2003), and a Curie-like downturn appears at temperatures above 350K Koyama et al. (2007), whereas the susceptibility of FeAs2 is flat up to 350KSun et al. (2009a). That there is no analogue in the spin response, may indicate that the features’s contribution to the entropy is associated with either the charge degrees of freedom (excitonic or charge ordering effects) or is, indeed, an electron-phonon effect. No such feature appears in the specific heat of FeAs2.686868P. Sun, private communication. Together, this suggests a much smaller phonon-drag effect in FeAs2.
Comparing the thermopower of the antimonide and the arsenide (see Fig. 1 in Ref. Sun et al. (2009a)) one notes, however, that the Seebeck coefficient of FeAs2 becomes larger than that of FeSb2 above 35K. This might indicate—if the phonon-drag picture holds—that the effective electron-phonon coupling in FeSb2 has sufficiently decreased (by umklapp and phonon-phonon scattering) so that the thermopower is now dominated by the electronic degrees of freedom, i.e., the larger gap in FeAs2 causes a larger response. Indeed, an approximate simulationTomczak et al. (2010a) of purely electron-diffusive contributions to the thermopower yielded good results for FeAs2 above 15K, and, for FeSb2, in the interval 35-50K which is high enough for phonon-contributions to have decayed and low enough to not cross the insulator-to-metal transition of the compound.
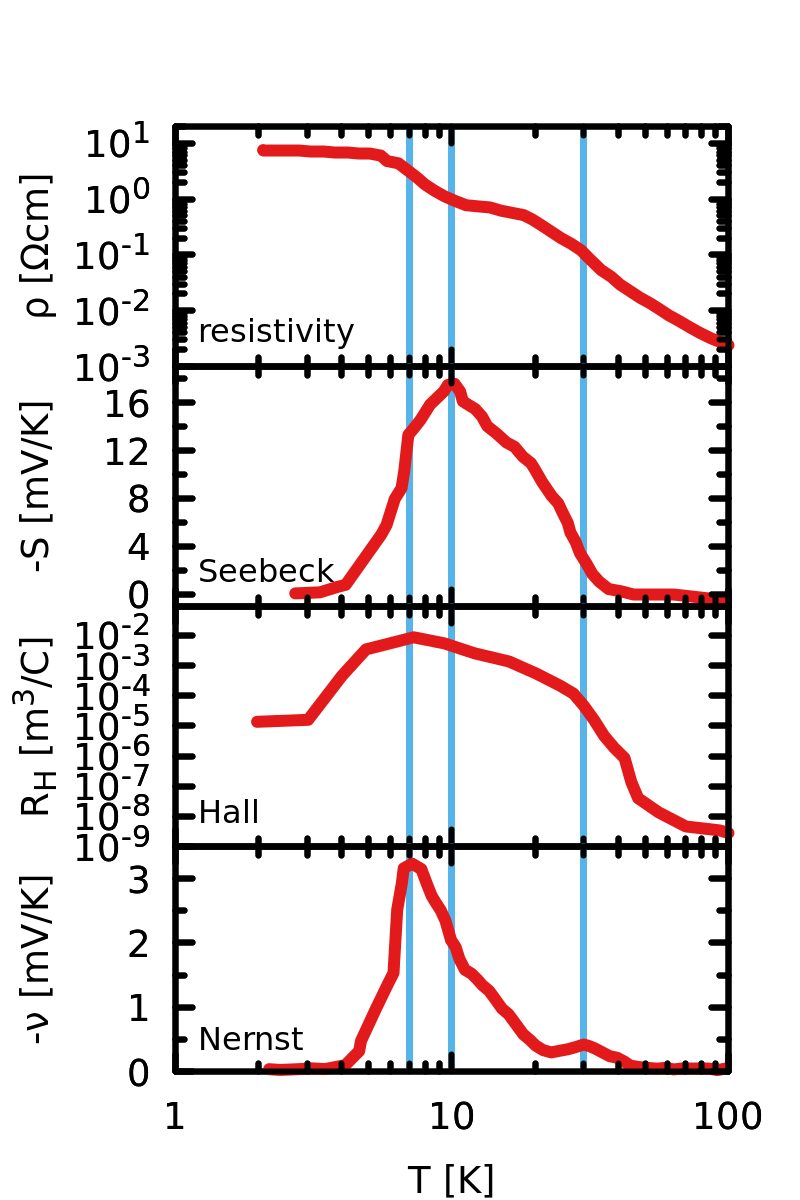
III.3.5 Constraints to a theory of FeSb2: correlation of features in transport observables.
For the development of a microscopic understanding, it is paramount to establish as many empirical constraints as possible, against which a candidate theory can be tested. In the case of FeSb2 the comprehensive work of Sun et al. Sun et al. (2009c, 2013) demonstrated that there is a striking inter-dependence of diverse transport observables. As depicted in Fig. (43), there are (at least) three temperatures at which the resistivity, the thermopower, and the Hall and Nernst coefficient display distinct features: Inflection points in the thermopower coincide with extrema in the Nernst coefficient, while the thermopower is maximal for inflection points in both the resistivity and the Nernst coefficient. Likewise, at these characteristic temperatures features appear in the Hall coefficient, as well as the magnetoresistance (see Fig. (44)(d)). This intimate linkage between electrical, magnetic, and thermoelectric quantities is a harbinger for a common microscopic origin, posing severe constraints on possible explanations of the colossal thermopower.
III.3.6 Modelling the phonon-drag in FeSb2: evidence for important role of in-gap states.
Realizing that the characteristic temperatures just mentioned all lie far below the insulator to metal crossover in FeSb2, it is reasonable to assume electronic lifetimes to be long. In that case, one may attempt to describe transport properties within the semi-classical Boltzmann approach (cf. the discussion in Section (III.1.4)).
Battiato et al. Battiato et al. (2015) recently investigated transport properties of FeSb2 by fitting experimental data to Boltzmann expressions for different microscopic scenarios: Consistent with earlier findingsTomczak et al. (2010a), a purely electronic setting was found unable to account for the large amplitude of thermoelectric quantities, and, moreover, did not produce the characteristic temperature scales. Indeed, considering that both the Hall coefficient and the thermopower are anti-symmetric under particle-hole inversion, one would expect the two quantities to exhibit a somewhat similar behaviour. Remarkably, the Hall coefficient’s profile is instead more similar to the Nernst coefficient. Also, a conventional phonon-drag mechanism—in which momentum is transferred to valence and/or conduction state carriers—did not result in the correct temperature profiles of observables. Finally, Battiato et al. Battiato et al. (2015) proposed a new, unconventional phonon-drag scenario: Assuming the presence of in-gap excitations and a phonon-drag that couples to their density of states, a quantitative description of all major transport functions was achieved, see Fig. (44).
The congruence of the temperature profile can be explained by the fact that in this scenario, the thermopower and the Nernst coefficient have the opposite symmetry under a particle-hole transformation when compared to their usual purely electronic counterparts: In the phonon-drag scenario the Seebeck coefficient is even, while the Nernst coefficient is odd, see table (5).696969It should further be stressed that in the modelling of Ref. Battiato et al. (2015) the positions and linewidths of features in the transport observables could not (within reason) be tuned with parameters such as the lifetimes and effective masses, but are determined solely by the positions of the in-gap states. Further, it was shown that capturing the large magnitude of the thermopower and the Nernst coefficient, required a momentum transfer of phonons into the electronic system that is small enough to have no apparent signature onto the thermal conductivity. Indeed, the experimental thermal conductivity is dominated by phonon-crystal boundary scatterings Bentien et al. (2007).
In the Nernst coefficient, the proposed phonon-coupling to the density of in-gap states circumvents Sondheimer cancellationWang et al. (2001), without requiring multi-band effects. Previously, it had been proposed that a strongly energy-dependent scattering rate causes the colossal Nernst signalSun et al. (2013). For a scattering rate of the form , the exponent can be determined by . The phonon-drag formalism formally yields a large exponent , in reasonable agreement with Ref. Sun et al. (2013), albeit in the absence of strongly dynamical electronic correlation effects.

| transport kernel | RH | S | N | MR | |
|---|---|---|---|---|---|
| electronic | |||||
| phonon-drag | - | - | - |
III.3.7 Existence and possible origin of in-gap states.
To strengthen the unconventional phonon-drag picture, we here review experimental findings regarding in-gap states and their nature in FeSb2, as well as mention attempts to pinpoint their origin using realistic electronic structure calculations.
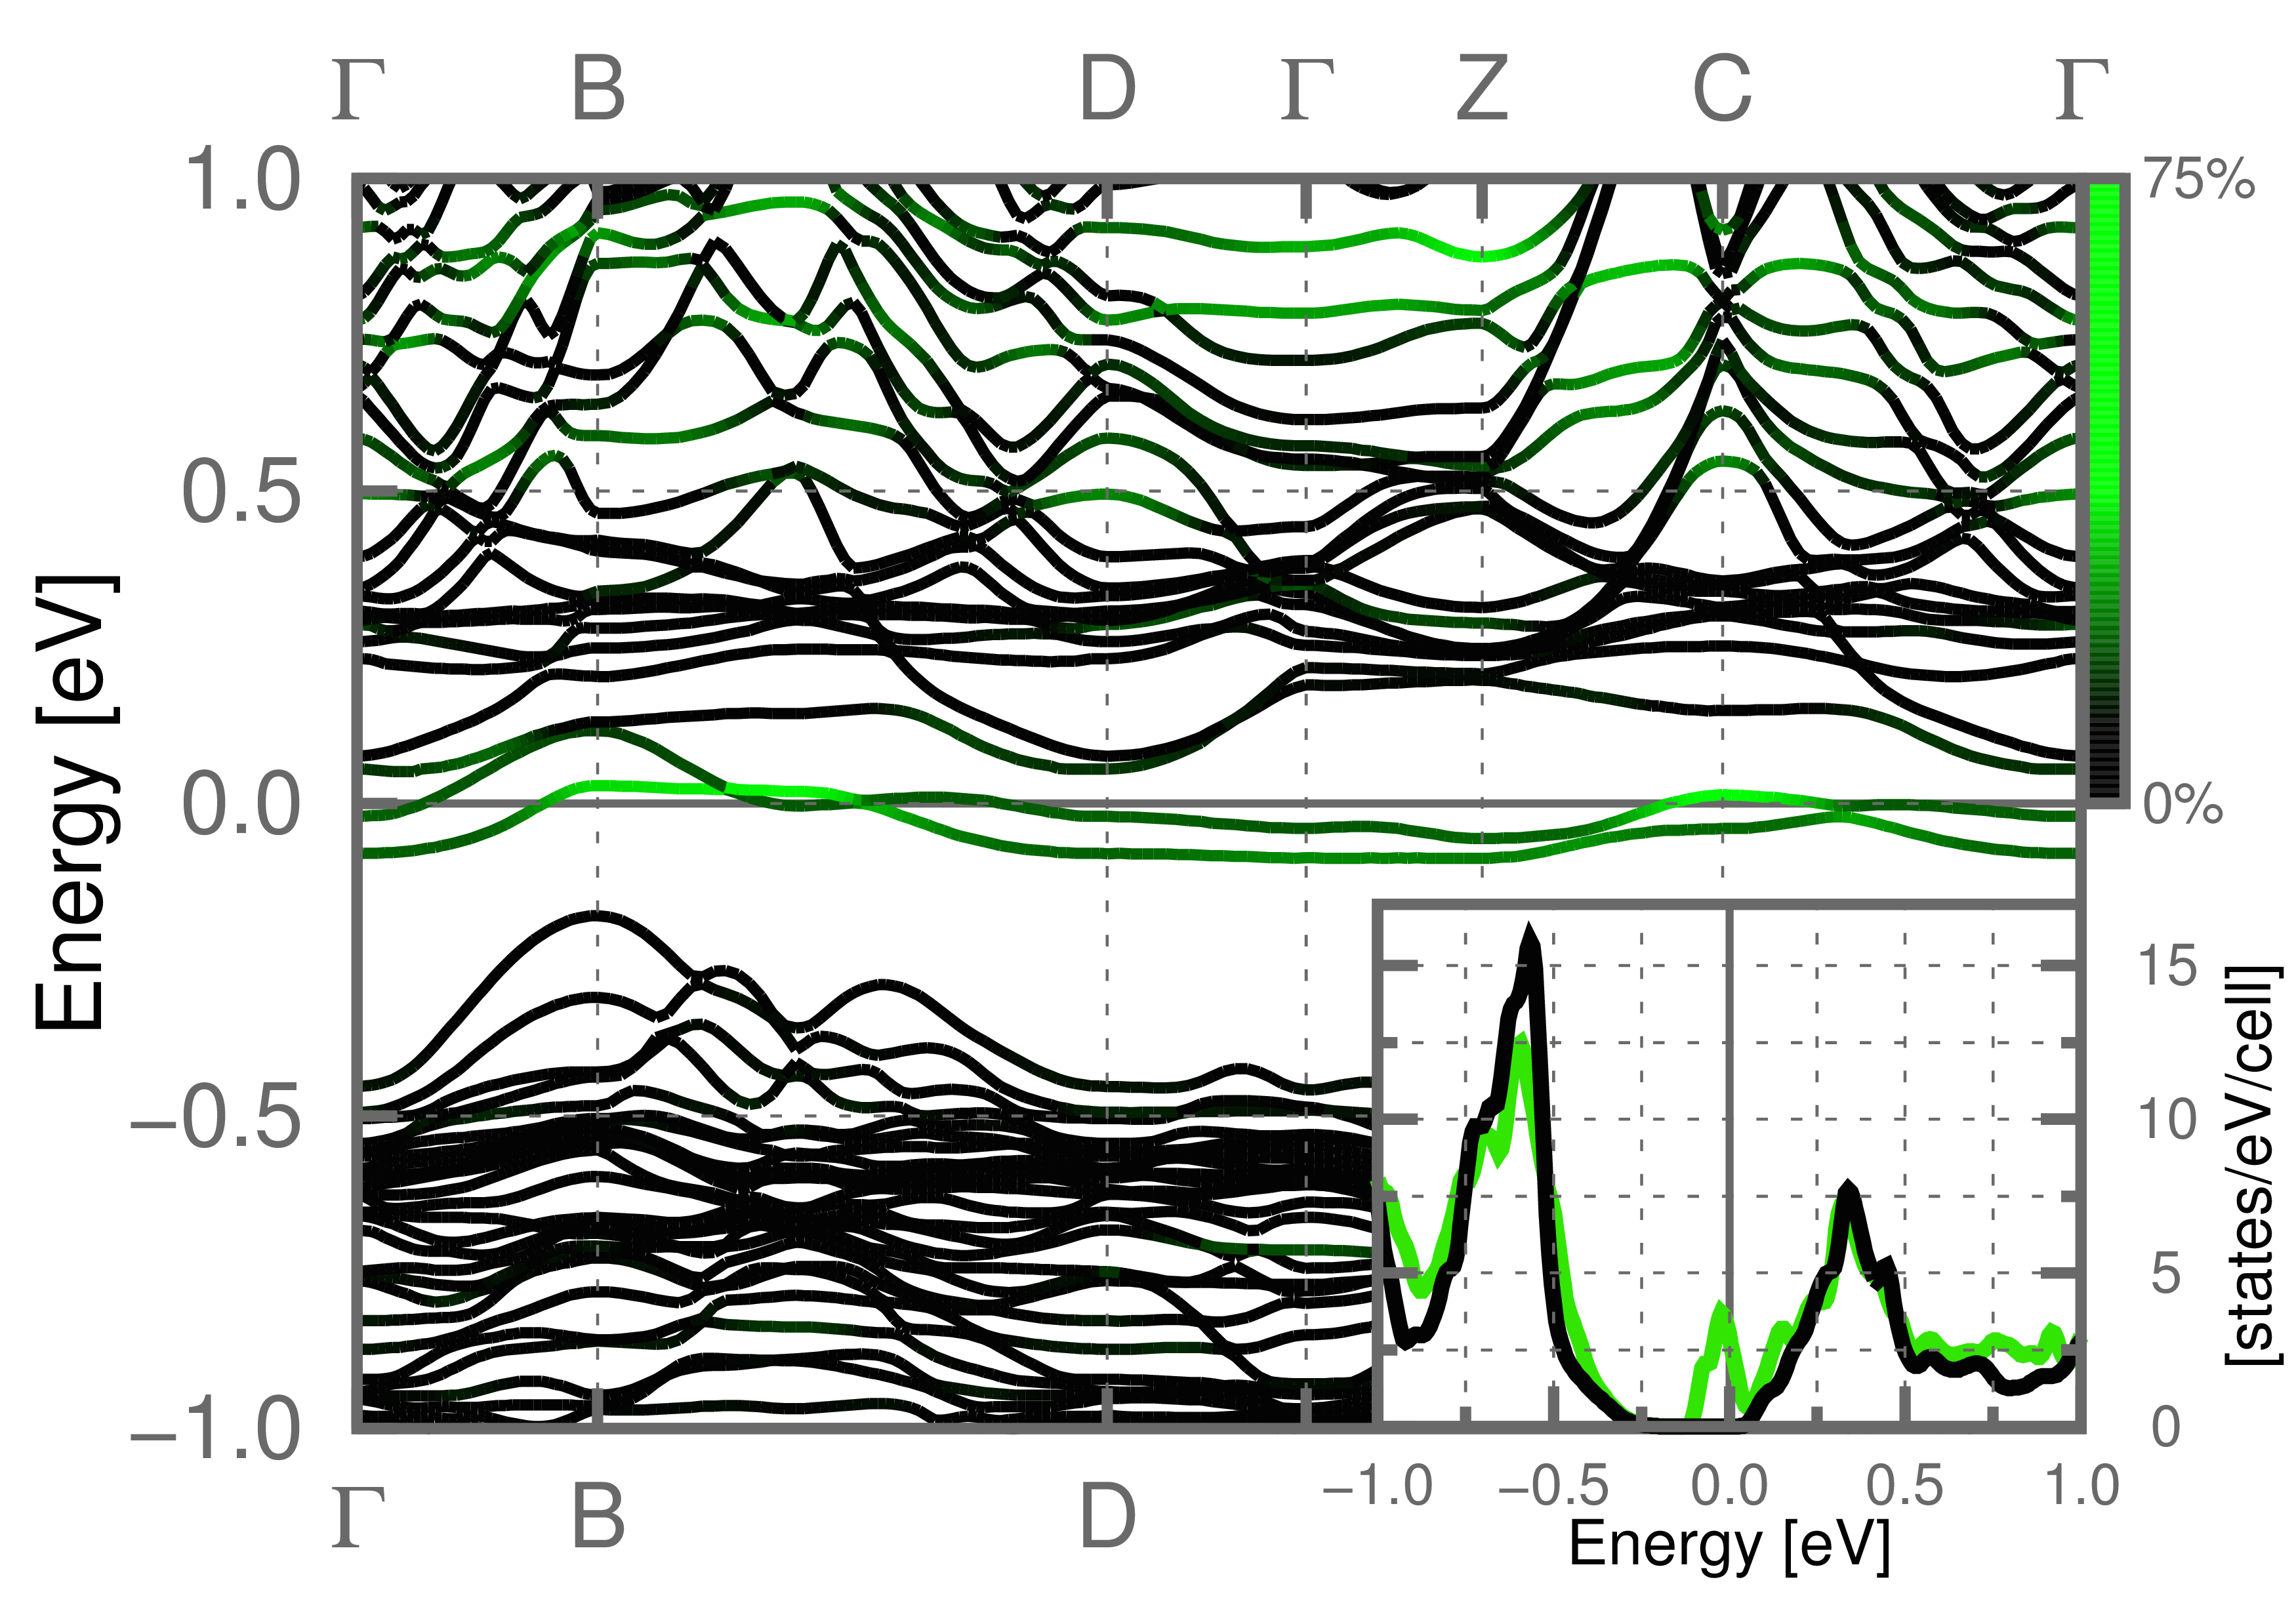
In-gap states in FeSb2 have been held responsible for activation-law regimes with distinct energies in the material’s resistivityFan et al. (1972); Bentien et al. (2007), as well as the low-temperature upturn in the magnetic susceptibilityKoyama et al. (2007). Using pressure-dependent magneto-transport measurements, Takahashi et al. Takahashi et al. (2013), disentangled the band-gap energies and found strong evidence for the smallest gap to originate from an impurity band.
Contrary to FeSiCorti et al. (2000), also low-temperature nuclear magnetic resonance measurements of both FeSb2 and RuSb2 (as well as FeGa3Gippius et al. (2014a)) by Gippius et al. Gippius et al. (2014b); Gippius et al. (2009) show clear indications of localized in-gap states, suggested to be located slightly below the conduction band and to be of character. This finding is consistent with the strong reaction of the in-gap states to magnetic fields (see the magnetoresistance in Fig. (44)(d)). Also, Storchak et al. Storchak et al. (2012) interpreted their muon spin rotation spectra as showing the presence of in-gap states, proposed to be of spin-polaron nature.
Modelling several defect and impurity scenarios from first principles, Battiato et al. Battiato et al. (2015) found the off-stoichiometry Fe1+xSb2-x to be a likely candidate for the emergence of in-gap states. Only for this substitution, electronic states were found to emerge inside the fundamental gap. Fig. (45) shows a simulation of a single anti-site defect: Fe25Sb47. Indeed two impurity bands appear close to the conduction states. The size of the supercell corresponds to in Fe1+xSb2-x. This concentration is, however, much larger than the estimated number of defect, , that is needed to account for the phonon-drag amplitude. Using Curie’s law, it was shownBattiato et al. (2015) that the expected magnetic signature of the required excess iron is consistent with the experimental magnetic susceptibility, which shows a low-temperature upturn of less than emu/molPetrovic et al. (2003, 2005); Hu et al. (2006); Koyama et al. (2007); Sun et al. (2009a, 2010a); Zaliznyak et al. (2011) for all accessed temperatures. The proposed origin of in-gap states is further supported by the binary Fe-Sb phase diagramRichter and Ipser (1997) that may suggest Fe-richness. Moreover, Fuccillo et al. Fuccillo et al. (2013) demonstrated that even the smallest iron concentrations in Ru1-xFexSb2 causes the appearance of the low temperature characteristics of FeSb2, suggesting a possible link to the transition-metal stoichiometry. Finally, recent transport measurements of Sanchala et al. Sanchela et al. (2015) showed that excess iron (or, equivalently, Sb-deficiency) has a large impact onto the peak value of the thermopower.
III.3.8 Outlook.
At first glance, the phonon-drag scenario for FeSb2 appears a disappointment on several levels. However, a closer inspection actually reveals new paths for future research:
(i) phonon engineering. The phonon-drag contribution to the thermopower and the thermal lattice conductivity are inter-linked, see, e.g., Fig. (42). Maximizing the first while minimizing the latter hence means satisfying antagonistic effects. The usual electron-crystal–phonon-glass paradigm is therefore likely to be unsuitable: An undifferentiated decrease in the phonon mean-free path to lower will equally diminish the phonon-drag effect. Any attempt at phonon engineering has therefore to be selective. It is a priori uncertain whether a separation between the phonon modes that dominate the phonon-drag and those propelling thermal conduction is possible, let alone whether they can be independently manipulated. In a pioneering work, Zhou et al. Zhou et al. (2015) demonstrated the feasibility of a phonon filter that achieves just that. The authors showed that in the case of silicon the phonon-drag induced figure of merit, , could be boosted by more than one order of magnitude. The key observation is that phonon modes contributing to the phonon-drag have typically a larger mean-free path, as well as notably lower energies than modes dominating thermal conduction. It is then proposed that nano-clusters can be used as impurities to preferentially scatter high-energy phonons, thus acting as a low-pass filterZhou et al. (2015). These findings provide a new path for optimizing the phonon-drag mechanism in thermoelectric materials for applications at temperatures up to some fraction of their Debye temperatures.
(ii) occurrence in other materials. The phonon-drag scenario proposed for FeSb2 relies on an unconventional mechanism, in which momentum is transferred to in-gap states. However, defect states are notoriously difficult to control (cf. the large sample dependence of ). Therefore it could be expected that technical applications are cumbersome to realize for this system and that the microscopic mechanism might be non-universal, i.e., not found in other materials. Yet, despite the large variation in the thermopower, the signatures of a narrow band inside the fundamental gap is consistently found around the same energy, not just in other transport and spectroscopic probes, but also in the electronic specific heat. This may indicate that the impurity band is an intrinsic feature of the FeSb2 compound or crystal structure. The magnitude of the phonon-drag thermopower will, however, depend on minute details, and the interplay of position of in-gap states, the fundamental gap, the electron-phonon coupling, as well as phonon energies. It seems plausible that the inter-period substitutions Ru for Fe, or As for Sb, thus sufficiently perturb the phonon system (in addition to changes in the electronic structure, see Section (II.2.2)), so as to destroy the conditions for a large phonon drag in FeAs2 and RuSb2. A substitution that changes the mass-balances much less is replacing Fe with Cr. Interestingly, the isostructural CrSb2—despite its quite different electronic structure (d4 configuration in antiferromagnetic CrSb2 vs. d6 in paramagnetic FeSb2)—also violates the upper bound of electronic diffusive thermoelectricitySales et al. (2012), see Fig. (41). Therefore it is tempting to propose that the material realizes the same phonon-drag mechanism as in FeSb2. Indeed, also in CrSb2 the existence of a donor impurity band below the conduction states has been suggestedSales et al. (2012). A further system could be FeGa3Wagner-Reetz et al. (2014). As mentioned before, nuclear magnetic resonance measurements evidenced in-gap states there as wellGippius et al. (2014a). Also, more recent thermopower dataWagner-Reetz et al. (2014), while not violating , do exhibit a characteristically sharp peak of up to -15meV/K at 12K, as well as a pronounced sample, and interestingly, polarization-dependence in the thermoelectric response. In conclusion, the phonon-drag effect in intermetallic narrow-gap semiconductors with open -electron shells might be more prevalent than initially thought. Further experimental investigations, in particular magnetoresistance and Nernst effect measurements for CrSb2 and FeGa3 are called for.
(iii) correlation effects. In the scenario for FeSb2 electronic correlation effects do not seem to play any role. Indeed, the phonon-drag mechanism does not inject momentum into the correlation-effects hosting valence and conduction carriers. Instead phonons couple to in-gap states. As remarked by Takahashi et al. Takahashi et al. (2016), this, in fact, makes the phonon-drag effect particularly large: Indeed, according to the phenomenological treatment due to Herring Herring (1954), the phonon-drag contribution to the thermopower reads . Here, and are the phonon lifetime and velocity, respectively, and a parameter related to the electron-phonon coupling strength that determines the fraction of the phonon momentum-loss/transfer. Crucially, the is inversely proportional to the mobility of the electrons () or holes () that dominate the regular electron diffusive thermopower. In the semi-classical picture, , where is the electronic lifetime and the charge carriers’ effective mass. Hence, large effective masses enhance the phonon-drag. From cyclotron resonance spectra, a mass was indeed extracted for the impurity states in FeSb2Takahashi et al. (2016). Masses of this order of magnitude are, however, not at all uncommon for intrinsic carriers in correlated materials. This suggests that strongly correlated electrons may actually lead to enhanced thermopowers and powerfactors also in semiconductors—with a little help of phonons.
Hence, instead of wrapping up and shelving the FeSb2 puzzle, the reviewed recent theoretical and experimental insights actually open up new directions in the field of thermoelectrics. While most likely not relevant to thermoelectricity in FeSb2, studying its colossal thermopower may have led to the unravelling of a new paradigm: the combination of the time-honoured phonon-drag effect and the physics of strongly correlated electrons.
Lessons from FeSb2: colossal thermopower caused by unconventional phonon-drag
-
•
FeSb2 and CrSb2 violate upper bound Eq. (19) of purely diffusive thermopower.
-
•
correlation of features (extrema, inflection points) in diverse transport observables constrain microscopic modelling.
-
•
phonon-drag coupling to extrinsic in-gap states gives a consistent description of all transport quantities.
-
•
potential path for large thermopowers: coupling phonons to correlated electrons with large effective masses: enhanced phonon-drag thermopowers; advanced phonon-engineering to reduce detrimental thermal conduction while leaving beneficial phonon-drag intact.
III.4 Skutterudite Antimonides: a focus on CoSb3.
Skutterudites are the prototypical compounds in which the phonon-glass, electron-crystal paradigmSlack (1995) can be realizedSales et al. (1997). These materials crystallize in the CoAs3-structure (cubic space-group ) harbouring four formula units. Crucially, the structure has voids at the 2a Wyckoff positions, that can be filled with rare earth, alkali metal, alkaline earth, or other elements, that are only weakly bound to the skutterudite host. As a consequence, the localized fillers exhibit large anharmonic vibrations that diminish the propagation of phonons, and thus heat.707070However, it has been noted that even some of the unfilled skutterudites have intrinsically low thermal conductivities, see, e.g., Ref. Fu et al. (2016) for a discussion of FeSb3. Besides the possibility to reach low thermal conductivities, skutterudite systems exhibit notably large powerfactors. For example, of CoSb3 reaches W/(K2cm) at 625KZhang et al. (2011a) (see table (1)). Over the years, this led to a continuous optimization of the thermoelectric figure of merit. at 800K was achieved in the year 2000Sales et al. (1996), multiple fillings boosted the value to in 2011Shi et al. (2011), and was reached in 2016Rogl et al. (2014).
Providing an all-encompassing overview of the research in skutterudites is far beyond the scope of this work. Instead we will focus on a single (unfilled) compound, CoSb3, to highlight challenges in the ab initio modelling of its thermoelectric properties.
III.4.1 Experimental and theoretical knowledge.
To start, experimental results for this compound scatter notablySharp et al. (1995). For example, values for the charge gap, as extracted from activation-law fits to the resistivity fall into the large range of 230-700meVSharp et al. (1995); Tang et al. (2015); Kawaharada et al. (2001); Mandrus et al. (1995a). Optical absorption experiments find, depending on temperature, a gap from 250 to 320meV, while Shubnikov-de Haas measurementsRakoto et al. (1999) and photoemission experimentsIshii et al. (2002) suggest gap values as low as 30-40meV. Also the thermopower is highly dependent on the sample preparationIkeda et al. (2015), to the extend that both and -type samples have been measuredSharp et al. (1995); Mandrus et al. (1995a); Arushanov et al. (1997); Nolas et al. (1998); Caillat et al. (1996); Leszczynski et al. (2013); Kawaharada et al. (2001); Kuznetsov et al. (2003), see Fig. (46)(a). From the Hall coefficient (Arushanov et al. (1997); Dyck et al. (2002)) as well as electronic structure calculations (DOS larger for conduction states, see Fig. (46)(c)) one would naively expect a positive thermopower for the stoichiometric compound. One might surmise that the origin of these variations lies in the loosely packed crystal structure which makes skutterudite compounds prone to diverse types of defects. Therefore, also the very small gap values extracted from Shubnikov-de Haas and photoemission experiments might be linked to impurity bands.


These experimental uncertainties are met with substantial variations in theoretical results for the perfectly stoichiometric compound. Using experimental atomic positions yields a direct gap in the Kohn-Sham spectrum of CoSb3 that varies from 40-60meV (LDA)Singh and Pickett (1994); Sofo and Mahan (1998), over 170meV (ACBN0)D’Amico et al. (2016) to 310meV (mBJ)Sun et al. (2015).717171The valence count, however, varies little, there are -electrons on each Co-site (wien2k with muffin-tin radius of ). For the band-structure of slightly electron-doped CoSb3 within LDA and mBJ, see Fig. (46)(d) and its discussion below. On top of this, also the equilibrium volume largely depends on the functional used in the relaxation: One finds difference of about 7% when relaxing the structure within LDA or GGA Sofo and Mahan (1998). Using these theoretical structures, large variations in the gap size are found for a given functionalWee et al. (2010). The strong link between electronic and structural properties is also congruent with quantum molecular dynamics simulationsKorotaev and Yanilkin (2017). The latter evidence a substantial temperature-dependence in the electronic structure in CoSb3, and might explain the temperature-induced band-convergence seen in experimentsTang et al. (2015).
Within DFT it is the treatment of exchange contributions that largely affects the size of the gap. Using quasi-particle self-consistent QSGW, we find an even larger gap of 730meV, see Fig. (46)(c). This increase in the size of the gap with respect to DFT-LDA occurs despite the presence of significant band-narrowings. Indeed, within QSGW the valence states are renormalized towards the Fermi with a factor of . Due to the perturbative nature of the GW approach, it tends to underestimate effective masses in compounds with open 3-shells (see also the discussion on di-antimonides in Section (II.2.2)). This finding thus indirectly advocates the presence of substantially enhanced effective masses in CoSb3. Experimentally, masses of 2-5 were indeed extracted from the Hall coefficientCaillat et al. (1996), or from the thermopower when doping with Ni Anno et al. (1999), and 1-3 when adding Yb fillers Tang et al. (2015). Given the competitionTomczak et al. (2012b); Tomczak et al. (2014) of exchange self-energies (widen gaps) and mass enhancements (shrink gaps), as well as moderately large values of effective masses, an accurate modelling of the electronic structure of skutterudites requires a methodology that treats exchange and correlations beyond DFT, and correlations beyond the perturbative GW. Viable approaches will be mentioned in Section (IV).
Despite issues related to defect-derived in-gap states and the putative presence of electronic correlation effects, several transport observables have been successfully modelled from first principles: Guo et al. Guo et al. (2015) computed the thermal lattice conductivity of unfilled and filled CoSb3 and found good agreement with experiments. Also thermoelectric simulations have been performed with some success: Using the Boltzmann response formalism on top of band-structure calculations, several groupsSofo and Mahan (1998); Koga et al. (2005); Wee et al. (2010); Chaput et al. (2005); Hammerschmidt and Paulus (2016) reproduced experimental thermopowers when adjusting the carrier density to values extracted from the experimental Hall coefficients, see Fig. (46)(a) for an example.
III.4.2 Doped CoSb3.
While for thermoelectric applications, doping CoSb3 by introducing filler atoms is the way to go, let us here nonetheless highlight the intriguing case of lightly Ni-doped CoSb3Anno et al. (1999); Dyck et al. (2002); Sun et al. (2015). Indeed introducing 3-transition-metal-derived carriers to the skutterudite has pronounced effects on transport and magnetic properties even for very low concentrationsDyck et al. (2002); Sun et al. (2015): Up to 1% Ni, the resistivity remains insulating, while the magnetic susceptibility develops a Curie-tail at low temperatures.727272At larger dopings the system becomes metallic with mobile charge carriers having effective masses enhanced by a factor of 2-5Anno et al. (1999); Dyck et al. (2002), similar to CoSb3 with Yb-fillingsTang et al. (2015). The Hall coefficient becomes negative already for the tiniest amounts of Ni. Concomitantly, as seen in Fig. (46)(c) for 0.1% Ni, also the thermopower is negative, with the exception of a pronounced positive peak below 25K, that is accompanied by a large peak in the Nernst coefficientSun et al. (2015).
To first approximation, one can try to model the electronic structure of Co1-xNixSb3 within the virtual crystal approximation (VCA). The resulting LDA and mBJ band-structures are shown in Fig. (46)(c) for . These bands are very close to those without doping, albeit shifted rigidly downwards. Crucially the mBJ electronic structure is notably more particle-hole asymmetric than the LDA one, owing especially to a rearrangement of conduction bands, as well as the increased gap below the conduction states. The corresponding thermopower has been computed within the Kubo formalism, using a constant scattering rate and fixing the temperature dependence of the chemical potential by the requirement of charge neutrality (instead of adjusting the carrier density to experimental valuesSofo and Mahan (1998); Wee et al. (2010); Chaput et al. (2005)). With the chemical potential residing inside the conduction bands, the LDA and mBJ-based thermopowers shown in Fig. (46)(c) are metallic. We note that—as expected—the visibly more particle-hole-asymmetric mBJ-band-structure translates into a larger thermopower. Vis-à-vis experiment, the mBJ-based thermopower approaches the experimental result above 100K. In fact—if the electronic structure is reliable and lifetime effects are minor (cf. Section (III.1.4))—congruence between simulation and experiment is expected at high enough temperatures when putative donor-band contributions can be neglected. This quantitative congruence suggests that the mBJ approach gives a qualitatively correct description of the intrinsic electronic structure of (lightly doped) CoSb3. The qualitative discrepancy below 100K, however, point to sizable contributions to the thermopower from effects not contained in the (intrinsic) band-structure. Indeed, using a phenomenological band-structure that includes a spin-orbit splitting (see also Ref. Koga et al. (2005)) and several impurity bands, Kajikawa Kajikawa (2016) successfully fitted the transport observables of Sun et al. Sun et al. (2015). In the grander scheme of things, the onset of the extrinsic low-temperature region can be viewed as a transition into a regime of vastly different electronic mobilitySun et al. (2015). As discussed in Section (III.1.2), such mobility gradients can be a source of enhanced thermoelectric effects. Indeed, the large Nernst coefficient in Co0.999Ni0.001Sb3 can be quantitatively explained in this scenarioSun et al. (2015).
Lessons for the skutterudite CoSb3:
-
•
unreliable electronic structures: large dependence on DFT functional.
-
•
indications for competition of exchange and correlation effects beyond DFT.
-
•
need for electronic structure calculations to include defects.
-
•
potential path for large thermoelectric effects: engineering of mobility gradients.
III.5 Heuslers compounds: a focus on Fe2VAl
The Heusler class of compounds displays an enormous richness in physical phenomena, with applications in spintronics, solar cells, magneto-calorics, and thermoelectricsGraf et al. (2011); Galanakis (2016). Here, we will limit the discussion to the so-called full-Heusler structure X2YZ which crystallizes in the cubic L21 structure (space group ). We again pick a representative of this subclass, that is both of fundamental and of potential technological interest: Fe2VAl.


III.5.1 Experimental knowledge.
The material is a semiconductor with a narrow gap of 90-130meVKato et al. (2000); Nakama et al. (2005), 100-200meV Okamura et al. (2000); Shreder et al. (2015), or 210-280meVLue and Ross (1998) as extracted from transport, optical, and nuclear magnetic resonance (NMR) measurements, respectively. Indeed, the resistivity of Fe2VAl, Fig. (47)(a) has a shape that seems typical for the materials investigated in this review. A closer inspection, see Fig. (1), reveals, however, that the resistivity increase upon lowering temperature is orders of magnitude smaller than in other materials with similar gap sizes. Indeed, despite insulating characteristics in the resistivity, photoemission spectroscopyNishino et al. (1997a); Soda et al. (2014); Miyazaki et al. (2014) sees a metallic edge at the Fermi level, and—the activated behaviour of the spin-lattice relaxation rate notwithstanding—also NMRLue and Ross (1998) suggests the presence of a residual density of states. This disparity between transport (and thermodynamic) quantities on the one hand, and spectroscopic probes on the other has been suggested to derive from off-stoichiometryNishino et al. (2001); Naka et al. (2016), anti-site disorderFeng et al. (2001) or weak localizationSoda et al. (2014).
In the spin sector, Fe2VAl has been characterized as paramagnetic down to lowest temperatures. Early specific heat measurements suggested metallic contributions from carriers with effective electronic masses of the order of 20-70 times the band massGuo et al. (1998); Singh and Mazin (1998); Weht and Pickett (1998). Together this prompted the suggestion of possible -orbital-based heavy fermion behaviourGuo et al. (1998). Subsequently, however, Lue et al. Lue et al. (1999) established that these finding were owing to the presence of extrinsic magnetic clustersVasundhara et al. (2008). Extracting the “intrinsic” contribution to the electronic specific heat from measurements in a varying magnetic field, however, still yielded masses enhanced by a factor of 5Lue et al. (1999). The intrinsic magnetic susceptibility is much flatter with no signs of towards activated behaviour up to 300KIshikawa et al. (2007); Shreder et al. (2008); Naka et al. (2016). NMR relaxation rates, however, do grow exponentially above 300KLue and Ross (1998), yet without any signs towards a crossover to Curie-Weiss-like behaviour is seen up to 600K, see Fig. (2).
In the chemical phase-space—given, e.g., by the pseudo-binary alloy series (Fe1-xVx)3Al or the off-stoichiometry Fe2V1+xAl1-x—the full-Heusler composition Fe2VAl is in many respects distinguished. This is illustrated in Fig. (48): As a function of the number of valence electrons, stoichiometric Fe2VAl realizes (a) the minimal equilibrium volume, (b) the minimal specific heat, is (c) in direct proximity to ferromagnetic long range order, and (d) is placed close to thermoelectric particle-hole symmetry.
The property that both electron and hole doping increases the volume of Fe2VAl is reminiscent of the Kondo insulator Ce3Bi4Pt3 (cf. the discussion in Section (I.2.3)). However, the physical origin behind this phenomenon is very different: In Ce3Bi4Pt3 the volume is indeed linked to the valence countFisk et al. (1995). In the case of Fe2VAl the counter-intuitive volume decrease upon substituting iron with larger vanadium atoms has been suggested to originate from a gain in cohesive energy. Indeed, Kato et al. Kato et al. (1998) have shown that long range structural order in (Fe1-xVx)3Al consistently increases when going from -Fe3Al to the -Fe2VAl ternary Heusler composition. This finding roots in the specifics of the Heusler crystal-structure: There are two inequivalent iron sites in Fe3Al that, among others, have different nearest neighbour distances. Vanadium, being larger than iron, preferentially substitutes the larger site, which gets completely filled when reaching the compositionNishino et al. (1997b). For excess vanadium, the smaller iron site gets populated and the lattice necessarily expands.737373In this respect the substitution with vanadium is unique. Indeed, substituting with the larger Ti the volume increases continuously, while for Cr—which has a radius only slightly larger than V—realizes a minimal volume at in (Fe1-xCrx)3AlNishino et al. (1997b).
That also the specific heat is minimal for Fe2VAl, indicates that the ternary Heusler compound is an insulating island immersed in a metallic sea of adjacent alloy compositions. This finding is corroborated by high-temperature extrapolations of the magnetic susceptibility that find Pauli contributions to be minimal for stoichiometric Fe2VAlNaka et al. (2016). On top of that, Fe2VAl is in proximity to ferromagnetic long-range order that is reached by, both, excess iron (e.g., for in Fe2+xV1-xAlNaka et al. (2012)), and excess vanadiumSoda et al. (2004). Indeed, stoichiometric Fe2VAl represents an exact zero of the Slater-Pauling function, , for the spontaneous ferromagnetic momentGraf et al. (2011); Galanakis (2016). Here, is the total number of valence electrons per formula unit. Since here , it follows that Fe2VAl is non-magnetic.

Also thermopower measurements place Fe2VAl into a tight spot. Indeed, there is a tremendous sample dependence in , as shown in Fig. (47)(b) and Fig. (48). While the thermopower most of the time reaches large values, the sign of the response varies from experiment to experiment. Note that the thermopower is much more sample dependent than the resistivity shown in Fig. (47)(a), as it is very sensitive to the balance of electron and hole contributions. As discussed in Section (III.1.3) in the model context, this sensitivity suggest that intrinsic Fe2VAl is placed close to thermoelectric particle-hole symmetry, for which exactly cancels but acquires very large values in the immediate vicinity.747474 We specified thermoelectric particle-hole symmetry, because different observables may experience compensation at different points. For example, in (Fe2V)1+xAl1-3x, the Hall coefficient vanishes for , while already for Nishino et al. (2001). Moreover, the trend in the off-stoichiometry of the composition series Fe2+xV1-xAl is unconventional, see Fig. (48): Adding in this way electrons(holes) to the system causes a more hole-like(electron-like) response, in even qualitative defiance of the rigid band picture of carrier doping. Similarly in the Hall coefficient, for Fe2VAl1.05, while for Fe2VAl0.95Matsushita et al. (2002). These counter-intuitive findings may be linked again to the unconventional effects of off-stoichiometry onto the crystal structure, cf. Fig. (48)(a). On the other hand, doping the Heusler compound by substitutions with a fourth element, yields (at small enough doping) the standard form of Eq. (17), as indicated by the model curve in Fig. (49).
The large thermopower in conjunction with the low resistivity values in Fe2VAl-based systems are indicative of large thermoelectric powerfactors. Indeed, Fe2VAl1-xSix with shows a large (n-type) power factor of mW/(K2m) in the range of KKato et al. (2001). Also Fe2V1+xAl1-x reaches a very favourable (n-type) powerfactor of mW/(K2m) for and p-type mW/(K2m) for Miyazaki et al. (2014). These value fall into the same performance class as standard Bi2Te3-based thermoelectrics for which mW/(K2m) in the same temperature range. However, the corresponding figures of merit are small: at 300K, e.g., for Fe2VAl0.9Ge0.1Nishino et al. (2006), or for Fe2VAl0.9Si0.07Sb0.03Mikami et al. (2009). Indeed the thermal conductivity of stoichiometric Fe2VAl reaches of 28W/(Km) at 300KNishino et al. (2006), which is an order of magnitude worse than in Bi2Te3.

III.5.2 Theoretical results.
Electronic structure.


Standard band-structure methods characterize Fe2VAl as a non-magnetic semi-metal, with a hole-pocket at and an electron-pocket at and a low-density pseudogap of meV in the DOSSingh and Mazin (1998); Weht and Pickett (1998); Weinert and Watson (1998); Guo et al. (1998), see the LDA results in Fig. (50). Improving on the exchange part in DFT, Fe2VAl becomes a semiconductor with an indirect gap between states of dominant Fe-t2g at and V-eg states at the -point. The size of this gap varies wildly in size depending on which functional and which admixture parameter is used, e.g., 200meV (mBJ)Bilc and Ghosez (2011); Do et al. (2011); Rai et al. (2016), 580 meV (PBE0)Do et al. (2011), or 340-620meV (B1-WC)Bilc and Ghosez (2011); Do et al. (2011). Therefore, we compare in Fig. (50) results of LDA (metallic) to that of the many-body perturbation theory QSGW757575which in particular does not depend on empirical parameters such as the fraction of Hartree-Fock admixtures., which yields a gap of meV. Contrary to exchange-improved DFT (see, e.g., Refs. Bilc and Ghosez (2011); Rai et al. (2016)), the conduction states are not merely shifted upwards rigidly in QSGW, but experience a narrowing of their band-width, see Fig. (50)(b). Interestingly, the effect is largest for the V--derived band that disperses from below 2eV at the or -point to around 6eV at .
Such band-width narrowings are a consequence of dynamical correlation effects. Treating the latter within DFT+dynamical mean-field theory, Kristanovski et al. Kristanovski et al. (2017) recently investigated the end member compounds (, ) of the Fe2+xV1-xAl series.767676 For DMFT calculations for another compounds in the binary Fe-Al system, see Galler et al. Galler et al. (2015); for magnetic properties of half-metallic Heusler compounds within DMFT, see, e.g., Refs. Katsnelson et al. (2008); Minár (2011) and references therein. For Fe2VAl they found, see Fig. (51), a strongly renormalized pseudogap of about 150meV at low temperatures and a mass-enhancement factor of 1.4 for vanadium states that were identified to dominate correlation-induced changes near the Fermi level. In particular, the spectral weight at the Fermi level was shown to be strongly dependent on temperature, causing a metallization with increasing temperature, reminiscent of what happens in FeSi (cf. Section (II.4.1)).777777Ref. Kristanovski et al. (2017) uses eV and eV for both Fe and V atoms, while constrained DFT yields eV, eVDo et al. (2011), and our constrained RPA for a maximally localized Wannier setup consisting of Fe- and V- orbitals gives eV, eV, eV, eV, where the ranges owe to an intra-shell orbital dependence.

Disorder and magnetism.
An alternative suggestion to explain that insulator-like transport properties coinciding with metallic photoemission spectrum resorts to issues of defects and disorder. Indeed, the discussed DMFT calculations build on a metallic GGA band-structure and incorporate correlation effects originating from local interactions. Longer range interaction lead, however, to significant exchange contributions in the self-energy that open a charge gap as discussed above for hybrid functionals and GW (cf. also the cases of FeSb2 in Section (II.2.2) and CoSb3 in Section (III.4)). Starting from an insulating host, diverse types of defects and disorder introduce states inside the gapBilc and Ghosez (2011).
Besides changes in the density-of-states at low-energies, deviations from perfect Fe2VAl also strongly affect magnetic properties: As mentioned above, stoichiometric Fe2VAl verifies the Slater-Pauling rule for the magnetic moment of full-Heusler compoundsGraf et al. (2011); Galanakis (2016), namely , with the total number of valence electrons per formula unit. Deviations from the stoichiometric valence count induces a spontaneous moment in experiments (see above). This is reproduced by band-theories—based on supercell setups or the coherent potential approximation—that see ferromagnetic order induced by excess vanadiumAntonov et al. (2008); Fujii et al. (2003), excess ironFujii et al. (2003), as well as anti-site defects (V for Fe, or Fe for Al)Bilc and Ghosez (2011). Among point defects, anti-site substitutions were shown to have the lowest formation enthalpiesBandaru and Jund (2016). In this picture, Fe2VAl is an intrinsic semiconductor whose puzzling transport and spectral properties are dominated by extrinsic effects.
In all, the electronic-structure of Fe2VAl is not yet properly understood. Indeed, as was the case for skutterudites (cf. Section (III.4)) the current Heusler compound presents a very challenging case, in which correlation and exchange effects beyond DFT-LDA need to be considered. Viable approaches will be mentioned in Section (IV). On top of this, the interplay of correlation effects and defects need to be considered, as pioneered in different contexts, e.g., by Lechermann et al. Lechermann and Obermeyer (2015); Lechermann et al. (2017).
Thermoelectricity.
From the theory side, the large powerfactors in Fe2YZ Heusler compounds has been rationalized to originate from an effective low-dimensionality in the electronic structureBilc et al. (2015). By this mechanism, it was shown that bulk semiconductors can realize highly directional conduction otherwise only found in actual low-dimensional systems.
Further, computing transport properties of Fe2VAl from first principles, using the semi-classical Boltzmann approach in the relaxation time approximation helped shedding some light onto the controversy of the compounds electronic structure. Do et al.Do et al. (2011) computed transport properties on top of their DFT (metallic with pseudogap) and DFT+U (insulating) electronic structure. A comparison with experimental results might elucidate whether from a thermoelectric point of view the pseudogap or the fully gapped scenario is more adequate. Using the pseudogap electronic structure, no thermopower values above V/K can be realized at 300K, even when considering (rigid band) doping Do et al. (2011); Xu et al. (2013); Al-Yamani and Hamad (2016). This finding is at odds with experiments for “stoichiometric” Fe2VAl, see Fig. (47)(b). The gapped electronic structure can qualitatively reproduce both the magnitude and the shape of the experimental thermopowerBilc and Ghosez (2011); Do et al. (2011), however only for densities that seem to be at odds with those extracted from the experimental Hall coefficient. Do et al.Do et al. (2011) suggested that the impact of defects needs to be included for a consistent description of Fe2VAl. Indeed, it was shown by Bilc and Ghosez Bilc and Ghosez (2011) and subsequently by Bandaru et al. Bandaru et al. (2017) that antisite defects largely impact the thermopower, and can easily flip its sign. While the powerfactor in the presence of such defects slightly decreasesBilc and Ghosez (2011), gets significantly enhanced in the simulationsBandaru et al. (2017) due to a notable reduction of thermal conduction.
Lessons for the Heusler compound Fe2VAl:
-
•
large, qualitative uncertainties in electronic structure.
-
•
need for treatment of both exchange and correlations beyond DFT.
-
•
interplay of intrinsic and defect, disorder derived states crucial for thermoelectric properties.
IV Conclusions and outlook
In this article we have reviewed signatures of electronic correlation effects, their microscopic origin, and their impact onto thermoelectricity in correlated narrow-gap semiconductors.
The salient characteristic of these systems is the large and unconventional temperature dependence in physical observables. In defiance of mere thermal activation across a fundamental gap, the most prominent members of these materials display an insulator-to-metal crossover at temperatures corresponding to energies of only a fraction of the gap size. Concomitantly, the magnetic susceptibility first grows to large values, before fluctuations disembogue into a Curie-Weiss-like decay.
In the microscopic picture emerging from realistic many-body calculations, the evolution of charge and spin degrees of freedom are intimately linked: The unlocking of spin fluctuations on transition-metal atoms cause the Brillouin zone momentum to seize being a good quantum number. The widening decomposition onto momentum-states corresponds to a diminishing lifetime of electronic excitations at a given momentum, causing incoherent spectral weight to spill into the gap, eventually filling it to realize a bad metal phase. Contrary to Mott insulators, the magnetic susceptibility is not dominated by local spin fluctuation. In fact, the main driving force of many-body effects in these systems was identified to be the Hund’s rule coupling787878In the genealogy of PhD advisors, Friedrich Hund is incidentally the author’s “great-grandfather”. entailing fluctuations to have ferromagnetic characteristics. The interplay of the Hund’s rule coupling and the hybridization gap explains the large variation of correlation signatures witnessed among various materials.
New realistic many-body simulations for Ce3Bi4Pt3 and the study of the Kondo-insulating nature of its states allowed for an in-depth comparison of heavy-fermion and -electron-based semiconductors. Based on a quite general classification of paramagnetic insulators from the dynamical mean-field perspective, we suggest an orbital-selective scenario for FeSi: While some iron- orbitals are Kondo-insulating, in others quantum fluctuations are suppressed by a more conventional gapping of non-local hybridizations.
As to the influence of correlation effects onto thermoelectricity, details matter, but simplistically one could summarize that (selective) mass enhancements (via the real-parts of the self-energy) are beneficial for a large thermopower, while (global) incoherence (described by the imaginary parts of the self-energy) is detrimental. We pointed hence out that many-body renormalizations that increase the particle-hole asymmetry are to be looked for, while coherence (excitation lifetimes) could be increased by diluting the atoms that host the dominant Hund’s rule coupling.
We further elaborated on new paths to exploit electronic correlations in thermoelectrics: In one proposal many-body effects have been suggested for the design of mobility gradients that were shown to enhance both the thermopower and the Nernst coefficientSun et al. (2015). Further, the time-honoured phonon-drag effect might find a revival and technical relevance. Indeed, it has been proposed that its effect is enhanced by coupling lattice vibrations to charge carriers with large effective massesTakahashi et al. (2016). Further, it was shownZhou et al. (2015) that phonon modes contributing to the phonon-drag can be separated from those dominating unwanted thermal conduction, heralding a new direction in the phonon-engineering route towards high-performance thermoelectrics.
The faithful simulation of thermoelectric properties of the silicides, antimonides, skutterudites, Heusler compounds discussed here, exposed several challenges for the future:
-
1.
Electronic structure: in all materials discussed here dynamical correlation effects beyond DFTKohn (1999); Jones and Gunnarsson (1989) or GWHedin (1965); Aryasetiawan and Gunnarsson (1998); Onida et al. (2002) have to be accounted for. In some, however, also exchange contributions to the self-energy beyond DFT and DFT+DMFT have been shown to be crucial for the electronic structure, let alone the computation of transport properties. This calls for the application of higher-level theories, such as the recent GW+DMFTBiermann et al. (2003); Biermann (2014); Werner and Casula (2016); Tomczak et al. (2017), QSGW+DMFTTomczak (2015); Choi et al. (2016), SEX+DMFTvan Roekeghem et al. (2014), or AbinitioDAGaller et al. (2017, 2018, 2017).
-
2.
Defects and disorder: as in more conventional semiconductors, effects of defects and disorder are a particular concern, especially when doping the stoichiometric parent compounds. Accounting for these effects in the presence of electronic correlation effects is a challenging, yet necessary endeavour for the future.
-
3.
Electron-phonon effects: future studies must address the impact of electronic correlations onto the phonon-structure, the interplay of electronic incoherence and thermal-disorder, as well as the phonon-drag effect.
Acknowledgements.
The author gratefully acknowledges discussions on topics related to this review with H. Aoki, M. Aronson, M. Battiato, S. Bühler-Paschen, O. Delaire, A. Galler, M. Gamża, A. Georges, K. Haule, K. Held, G. Kotliar, J. Kuneš, G. K. H. Madsen, E. Maggio, J. Mravlje, Hyowon Park, C. Petrovic, J. Pflaum, A. Prokofiev, G. Sangiovanni, F. Steglich, Peijie Sun, P. Tomes, A. Toschi, Wenhu Xu, V. Zlatić, Z. Zhong, as well as M. Battiato, S. Bühler-Paschen, K. Held, J. Kuneš for comments on parts of the manuscript. We thank A. Hausoel for providing pre-release capabilities and support of the w2dynamics package. This work has been supported by the Austrian Science Fund (FWF) through project “LinReTraCe” P 30213-N36. Some calculations were performed on the Vienna Scientific Cluster (VSC).References
- Zhang et al. (2015) L. Zhang, Y. Zhou, L. Guo, W. Zhao, A. Barnes, H.-T. Zhang, C. Eaton, Y. Zheng, M. Brahlek, H. F. Haneef, et al., Nature Materials 15, 204 EP (2015), article, URL http://dx.doi.org/10.1038/nmat4493.
- Ngai et al. (2014) J. Ngai, F. Walker, and C. Ahn, Annual Review of Materials Research 44, 1 (2014), URL http://dx.doi.org/10.1146/annurev-matsci-070813-113248.
- Scherwitzl et al. (2010) R. Scherwitzl, P. Zubko, I. G. Lezama, S. Ono, A. F. Morpurgo, G. Catalan, and J.-M. Triscone, Advanced Materials 22, 5517 (2010), ISSN 1521-4095, URL http://dx.doi.org/10.1002/adma.201003241.
- Zhong et al. (2015) Z. Zhong, M. Wallerberger, J. M. Tomczak, C. Taranto, N. Parragh, A. Toschi, G. Sangiovanni, and K. Held, Phys. Rev. Lett. 114, 246401 (2015), preprint arXiv:1312.5989, URL http://link.aps.org/doi/10.1103/PhysRevLett.114.246401.
- Moyer et al. (2013) J. A. Moyer, C. Eaton, and R. Engel-Herbert, Advanced Materials 25, 3578 (2013), ISSN 1521-4095, URL http://dx.doi.org/10.1002/adma.201300900.
- Tomczak et al. (2013a) J. M. Tomczak, L. V. Pourovskii, L. Vaugier, A. Georges, and S. Biermann, Proc. Natl. Acad. Sci. USA 110, 904 (2013a), preprint arXiv:1301.0630, URL http://www.pnas.org/content/110/3/904.abstract.
- Li et al. (2012) S.-Y. Li, G. Niklasson, and C. Granqvist, Thin Solid Films 520, 3823 (2012), ISSN 0040-6090, 7th International Symposium on Transparent Oxide Thin Films for Electronics and Optics (TOEO-7), URL http://www.sciencedirect.com/science/article/pii/S0040609011017937.
- Tomczak and Biermann (2009a) J. M. Tomczak and S. Biermann, Phys. Status Solidi B (feature article) 246, 1996 (2009a), scientific Highlight of the Month of the Network, no. 88, August 2008, arXiv:0907.1575.
- Schlesinger et al. (1993) Z. Schlesinger, Z. Fisk, H.-T. Zhang, M. B. Maple, J. DiTusa, and G. Aeppli, Phys. Rev. Lett. 71, 1748 (1993).
- Bocelli et al. (1996) S. Bocelli, F. Marabelli, R. Spolenak, and E. Bauer, Mat. Res. Soc. Symp. Proc. 402, 361 (1996).
- Paschen et al. (1997) S. Paschen, E. Felder, M. A. Chernikov, L. Degiorgi, H. Schwer, H. R. Ott, D. P. Young, J. L. Sarrao, and Z. Fisk, Phys. Rev. B 56, 12916 (1997).
- Jaccarino et al. (1967) V. Jaccarino, G. K. Wertheim, J. H. Wernick, L. R. Walker, and S. Arajs, Phys. Rev. 160, 476 (1967).
- Takagi et al. (1981) S. Takagi, H. Yasuoka, S. Ogawa, and J. H. Wernick, Journal of the Physical Society of Japan 50, 2539 (1981), URL http://jpsj.ipap.jp/link?JPSJ/50/2539/.
- Wolfe et al. (1965) R. Wolfe, J. H. Wernick, and S. E. Haszko, Physics Letters 19, 449 (1965), ISSN 0031-9163, URL http://www.sciencedirect.com/science/article/pii/0031916365900946.
- Damascelli et al. (1997a) A. Damascelli, K. Schulte, D. van der Marel, M. F th, and A. A. Menovsky, Physica B 230-232, 787 (1997a), proceedings of the International Conference on Strongly Correlated Electron Systems, URL http://www.sciencedirect.com/science/article/pii/S092145269600840X.
- Menzel et al. (2009) D. Menzel, P. Popovich, N. N. Kovaleva, J. Schoenes, K. Doll, and A. V. Boris, Phys. Rev. B 79, 165111 (2009).
- Sales et al. (2011) B. C. Sales, O. Delaire, M. A. McGuire, and A. F. May, Phys. Rev. B 83, 125209 (2011).
- Buschinger et al. (1997a) B. Buschinger, W. Guth, M. Weiden, C. Geibel, F. Steglich, V. Vescoli, L. Degiorgi, and C. Wassilew-Reul, Journal of Alloys and Compounds 262-263, 238 (1997a), ISSN 0925-8388, proceedings of the Twelfth International Conference on Solid Compounds of Transition Elements, URL http://www.sciencedirect.com/science/article/pii/S0925838897003897.
- Buschinger et al. (1997b) B. Buschinger, C. Geibel, J. Diehl, M. Weiden, W. Guth, A. Wildbrett, S. Horn, and F. Steglich, Journal of Alloys and Compounds 256, 57 (1997b), ISSN 0925-8388, URL http://www.sciencedirect.com/science/article/pii/S0925838896030216.
- Vescoli et al. (1998) V. Vescoli, L. Degiorgi, B. Buschinger, W. Guth, C. Geibel, and F. Steglich, Solid State Communications 105, 367 (1998), ISSN 0038-1098, URL http://www.sciencedirect.com/science/article/pii/S0038109897101478.
- Hohl et al. (1998) H. Hohl, A. Ramirez, C. Goldmann, G. Ernst, and E. Bucher, Journal of Alloys and Compounds 278, 39 (1998), ISSN 0925-8388, URL http://www.sciencedirect.com/science/article/pii/S0925838898005842.
- Herzog et al. (2010a) A. Herzog, M. Marutzky, J. Sichelschmidt, F. Steglich, S. Kimura, S. Johnsen, and B. B. Iversen, Phys. Rev. B 82, 245205 (2010a), URL http://link.aps.org/doi/10.1103/PhysRevB.82.245205.
- Bentien et al. (2007) A. Bentien, S. Johnsen, G. K. H. Madsen, B. B. Iversen, and F. Steglich, Europhys. Lett. 80, 17008 (5pp) (2007), URL http://stacks.iop.org/0295-5075/80/17008.
- Sun et al. (2009a) P. Sun, N. Oeschler, S. Johnsen, B. B. Iversen, and F. Steglich, Applied Physics Express 2, 091102 (2009a), URL http://apex.ipap.jp/link?APEX/2/091102/.
- Hu et al. (2006) R. Hu, V. F. Mitrović, and C. Petrovic, Phys. Rev. B 74, 195130 (2006).
- Sun et al. (2013) P. Sun, W. Xu, J. M. Tomczak, G. Kotliar, M. Søndergaard, B. B. Iversen, and F. Steglich, Phys. Rev. B 88, 245203 (2013), preprint arXiv1309.3048, URL http://link.aps.org/doi/10.1103/PhysRevB.88.245203.
- Takahashi et al. (2016) H. Takahashi, R. Okazaki, S. Ishiwata, H. Taniguchi, A. Okutani, M. Hagiwara, and I. Terasaki, Nature Communications 7, 12732 EP (2016), article, URL http://dx.doi.org/10.1038/ncomms12732.
- Jie et al. (2012) Q. Jie, R. Hu, E. Bozin, A. Llobet, I. Zaliznyak, C. Petrovic, and Q. Li, Phys. Rev. B 86, 115121 (2012), URL http://link.aps.org/doi/10.1103/PhysRevB.86.115121.
- Harada et al. (2004) T. Harada, T. Kanomata, Y. Takahashi, O. Nashima, H. Yoshida, and T. Kaneko, Journal of Alloys and Compounds 383, 200 (2004), ISSN 0925-8388, proceedings of the 14th International Conference on Solid Compounds of Transition Elements (SCTE 2003), URL http://www.sciencedirect.com/science/article/pii/S0925838804004827.
- Fan et al. (1972) A. K. L. Fan, G. H. Rosenthal, H. L. McKinzie, and A. Wold, Journal of Solid State Chemistry 5, 136 (1972), ISSN 0022-4596, URL http://www.sciencedirect.com/science/article/B6WM2-4B6NPKF-R/2/a8a8ee62733efce7ff444b3ea07a01f5.
- Hulliger (1959) F. Hulliger, Helv. Phys. Acta 32, 615 (1959).
- Boda et al. (1971) G. Boda, B. Stenström, V. Sagredo, O. Beckman, B. Carlsson, and S. Rundqvist, Physica Scripta 4, 132 (1971), URL http://stacks.iop.org/1402-4896/4/i=3/a=010.
- Sales et al. (2012) B. C. Sales, A. F. May, M. A. McGuire, M. B. Stone, D. J. Singh, and D. Mandrus, Phys. Rev. B 86, 235136 (2012), URL http://link.aps.org/doi/10.1103/PhysRevB.86.235136.
- Knyazev and Kuz’min (2017) Y. V. Knyazev and Y. I. Kuz’min, Physics of the Solid State 59, 2244 (2017), ISSN 1090-6460, URL https://doi.org/10.1134/S1063783417110154.
- Amagai et al. (2004) Y. Amagai, A. Yamamoto, T. Iida, and Y. Takanashi, Journal of Applied Physics 96, 5644 (2004), URL http://dx.doi.org/10.1063/1.1803947.
- Gamża et al. (2014) M. B. Gamża, J. M. Tomczak, C. Brown, A. Puri, G. Kotliar, and M. C. Aronson, Phys. Rev. B 89, 195102 (2014), preprint arXiv:1405.2369, URL http://link.aps.org/doi/10.1103/PhysRevB.89.195102.
- Hadano et al. (2009) Y. Hadano, S. Narazu, M. A. Avila, T. Onimaru, and T. Takabatake, J. Phys. Soc. Jpn. 78, 013702 (2009), URL http://jpsj.ipap.jp/link?JPSJ/78/013702/.
- Arita et al. (2011) M. Arita, K. Shimada, Y. Utsumi, O. Morimoto, H. Sato, H. Namatame, M. Taniguchi, Y. Hadano, and T. Takabatake, Phys. Rev. B 83, 245116 (2011), URL http://link.aps.org/doi/10.1103/PhysRevB.83.245116.
- Tsujii et al. (2008a) N. Tsujii, H. Yamaoka, M. Matsunami, R. Eguchi, Y. Ishida, Y. Senba, H. Ohashi, S. Shin, T. Furubayashi, H. Abe, et al., Journal of the Physical Society of Japan 77, 024705 (2008a), URL http://dx.doi.org/10.1143/JPSJ.77.024705.
- Haldolaarachchige et al. (2011) N. Haldolaarachchige, A. B. Karki, W. A. Phelan, Y. M. Xiong, R. Jin, J. Y. Chan, S. Stadler, and D. P. Young, Journal of Applied Physics 109, 103712 (2011), URL http://link.aip.org/link/?JAP/109/103712/1.
- Wagner-Reetz et al. (2014) M. Wagner-Reetz, D. Kasinathan, W. Schnelle, R. Cardoso-Gil, H. Rosner, Y. Grin, and P. Gille, Phys. Rev. B 90, 195206 (2014), URL http://link.aps.org/doi/10.1103/PhysRevB.90.195206.
- Tang et al. (2015) Y. Tang, Z. M. Gibbs, L. A. Agapito, G. Li, H.-S. Kim, M. B. Nardelli, S. Curtarolo, and G. J. Snyder, Nat Mater 14, 1223 (2015), ISSN 1476-1122, article, URL http://dx.doi.org/10.1038/nmat4430.
- Sharp et al. (1995) J. W. Sharp, E. C. Jones, R. K. Williams, P. M. Martin, and B. C. Sales, Journal of Applied Physics 78, 1013 (1995), URL https://doi.org/10.1063/1.360402.
- Yang et al. (2000) J. Yang, G. P. Meisner, D. T. Morelli, and C. Uher, Phys. Rev. B 63, 014410 (2000), URL https://link.aps.org/doi/10.1103/PhysRevB.63.014410.
- Mandrus et al. (1995a) D. Mandrus, A. Migliori, T. W. Darling, M. F. Hundley, E. J. Peterson, and J. D. Thompson, Phys. Rev. B 52, 4926 (1995a), URL https://link.aps.org/doi/10.1103/PhysRevB.52.4926.
- Zhang et al. (2011a) J. Zhang, B. Xu, L.-M. Wang, D. Yu, Z. Liu, J. He, and Y. Tian, Applied Physics Letters 98, 072109 (2011a), URL https://doi.org/10.1063/1.3557068.
- Kawaharada et al. (2001) Y. Kawaharada, K. Kurosaki, M. Uno, and S. Yamanaka, Journal of Alloys and Compounds 315, 193 (2001), ISSN 0925-8388, URL http://www.sciencedirect.com/science/article/pii/S0925838800012755.
- Kuznetsov et al. (2003) V. L. Kuznetsov, L. A. Kuznetsova, and D. M. Rowe, Journal of Physics: Condensed Matter 15, 5035 (2003), URL http://stacks.iop.org/0953-8984/15/i=29/a=315.
- Kato et al. (2000) M. Kato, Y. Nishino, U. Mizutani, and S. Asano, Journal of Physics: Condensed Matter 12, 1769 (2000), URL http://stacks.iop.org/0953-8984/12/i=8/a=318.
- Nakama et al. (2005) T. Nakama, Y. Takaesu, K. Yagasaki, T. Naka, A. Matsushita, K. Fukuda, and Y. Yamada, Journal of the Physical Society of Japan 74, 1378 (2005), URL https://doi.org/10.1143/JPSJ.74.1378.
- Lue and Ross (1998) C.-S. Lue and J. H. Ross, Phys. Rev. B 58, 9763 (1998), URL https://link.aps.org/doi/10.1103/PhysRevB.58.9763.
- Knapp et al. (2017) I. Knapp, B. Budinska, D. Milosavljevic, P. Heinrich, S. Khmelevskyi, R. Moser, R. Podloucky, P. Prenninger, and E. Bauer, Phys. Rev. B 96, 045204 (2017), URL https://link.aps.org/doi/10.1103/PhysRevB.96.045204.
- Okamura et al. (2000) H. Okamura, J. Kawahara, T. Nanba, S. Kimura, K. Soda, U. Mizutani, Y. Nishino, M. Kato, I. Shimoyama, H. Miura, et al., Phys. Rev. Lett. 84, 3674 (2000), URL https://link.aps.org/doi/10.1103/PhysRevLett.84.3674.
- Shreder et al. (2015) E. I. Shreder, A. D. Svyazhin, and A. A. Makhnev, Optics and Spectroscopy 119, 969 (2015), ISSN 1562-6911, URL http://dx.doi.org/10.1134/S0030400X1511020X.
- Miyazaki et al. (2014) H. Miyazaki, S. Tanaka, N. Ide, K. Soda, and Y. Nishino, Materials Research Express 1, 015901 (2014), URL http://stacks.iop.org/2053-1591/1/i=1/a=015901.
- Yamaguchi et al. (1996) S. Yamaguchi, Y. Okimoto, H. Taniguchi, and Y. Tokura, Phys. Rev. B 53, R2926 (1996), URL https://link.aps.org/doi/10.1103/PhysRevB.53.R2926.
- Tokura et al. (1998) Y. Tokura, Y. Okimoto, S. Yamaguchi, H. Taniguchi, T. Kimura, and H. Takagi, Phys. Rev. B 58, R1699 (1998), URL https://link.aps.org/doi/10.1103/PhysRevB.58.R1699.
- Señarı́s-Rodrı́guez and Goodenough (1995) M. Señarı́s-Rodrı́guez and J. Goodenough, Journal of Solid State Chemistry 116, 224 (1995), ISSN 0022-4596, URL http://www.sciencedirect.com/science/article/pii/S0022459685712078.
- Benedict et al. (2016) C. J. Benedict, A. Rao, G. Sanjeev, G. Okram, and P. Babu, Journal of Magnetism and Magnetic Materials 397, 145 (2016), ISSN 0304-8853, URL http://www.sciencedirect.com/science/article/pii/S0304885315305266.
- Bucher et al. (1994) B. Bucher, Z. Schlesinger, P. C. Canfield, and Z. Fisk, Phys. Rev. Lett. 72, 522 (1994), URL https://link.aps.org/doi/10.1103/PhysRevLett.72.522.
- Hundley et al. (1990) M. F. Hundley, P. C. Canfield, J. D. Thompson, Z. Fisk, and J. M. Lawrence, Phys. Rev. B 42, 6842 (1990), URL https://link.aps.org/doi/10.1103/PhysRevB.42.6842.
- Dzsaber et al. (2017) S. Dzsaber, L. Prochaska, A. Sidorenko, G. Eguchi, R. Svagera, M. Waas, A. Prokofiev, Q. Si, and S. Paschen, Phys. Rev. Lett. 118, 246601 (2017), URL https://link.aps.org/doi/10.1103/PhysRevLett.118.246601.
- Severing et al. (1991) A. Severing, J. D. Thompson, P. C. Canfield, Z. Fisk, and P. Riseborough, Phys. Rev. B 44, 6832 (1991), URL https://link.aps.org/doi/10.1103/PhysRevB.44.6832.
- Katoh and Takabatake (1998) K. Katoh and T. Takabatake, Journal of Alloys and Compounds 268, 22 (1998), ISSN 0925-8388, URL http://www.sciencedirect.com/science/article/pii/S0925838897005835.
- Holseth and Kjekshus (1980) H. Holseth and A. Kjekshus, Acta Chemica Scandinavica 24, 3309 (1980).
- Hu et al. (2007a) R. Hu, V. F. Mitrović, and C. Petrovic, Phys. Rev. B 76, 115105 (2007a).
- Imada et al. (1998) M. Imada, A. Fujimori, and Y. Tokura, Metal-insulator transitions (1998).
- Nishino et al. (1997a) Y. Nishino, M. Kato, S. Asano, K. Soda, M. Hayasaki, and U. Mizutani, Phys. Rev. Lett. 79, 1909 (1997a), URL https://link.aps.org/doi/10.1103/PhysRevLett.79.1909.
- Damascelli et al. (1997b) A. Damascelli, K. Schulte, D. van der Marel, and A. A. Menovsky, Phys. Rev. B 55, R4863 (1997b), URL http://link.aps.org/doi/10.1103/PhysRevB.55.R4863.
- Chernikov et al. (1997) M. A. Chernikov, L. Degiorgi, E. Felder, S. Paschen, A. D. Bianchi, H. R. Ott, J. L. Sarrao, Z. Fisk, and D. Mandrus, Phys. Rev. B 56, 1366 (1997).
- Perucchi et al. (2006) A. Perucchi, L. Degiorgi, R. Hu, C. Petrovic, and V. F. Mitrovic, The European Physical Journal B 54, 175 (2006), URL http://www.springerlink.com/content/q650164760u50155.
- Nyhus et al. (1995) P. Nyhus, S. L. Cooper, and Z. Fisk, Phys. Rev. B 51, 15626 (1995).
- Park et al. (1995) C.-H. Park, Z.-X. Shen, A. G. Loeser, D. S. Dessau, D. G. Mandrus, A. Migliori, J. Sarrao, and Z. Fisk, Phys. Rev. B 52, R16981 (1995), URL http://link.aps.org/doi/10.1103/PhysRevB.52.R16981.
- Saitoh et al. (1995) T. Saitoh, A. Sekiyama, T. Mizokawa, A. Fujimori, K. Ito, H. Nakamura, and M. Shiga, Solid State Communications 95, 307 (1995), ISSN 0038-1098, URL http://www.sciencedirect.com/science/article/pii/0038109895002774.
- Klein et al. (2009) M. Klein, D. Menzel, K. Doll, M. Neef, D. Zur, I. Jursic, J. Schoenes, and F. Reinert, New Journal of Physics 11, 023026 (2009), URL http://stacks.iop.org/1367-2630/11/i=2/a=023026.
- Ishizaka et al. (2005) K. Ishizaka, T. Kiss, T. Shimojima, T. Yokoya, T. Togashi, S. Watanabe, C. Q. Zhang, C. T. Chen, Y. Onose, Y. Tokura, et al., Phys. Rev. B 72, 233202 (2005).
- Arita et al. (2008a) M. Arita, K. Shimada, Y. Takeda, M. Nakatake, H. Namatame, M. Taniguchi, H. Negishi, T. Oguchi, T. Saitoh, A. Fujimori, et al., Phys. Rev. B 77, 205117 (2008a).
- Fäth et al. (1998) M. Fäth, J. Aarts, A. A. Menovsky, G. J. Nieuwenhuys, and J. A. Mydosh, Phys. Rev. B 58, 15483 (1998), URL https://link.aps.org/doi/10.1103/PhysRevB.58.15483.
- Rozenberg et al. (1996) M. J. Rozenberg, G. Kotliar, and H. Kajueter, Phys. Rev. B 54, 8452 (1996).
- Kohn (1999) W. Kohn, Rev. Mod. Phys. 71, 1253 (1999).
- Jones and Gunnarsson (1989) R. O. Jones and O. Gunnarsson, Rev. Mod. Phys. 61, 689 (1989).
- Friemelt et al. (1996) K. Friemelt, J. F. Ditusa, E. Bucher, and G. Aeppli, Annalen der Physik 508, 175 (1996), ISSN 1521-3889, URL http://dx.doi.org/10.1002/andp.2065080206.
- DiTusa et al. (1997) J. F. DiTusa, K. Friemelt, E. Bucher, G. Aeppli, and A. P. Ramirez, Phys. Rev. Lett. 78, 2831 (1997), URL https://link.aps.org/doi/10.1103/PhysRevLett.78.2831.
- DiTusa et al. (1998) J. F. DiTusa, K. Friemelt, E. Bucher, G. Aeppli, and A. P. Ramirez, Phys. Rev. B 58, 10288 (1998), URL https://link.aps.org/doi/10.1103/PhysRevB.58.10288.
- Delaire et al. (2013) O. Delaire, I. I. Al-Qasir, J. Ma, A. M. dos Santos, B. C. Sales, L. Mauger, M. B. Stone, D. L. Abernathy, Y. Xiao, and M. Somayazulu, Phys. Rev. B 87, 184304 (2013), URL https://link.aps.org/doi/10.1103/PhysRevB.87.184304.
- Sun et al. (2011) P. Sun, M. Sondergaard, Y. Sun, S. Johnsen, B. B. Iversen, and F. Steglich, 98, 072105 (2011), ISSN 00036951, URL http://dx.doi.org/doi/10.1063/1.3556645.
- Bentien et al. (2006) A. Bentien, G. K. H. Madsen, S. Johnsen, and B. B. Iversen, Phys. Rev. B 74, 205105 (2006), URL http://link.aps.org/abstract/PRB/v74/e205105.
- Caillat et al. (1996) T. Caillat, A. Borshchevsky, and J. Fleurial, Journal of Applied Physics 80, 4442 (1996), URL https://doi.org/10.1063/1.363405.
- Anno et al. (1999) H. Anno, K. Matsubara, Y. Notohara, T. Sakakibara, and H. Tashiro, Journal of Applied Physics 86, 3780 (1999), URL https://doi.org/10.1063/1.371287.
- Dyck et al. (2002) J. S. Dyck, W. Chen, J. Yang, G. P. Meisner, and C. Uher, Phys. Rev. B 65, 115204 (2002), URL https://link.aps.org/doi/10.1103/PhysRevB.65.115204.
- Lue et al. (1999) C. S. Lue, J. H. Ross, C. F. Chang, and H. D. Yang, Phys. Rev. B 60, R13941 (1999), URL https://link.aps.org/doi/10.1103/PhysRevB.60.R13941.
- Koyama et al. (2007) T. Koyama, Y. Fukui, Y. Muro, T. Nagao, H. Nakamura, and T. Kohara, Phys. Rev. B 76, 073203 (2007), URL http://link.aps.org/abstract/PRB/v76/e073203.
- Morelli et al. (1997) D. T. Morelli, G. P. Meisner, B. Chen, S. Hu, and C. Uher, Phys. Rev. B 56, 7376 (1997), URL https://link.aps.org/doi/10.1103/PhysRevB.56.7376.
- Koo et al. (2018) B. Koo, K. Bader, U. Burkhardt, M. Baenitz, P. Gille, and J. Sichelschmidt, Journal of Physics: Condensed Matter 30, 045601 (2018), URL http://stacks.iop.org/0953-8984/30/i=4/a=045601.
- Stone et al. (2012) M. B. Stone, M. D. Lumsden, S. E. Nagler, D. J. Singh, J. He, B. C. Sales, and D. Mandrus, Phys. Rev. Lett. 108, 167202 (2012), URL https://link.aps.org/doi/10.1103/PhysRevLett.108.167202.
- Bauer et al. (1998) E. Bauer, A. Galatanu, R. Hauser, C. Reichl, G. Wiesinger, G. Zaussinger, M. Galli, and F. Marabelli, Journal of Magnetism and Magnetic Materials 177, 1401 (1998), ISSN 0304-8853, international Conference on Magnetism (Part II), URL http://www.sciencedirect.com/science/article/pii/S0304885397007865.
- Yeo et al. (2003) S. Yeo, S. Nakatsuji, A. D. Bianchi, P. Schlottmann, Z. Fisk, L. Balicas, P. A. Stampe, and R. J. Kennedy, Phys. Rev. Lett. 91, 046401 (2003), URL https://link.aps.org/doi/10.1103/PhysRevLett.91.046401.
- Paschen et al. (1999) S. Paschen, D. Pushin, H. Ott, D. Young, and Z. Fisk, Physica B: Condensed Matter 259–261, 864 (1999), ISSN 0921-4526, URL http://www.sciencedirect.com/science/article/pii/S0921452698009703.
- Beille et al. (1983a) J. Beille, J. Voiron, and M. Roth, Solid State Communications 47, 399 (1983a), ISSN 0038-1098, URL http://www.sciencedirect.com/science/article/pii/0038109883909286.
- Shimizu et al. (1990) K. Shimizu, H. Maruyama, H. Yamazaki, and H. Watanabe, Journal of the Physical Society of Japan 59, 305 (1990), URL http://dx.doi.org/10.1143/JPSJ.59.305.
- Manyala et al. (2000) N. Manyala, Y. Sidis, J. F. DiTusa, G. Aeppli, D. P. Young, and Z. Fisk, Nature 404, 581 (2000), ISSN 0028-0836, URL http://dx.doi.org/10.1038/35007030.
- Onose et al. (2005) Y. Onose, N. Takeshita, C. Terakura, H. Takagi, and Y. Tokura, Phys. Rev. B 72, 224431 (2005), URL https://link.aps.org/doi/10.1103/PhysRevB.72.224431.
- Hu et al. (2007b) R. Hu, R. P. Hermann, F. Grandjean, Y. Lee, J. B. Warren, V. F. Mitrović, and C. Petrovic, Phys. Rev. B 76, 224422 (2007b), URL http://link.aps.org/abstract/PRB/v76/e224422.
- Naka et al. (2012) T. Naka, K. Sato, M. Taguchi, T. Nakane, F. Ishikawa, Y. Yamada, Y. Takaesu, T. Nakama, and A. Matsushita, Phys. Rev. B 85, 085130 (2012), URL https://link.aps.org/doi/10.1103/PhysRevB.85.085130.
- Kanomata et al. (2001) T. Kanomata, T. Sasaki, T. Hoshi, T. Narita, T. Harada, H. Nishihara, T. Yoshida, R. Note, K. Koyama, H. Nojiri, et al., Journal of Alloys and Compounds 317-318, 390 (2001), ISSN 0925-8388, the 13th International Conference on Solid Compounds of Transition Elements, URL http://www.sciencedirect.com/science/article/pii/S0925838800014444.
- Matsuda et al. (2000) H. Matsuda, K. Endo, K. Ooiwa, M. Iijima, Y. Takano, H. Mitamura, T. Goto, M. Tokiyama, and J. Arai, Journal of the Physical Society of Japan 69, 1004 (2000), URL https://doi.org/10.1143/JPSJ.69.1004.
- Saha et al. (2009) R. Saha, V. Srinivas, and T. V. C. Rao, Phys. Rev. B 79, 174423 (2009), URL https://link.aps.org/doi/10.1103/PhysRevB.79.174423.
- Sato et al. (2010) K. Sato, T. Naka, M. Taguchi, T. Nakane, F. Ishikawa, Y. Yamada, Y. Takaesu, T. Nakama, A. de Visser, and A. Matsushita, Phys. Rev. B 82, 104408 (2010), URL https://link.aps.org/doi/10.1103/PhysRevB.82.104408.
- Soda et al. (2004) K. Soda, H. Murayama, S. Yagi, M. Kato, T. Takeuchi, U. Mizutani, S. Imada, S. Suga, Y. Saitoh, T. Muro, et al., Physica B: Condensed Matter 351, 338 (2004), ISSN 0921-4526, proceedings of The International Symposium on Synchrotron Radiation Research for Spin and Electronic States in d and f Electron Systems, URL http://www.sciencedirect.com/science/article/pii/S0921452604007562.
- Sales et al. (1994) B. C. Sales, E. C. Jones, B. C. Chakoumakos, J. A. Fernandez-Baca, H. E. Harmon, J. W. Sharp, and E. H. Volckmann, Phys. Rev. B 50, 8207 (1994), URL https://link.aps.org/doi/10.1103/PhysRevB.50.8207.
- Heremans (2016) J. P. Heremans, Proc. SPIE 9821, 98210G (2016), URL http://dx.doi.org/10.1117/12.2228756.
- Manyala et al. (2004) N. Manyala, Y. Sidis, J. F. DiTusa, G. Aeppli, D. P. Young, and Z. Fisk, Nat Mater 3, 255 (2004), ISSN 1476-1122, URL http://dx.doi.org/10.1038/nmat1103.
- Ferrarotti, A. S. et al. (2000) Ferrarotti, A. S., Gail, H.-P., Degiorgi, L., and Ott, H. R., A&A 357, L13 (2000).
- Lodders and Fegley (1999) K. Lodders and J. B. Fegley, in Asymptotic Giant Stars, edited by T. Le Bertre, A. Léebre, and C. Waelkens (IAU Symp. (Cambridge: Cambridge Univ. Press), 1999), vol. 191, p. 279.
- Knittle and Williams (1995) E. Knittle and Q. Williams, Geophysical Research Letters 22, 445 (1995), ISSN 1944-8007, URL http://dx.doi.org/10.1029/94GL03346.
- Caracas and Wentzcovitch (2004) R. Caracas and R. Wentzcovitch, Geophysical Research Letters 31, n/a (2004), ISSN 1944-8007, l20603, URL http://dx.doi.org/10.1029/2004GL020601.
- Lin et al. (2003) J.-F. Lin, A. J. Campbell, D. L. Heinz, and G. Shen, Journal of Geophysical Research: Solid Earth 108, n/a (2003), ISSN 2156-2202, 2045, URL http://dx.doi.org/10.1029/2002JB001978.
- Dubrovinsky et al. (2003) L. Dubrovinsky, N. Dubrovinskaia, F. Langenhorst, D. Dobson, D. Rubie, C. Geßmann, I. A. Abrikosov, B. Johansson, V. I. Baykov, L. Vitos, et al., Nature 422, 58 EP (2003), URL http://dx.doi.org/10.1038/nature01422.
- Fernández-Madrigal et al. (2001) F. J. Fernández-Madrigal, P. Lavela, C. Pérez-Vicente, and J. L. Tirado, Journal of Electroanalytical Chemistry 501, 205 (2001), ISSN 1572-6657, URL http://www.sciencedirect.com/science/article/pii/S0022072800005295.
- Park and Sohn (2010) C.-M. Park and H.-J. Sohn, Electrochimica Acta 55, 4987 (2010), ISSN 0013-4686, URL http://www.sciencedirect.com/science/article/pii/S0013468610005347.
- Graf et al. (2011) T. Graf, C. Felser, and S. S. Parkin, Progress in Solid State Chemistry 39, 1 (2011), ISSN 0079-6786, URL //www.sciencedirect.com/science/article/pii/S0079678611000021.
- Galanakis (2016) I. Galanakis, Theory of Heusler and Full-Heusler Compounds (Springer International Publishing, Cham, 2016), pp. 3–36, ISBN 978-3-319-21449-8, URL http://dx.doi.org/10.1007/978-3-319-21449-8_1.
- Sun et al. (2014) P. Sun, B. Wei, D. Menzel, and F. Steglich, Phys. Rev. B 90, 245146 (2014), URL http://link.aps.org/doi/10.1103/PhysRevB.90.245146.
- Hundley et al. (1994a) M. F. Hundley, P. C. Canfield, J. D. Thompson, and Z. Fisk, Phys. Rev. B 50, 18142 (1994a), URL https://link.aps.org/doi/10.1103/PhysRevB.50.18142.
- G. Aeppli (1992) Z. F. G. Aeppli, Comments Cond. Mat. Phys 16, 150 (1992).
- Fisk et al. (1995) Z. Fisk, J. Sarrao, J. Thompson, D. Mandrus, M. Hundley, A. Miglori, B. Bucher, Z. Schlesinger, G. Aeppli, E. Bucher, et al., Physica B: Condensed Matter 206, 798 (1995), ISSN 0921-4526, URL http://www.sciencedirect.com/science/article/pii/092145269400588M.
- Mandrus et al. (1995b) D. Mandrus, J. L. Sarrao, A. Migliori, J. D. Thompson, and Z. Fisk, Phys. Rev. B 51, 4763 (1995b).
- Petrovic et al. (2003) C. Petrovic, J. W. Kim, S. L. Bud’ko, A. I. Goldman, P. C. Canfield, W. Choe, and G. J. Miller, Phys. Rev. B 67, 155205 (2003).
- Petrovic et al. (2005) C. Petrovic, Y. Lee, T. Vogt, N. D. Lazarov, S. L. Bud’ko, and P. C. Canfield, Phys. Rev. B 72, 045103 (2005).
- Lacerda et al. (1993) A. Lacerda, H. Zhang, P. Canfield, M. Hundley, Z. Fisk, J. Thompson, C. Seaman, M. Maple, and G. Aeppli, Physica B: Condensed Matter 186, 1043 (1993), ISSN 0921-4526, URL http://www.sciencedirect.com/science/article/pii/092145269390780A.
- Schlesinger et al. (1997) Z. Schlesinger, Z. Fisk, H.-T. Zhang, and M. Maple, Physica B 237-238, 460 (1997), proceedings of the Yamada Conference XLV, the International Conference on the Physics of Transition Metals, URL http://www.sciencedirect.com/science/article/pii/S0921452697001373.
- Hunt et al. (1994) M. B. Hunt, M. A. Chernikov, E. Felder, H. R. Ott, Z. Fisk, and P. Canfield, Phys. Rev. B 50, 14933 (1994), URL https://link.aps.org/doi/10.1103/PhysRevB.50.14933.
- Spałek and Ślebarski (2011) J. Spałek and A. Ślebarski, Journal of Physics: Conference Series 273, 012055 (2011), URL http://stacks.iop.org/1742-6596/273/i=1/a=012055.
- Coleman (2007) P. Coleman, Heavy Fermions: Electrons at the Edge of Magnetism (John Wiley & Sons, Ltd, 2007), ISBN 9780470022184, URL http://dx.doi.org/10.1002/9780470022184.hmm105.
- Doniach (1977) S. Doniach, Physica B+C 91, 231 (1977), ISSN 0378-4363, URL http://www.sciencedirect.com/science/article/pii/0378436377901905.
- Degiorgi (1999) L. Degiorgi, Rev. Mod. Phys. 71, 687 (1999), URL http://link.aps.org/doi/10.1103/RevModPhys.71.687.
- Riseborough (2000) P. S. Riseborough, Advances in Physics 49, 257 (2000), URL http://dx.doi.org/10.1080/000187300243345.
- Dzero et al. (2016) M. Dzero, J. Xia, V. Galitski, and P. Coleman, Annual Review of Condensed Matter Physics 7, 249 (2016), URL https://doi.org/10.1146/annurev-conmatphys-031214-014749.
- Takeda et al. (1999) Y. Takeda, M. Arita, H. Sato, K. Shimada, H. Namatame, M. Taniguchi, K. Katoh, F. Iga, and T. Takabatake, Journal of Electron Spectroscopy and Related Phenomena 101–103, 721 (1999), ISSN 0368-2048, URL http://www.sciencedirect.com/science/article/pii/S036820489800406X.
- Hundley et al. (1994b) M. Hundley, J. Thompson, P. Canfield, and Z. Fisk, Physica B: Condensed Matter 199–200, 443 (1994b), ISSN 0921-4526, URL http://www.sciencedirect.com/science/article/pii/0921452694918643.
- Sanchez-Castro et al. (1993) C. Sanchez-Castro, K. S. Bedell, and B. R. Cooper, Phys. Rev. B 47, 6879 (1993), URL https://link.aps.org/doi/10.1103/PhysRevB.47.6879.
- Yamaguchi et al. (2013) J. Yamaguchi, A. Sekiyama, M. Y. Kimura, H. Sugiyama, Y. Tomida, G. Funabashi, S. Komori, T. Balashov, W. Wulfhekel, T. Ito, et al., New Journal of Physics 15, 043042 (2013), URL http://stacks.iop.org/1367-2630/15/i=4/a=043042.
- Min et al. (2014) Chul-Hee Min, P. Lutz, S. Fiedler, B. Y. Kang, B.-K. Cho, H. D. Kim, H. Bentmann, and F. Reinert, Phys. Rev. Lett. 112, 226402 (2014), URL https://link.aps.org/doi/10.1103/PhysRevLett.112.226402.
- Denlinger et al. (2014) J. D. Denlinger, J. W. Allen, J.-S. Kang, K. Sun, B.-I. Min, D.-J. Kim, and Z. Fisk, SmB6 Photoemission: Past and Present (2014), vol. 3, p. 017038, URL http://journals.jps.jp/doi/abs/10.7566/JPSCP.3.017038.
- Xu et al. (2016) N. Xu, H. Ding, and M. Shi, Journal of Physics: Condensed Matter 28, 363001 (2016), URL http://stacks.iop.org/0953-8984/28/i=36/a=363001.
- Min et al. (2017) Chul-Hee Min, F. Goth, P. Lutz, H. Bentmann, B. Y. Kang, B. K. Cho, J. Werner, K.-S. Chen, F. Assaad, and F. Reinert, Scientific Reports 7, 11980 (2017), URL https://doi.org/10.1038/s41598-017-12080-5.
- Damascelli (2002) A. Damascelli, Optical Spectroscopy of Quantum Spin Systems (PhD thesis, Rijksuniversiteit Groningen, 2002).
- Laube et al. (1999) F. Laube, G. Goll, C. Obermair, T. Pietrus, and H. Löhneysen, Physica B: Condensed Matter 259, 303 (1999), ISSN 0921-4526, URL http://www.sciencedirect.com/science/article/pii/S0921452698006346.
- Millis (2004) A. J. Millis, in Strong Interactions in Low Dimensions, edited by L. D. D. Baeriswyl (Physics and Chemistry of Materials with Low-Dimensional Structures, 2004), vol. 25, p. 195ff, URL http://www.springer.com/materials/book/978-1-4020-1798-8.
- Barker et al. (1968) A. S. Barker, B. I. Halperin, and T. M. Rice, Phys. Rev. Lett. 20, 384 (1968), URL https://link.aps.org/doi/10.1103/PhysRevLett.20.384.
- Katsufuji et al. (1995) T. Katsufuji, Y. Okimoto, T. Arima, Y. Tokura, and J. B. Torrance, Phys. Rev. B 51, 4830 (1995), URL https://link.aps.org/doi/10.1103/PhysRevB.51.4830.
- Rozenberg et al. (1995) M. J. Rozenberg, G. Kotliar, H. Kajueter, G. A. Thomas, D. H. Rapkine, J. M. Honig, and P. Metcalf, Phys. Rev. Lett. 75, 105 (1995).
- Okazaki et al. (2006) K. Okazaki, S. Sugai, Y. Muraoka, and Z. Hiroi, Phys. Rev. B 73, 165116 (2006).
- Qazilbash et al. (2008) M. M. Qazilbash, A. A. Schafgans, K. S. Burch, S. J. Yun, B. G. Chae, B. J. Kim, H. T. Kim, and D. N. Basov, Phys. Rev. B 77, 115121 (2008), URL https://link.aps.org/doi/10.1103/PhysRevB.77.115121.
- Tomczak and Biermann (2009b) J. M. Tomczak and S. Biermann, Phys. Rev. B 80, 085117 (pages 13) (2009b), preprint arXiv:0904.3388, URL http://link.aps.org/abstract/PRB/v80/e085117.
- Degiorgi et al. (1994) L. Degiorgi, M. B. Hunt, H. R. Ott, M. Dressel, B. J. Feenstra, G. Grüner, Z. Fisk, and P. Canfield, Europhys. Lett. 28, 341 (1994), URL http://stacks.iop.org/0295-5075/28/i=5/a=008.
- Takahashi et al. (2011) H. Takahashi, Y. Yasui, I. Terasaki, and M. Sato, Journal of the Physical Society of Japan 80, 054708 (2011), URL http://dx.doi.org/10.1143/JPSJ.80.054708.
- Reyes et al. (1994) A. P. Reyes, R. H. Heffner, P. C. Canfield, J. D. Thompson, and Z. Fisk, Phys. Rev. B 49, 16321 (1994), URL https://link.aps.org/doi/10.1103/PhysRevB.49.16321.
- Ahamad et al. (2017) S. Ahamad, R. Moessner, and O. Erten, ArXiv e-prints (2017) eprint 1709.08241.
- Shirane et al. (1987) G. Shirane, J. E. Fischer, Y. Endoh, and K. Tajima, Phys. Rev. Lett. 59, 351 (1987), URL http://link.aps.org/doi/10.1103/PhysRevLett.59.351.
- Tajima et al. (1988) K. Tajima, Y. Endoh, J. E. Fischer, and G. Shirane, Phys. Rev. B 38, 6954 (1988), URL http://link.aps.org/doi/10.1103/PhysRevB.38.6954.
- Kudasov et al. (1998) Y. B. Kudasov, A. I. Bykov, M. I. Dolotenko, N. P. Kolokol’chikov, M. P. Monakhov, I. M. Markevtsev, V. V. Platonov, V. D. Selemir, O. M. Tatsenko, A. V. Filippov, et al., Journal of Experimental and Theoretical Physics Letters 68, 350 (1998), ISSN 1090-6487, URL http://dx.doi.org/10.1134/1.567872.
- Kudasov et al. (1999) Y. B. Kudasov, A. I. Bykov, M. I. Dolotenko, N. P. Kolokol’chikov, M. P. Monakhov, I. M. Markevtsev, V. V. Platonov, V. D. Selemir, O. M. Tatsenko, A. V. Filippov, et al., Journal of Experimental and Theoretical Physics 89, 960 (1999), ISSN 1090-6509, URL http://dx.doi.org/10.1134/1.558938.
- Beach et al. (2004) K. S. D. Beach, P. A. Lee, and P. Monthoux, Phys. Rev. Lett. 92, 026401 (2004), URL https://link.aps.org/doi/10.1103/PhysRevLett.92.026401.
- Ohashi et al. (2004) T. Ohashi, A. Koga, S.-i. Suga, and N. Kawakami, Phys. Rev. B 70, 245104 (2004), URL https://link.aps.org/doi/10.1103/PhysRevB.70.245104.
- Hundley et al. (1993) M. Hundley, A. Lacerda, P. Canfield, J. Thompson, and Z. Fisk, Physica B: Condensed Matter 186–188, 425 (1993), ISSN 0921-4526, URL http://www.sciencedirect.com/science/article/pii/092145269390593U.
- Boebinger et al. (1995) G. Boebinger, A. Passner, P. Canfield, and Z. Fisk, Physica B: Condensed Matter 211, 227 (1995), ISSN 0921-4526, research in High Magnetic Fields, URL http://www.sciencedirect.com/science/article/pii/0921452694009925.
- Jaime et al. (2000) M. Jaime, R. Movshovich, G. R. Stewart, W. P. Beyermann, M. G. Berisso, M. F. Hundley, P. C. Canfield, and J. L. Sarrao, Nature 405, 160 (2000), ISSN 0028-0836, URL http://dx.doi.org/10.1038/35012027.
- Ohta et al. (1997) H. Ohta, T. Arioka, Y. Yamamoto, S. Mitsudo, T. Hamamoto, M. Motokawa, Y. Yamaguchi, and E. Kulatov, Physica B: Condensed Matter 237–238, 463 (1997), ISSN 0921-4526, proceedings of the Yamada Conference XLV, the International Conference on the Physics of Transition Metals, URL http://www.sciencedirect.com/science/article/pii/S0921452697001415.
- Lisunov et al. (1996) K. Lisunov, E. Arushanov, C. Kloc, J. Broto, J. Leotin, H. Rokoto, M. Respaud, and E. Bucher, Physica B: Condensed Matter 229, 37 (1996), ISSN 0921-4526, URL http://www.sciencedirect.com/science/article/pii/S092145269600508X.
- Samatham et al. (2012) S. S. Samatham, D. Venkateshwarlu, M. Gangrade, and V. Ganesan, physica status solidi (b) 249, 2258 (2012), ISSN 1521-3951, URL http://dx.doi.org/10.1002/pssb.201248237.
- Bauer et al. (1997) E. Bauer, S. Bocelli, R. Hauser, F. Marabelli, and R. Spolenak, Physica B: Condensed Matter 230-232, 794 (1997), ISSN 0921-4526, proceedings of the International Conference on Strongly Correlated Electron Systems, URL http://www.sciencedirect.com/science/article/pii/S0921452696008423.
- Koyama et al. (1999) K. Koyama, T. Goto, T. Kanomata, and R. Note, Journal of the Physical Society of Japan 68, 1693 (1999), URL http://dx.doi.org/10.1143/JPSJ.68.1693.
- Reichl et al. (1999) C. Reichl, G. Wiesinger, G. Zaussinger, E. Bauer, M. Galli, and F. Marabelli, Physica B: Condensed Matter 259, 866 (1999), ISSN 0921-4526, URL http://www.sciencedirect.com/science/article/pii/S0921452698011144.
- Mani et al. (2001) A. Mani, A. Bharathi, and Y. Hariharan, Phys. Rev. B 63, 115103 (2001), URL https://link.aps.org/doi/10.1103/PhysRevB.63.115103.
- Mani et al. (2012) A. Mani, J. Janaki, A. T. Satya, T. G. Kumary, and A. Bharathi, Journal of Physics: Condensed Matter 24, 075601 (2012), URL http://stacks.iop.org/0953-8984/24/i=7/a=075601.
- Takahashi et al. (2013) H. Takahashi, R. Okazaki, I. Terasaki, and Y. Yasui, Phys. Rev. B 88, 165205 (2013).
- J. D. Thompson and Severing (1993) J. D. Thompson, W. P. Beyermann, P. C. Canfield, Z. Fisk, M. F. Hundley, G. H. Kwei, R. S. Kwok, A. Lacerda, J. M Lawrence, and A. Severing, Transport and thermal properties of f-electron systems, (Plenum, New York, 1993).
- Cooley et al. (1997) J. C. Cooley, M. C. Aronson, and P. C. Canfield, Phys. Rev. B 55, 7533 (1997), URL https://link.aps.org/doi/10.1103/PhysRevB.55.7533.
- Limelette et al. (2003) P. Limelette, A. Georges, D. Jérome, P. Wzietek, P. Metcalf, and J. M. Honig, Science 302, 89 (2003), ISSN 0036-8075, URL http://science.sciencemag.org/content/302/5642/89.
- Grechnev et al. (1994) G. Grechnev, T. Jarlborg, A. Panfilov, M. Peter, and I. Svechkarev, Solid State Communications 91, 835 (1994), ISSN 0038-1098, URL http://www.sciencedirect.com/science/article/pii/0038109894906599.
- Pelzer et al. (2001) R. Pelzer, L. Naber, A. Galatanu, H. Sassik, and E. Bauer, Journal of Magnetism and Magnetic Materials 226, 227 (2001), ISSN 0304-8853, proceedings of the International Conference on Magnetism (ICM 2000), URL http://www.sciencedirect.com/science/article/pii/S0304885300006338.
- Beille et al. (1983b) J. Beille, M. B. Maple, J. Wittig, Z. Fisk, and L. E. DeLong, Phys. Rev. B 28, 7397 (1983b), URL https://link.aps.org/doi/10.1103/PhysRevB.28.7397.
- Iga et al. (1993) F. Iga, M. Kasaya, H. Suzuki, Y. Okayama, H. Takahashi, and N. Mori, Physica B: Condensed Matter 186, 419 (1993), ISSN 0921-4526, URL http://www.sciencedirect.com/science/article/pii/092145269390591S.
- Barla et al. (2005) A. Barla, J. Derr, J. P. Sanchez, B. Salce, G. Lapertot, B. P. Doyle, R. Rüffer, R. Lengsdorf, M. M. Abd-Elmeguid, and J. Flouquet, Phys. Rev. Lett. 94, 166401 (2005), URL https://link.aps.org/doi/10.1103/PhysRevLett.94.166401.
- Xu et al. (1996) X.-h. Xu, Z.-z. Li, and M.-w. Xiao, Phys. Rev. B 54, 12993 (1996), URL https://link.aps.org/doi/10.1103/PhysRevB.54.12993.
- Forthaus et al. (2011) M. K. Forthaus, G. R. Hearne, N. Manyala, O. Heyer, R. A. Brand, D. I. Khomskii, T. Lorenz, and M. M. Abd-Elmeguid, Phys. Rev. B 83, 085101 (2011), URL https://link.aps.org/doi/10.1103/PhysRevB.83.085101.
- Lundgren et al. (1968) L. Lundgren, K. Blom, and O. Beckman, Physics Letters A 28, 175 (1968), ISSN 0375-9601, URL http://www.sciencedirect.com/science/article/pii/0375960168901849.
- Lebech et al. (1989) B. Lebech, J. Bernhard, and T. Freltoft, Journal of Physics: Condensed Matter 1, 6105 (1989), URL http://stacks.iop.org/0953-8984/1/i=35/a=010.
- Ishikawa et al. (1976) Y. Ishikawa, K. Tajima, D. Bloch, and M. Roth, Solid State Communications 19, 525 (1976), ISSN 0038-1098, URL http://www.sciencedirect.com/science/article/pii/0038109876900570.
- Marklund et al. (1974) K. Marklund, M. Larsson, S. Byström, and T. Lindqvist, Physica Scripta 9, 47 (1974), URL http://stacks.iop.org/1402-4896/9/i=1/a=007.
- Wilhelm et al. (2016) H. Wilhelm, A. O. Leonov, U. K. Rößler, P. Burger, F. Hardy, C. Meingast, M. E. Gruner, W. Schnelle, M. Schmidt, and M. Baenitz, Phys. Rev. B 94, 144424 (2016), URL https://link.aps.org/doi/10.1103/PhysRevB.94.144424.
- Guritanu et al. (2007) V. Guritanu, D. van der Marel, J. Teyssier, T. Jarlborg, H. Wilhelm, M. Schmidt, and F. Steglich, Phys. Rev. B 75, 155114 (2007), URL https://link.aps.org/doi/10.1103/PhysRevB.75.155114.
- Schlottmann and Hellberg (1996) P. Schlottmann and C. S. Hellberg, Journal of Applied Physics 79, 6414 (1996), URL http://aip.scitation.org/doi/abs/10.1063/1.362014.
- Tsujii (2017) N. Tsujii, Journal of Physics: Conference Series 868, 012009 (2017), URL http://stacks.iop.org/1742-6596/868/i=1/a=012009.
- Bharathi et al. (1997) A. Bharathi, A. Mani, G. N. Rao, C. Sundar, and Y. Hariharan, Physica B: Condensed Matter 240, 1 (1997), ISSN 0921-4526, URL http://www.sciencedirect.com/science/article/pii/S0921452697004225.
- Wilhelm et al. (2007) H. Wilhelm, M. Schmidt, R. Cardoso-Gil, U. Burkhardt, M. Hanfland, U. Schwarz, and L. Akselrud, Science and Technology of Advanced Materials 8, 416 (2007), URL http://dx.doi.org/10.1016/j.stam.2007.04.004.
- Pedrazzini et al. (2007) P. Pedrazzini, H. Wilhelm, D. Jaccard, T. Jarlborg, M. Schmidt, M. Hanfland, L. Akselrud, H. Q. Yuan, U. Schwarz, Y. Grin, et al., Phys. Rev. Lett. 98, 047204 (2007), URL https://link.aps.org/doi/10.1103/PhysRevLett.98.047204.
- Schroder et al. (2000) A. Schroder, G. Aeppli, R. Coldea, M. Adams, O. Stockert, H. v. Lohneysen, E. Bucher, R. Ramazashvili, and P. Coleman, Nature 407, 351 (2000), ISSN 0028-0836, URL http://dx.doi.org/10.1038/35030039.
- Gegenwart et al. (2008) P. Gegenwart, Q. Si, and F. Steglich, Nat Phys 4, 186 (2008), ISSN 1745-2473, URL http://dx.doi.org/10.1038/nphys892.
- Wirth and Steglich (2016) S. Wirth and F. Steglich, 1, 16051 EP (2016), review Article, URL http://dx.doi.org/10.1038/natrevmats.2016.51.
- Si and Paschen (2013) Q. Si and S. Paschen, physica status solidi (b) 250, 425 (2013), ISSN 1521-3951, URL http://dx.doi.org/10.1002/pssb.201300005.
- Menon and Malik (1997) L. Menon and S. K. Malik, Phys. Rev. B 55, 14100 (1997), URL https://link.aps.org/doi/10.1103/PhysRevB.55.14100.
- Adroja et al. (1996) D. Adroja, B. Rainford, A. Neville, and A. Jansen, Physica B: Condensed Matter 223, 275 (1996), ISSN 0921-4526, proceedings of the International Conference on Strongly Correlated Electron Systems, URL http://www.sciencedirect.com/science/article/pii/0921452696000981.
- Sakurai et al. (1992) J. Sakurai, R. Kawamura, T. Taniguchi, S. Nishigori, S. Ikeda, H. Goshima, T. Suzuki, and T. Fujita, Journal of Magnetism and Magnetic Materials 104, 1415 (1992), ISSN 0304-8853, proceedings of the International Conference on Magnetism, Part II, URL http://www.sciencedirect.com/science/article/pii/0304885392906444.
- Nishigori et al. (1993) S. Nishigori, H. Goshima, T. Suzuki, T. Fujita, G. Nakamoto, T. Takabatake, H. Fujii, and J. Sakurai, Physica B: Condensed Matter 186, 406 (1993), ISSN 0921-4526, URL http://www.sciencedirect.com/science/article/pii/092145269390587V.
- Kalvius et al. (2000) G. Kalvius, A. Kratzer, G. Grosse, D. Noakes, R. Wäppling, H. Löhneysen, T. Takabatake, and Y. Echizen, Physica B: Condensed Matter 289, 256 (2000), ISSN 0921-4526, URL http://www.sciencedirect.com/science/article/pii/S0921452600003872.
- Kasaya et al. (1991) M. Kasaya, T. Tani, H. Suzuki, K. Ohoyama, and M. Kohgi, Journal of the Physical Society of Japan 60, 2542 (1991), URL http://dx.doi.org/10.1143/JPSJ.60.2542.
- Takabatake et al. (1996) T. Takabatake, G. Nakamoto, T. Yoshino, H. Fujii, K. Izawa, S. Nishigori, H. Goshima, T. Suzuki, T. Fujita, K. Maezawa, et al., Physica B: Condensed Matter 223, 413 (1996), ISSN 0921-4526, proceedings of the International Conference on Strongly Correlated Electron Systems, URL http://www.sciencedirect.com/science/article/pii/0921452696001378.
- Nakamoto et al. (1995) G. Nakamoto, T. Takabatake, Y. Bando, H. Fujii, K. Izawa, T. Suzuki, T. Fujita, A. Minami, I. Oguro, L. Tai, et al., Physica B: Condensed Matter 206, 840 (1995), ISSN 0921-4526, proceedings of the International Conference on Strongly Correlated Electron Systems, URL http://www.sciencedirect.com/science/article/pii/092145269400602R.
- Ikeda and Miyake (1996) H. Ikeda and K. Miyake, Journal of the Physical Society of Japan 65, 1769 (1996), URL http://jpsj.ipap.jp/link?JPSJ/65/1769/.
- Stockert et al. (2016) U. Stockert, P. Sun, N. Oeschler, F. Steglich, T. Takabatake, P. Coleman, and S. Paschen, Phys. Rev. Lett. 117, 216401 (2016), URL https://link.aps.org/doi/10.1103/PhysRevLett.117.216401.
- A.S. Panfilov and Sidorenko (1975) I. S. P. G. A.S. Panfilov, T.L. Pivovar and F. Sidorenko, Zh. Eksp. Teor. Fiz. 68, 2134 (1975).
- Ackerbauer et al. (2009) S. Ackerbauer, N. Krendelsberger, F. Weitzer, K. Hiebl, and J. C. Schuster, Intermetallics 17, 414 (2009), ISSN 0966-9795, URL http://www.sciencedirect.com/science/article/pii/S0966979508002811.
- Hunt et al. (2017) S. A. Hunt, E. T. H. Wann, D. P. Dobson, L. Vočadlo, and I. G. Wood, Journal of Physics: Condensed Matter 29, 335701 (2017), URL http://stacks.iop.org/0953-8984/29/i=33/a=335701.
- Manyala et al. (2008) N. Manyala, J. F. DiTusa, G. Aeppli, and A. P. Ramirez, Nature 454, 976 (2008), ISSN 0028-0836, URL http://dx.doi.org/10.1038/nature07137.
- Yadam et al. (2016) S. Yadam, D. Singh, D. Venkateshwarlu, M. K. Gangrade, S. S. Samatham, and V. Ganesan, Journal of Alloys and Compounds 663, 311 (2016), ISSN 0925-8388, URL http://www.sciencedirect.com/science/article/pii/S0925838815318387.
- Sinha et al. (2014) P. Sinha, N. A. Porter, and C. H. Marrows, Phys. Rev. B 89, 134426 (2014), URL https://link.aps.org/doi/10.1103/PhysRevB.89.134426.
- Canfield et al. (1992) P. Canfield, J. Thompson, Z. Fisk, M. Hundley, and A. Lacerda, Journal of Magnetism and Magnetic Materials 108, 217 (1992), ISSN 0304-8853, URL http://www.sciencedirect.com/science/article/pii/030488539291418S.
- Pietrus et al. (2008) T. Pietrus, H. v. Löhneysen, and P. Schlottmann, Phys. Rev. B 77, 115134 (2008), URL https://link.aps.org/doi/10.1103/PhysRevB.77.115134.
- Rajan (1983) V. T. Rajan, Phys. Rev. Lett. 51, 308 (1983), URL https://link.aps.org/doi/10.1103/PhysRevLett.51.308.
- Severing et al. (1994) A. Severing, T. Perring, J. Thompson, P. Canfield, and Z. Fisk, Physica B: Condensed Matter 199–200, 480 (1994), ISSN 0921-4526, URL http://www.sciencedirect.com/science/article/pii/0921452694918767.
- Kwei et al. (1992) G. H. Kwei, J. M. Lawrence, P. C. Canfield, W. P. Beyermann, J. D. Thompson, Z. Fisk, A. C. Lawson, and J. A. Goldstone, Phys. Rev. B 46, 8067 (1992), URL https://link.aps.org/doi/10.1103/PhysRevB.46.8067.
- Varma (1976) C. M. Varma, Rev. Mod. Phys. 48, 219 (1976), URL https://link.aps.org/doi/10.1103/RevModPhys.48.219.
- Idl et al. (2002) E. Idl, S. Berger, R. Pelzer, L. Naber, A. Galatanu, H. Sassik, and E. Bauer, High Pressure Research 22, 205 (2002), URL http://www.tandfonline.com/doi/abs/10.1080/08957950211339.
- Dzero et al. (2010) M. Dzero, K. Sun, V. Galitski, and P. Coleman, Phys. Rev. Lett. 104, 106408 (2010), URL https://link.aps.org/doi/10.1103/PhysRevLett.104.106408.
- Di Sante et al. (2017) D. Di Sante, A. Hausoel, P. Barone, J. M. Tomczak, G. Sangiovanni, and R. Thomale, Phys. Rev. B 96, 121106 (2017), URL https://link.aps.org/doi/10.1103/PhysRevB.96.121106.
- Lai et al. (2018) H.-H. Lai, S. E. Grefe, S. Paschen, and Q. Si, Proceedings of the National Academy of Sciences 115, 93 (2018), URL http://www.pnas.org/content/115/1/93.abstract.
- Kübler et al. (2013) J. Kübler, B. Yan, and C. Felser, EPL (Europhysics Letters) 104, 30001 (2013), URL http://stacks.iop.org/0295-5075/104/i=3/a=30001.
- Martins et al. (2017) C. Martins, M. Aichhorn, and S. Biermann, Journal of Physics: Condensed Matter 29, 263001 (2017), URL http://stacks.iop.org/0953-8984/29/i=26/a=263001.
- Jones et al. (1999) C. D. W. Jones, K. A. Regan, and F. J. DiSalvo, Phys. Rev. B 60, 5282 (1999), URL https://link.aps.org/doi/10.1103/PhysRevB.60.5282.
- Jones et al. (1998) C. D. W. Jones, K. A. Regan, and F. J. DiSalvo, Phys. Rev. B 58, 16057 (1998), URL http://link.aps.org/doi/10.1103/PhysRevB.58.16057.
- Sakai et al. (2007a) A. Sakai, F. Ishii, Y. Onose, Y. Tomioka, S. Yotsuhashi, H. Adachi, N. Nagaosa, and Y. Tokura, J. Phys. Soc. Jpn. 76, 093601 (2007a), URL http://jpsj.ipap.jp/link?JPSJ/76/093601/.
- Sakai et al. (2007) A. Sakai, S. Yotsuhashi, H. Adachi, F. Ishii, Y. Onose, Y. Tomioka, N. Nagaosa, and Y. Tokura, proceedings of the 26th International Conference on Thermoelectrics, 256 (2007), URL https://doi.org/10.1109/ICT.2007.4569473.
- Gu et al. (2011) T. Gu, X. Wu, S. Qin, and L. Dubrovinsky, Physics of the Earth and Planetary Interiors 184, 154 (2011), ISSN 0031-9201, URL http://www.sciencedirect.com/science/article/pii/S0031920110002372.
- Okabe (1996) T. Okabe, Journal of the Physical Society of Japan 65, 1056 (1996), URL https://doi.org/10.1143/JPSJ.65.1056.
- Bünemann et al. (1998) J. Bünemann, W. Weber, and F. Gebhard, Phys. Rev. B 57, 6896 (1998), URL https://link.aps.org/doi/10.1103/PhysRevB.57.6896.
- Vollhardt et al. (1999) D. Vollhardt, N. Blümer, K. Held, M. Kollar, J. Schlipf, M. Ulmke, and J. Wahle, Metallic ferromagnetism: Progress in our understanding of an old strong-coupling problem (Springer Berlin Heidelberg, Berlin, Heidelberg, 1999), pp. 383–396, ISBN 978-3-540-44558-6, URL https://doi.org/10.1007/BFb0107631.
- Sakai et al. (2007b) S. Sakai, R. Arita, and H. Aoki, Phys. Rev. Lett. 99, 216402 (2007b), URL https://link.aps.org/doi/10.1103/PhysRevLett.99.216402.
- Tsujii et al. (2008b) N. Tsujii, H. Yamaoka, M. Matsunami, R. Eguchi, Y. Ishida, Y. Senba, H. Ohashi, S. Shin, T. Furubayashi, H. Abe, et al., Journal of the Physical Society of Japan 77, 024705 (2008b), URL http://jpsj.ipap.jp/link?JPSJ/77/024705/.
- Mani (2004) A. Mani, Solid State Communications 132, 551 (2004), ISSN 0038-1098, URL http://www.sciencedirect.com/science/article/pii/S0038109804007653.
- Zaliznyak et al. (2011) I. A. Zaliznyak, A. T. Savici, V. O. Garlea, R. Hu, and C. Petrovic, Phys. Rev. B 83, 184414 (2011), URL http://link.aps.org/doi/10.1103/PhysRevB.83.184414.
- Varma (1994) C. M. Varma, Phys. Rev. B 50, 9952 (1994).
- Misawa and Tate (1996) S. Misawa and A. Tate, Journal of Magnetism and Magnetic Materials 157-158, 617 (1996), ISSN 0304-8853, european Magnetic Materials and Applications Conference, URL http://www.sciencedirect.com/science/article/pii/0304885395011447.
- Takahashi and Moriya (1979) Y. Takahashi and T. Moriya, J. Phys. Soc. Jpn. 46, 1451 (1979), URL http://jpsj.ipap.jp/link?JPSJ/46/1451/.
- Evangelou and Edwards (1983) S. N. Evangelou and D. M. Edwards, Journal of Physics C: Solid State Physics 16, 2121 (1983), URL http://stacks.iop.org/0022-3719/16/i=11/a=015.
- Mattheiss and Hamann (1993) L. F. Mattheiss and D. R. Hamann, Phys. Rev. B 47, 13114 (1993).
- Kokalj (1999) A. Kokalj, Journal of Molecular Graphics and Modelling 17, 176 (1999), ISSN 1093-3263, URL http://www.sciencedirect.com/science/article/pii/S1093326399000285.
- Tomczak et al. (2013b) J. M. Tomczak, K. Haule, and G. Kotliar, in New Materials for Thermoelectric Applications: Theory and Experiment, edited by V. Zlatić and A. Hewson (Springer Netherlands, 2013b), NATO Science for Peace and Security Series B: Physics and Biophysics, pp. 45–57, ISBN 978-94-007-4984-9, preprint arXiv:1210.3379, URL http://dx.doi.org/10.1007/978-94-007-4984-9_4.
- Mazurenko et al. (2010) V. V. Mazurenko, A. O. Shorikov, A. V. Lukoyanov, K. Kharlov, E. Gorelov, A. I. Lichtenstein, and V. I. Anisimov, Phys. Rev. B 81, 125131 (2010).
- Krajčí and Hafner (2007) M. Krajčí and J. Hafner, Phys. Rev. B 75, 024116 (2007), URL https://link.aps.org/doi/10.1103/PhysRevB.75.024116.
- Anisimov et al. (1991) V. I. Anisimov, J. Zaanen, and O. K. Andersen, Phys. Rev. B 44, 943 (1991).
- Hedin (1965) L. Hedin, Phys. Rev. 139, A796 (1965).
- Aryasetiawan and Gunnarsson (1998) F. Aryasetiawan and O. Gunnarsson, Rep. Prog. Phys. 61, 237 (1998), URL http://stacks.iop.org/0034-4885/61/237.
- Onida et al. (2002) G. Onida, L. Reining, and A. Rubio, Rev. Mod. Phys. 74, 601 (2002).
- Aryasetiawan et al. (2004) F. Aryasetiawan, M. Imada, A. Georges, G. Kotliar, S. Biermann, and A. I. Lichtenstein, Phys. Rev. B 70, 195104 (2004).
- Williams et al. (1966) H. J. Williams, J. H. Wernick, R. C. Sherwood, and G. K. Wertheim, Journal of Applied Physics 37, 1256 (1966), URL http://dx.doi.org/10.1063/1.1708422.
- Watanabe et al. (1963) H. Watanabe, H. Yamamoto, and K. ichi Ito, Journal of the Physical Society of Japan 18, 995 (1963), URL http://dx.doi.org/10.1143/JPSJ.18.995.
- Fu et al. (1994) C. Fu, M. P. C. M. Krijn, and S. Doniach, Phys. Rev. B 49, 2219 (1994).
- Jarlborg (1999) T. Jarlborg, Phys. Rev. B 59, 15002 (1999).
- Kuneš and Anisimov (2008) J. Kuneš and V. I. Anisimov, Phys. Rev. B 78, 033109 (2008).
- Tomczak et al. (2012a) J. M. Tomczak, K. Haule, and G. Kotliar, Proc. Natl. Acad. Sci. USA 109, 3243 (2012a), preprint arXiv:1109.6561, URL http://www.pnas.org/content/109/9/3243.abstract.
- Tran and Blaha (2009) F. Tran and P. Blaha, Phys. Rev. Lett. 102, 226401 (2009), URL http://link.aps.org/doi/10.1103/PhysRevLett.102.226401.
- Křápek et al. (2012) V. Křápek, P. Novák, J. Kuneš, D. Novoselov, D. M. Korotin, and V. I. Anisimov, Phys. Rev. B 86, 195104 (2012), URL https://link.aps.org/doi/10.1103/PhysRevB.86.195104.
- Anisimov et al. (1996) V. I. Anisimov, S. Y. Ezhov, I. S. Elfimov, I. V. Solovyev, and T. M. Rice, Phys. Rev. Lett. 76, 1735 (1996).
- Yamada et al. (2003) H. Yamada, K. Terao, H. Ohta, and E. Kulatov, Physica B: Condensed Matter 329, 1131 (2003), ISSN 0921-4526, proceedings of the 23rd International Conference on Low Temperature Physics, URL http://www.sciencedirect.com/science/article/pii/S0921452602024717.
- Neef et al. (2009) M. Neef, K. Doll, and G. Zwicknagl, Phys. Rev. B 80, 035122 (2009), URL https://link.aps.org/doi/10.1103/PhysRevB.80.035122.
- Pulikkotil et al. (2012) J. J. Pulikkotil, S. Auluck, P. K. Rout, and R. C. Budhani, Journal of Physics: Condensed Matter 24, 096003 (2012), URL http://stacks.iop.org/0953-8984/24/i=9/a=096003.
- Anisimov et al. (2002) V. I. Anisimov, R. Hlubina, M. A. Korotin, V. V. Mazurenko, T. M. Rice, A. O. Shorikov, and M. Sigrist, Phys. Rev. Lett. 89, 257203 (2002), URL https://link.aps.org/doi/10.1103/PhysRevLett.89.257203.
- Wäppling and Häggström (1968) R. Wäppling and L. Häggström, Physics Letters A 28, 173 (1968), ISSN 0375-9601, URL http://www.sciencedirect.com/science/article/pii/0375960168901837.
- Morozumi and Yamada (2007) H. Morozumi and H. Yamada, Journal of Magnetism and Magnetic Materials 310, 1048 (2007), ISSN 0304-8853, proceedings of the 17th International Conference on Magnetism, URL http://www.sciencedirect.com/science/article/pii/S0304885306014223.
- Punkkinen et al. (2006) M. P. J. Punkkinen, K. Kokko, M. Ropo, I. J. Väyrynen, L. Vitos, B. Johansson, and J. Kollar, Phys. Rev. B 73, 024426 (2006), URL https://link.aps.org/doi/10.1103/PhysRevB.73.024426.
- Klein et al. (2008) M. Klein, D. Zur, D. Menzel, J. Schoenes, K. Doll, J. Röder, and F. Reinert, Phys. Rev. Lett. 101, 046406 (2008).
- Tomczak et al. (2010a) J. M. Tomczak, K. Haule, T. Miyake, A. Georges, and G. Kotliar, Phys. Rev. B 82, 085104 (2010a), preprint arXiv:1006.0564.
- Zinoveva et al. (1974) G. P. Zinoveva, L. P. Andreeva, and P. V. Geld, physica status solidi (a) 23, 711 (1974), ISSN 1521-396X, URL http://dx.doi.org/10.1002/pssa.2210230244.
- Vočadlo et al. (2002) L. Vočadlo, K. S. Knight, G. D. Price, and I. G. Wood, Physics and Chemistry of Minerals 29, 132 (2002), ISSN 1432-2021, URL http://dx.doi.org/10.1007/s002690100202.
- Moroni et al. (1999) E. G. Moroni, W. Wolf, J. Hafner, and R. Podloucky, Phys. Rev. B 59, 12860 (1999), URL https://link.aps.org/doi/10.1103/PhysRevB.59.12860.
- Stern and Madsen (2016) R. Stern and G. K. H. Madsen, Phys. Rev. B 94, 144304 (2016), URL https://link.aps.org/doi/10.1103/PhysRevB.94.144304.
- Wood et al. (1995) I. G. Wood, T. D. Chaplin, W. I. F. David, S. Hull, G. D. Price, and J. N. Street, Journal of Physics: Condensed Matter 7, L475 (1995), URL http://stacks.iop.org/0953-8984/7/i=36/a=001.
- Wood et al. (1996) I. G. Wood, W. I. F. David, S. Hull, and G. D. Price, Journal of Applied Crystallography 29, 215 (1996), URL https://doi.org/10.1107/S0021889895015263.
- Guyot et al. (1997) F. Guyot, J. Zhang, I. Martinez, J. Matas, Y. Ricard, M. Javoy, E. A. J. Burke, C. Chopin, W. V. Maresch, L. Ungaretti, et al., P-v-t measurements of iron silicide (epsilon -fesi) implications for silicate-metal interactions in the early earth, GeoRef (1997), geoRef-ID: 1997-036942.
- Imai and Watanabe (2006) Y. Imai and A. Watanabe, Journal of Alloys and Compounds 417, 173 (2006), ISSN 0925-8388, URL http://www.sciencedirect.com/science/article/pii/S0925838805014830.
- Zhao et al. (2009) Y. N. Zhao, H. L. Han, Y. Yu, W. H. Xue, and T. Gao, EPL (Europhysics Letters) 85, 47005 (2009), URL http://stacks.iop.org/0295-5075/85/i=4/a=47005.
- Shaposhnikov et al. (2009) V. Shaposhnikov, D. Migas, V. Borisenko, and N. Dorozhkin, Semiconductors 43, 142 (2009), ISSN 1063-7826, URL http://dx.doi.org/10.1134/S1063782609020031.
- Becke (1993a) A. D. Becke, The Journal of Chemical Physics 98, 5648 (1993a), URL http://dx.doi.org/10.1063/1.464913.
- Faleev et al. (2004) S. V. Faleev, M. van Schilfgaarde, and T. Kotani, Phys. Rev. Lett. 93, 126406 (2004).
- Methfessel et al. (2000) M. Methfessel, M. van Schilfgaarde, and R. Casali, in Electronic Structure and Physical Properties of Solids: The Uses of the LMTO Method, Lecture Notes in Physics. H. Dreysse, ed. 535, 114 (2000).
- van Schilfgaarde et al. (2006) M. van Schilfgaarde, T. Kotani, and S. Faleev, Phys. Rev. Lett. 96, 226402 (2006), URL http://link.aps.org/abstract/PRL/v96/e226402.
- Holseth and Kjekshus (1969) H. Holseth and A. Kjekshus, Acta Chemica Scandinavica 23, 3043 (1969).
- Holseth and Kjekshus (1968) H. Holseth and A. Kjekshus, Acta Chemica Scandinavica 22, 3284 (1968).
- Hulliger (1963) F. Hulliger, Nature 198, 1081 (1963), URL http://dx.doi.org/10.1038/1981081b0.
- Kjekshus et al. (1977) A. Kjekshus, T. Rakke, and A. Andresen, Acta Chemica Scandinavica 31a, 253 (1977).
- Goodenough (1972) J. B. Goodenough, Journal of Solid State Chemistry 5, 144 (1972), ISSN 0022-4596, URL http://www.sciencedirect.com/science/article/B6WM2-4B6NPKF-S/2/9b30e5e2009172381250da812cec739d.
- Madsen et al. (2006) G. Madsen, A. Bentien, S. Johnsen, and B. B. Iversen, in 25th International Conference on Thermoelectrics, ICT ’06. (2006), pp. 579–581, URL http://ieeexplore.ieee.org/xpl/tocresult.jsp?isnumber=4084513.
- Lukoyanov et al. (2006) A. V. Lukoyanov, V. V. Mazurenko, V. I. Anisimov, M. Sigrist, and T. M. Rice, Eur. Phys. J. B 53, 205 (2006).
- Wu et al. (2009) X. Wu, G. Steinle-Neumann, S. Qin, M. Kanzaki, and L. Dubrovinsky, Journal of Physics: Condensed Matter 21, 185403 (6pp) (2009), URL http://stacks.iop.org/0953-8984/21/185403.
- Brahmia et al. (2013) M. Brahmia, B. Bennecer, and A. Hamidani, Materials Science and Engineering: B 178, 1249 (2013), ISSN 0921-5107, URL http://www.sciencedirect.com/science/article/pii/S0921510713002821.
- Becke (1993b) A. D. Becke, The Journal of Chemical Physics 98, 1372 (1993b), URL http://link.aip.org/link/?JCP/98/1372/1.
- Tomczak et al. (2012b) J. M. Tomczak, M. van Schilfgaarde, and G. Kotliar, Phys. Rev. Lett. 109, 237010 (2012b), preprint arXiv:1209.2213, URL http://link.aps.org/doi/10.1103/PhysRevLett.109.237010.
- Sentef et al. (2009) M. Sentef, J. Kuneš, P. Werner, and A. P. Kampf, Phys. Rev. B 80, 155116 (2009), URL http://link.aps.org/abstract/PRB/v80/e155116.
- Miyake and Aryasetiawan (2008) T. Miyake and F. Aryasetiawan, Phys. Rev. B 77, 085122 (2008), URL http://link.aps.org/abstract/PRB/v77/e085122.
- Shishkin et al. (2007) M. Shishkin, M. Marsman, and G. Kresse, Phys. Rev. Lett. 99, 246403 (2007), URL http://link.aps.org/doi/10.1103/PhysRevLett.99.246403.
- Georges et al. (1996) A. Georges, G. Kotliar, W. Krauth, and M. J. Rozenberg, Rev. Mod. Phys. 68, 13 (1996).
- Kotliar and Vollhardt (2004) G. Kotliar and D. Vollhardt, Physics Today 57, 53 (2004).
- Biermann et al. (2003) S. Biermann, F. Aryasetiawan, and A. Georges, Phys. Rev. Lett. 90, 086402 (2003).
- Biermann (2014) S. Biermann, Journal of Physics: Condensed Matter 26, 173202 (2014), URL http://stacks.iop.org/0953-8984/26/i=17/a=173202.
- Werner and Casula (2016) P. Werner and M. Casula, Journal of Physics: Condensed Matter 28, 383001 (2016), URL http://stacks.iop.org/0953-8984/28/i=38/a=383001.
- Tomczak et al. (2017) J. M. Tomczak, P. Liu, A. Toschi, G. Kresse, and K. Held, The European Physical Journal Special Topics 226, 2565 (2017), ISSN 1951-6401, URL http://dx.doi.org/10.1140/epjst/e2017-70053-1.
- Tomczak (2015) J. M. Tomczak, Journal of Physics: Conference Series 592, 012055 (2015), preprint arXiv:1411.5180, URL http://stacks.iop.org/1742-6596/592/i=1/a=012005.
- Choi et al. (2016) S. Choi, A. Kutepov, K. Haule, M. van Schilfgaarde, and G. Kotliar, Npj Quantum Materials 1, 16001 (2016), URL http://dx.doi.org/10.1038/npjquantmats.2016.1.
- Tomczak et al. (2009) J. M. Tomczak, T. Miyake, R. Sakuma, and F. Aryasetiawan, Phys. Rev. B 79, 235133 (pages 8) (2009), preprint arXiv:0906.4398, URL http://link.aps.org/abstract/PRB/v79/e235133.
- Tomczak et al. (2010b) J. M. Tomczak, T. Miyake, and F. Aryasetiawan, Phys. Rev. B 81, 115116 (2010b), preprint arXiv:1006.0565.
- Takegahara et al. (1993) K. Takegahara, H. Harima, Y. Kaneta, and A. Yanase, Journal of the Physical Society of Japan 62, 2103 (1993), URL http://dx.doi.org/10.1143/JPSJ.62.2103.
- Dwight (1977) A. E. Dwight, Acta Crystallographica Section B 33, 1579 (1977), URL https://doi.org/10.1107/S0567740877006530.
- Blaha et al. (2001) P. Blaha, K. Schwarz, G.-K.-H. Madsen, D. Kvasnicka, and J. Luitz, Vienna University of Technology, Austria (2001), iSBN 3-9501031-1-2.
- Kotliar et al. (2006) G. Kotliar, S. Y. Savrasov, K. Haule, V. S. Oudovenko, O. Parcollet, and C. A. Marianetti, Rev. Mod. Phys. 78, 865 (2006).
- Aryasetiawan et al. (2009) F. Aryasetiawan, J. M. Tomczak, T. Miyake, and R. Sakuma, Phys. Rev. Lett. 102, 176402 (2009), preprint arXiv:0806.3373.
- Miyake et al. (2009) T. Miyake, F. Aryasetiawan, and M. Imada, Phys. Rev. B 80, 155134 (2009), URL http://link.aps.org/abstract/PRB/v80/e155134.
- Riseborough (1992) P. S. Riseborough, Phys. Rev. B 45, 13984 (1992), URL https://link.aps.org/doi/10.1103/PhysRevB.45.13984.
- Sun and Steglich (2013) P. Sun and F. Steglich, Phys. Rev. Lett. 110, 216408 (2013), URL https://link.aps.org/doi/10.1103/PhysRevLett.110.216408.
- Jarrell et al. (1993) M. Jarrell, H. Akhlaghpour, and T. Pruschke, Phys. Rev. Lett. 70, 1670 (1993), URL https://link.aps.org/doi/10.1103/PhysRevLett.70.1670.
- Jarrell (1995) M. Jarrell, Phys. Rev. B 51, 7429 (1995), URL https://link.aps.org/doi/10.1103/PhysRevB.51.7429.
- Sun et al. (1993) S.-J. Sun, M.-F. Yang, and T.-M. Hong, Phys. Rev. B 48, 16127 (1993), URL https://link.aps.org/doi/10.1103/PhysRevB.48.16127.
- Rozenberg (1995) M. J. Rozenberg, Phys. Rev. B 52, 7369 (1995), URL https://link.aps.org/doi/10.1103/PhysRevB.52.7369.
- Franco et al. (2009) R. Franco, J. Silva-Valencia, and M. S. Figueira, The European Physical Journal B 67, 159 (2009), ISSN 1434-6036, URL http://dx.doi.org/10.1140/epjb/e2009-00030-x.
- Foglio and Figueira (1999) M. E. Foglio and M. S. Figueira, Phys. Rev. B 60, 11361 (1999), URL https://link.aps.org/doi/10.1103/PhysRevB.60.11361.
- Mutou and Hirashima (1995) T. Mutou and D. S. Hirashima, Journal of the Physical Society of Japan 64, 4799 (1995), URL http://dx.doi.org/10.1143/JPSJ.64.4799.
- Figueira et al. (2012) M. S. Figueira, J. Silva-Valencia, and R. Franco, The European Physical Journal B 85, 203 (2012), ISSN 1434-6036, URL http://dx.doi.org/10.1140/epjb/e2012-30060-0.
- Tanasković et al. (2011) D. Tanasković, K. Haule, G. Kotliar, and V. Dobrosavljević, Phys. Rev. B 84, 115105 (2011), URL http://link.aps.org/doi/10.1103/PhysRevB.84.115105.
- Yamada and Ōno (2012) T. Yamada and Y. Ōno, Phys. Rev. B 85, 165114 (2012), URL https://link.aps.org/doi/10.1103/PhysRevB.85.165114.
- Continentino et al. (1994) M. A. Continentino, G. M. Japiassu, and A. Troper, Phys. Rev. B 49, 4432 (1994), URL https://link.aps.org/doi/10.1103/PhysRevB.49.4432.
- Held et al. (2000) K. Held, C. Huscroft, R. T. Scalettar, and A. K. McMahan, Phys. Rev. Lett. 85, 373 (2000), URL https://link.aps.org/doi/10.1103/PhysRevLett.85.373.
- Held and Bulla (2000) K. Held and R. Bulla, The European Physical Journal B - Condensed Matter and Complex Systems 17, 7 (2000), ISSN 1434-6036, URL https://doi.org/10.1007/s100510070154.
- Fu and Doniach (1995) C. Fu and S. Doniach, Phys. Rev. B 51, 17439 (1995).
- Urasaki and Saso (1999) K. Urasaki and T. Saso, J. Phys. Soc. Jpn. 68, 3477 (1999), URL http://jpsj.ipap.jp/link?JPSJ/68/3477/.
- Saso and Urasaki (2002) T. Saso and K. Urasaki, Journal of Physics and Chemistry of Solids 63, 1475 (2002), ISSN 0022-3697, proceedings of the 8th ISSP International Symposium, URL http://www.sciencedirect.com/science/article/pii/S0022369702000768.
- Yang et al. (2011) K.-Y. Yang, Y. Yamashita, A. M. Läuchli, M. Sigrist, and T. M. Rice, EPL (Europhysics Letters) 95, 47007 (2011), URL http://stacks.iop.org/0295-5075/95/i=4/a=47007.
- Doniach et al. (1994) S. Doniach, C. Fu, and S. Trugman, Physica B: Condensed Matter 199–200, 450 (1994), ISSN 0921-4526, URL http://www.sciencedirect.com/science/article/pii/092145269491866X.
- Haule et al. (2010) K. Haule, C.-H. Yee, and K. Kim, Phys. Rev. B 81, 195107 (2010).
- Yanagi and Ueda (2016) Y. Yanagi and K. Ueda, Phys. Rev. B 93, 045125 (2016), URL https://link.aps.org/doi/10.1103/PhysRevB.93.045125.
- Greger et al. (2013) M. Greger, M. Kollar, and D. Vollhardt, Phys. Rev. B 87, 195140 (2013), URL https://link.aps.org/doi/10.1103/PhysRevB.87.195140.
- Kohgi et al. (1986) M. Kohgi, Y. Endoh, Y. Ishikawa, H. Yoshizawa, and G. Shirane, Phys. Rev. B 34, 1762 (1986), URL https://link.aps.org/doi/10.1103/PhysRevB.34.1762.
- Park et al. (2011) H. Park, K. Haule, and G. Kotliar, Phys. Rev. Lett. 107, 137007 (2011), URL http://link.aps.org/doi/10.1103/PhysRevLett.107.137007.
- Goremychkin et al. (2018) E. A. Goremychkin, H. Park, R. Osborn, S. Rosenkranz, J.-P. Castellan, V. R. Fanelli, A. D. Christianson, M. B. Stone, E. D. Bauer, K. J. McClellan, et al., Science 359, 186 (2018), ISSN 0036-8075, URL http://science.sciencemag.org/content/359/6372/186.
- Krannich et al. (2015) S. Krannich, Y. Sidis, D. Lamago, R. Heid, J.-M. Mignot, H. v. Löhneysen, A. Ivanov, P. Steffens, T. Keller, L. Wang, et al., 6, 8961 EP (2015), article, URL http://dx.doi.org/10.1038/ncomms9961.
- Poteryaev et al. (2007) A. I. Poteryaev, J. M. Tomczak, S. Biermann, A. Georges, A. I. Lichtenstein, A. N. Rubtsov, T. Saha-Dasgupta, and O. K. Andersen, Phys. Rev. B 76, 085127 (pages 17) (2007), preprint arXiv:cond-mat/0701263, URL http://link.aps.org/abstract/PRB/v76/e085127.
- Byczuk et al. (2007) K. Byczuk, M. Kollar, K. Held, Y. F. Yang, I. A. Nekrasov, T. Pruschke, and D. Vollhardt, Nat Phys 3, 168 (2007), URL doi:10.1038/nphys538.
- Dutta and Pandey (2018) P. Dutta and S. K. Pandey, ArXiv e-prints (2018), eprint 1801.03496.
- Kutepov et al. (2010) A. Kutepov, K. Haule, S. Y. Savrasov, and G. Kotliar, Phys. Rev. B 82, 045105 (2010), URL http://link.aps.org/doi/10.1103/PhysRevB.82.045105.
- Miiller et al. (2015) W. Miiller, J. M. Tomczak, J. W. Simonson, G. Smith, G. Kotliar, and M. C. Aronson, Journal of Physics: Condensed Matter 27, 175601 (2015), preprint arXiv:1408.3606, URL http://stacks.iop.org/0953-8984/27/i=17/a=175601.
- Haule and Kotliar (2009a) K. Haule and G. Kotliar, New Journal of Physics 11, 025021 (2009a), URL http://stacks.iop.org/1367-2630/11/i=2/a=025021.
- Yin et al. (2011) Z. P. Yin, K. Haule, and G. Kotliar, Nat. Mat 10, 932 (2011), preprint : arXiv1104.3454.
- Hansmann et al. (2010) P. Hansmann, R. Arita, A. Toschi, S. Sakai, G. Sangiovanni, and K. Held, Phys. Rev. Lett. 104, 197002 (2010), URL http://link.aps.org/doi/10.1103/PhysRevLett.104.197002.
- Khajetoorians et al. (2015) A. Khajetoorians, M. Valentyuk, M. Steinbrecher, T. Schlenk, A. Shick, J. Kolorenc, I. Lichtenstein, T. Wehling, R. Wiesendanger, and J. Wiebe, Nat Nano 10, 958 (2015), ISSN 1748-3387, article, URL http://dx.doi.org/10.1038/nnano.2015.193.
- Mravlje et al. (2011) J. Mravlje, M. Aichhorn, T. Miyake, K. Haule, G. Kotliar, and A. Georges, Phys. Rev. Lett. 106, 096401 (2011), URL http://link.aps.org/doi/10.1103/PhysRevLett.106.096401.
- Hausoel et al. (2017) A. Hausoel, M. Karolak, E. Sasioglu, A. Lichtenstein, K. Held, A. Katanin, A. Toschi, and G. Sangiovanni, Nature Communications 8, 16062 EP (2017), article, URL http://dx.doi.org/10.1038/ncomms16062.
- Hariki et al. (2017) A. Hariki, A. Hausoel, G. Sangiovanni, and J. Kuneš, Phys. Rev. B 96, 155135 (2017), URL https://link.aps.org/doi/10.1103/PhysRevB.96.155135.
- Okada and Yosida (1973) I. Okada and K. Yosida, Progress of Theoretical Physics 49, 1483 (1973), URL http://ptp.ipap.jp/link?PTP/49/1483/.
- Nevidomskyy and Coleman (2009) A. H. Nevidomskyy and P. Coleman, Phys. Rev. Lett. 103, 147205 (2009), URL https://link.aps.org/doi/10.1103/PhysRevLett.103.147205.
- de’ Medici (2011) L. de’ Medici, Phys. Rev. B 83, 205112 (2011), URL http://link.aps.org/doi/10.1103/PhysRevB.83.205112.
- de’ Medici et al. (2011) L. de’ Medici, J. Mravlje, and A. Georges, Phys. Rev. Lett. 107, 256401 (2011), URL http://link.aps.org/doi/10.1103/PhysRevLett.107.256401.
- Georges et al. (2013) A. Georges, L. d. Medici, and J. Mravlje, Annual Review of Condensed Matter Physics 4, 137 (2013), URL http://dx.doi.org/10.1146/annurev-conmatphys-020911-125045.
- Haule (2007) K. Haule, Phys. Rev. B 75, 155113 (2007).
- Werner and Millis (2007) P. Werner and A. J. Millis, Phys. Rev. Lett. 99, 126405 (2007), URL https://link.aps.org/doi/10.1103/PhysRevLett.99.126405.
- Kunes et al. (2008) J. Kunes, A. V. Lukoyanov, V. I. Anisimov, R. T. Scalettar, and W. E. Pickett, Nat Mater 7, 198 (2008).
- Knížek et al. (2009) K. Knížek, Z. c. v. Jirák, J. c. v. Hejtmánek, P. Novák, and W. Ku, Phys. Rev. B 79, 014430 (2009), URL https://link.aps.org/doi/10.1103/PhysRevB.79.014430.
- Eder (2010) R. Eder, Phys. Rev. B 81, 035101 (2010), URL https://link.aps.org/doi/10.1103/PhysRevB.81.035101.
- Kuneš and Křápek (2011) J. Kuneš and V. Křápek, Phys. Rev. Lett. 106, 256401 (2011).
- Augustinský et al. (2013) P. Augustinský, V. Křápek, and J. Kuneš, Phys. Rev. Lett. 110, 267204 (2013), URL https://link.aps.org/doi/10.1103/PhysRevLett.110.267204.
- Georges (2011) A. Georges, Annalen der Physik 523, 672 (2011), ISSN 1521-3889, URL http://dx.doi.org/10.1002/andp.201100042.
- Zölfl et al. (2001) M. B. Zölfl, I. A. Nekrasov, T. Pruschke, V. I. Anisimov, and J. Keller, Phys. Rev. Lett. 87, 276403 (2001).
- Chakrabarti et al. (2014) B. Chakrabarti, M. E. Pezzoli, G. Sordi, K. Haule, and G. Kotliar, Phys. Rev. B 89, 125113 (2014), URL https://link.aps.org/doi/10.1103/PhysRevB.89.125113.
- Bieder and Amadon (2014) J. Bieder and B. Amadon, Phys. Rev. B 89, 195132 (2014), URL https://link.aps.org/doi/10.1103/PhysRevB.89.195132.
- Brinkman and Rice (1970) W. F. Brinkman and T. M. Rice, Phys. Rev. B 2, 4302 (1970).
- Pavarini et al. (2004) E. Pavarini, S. Biermann, A. Poteryaev, A. I. Lichtenstein, A. Georges, and O. K. Andersen, Phys. Rev. Lett. 92, 176403 (2004), URL http://link.aps.org/abstract/PRL/v92/e176403.
- Held et al. (2001) K. Held, G. Keller, V. Eyert, D. Vollhardt, and V. I. Anisimov, Phys. Rev. Lett. 86, 5345 (2001).
- Tomczak et al. (2008) J. M. Tomczak, F. Aryasetiawan, and S. Biermann, Phys. Rev. B 78, 115103 (pages 6) (2008), preprint arXiv:0704.0902, URL http://link.aps.org/abstract/PRB/v78/e115103.
- Herper et al. (2017) H. C. Herper, T. Ahmed, J. M. Wills, I. Di Marco, T. Björkman, D. Iuşan, A. V. Balatsky, and O. Eriksson, Phys. Rev. Materials 1, 033802 (2017), URL https://link.aps.org/doi/10.1103/PhysRevMaterials.1.033802.
- Budich et al. (2013) J. C. Budich, B. Trauzettel, and G. Sangiovanni, Phys. Rev. B 87, 235104 (2013), URL https://link.aps.org/doi/10.1103/PhysRevB.87.235104.
- Amaricci et al. (2015) A. Amaricci, J. C. Budich, M. Capone, B. Trauzettel, and G. Sangiovanni, Phys. Rev. Lett. 114, 185701 (2015), URL https://link.aps.org/doi/10.1103/PhysRevLett.114.185701.
- Amaricci et al. (2012) A. Amaricci, L. de’ Medici, G. Sordi, M. J. Rozenberg, and M. Capone, Phys. Rev. B 85, 235110 (2012), URL https://link.aps.org/doi/10.1103/PhysRevB.85.235110.
- Wallerberger et al. (2018) M. Wallerberger, A. Hausoel, P. Gunacker, A. Kowalski, N. Parragh, F. Goth, K. Held, and G. Sangiovanni, ArXiv e-prints (2018), eprint 1801.10209.
- Racu et al. (2008) A.-M. Racu, D. Menzel, J. Schoenes, M. Marutzky, S. Johnsen, and B. B. Iversen, Proceedings of the 52nd Annual Conference on Magnetism and Magnetic Materials 103, 07C912 (2008), URL http://link.aip.org/link/?JAP/103/07C912/1.
- Zhang et al. (2018) T. Zhang, Z. Song, A. Alexandradinata, H. Weng, C. Fang, L. Lu, and Z. Fang, Phys. Rev. Lett. 120, 016401 (2018), URL https://link.aps.org/doi/10.1103/PhysRevLett.120.016401.
- Buschinger et al. (1997c) B. Buschinger, C. Geibel, F. Steglich, D. Mandrus, D. Young, J. L. Sarrao, and Z. Fisk, Physica B 230-232, 784 (1997c), proceedings of SCES, URL http://www.sciencedirect.com/science/article/pii/S0921452696008393.
- Ou-Yang et al. (2017) T. Ou-Yang, Y. Zhuang, B. Ramachandran, W. Chen, G. Shu, C. Hu, F. Chou, and Y. Kuo, Journal of Alloys and Compounds 702, 92 (2017), ISSN 0925-8388, URL http://www.sciencedirect.com/science/article/pii/S0925838817302517.
- Sun et al. (2010a) P. Sun, N. Oeschler, S. Johnsen, B. B. Iversen, and F. Steglich, Dalton Transactions 39, 1012 (2010a), URL http://dx.doi.org/10.1039/b918909b.
- Wang et al. (2012) K. Wang, R. Hu, J. Warren, and C. Petrovic, Journal of Applied Physics 112, 013703 (2012), URL http://dx.doi.org/10.1063/1.4731251.
- Liao et al. (2014) B. Liao, S. Lee, K. Esfarjani, and G. Chen, Phys. Rev. B 89, 035108 (2014), URL http://link.aps.org/doi/10.1103/PhysRevB.89.035108.
- Pshenay-Severin et al. (2017) D. A. Pshenay-Severin, Y. V. Ivanov, A. T. Burkov, S. V. Novikov, V. K. Zaitsev, and H. Reith, Journal of Electronic Materials (2017).
- Lue et al. (2004) C. S. Lue, Y.-K. Kuo, C. L. Huang, and W. J. Lai, Phys. Rev. B 69, 125111 (2004), URL https://link.aps.org/doi/10.1103/PhysRevB.69.125111.
- Zhao et al. (2011) H. Zhao, M. Pokharel, G. Zhu, S. Chen, K. Lukas, Q. Jie, C. Opeil, G. Chen, and Z. Ren, Applied Physics Letters 99, 163101 (2011), URL http://scitation.aip.org/content/aip/journal/apl/99/16/10.1063/1.3651757.
- Pokharel et al. (2013) M. Pokharel, H. Zhao, K. Lukas, Z. Ren, C. Opeil, and B. Mihaila, MRS Communications 3, 31 (2013), ISSN 2159-6867, URL http://journals.cambridge.org/article_S2159685913000074.
- Delaire et al. (2011a) O. Delaire, K. Marty, M. B. Stone, P. R. C. Kent, M. S. Lucas, D. L. Abernathy, D. Mandrus, and B. C. Sales, Proc. Natl. Acad. Sci. USA 108, 4725 (2011a), URL http://www.pnas.org/content/108/12/4725.abstract.
- Petrova et al. (2010) A. E. Petrova, V. N. Krasnorussky, A. A. Shikov, W. M. Yuhasz, T. A. Lograsso, J. C. Lashley, and S. M. Stishov, Phys. Rev. B 82, 155124 (2010), URL https://link.aps.org/doi/10.1103/PhysRevB.82.155124.
- Menzel et al. (2006) D. Menzel, M. Finke, T. Donig, A.-M. Racu, and J. Schoenes, Physica B: Condensed Matter 378-380, 718 (2006), ISSN 0921-4526, proceedings of the International Conference on Strongly Correlated Electron Systems SCES 2005, URL http://www.sciencedirect.com/science/article/pii/S092145260600336X.
- Racu et al. (2007) A.-M. Racu, D. Menzel, J. Schoenes, and K. Doll, Phys. Rev. B 76, 115103 (2007), URL https://link.aps.org/doi/10.1103/PhysRevB.76.115103.
- Ponosov et al. (2016) Y. S. Ponosov, A. O. Shorikov, S. V. Streltsov, A. V. Lukoyanov, N. I. Shchegolikhina, A. F. Prekul, and V. I. Anisimov, JETP Letters 103, 316 (2016), ISSN 1090-6487, URL http://dx.doi.org/10.1134/S002136401605012X.
- Parshin et al. (2014) P. P. Parshin, P. A. Alekseev, K. S. Nemkovskii, J. Perßon, A. I. Chumakov, and R. Rüffer, Journal of Experimental and Theoretical Physics 118, 242 (2014), ISSN 1090-6509, URL https://doi.org/10.1134/S1063776114020034.
- Zaliznyak et al. (2014) I. Zaliznyak, C. Petrovic, R. Hu, A. Savici, O. Garlea, and B. Winn, Bulletin of the American Physical Society 59 (2014).
- Axe and Shirane (1973) J. D. Axe and G. Shirane, Phys. Rev. Lett. 30, 214 (1973), URL https://link.aps.org/doi/10.1103/PhysRevLett.30.214.
- Delaire et al. (2015) O. Delaire, I. I. Al-Qasir, A. F. May, C. W. Li, B. C. Sales, J. L. Niedziela, J. Ma, M. Matsuda, D. L. Abernathy, and T. Berlijn, Phys. Rev. B 91, 094307 (2015), URL https://link.aps.org/doi/10.1103/PhysRevB.91.094307.
- Delaire et al. (2008a) O. Delaire, M. S. Lucas, J. A. Muñoz, M. Kresch, and B. Fultz, Phys. Rev. Lett. 101, 105504 (2008a), URL https://link.aps.org/doi/10.1103/PhysRevLett.101.105504.
- Delaire et al. (2008b) O. Delaire, M. Kresch, J. A. Muñoz, M. S. Lucas, J. Y. Y. Lin, and B. Fultz, Phys. Rev. B 77, 214112 (2008b), URL https://link.aps.org/doi/10.1103/PhysRevB.77.214112.
- Jarlborg (1997a) T. Jarlborg, Physics Letters A 236, 143 (1997a), ISSN 0375-9601, URL http://www.sciencedirect.com/science/article/pii/S0375960197007263.
- Jarlborg (2007) T. Jarlborg, Phys. Rev. B 76, 205105 (2007), URL https://link.aps.org/doi/10.1103/PhysRevB.76.205105.
- Jarlborg (1997b) T. Jarlborg, Reports on Progress in Physics 60, 1305 (1997b), URL http://stacks.iop.org/0034-4885/60/i=11/a=003.
- Nourafkan and Nafari (2009) R. Nourafkan and N. Nafari, Phys. Rev. B 79, 075122 (2009), URL https://link.aps.org/doi/10.1103/PhysRevB.79.075122.
- Rybina et al. (2007) A. V. Rybina, P. A. Alekseev, K. S. Nemkovski, E. V. Nefeodova, J. M. Mignot, Y. B. Paderno, N. Y. Shitsevalova, and R. I. Bewley, Crystallography Reports 52, 770 (2007), ISSN 1562-689X, URL https://doi.org/10.1134/S1063774507050033.
- Alekseev et al. (2012) P. A. Alekseev, J.-M. Mignot, K. S. Nemkovski, A. V. Rybina, V. N. Lazukov, A. S. Ivanov, F. Iga, and T. Takabatake, Journal of Physics: Condensed Matter 24, 205601 (2012), URL http://stacks.iop.org/0953-8984/24/i=20/a=205601.
- Parshin et al. (2016a) P. P. Parshin, A. I. Chumakov, P. A. Alekseev, K. S. Nemkovski, J. Perßon, L. Dubrovinsky, A. Kantor, and R. Rüffer, Phys. Rev. B 93, 081102 (2016a), URL https://link.aps.org/doi/10.1103/PhysRevB.93.081102.
- Parshin et al. (2016b) P. P. Parshin, A. I. Chumakov, P. A. Alekseev, K. S. Nemkovski, L. Dubrovinskii, A. Kantor, J. Perßon, and R. Rüffer, Journal of Experimental and Theoretical Physics 123, 1073 (2016b), URL https://doi.org/10.1134/S1063776116110170.
- Zlatic and Monnier (2014) V. Zlatic and R. Monnier, Modern Theory of Thermoelectricity (Oxford University Press, 2014).
- Behnia (2015) K. Behnia, Fundamentals of Thermoelectricity (Oxford University Press, 2015).
- Pichanusakorn and Bandaru (2010) P. Pichanusakorn and P. Bandaru, Materials Science and Engineering: R: Reports 67, 19 (2010), ISSN 0927-796X, URL http://www.sciencedirect.com/science/article/pii/S0927796X09000904.
- Shakouri (2011) A. Shakouri, Annual Review of Materials Research 41, 399 (2011), URL http://dx.doi.org/10.1146/annurev-matsci-062910-100445.
- Behnia and Aubin (2016) K. Behnia and H. Aubin, Reports on Progress in Physics 79, 046502 (2016), URL http://stacks.iop.org/0034-4885/79/i=4/a=046502.
- Shi et al. (2016) X. Shi, L. Chen, and C. Uher, International Materials Reviews 61, 379 (2016), URL http://dx.doi.org/10.1080/09506608.2016.1183075.
- Tan et al. (2016) G. Tan, L.-D. Zhao, and M. G. Kanatzidis, Chemical Reviews 116, 12123 (2016), pMID: 27580481, URL http://dx.doi.org/10.1021/acs.chemrev.6b00255.
- Zhu et al. (2017) T. Zhu, Y. Liu, C. Fu, J. P. Heremans, J. G. Snyder, and X. Zhao, Advanced Materials 29, 1605884 (2017), ISSN 1521-4095, 1605884, URL http://dx.doi.org/10.1002/adma.201605884.
- He and Tritt (2017) J. He and T. M. Tritt, Science 357 (2017), ISSN 0036-8075, URL http://science.sciencemag.org/content/357/6358/eaak9997.
- Bos and Downie (2014) J.-W. G. Bos and R. A. Downie, Journal of Physics: Condensed Matter 26, 433201 (2014), URL http://stacks.iop.org/0953-8984/26/i=43/a=433201.
- Gonçalves, Antonio P. and Godart, Claude (2014) Gonçalves, Antonio P. and Godart, Claude, Eur. Phys. J. B 87, 42 (2014), URL http://dx.doi.org/10.1140/epjb/e2014-40989-3.
- Hébert et al. (2016) S. Hébert, D. Berthebaud, R. Daou, Y. Bréard, D. Pelloquin, E. Guilmeau, F. Gascoin, O. Lebedev, and A. Maignan, Journal of Physics: Condensed Matter 28, 013001 (2016), URL http://stacks.iop.org/0953-8984/28/i=1/a=013001.
- Ioffe (1960) A. Ioffe, Physics of semiconductors (Academic Press Inc., New York, 1960).
- Pálsson and Kotliar (1998) G. Pálsson and G. Kotliar, Phys. Rev. Lett. 80, 4775 (1998).
- Pruschke et al. (1995) T. Pruschke, M. Jarrell, and J. K. Freericks, Advances in Physics 44, 187 (1995), URL http://www.informaworld.com/10.1080/00018739500101526.
- Oudovenko and Kotliar (2002) V. S. Oudovenko and G. Kotliar, Phys. Rev. B 65, 075102 (2002).
- Dresselhaus et al. (2007) M. Dresselhaus, G. Chen, M. Tang, R. Yang, H. Lee, D. Wang, Z. Ren, J.-P. Fleurial, and P. Gogna, Advanced Materials 19, 1043 (2007), ISSN 1521-4095, URL http://dx.doi.org/10.1002/adma.200600527.
- Snyder and Toberer (2008) G. J. Snyder and E. S. Toberer, Nat Mater 7, 105 (2008), ISSN 1476-1122, URL http://dx.doi.org/10.1038/nmat2090.
- Yang et al. (2016) J. Yang, L. Xi, W. Qiu, L. Wu, X. Shi, L. Chen, J. Yang, W. Zhang, C. Uher, and D. J. Singh, Npj Computational Materials 2, 15015 EP (2016), review Article, URL http://dx.doi.org/10.1038/npjcompumats.2015.15.
- Gayner and Kar (2016) C. Gayner and K. K. Kar, Progress in Materials Science 83, 330 (2016), ISSN 0079-6425, URL http://www.sciencedirect.com/science/article/pii/S0079642516300317.
- Sun et al. (2015) P. Sun, B. Wei, J. Zhang, J. M. Tomczak, A. M. Strydom, M. Søndergaard, B. B. Iversen, and F. Steglich, Nat Commun 6, 7475 (2015), preprint arXiv:1503.09015.
- Zhao et al. (2017) W. Zhao, Z. Liu, Z. Sun, Q. Zhang, P. Wei, X. Mu, H. Zhou, C. Li, S. Ma, D. He, et al., Nature 549, 247 EP (2017), URL http://dx.doi.org/10.1038/nature23667.
- Slack (1995) G. A. Slack, in CRC Handbook of Thermoelectronics, edited by D. M. Rowe (CRC Press, Boca Raton, 1995), p. 407.
- Biswas et al. (2012) K. Biswas, J. He, I. D. Blum, C.-I. Wu, T. P. Hogan, D. N. Seidman, V. P. Dravid, and M. G. Kanatzidis, Nature 489, 414 (2012), ISSN 0028-0836, URL http://dx.doi.org/10.1038/nature11439.
- Hicks and Dresselhaus (1993a) L. D. Hicks and M. S. Dresselhaus, Phys. Rev. B 47, 12727 (1993a), URL https://link.aps.org/doi/10.1103/PhysRevB.47.12727.
- Touzelbaev et al. (2001) M. N. Touzelbaev, P. Zhou, R. Venkatasubramanian, and K. E. Goodson, Journal of Applied Physics 90, 763 (2001), URL http://dx.doi.org/10.1063/1.1374458.
- Beyer et al. (2002) H. Beyer, J. Nurnus, H. Böttner, A. Lambrecht, E. Wagner, and G. Bauer, Physica E: Low-dimensional Systems and Nanostructures 13, 965 (2002), ISSN 1386-9477, URL http://www.sciencedirect.com/science/article/pii/S1386947702002461.
- Heremans et al. (2013) J. P. Heremans, M. S. Dresselhaus, L. E. Bell, and D. T. Morelli, Nat Nano 8, 471 (2013), URL http://dx.doi.org/10.1038/nnano.2013.129.
- Hochbaum et al. (2008) A. I. Hochbaum, R. Chen, R. D. Delgado, W. Liang, E. C. Garnett, M. Najarian, A. Majumdar, and P. Yang, Nature 451, 163 (2008).
- Boukai et al. (2008) A. I. Boukai, Y. Bunimovich, J. Tahir-Kheli, J.-K. Yu, W. A. Goddard III, and J. R. Heath, Nature 451, 168 (2008).
- Slack and Tsoukala (1994) G. A. Slack and V. G. Tsoukala, Journal of Applied Physics 76, 1665 (1994), URL http://dx.doi.org/10.1063/1.357750.
- Nolas et al. (1996) G. S. Nolas, G. A. Slack, D. T. Morelli, T. M. Tritt, and A. C. Ehrlich, Journal of Applied Physics 79, 4002 (1996), URL http://aip.scitation.org/doi/abs/10.1063/1.361828.
- Sales et al. (1997) B. C. Sales, D. Mandrus, B. C. Chakoumakos, V. Keppens, and J. R. Thompson, Phys. Rev. B 56, 15081 (1997), URL https://link.aps.org/doi/10.1103/PhysRevB.56.15081.
- Nolas et al. (1998) G. S. Nolas, J. L. Cohn, and G. A. Slack, Phys. Rev. B 58, 164 (1998), URL https://link.aps.org/doi/10.1103/PhysRevB.58.164.
- Voneshen et al. (2013) D. J. Voneshen, K. Refson, E. Borissenko, M. Krisch, A. Bosak, A. Piovano, E. Cemal, M. Enderle, M. J. Gutmann, M. Hoesch, et al., Nat Mater 12, 1028 (2013), ISSN 1476-1122, letter, URL http://dx.doi.org/10.1038/nmat3739.
- Shiga et al. (2012) T. Shiga, J. Shiomi, J. Ma, O. Delaire, T. Radzynski, A. Lusakowski, K. Esfarjani, and G. Chen, Phys. Rev. B 85, 155203 (2012), URL http://link.aps.org/doi/10.1103/PhysRevB.85.155203.
- Zhao et al. (2014) L.-D. Zhao, S.-H. Lo, Y. Zhang, H. Sun, G. Tan, C. Uher, C. Wolverton, V. P. Dravid, and M. G. Kanatzidis, Nature 508, 373 (2014), ISSN 0028-0836, letter, URL http://dx.doi.org/10.1038/nature13184.
- Delaire et al. (2011b) O. Delaire, J. Ma, K. Marty, A. F. May, M. A. McGuire, M.-H. Du, D. J. Singh, A. Podlesnyak, G. Ehlers, M. D. Lumsden, et al., Nat Mater 10, 614 (2011b), ISSN 1476-1122, URL http://dx.doi.org/10.1038/nmat3035.
- Li et al. (2015) C. W. Li, J. Hong, A. F. May, D. Bansal, S. Chi, T. Hong, G. Ehlers, and O. Delaire, Nat Phys 11, 1063 (2015), ISSN 1745-2473, article, URL http://dx.doi.org/10.1038/nphys3492.
- Hong and Delaire (2016) J. Hong and O. Delaire, ArXiv e-prints (2016), eprint 1604.07077.
- Ribeiro et al. (2018) G. A. S. Ribeiro, L. Paulatto, R. Bianco, I. Errea, F. Mauri, and M. Calandra, Phys. Rev. B 97, 014306 (2018), URL https://link.aps.org/doi/10.1103/PhysRevB.97.014306.
- Battiato et al. (2015) M. Battiato, J. M. Tomczak, Z. Zhong, and K. Held, Phys. Rev. Lett. 114, 236603 (2015), preprint arXiv:arXiv:1505.02946, URL http://link.aps.org/doi/10.1103/PhysRevLett.114.236603.
- Zhou et al. (2015) J. Zhou, B. Liao, B. Qiu, S. Huberman, K. Esfarjani, M. S. Dresselhaus, and G. Chen, Proceedings of the National Academy of Sciences 112, 14777 (2015), URL http://www.pnas.org/content/112/48/14777.abstract.
- Heremans et al. (2008) J. P. Heremans, V. Jovovic, E. S. Toberer, A. Saramat, K. Kurosaki, A. Charoenphakdee, S. Yamanaka, and G. J. Snyder, Science 321, 554 (2008), ISSN 0036-8075, URL http://science.sciencemag.org/content/321/5888/554.
- Heremans et al. (2012) J. P. Heremans, B. Wiendlocha, and A. M. Chamoire, Energy Environ. Sci. 5, 5510 (2012), URL http://dx.doi.org/10.1039/C1EE02612G.
- Pei et al. (2011) Y. Pei, X. Shi, A. LaLonde, H. Wang, L. Chen, and G. J. Snyder, Nature 473, 66 (2011), ISSN 0028-0836, URL http://dx.doi.org/10.1038/nature09996.
- Bhattacharya and Madsen (2015) S. Bhattacharya and G. K. H. Madsen, Phys. Rev. B 92, 085205 (2015), URL https://link.aps.org/doi/10.1103/PhysRevB.92.085205.
- Zhang et al. (2016) J. Zhang, L. Song, G. K. H. Madsen, K. F. F. Fischer, W. Zhang, X. Shi, and B. B. Iversen, Nature Communications 7, 10892 EP (2016), article, URL http://dx.doi.org/10.1038/ncomms10892.
- Parker et al. (2013) D. Parker, X. Chen, and D. J. Singh, Phys. Rev. Lett. 110, 146601 (2013), URL https://link.aps.org/doi/10.1103/PhysRevLett.110.146601.
- Bilc et al. (2015) D. I. Bilc, G. Hautier, D. Waroquiers, G.-M. Rignanese, and P. Ghosez, Phys. Rev. Lett. 114, 136601 (2015), URL http://link.aps.org/doi/10.1103/PhysRevLett.114.136601.
- Hicks and Dresselhaus (1993b) L. D. Hicks and M. S. Dresselhaus, Phys. Rev. B 47, 16631 (1993b), URL https://link.aps.org/doi/10.1103/PhysRevB.47.16631.
- Kuroki and Arita (2007) K. Kuroki and R. Arita, Journal of the Physical Society of Japan 76, 083707 (2007), URL http://dx.doi.org/10.1143/JPSJ.76.083707.
- Arita et al. (2008b) R. Arita, K. Kuroki, K. Held, A. V. Lukoyanov, S. Skornyakov, and V. I. Anisimov, Phys. Rev. B 78, 115121 (2008b), URL https://link.aps.org/doi/10.1103/PhysRevB.78.115121.
- Usui et al. (2014) H. Usui, K. Kuroki, S. Nakano, K. Kudo, and M. Nohara, Journal of Electronic Materials 43, 1656 (2014), ISSN 1543-186X, URL https://doi.org/10.1007/s11664-013-2823-5.
- Paul and Kotliar (2003) I. Paul and G. Kotliar, Phys. Rev. B 67, 115131 (2003).
- LaLonde et al. (2011) A. D. LaLonde, Y. Pei, H. Wang, and G. J. Snyder, Materials Today 14, 526 (2011), ISSN 1369-7021, URL http://www.sciencedirect.com/science/article/pii/S1369702111702784.
- Schweitzer and Czycholl (1991) H. Schweitzer and G. Czycholl, Phys. Rev. Lett. 67, 3724 (1991).
- Grenzebach et al. (2006) C. Grenzebach, F. Anders, and G. Czycholl, Physica B 378-380, 690 (2006).
- Arsenault et al. (2013) L.-F. m. c. Arsenault, B. S. Shastry, P. Sémon, and A.-M. S. Tremblay, Phys. Rev. B 87, 035126 (2013), URL http://link.aps.org/doi/10.1103/PhysRevB.87.035126.
- Zlatić and Freericks (2012) V. Zlatić and J. K. Freericks, Phys. Rev. Lett. 109, 266601 (2012), URL http://link.aps.org/doi/10.1103/PhysRevLett.109.266601.
- Oudovenko et al. (2006) V. S. Oudovenko, G. Pálsson, K. Haule, G. Kotliar, and S. Y. Savrasov, Phys. Rev. B 73, 035120 (2006), URL http://link.aps.org/abstract/PRB/v73/e035120.
- Haule and Kotliar (2009b) K. Haule and G. Kotliar, Properties and Applications of Thermoelectric Materials, Proceedings of the NATO Advanced Research Workshop on Properties and Application of Thermoelectric Materials, Hvar, Croatia, 21-26 September 2008 (Springer Netherlands, 2009b), chap. Thermoelectrics Near the Mott Localization–Delocalization Transition, pp. 119–131, NATO Science for Peace and Security Series B: Physics and Biophysics.
- Boehnke and Lechermann (2014) L. Boehnke and F. Lechermann, physica status solidi (a) 211, 1267 (2014), ISSN 1862-6319, URL http://dx.doi.org/10.1002/pssa.201300197.
- Mravlje and Georges (2016) J. Mravlje and A. Georges, Phys. Rev. Lett. 117, 036401 (2016), URL http://link.aps.org/doi/10.1103/PhysRevLett.117.036401.
- Behnia et al. (2004) K. Behnia, D. Jaccard, and J. Flouquet, Journal of Physics: Condensed Matter 16, 5187 (2004), URL http://stacks.iop.org/0953-8984/16/i=28/a=037.
- Mukerjee (2005) S. Mukerjee, Phys. Rev. B 72, 195109 (2005).
- Zlatić et al. (2007) V. Zlatić, R. Monnier, J. K. Freericks, and K. W. Becker, Phys. Rev. B 76, 085122 (2007), URL https://link.aps.org/doi/10.1103/PhysRevB.76.085122.
- Chaikin and Beni (1976) P. M. Chaikin and G. Beni, Phys. Rev. B 13, 647 (1976), URL http://link.aps.org/doi/10.1103/PhysRevB.13.647.
- Koshibae et al. (2000) W. Koshibae, K. Tsutsui, and S. Maekawa, Phys. Rev. B 62, 6869 (2000), URL http://link.aps.org/doi/10.1103/PhysRevB.62.6869.
- Wang et al. (2003) Y. Wang, N. S. Rogado, R. J. Cava, and N. P. Ong, Nature 423, 425 (2003), URL http://www.nature.com/nature/journal/v423/n6938/suppinfo/nature01639_S1.html.
- Uchida et al. (2011) M. Uchida, K. Oishi, M. Matsuo, W. Koshibae, Y. Onose, M. Mori, J. Fujioka, S. Miyasaka, S. Maekawa, and Y. Tokura, Phys. Rev. B 83, 165127 (2011), URL https://link.aps.org/doi/10.1103/PhysRevB.83.165127.
- Liu et al. (2013) H. Liu, X. Yuan, P. Lu, X. Shi, F. Xu, Y. He, Y. Tang, S. Bai, W. Zhang, L. Chen, et al., Advanced Materials 25, 6607 (2013), ISSN 1521-4095, URL http://dx.doi.org/10.1002/adma.201302660.
- Brown et al. (2013) D. R. Brown, T. Day, K. A. Borup, S. Christensen, B. B. Iversen, and G. J. Snyder, APL Materials 1, 052107 (2013), URL http://dx.doi.org/10.1063/1.4827595.
- Nilges et al. (2009) T. Nilges, S. Lange, M. Bawohl, J. M. Deckwart, M. Janssen, H.-D. Wiemhöfer, R. Decourt, B. Chevalier, J. Vannahme, H. Eckert, et al., Nature Materials 8, 101 EP (2009), article, URL http://dx.doi.org/10.1038/nmat2358.
- Guin et al. (2014) S. N. Guin, J. Pan, A. Bhowmik, D. Sanyal, U. V. Waghmare, and K. Biswas, Journal of the American Chemical Society 136, 12712 (2014), pMID: 25134826, URL http://dx.doi.org/10.1021/ja5059185.
- Roy and Maiti (2018) P. Roy and T. Maiti, Journal of Physics D: Applied Physics 51, 065104 (2018), URL http://stacks.iop.org/0022-3727/51/i=6/a=065104.
- Mahan and Sofo (1996) G. D. Mahan and J. O. Sofo, Proc. Natl. Acad. Sci. USA 93, 7436 (1996),
- Zhang et al. (2011b) Y. Zhang, M. S. Dresselhaus, Y. Shi, Z. Ren, and G. Chen, Nano Letters 11, 1166 (2011b), URL http://pubs.acs.org/doi/abs/10.1021/nl104090j.
- Goldsmid and Sharp (1999) H. J. Goldsmid and J. W. Sharp, Journal of Electronic Materials 28, 869 (1999), ISSN 1543-186X, URL https://doi.org/10.1007/s11664-999-0211-y.
- Battiato et al. (2017) M. Battiato, V. Zlatic, and K. Held, Phys. Rev. B 95, 235137 (2017), URL https://link.aps.org/doi/10.1103/PhysRevB.95.235137.
- Madsen and Singh (2006) G. K. Madsen and D. J. Singh, Computer Physics Communications 175, 67 (2006), ISSN 0010-4655, URL http://www.sciencedirect.com/science/article/B6TJ5-4JVSWV1-3/2/a9c4b7987d52a50736c23ff36ca461d7.
- Pizzi et al. (2014) G. Pizzi, D. Volja, B. Kozinsky, M. Fornari, and N. Marzari, Computer Physics Communications 185, 422 (2014), ISSN 0010-4655, URL http://www.sciencedirect.com/science/article/pii/S0010465513003160.
- Scheidemantel et al. (2003) T. J. Scheidemantel, C. Ambrosch-Draxl, T. Thonhauser, J. V. Badding, and J. O. Sofo, Phys. Rev. B 68, 125210 (2003), URL https://link.aps.org/doi/10.1103/PhysRevB.68.125210.
- Singh (2007) D. J. Singh, Phys. Rev. B 76, 085110 (2007), URL http://link.aps.org/doi/10.1103/PhysRevB.76.085110.
- Singh (2010) D. J. Singh, Phys. Rev. B 81, 195217 (2010), URL http://link.aps.org/doi/10.1103/PhysRevB.81.195217.
- An et al. (2009) J. An, A. S. Sefat, D. J. Singh, and M.-H. Du, Phys. Rev. B 79, 075120 (2009), URL http://link.aps.org/doi/10.1103/PhysRevB.79.075120.
- Rhyee et al. (2009) J.-S. Rhyee, K. H. Lee, S. M. Lee, E. Cho, S. I. Kim, E. Lee, Y. S. Kwon, J. H. Shim, and G. Kotliar, Nature 459, 965 (2009), ISSN 0028-0836, URL http://dx.doi.org/10.1038/nature08088.
- Madsen (2006) G. K. H. Madsen, Journal of the American Chemical Society 128, 12140 (2006), pMID: 16967963, URL http://dx.doi.org/10.1021/ja062526a.
- Wang et al. (2011a) S. Wang, Z. Wang, W. Setyawan, N. Mingo, and S. Curtarolo, Phys. Rev. X 1, 021012 (2011a), URL http://link.aps.org/doi/10.1103/PhysRevX.1.021012.
- Opahle et al. (2012) I. Opahle, G. K. H. Madsen, and R. Drautz, Phys. Chem. Chem. Phys. 14, 16197 (2012), URL http://dx.doi.org/10.1039/C2CP41826F.
- Garrity (2016) K. F. Garrity, Phys. Rev. B 94, 045122 (2016), URL http://link.aps.org/doi/10.1103/PhysRevB.94.045122.
- Gorai et al. (2017) P. Gorai, V. Stevanovic, and E. S. Toberer, 2, 17053 EP (2017), review Article, URL http://dx.doi.org/10.1038/natrevmats.2017.53.
- van Roekeghem et al. (2016) A. van Roekeghem, J. Carrete, C. Oses, S. Curtarolo, and N. Mingo, Phys. Rev. X 6, 041061 (2016), URL https://link.aps.org/doi/10.1103/PhysRevX.6.041061.
- Parker and Singh (2010) D. Parker and D. J. Singh, Phys. Rev. B 82, 035204 (2010), URL https://link.aps.org/doi/10.1103/PhysRevB.82.035204.
- Wang et al. (2011b) H. Wang, Y. Pei, A. D. LaLonde, and G. J. Snyder, Advanced Materials 23, 1366 (2011b), ISSN 1521-4095, URL http://dx.doi.org/10.1002/adma.201004200.
- Chang et al. (2017) P.-Y. Chang, O. Erten, and P. Coleman, Nat Phys advance online publication (2017), ISSN 1745-2481, article, URL http://dx.doi.org/10.1038/nphys4092.
- Corti et al. (2000) M. Corti, M. Fanciulli, and F. Tabak, Journal of Applied Physics 87, 6280 (2000), URL http://dx.doi.org/10.1063/1.372679.
- Sluchanko et al. (2000) N. E. Sluchanko, V. V. Glushkov, S. V. Demishev, M. V. Kondrin, K. M. Petukhov, N. A. Samarin, V. V. Moshchalkov, and A. A. Menovsky, EPL (Europhysics Letters) 51, 557 (2000), URL http://stacks.iop.org/0295-5075/51/i=5/a=557.
- Glushkov et al. (2011) V. V. Glushkov, B. P. Gorshunov, E. S. Zhukova, S. V. Demishev, A. A. Pronin, N. E. Sluchanko, S. Kaiser, and M. Dressel, Phys. Rev. B 84, 073108 (2011), URL https://link.aps.org/doi/10.1103/PhysRevB.84.073108.
- Held et al. (2009) K. Held, R. Arita, V. I. Anisimov, and K. Kuroki, in Properties and Applications of Thermoelectric Materials, edited by V. Zlatic and A. C. Hewson (Springer Netherlands, 2009), NATO Science for Peace and Security Series B: Physics and Biophysics, pp. 141–157, ISBN 978-90-481-2892-1, 10.1007/978-90-481-2892-1_9, URL http://dx.doi.org/10.1007/978-90-481-2892-1_9.
- Arita et al. (2008c) R. Arita, K. Kuroki, K. Held, A. V. Lukoyanov, S. Skornyakov, and V. I. Anisimov, Phys. Rev. B 78, 115121 (2008c), URL http://link.aps.org/abstract/PRB/v78/e115121.
- Sluchanko et al. (1998) N. Sluchanko, V. Glushkov, S. Demishev, M. Kondrin, K. Petukhov, A. Pronin, N. Samarin, Y. Bruynseraede, V. Moshchalkov, and A. Menovsky, JETP Letters 68, 817 (1998), ISSN 0021-3640, 10.1134/1.567951, URL http://dx.doi.org/10.1134/1.567951.
- Sharath Chandra et al. (2008) L. S. Sharath Chandra, A. Lakhani, M. Gangrade, and V. Ganesan, Phys. Rev. B 78, 075123 (2008), URL https://link.aps.org/doi/10.1103/PhysRevB.78.075123.
- Herzog et al. (2010b) A. Herzog, M. Marutzky, J. Sichelschmidt, F. Steglich, S. Kimura, S. Johnsen, and B. B. Iversen, Phys. Rev. B 82, 245205 (2010b), URL http://link.aps.org/doi/10.1103/PhysRevB.82.245205.
- Fuccillo et al. (2013) M. K. Fuccillo, Q. D. Gibson, M. N. Ali, L. M. Schoop, and R. J. Cava, APL Materials 1, 062102 (2013), URL http://scitation.aip.org/content/aip/journal/aplmater/1/6/10.1063/1.4833055.
- Mani et al. (2002) A. Mani, A. Bharathi, S. Mathi Jaya, G. L. N. Reddy, C. S. Sundar, and Y. Hariharan, Phys. Rev. B 65, 245206 (2002), URL http://link.aps.org/doi/10.1103/PhysRevB.65.245206.
- Issi and Luyckx (1966) J. Issi and A. Luyckx, Physics Letters 23, 13 (1966), ISSN 0031-9163, URL http://www.sciencedirect.com/science/article/pii/0031916366902319.
- Sun et al. (2009b) Y. Sun, S. Johnsen, P. Eklund, M. Sillassen, J. B. ttiger, N. Oeschler, P. Sun, F. Steglich, and B. B. Iversen, Journal of Applied Physics 106, 033710 (2009b), URL http://link.aip.org/link/?JAP/106/033710/1.
- Sun et al. (2010b) Y. Sun, E. Zhang, S. Johnsen, M. Sillassen, P. Sun, F. Steglich, J. Bøttiger, and B. B. Iversen, Journal of Physics D: Applied Physics 43, 205402 (2010b), URL http://stacks.iop.org/0022-3727/43/i=20/a=205402.
- Sun et al. (2009c) P. Sun, N. Oeschler, S. Johnsen, B. B. Iversen, and F. Steglich, Phys. Rev. B 79, 153308 (2009c), URL http://link.aps.org/abstract/PRB/v79/e153308.
- Frederikse (1953) H. P. R. Frederikse, Phys. Rev. 92, 248 (1953), URL https://link.aps.org/doi/10.1103/PhysRev.92.248.
- Herring (1954) C. Herring, Phys. Rev. 96, 1163 (1954).
- Geballe and Hull (1954) T. H. Geballe and G. W. Hull, Phys. Rev. 94, 1134 (1954).
- Frederikse and Mielczarek (1955) H. P. R. Frederikse and E. V. Mielczarek, Phys. Rev. 99, 1889 (1955), URL https://link.aps.org/doi/10.1103/PhysRev.99.1889.
- F.J. Blatt and Greigr (1976) C. F. F.J. Blatt, P.A. Schroeder and D. Greigr, Thermoelectric Power of Metals (Plenum Press, New York and London, 1976).
- Lazarević et al. (2010) N. Lazarević, Z. V. Popović, R. Hu, and C. Petrovic, Phys. Rev. B 81, 144302 (2010).
- Gippius et al. (2009) A. A. Gippius, M. Baenitz, A. K. Rajarajan, E. M. Bruening, K. O. otnikov, R. Walstedt, A. Strydom, J. Mydosh, and F. Steglich, Journal of Physics: Conference Series 150, 042040 (4pp) (2009), URL http://stacks.iop.org/1742-6596/150/042040.
- Kieslich et al. (2014) G. Kieslich, C. S. Birkel, I. Veremchuk, Y. Grin, and W. Tremel, Dalton Trans. 43, 558 (2014), URL http://dx.doi.org/10.1039/C3DT51535D.
- Diakhate et al. (2011) M. S. Diakhate, R. P. Hermann, A. Möchel, I. Sergueev, M. Søndergaard, M. Christensen, and M. J. Verstraete, Phys. Rev. B 84, 125210 (2011), URL http://link.aps.org/doi/10.1103/PhysRevB.84.125210.
- Wang et al. (2001) Y. Wang, Z. A. Xu, T. Kakeshita, S. Uchida, S. Ono, Y. Ando, and N. P. Ong, Phys. Rev. B 64, 224519 (2001), URL http://link.aps.org/doi/10.1103/PhysRevB.64.224519.
- Gippius et al. (2014a) A. A. Gippius, V. Y. Verchenko, A. V. Tkachev, N. E. Gervits, C. S. Lue, A. A. Tsirlin, N. Büttgen, W. Krätschmer, M. Baenitz, M. Shatruk, et al., Phys. Rev. B 89, 104426 (2014a), URL https://link.aps.org/doi/10.1103/PhysRevB.89.104426.
- Gippius et al. (2014b) A. Gippius, M. Baenitz, K. Okhotnikov, S. Johnsen, B. Iversen, and A. Shevelkov, Applied Magnetic Resonance pp. 1–16 (2014b), ISSN 0937-9347, URL http://dx.doi.org/10.1007/s00723-014-0592-9.
- Storchak et al. (2012) V. G. Storchak, J. H. Brewer, R. L. Lichti, R. Hu, and C. Petrovic, Journal of Physics: Condensed Matter 24, 185601 (2012), URL http://stacks.iop.org/0953-8984/24/i=18/a=185601.
- Richter and Ipser (1997) K. W. Richter and H. Ipser, Journal of Alloys and Compounds 247, 247 (1997), ISSN 0925-8388, URL http://www.sciencedirect.com/science/article/pii/S0925838896025972.
- Sanchela et al. (2015) A. V. Sanchela, A. D. Thakur, and C. Tomy, Journal of Materiomics 1, 205 (2015), ISSN 2352-8478, URL http://www.sciencedirect.com/science/article/pii/S2352847815000325.
- Fu et al. (2016) Y. Fu, D. J. Singh, W. Li, and L. Zhang, Phys. Rev. B 94, 075122 (2016), URL https://link.aps.org/doi/10.1103/PhysRevB.94.075122.
- Sales et al. (1996) B. C. Sales, D. Mandrus, and R. K. Williams, Science 272, 1325 (1996), ISSN 0036-8075, URL http://science.sciencemag.org/content/272/5266/1325.
- Shi et al. (2011) X. Shi, J. Yang, J. R. Salvador, M. Chi, J. Y. Cho, H. Wang, S. Bai, J. Yang, W. Zhang, and L. Chen, Journal of the American Chemical Society 133, 7837 (2011), pMID: 21524125, URL http://dx.doi.org/10.1021/ja111199y.
- Rogl et al. (2014) G. Rogl, A. Grytsiv, P. Rogl, N. Peranio, E. Bauer, M. Zehetbauer, and O. Eibl, Acta Materialia 63, 30 (2014), ISSN 1359-6454, URL http://www.sciencedirect.com/science/article/pii/S1359645413007246.
- Rakoto et al. (1999) H. Rakoto, M. Respaud, J. Broto, E. Arushanov, and T. Caillat, Physica B: Condensed Matter 269, 13 (1999), ISSN 0921-4526, URL http://www.sciencedirect.com/science/article/pii/S0921452699000940.
- Ishii et al. (2002) H. Ishii, K. Okazaki, A. Fujimori, Y. Nagamoto, T. Koyanagi, and J. O. Sofo, Journal of the Physical Society of Japan 71, 2271 (2002), URL https://doi.org/10.1143/JPSJ.71.2271.
- Ikeda et al. (2015) M. Ikeda, P. Tomeš, L. Prochaska, J. Eilertsen, S. Populoh, S. Löffler, R. Svagera, M. Waas, H. Sassik, A. Weidenkaff, et al., Zeitschrift für anorganische und allgemeine Chemie 641, 2020 (2015), ISSN 1521-3749, URL http://dx.doi.org/10.1002/zaac.201500179.
- Arushanov et al. (1997) E. Arushanov, K. Fess, W. Kaefer, C. Kloc, and E. Bucher, Phys. Rev. B 56, 1911 (1997), URL https://link.aps.org/doi/10.1103/PhysRevB.56.1911.
- Leszczynski et al. (2013) J. Leszczynski, V. D. Ros, B. Lenoir, A. Dauscher, C. Candolfi, P. Masschelein, J. Hejtmanek, K. Kutorasinski, J. Tobola, R. I. Smith, et al., Journal of Physics D: Applied Physics 46, 495106 (2013), URL http://stacks.iop.org/0022-3727/46/i=49/a=495106.
- Wee et al. (2010) D. Wee, B. Kozinsky, N. Marzari, and M. Fornari, Phys. Rev. B 81, 045204 (2010), URL https://link.aps.org/doi/10.1103/PhysRevB.81.045204.
- Singh and Pickett (1994) D. J. Singh and W. E. Pickett, Phys. Rev. B 50, 11235 (1994), URL https://link.aps.org/doi/10.1103/PhysRevB.50.11235.
- Sofo and Mahan (1998) J. O. Sofo and G. D. Mahan, Phys. Rev. B 58, 15620 (1998), URL https://link.aps.org/doi/10.1103/PhysRevB.58.15620.
- D’Amico et al. (2016) P. D’Amico, L. Agapito, A. Catellani, A. Ruini, S. Curtarolo, M. Fornari, M. B. Nardelli, and A. Calzolari, Phys. Rev. B 94, 165166 (2016), URL https://link.aps.org/doi/10.1103/PhysRevB.94.165166.
- Korotaev and Yanilkin (2017) P. Korotaev and A. Yanilkin, J. Mater. Chem. C 5, 10185 (2017), URL http://dx.doi.org/10.1039/C7TC03603E.
- Tomczak et al. (2014) J. M. Tomczak, M. Casula, T. Miyake, and S. Biermann, Phys. Rev. B 90, 165138 (2014), URL http://link.aps.org/doi/10.1103/PhysRevB.90.165138.
- Guo et al. (2015) R. Guo, X. Wang, and B. Huang, 5, 7806 EP (2015), article, URL http://dx.doi.org/10.1038/srep07806.
- Koga et al. (2005) K. Koga, K. Akai, K. Oshiro, and M. Matsuura, Phys. Rev. B 71, 155119 (2005), URL https://link.aps.org/doi/10.1103/PhysRevB.71.155119.
- Chaput et al. (2005) L. Chaput, P. Pécheur, J. Tobola, and H. Scherrer, Phys. Rev. B 72, 085126 (2005), URL https://link.aps.org/doi/10.1103/PhysRevB.72.085126.
- Hammerschmidt and Paulus (2016) L. Hammerschmidt and B. Paulus, physica status solidi (a) 213, 750 (2016), ISSN 1862-6319, URL http://dx.doi.org/10.1002/pssa.201532609.
- Kajikawa (2016) Y. Kajikawa, Journal of Applied Physics 119, 055702 (2016), URL http://scitation.aip.org/content/aip/journal/jap/119/5/10.1063/1.4940742.
- Lue and Kuo (2002) C. S. Lue and Y.-K. Kuo, Phys. Rev. B 66, 085121 (2002), URL https://link.aps.org/doi/10.1103/PhysRevB.66.085121.
- Mikami et al. (2009) M. Mikami, S. Tanaka, and K. Kobayashi, Journal of Alloys and Compounds 484, 444 (2009), ISSN 0925-8388, URL http://www.sciencedirect.com/science/article/pii/S0925838809008597.
- Hanada et al. (2001) Y. Hanada, R. O. Suzuki, and K. Ono, Journal of Alloys and Compounds 329, 63 (2001), ISSN 0925-8388, URL http://www.sciencedirect.com/science/article/pii/S0925838801016772.
- Soda et al. (2014) K. Soda, S. Osawa, M. Kato, H. Miyazaki, and Y. Nishino, Proceedings of the International Conference on Strongly Correlated Electron Systems (SCES2013), JPS Conf. Proc. 3, 017036 (2014).
- Nishino et al. (2001) Y. Nishino, H. Kato, M. Kato, and U. Mizutani, Phys. Rev. B 63, 233303 (2001), URL https://link.aps.org/doi/10.1103/PhysRevB.63.233303.
- Naka et al. (2016) T. Naka, A. M. Nikitin, Y. Pan, A. de Visser, T. Nakane, F. Ishikawa, Y. Yamada, M. Imai, and A. Matsushita, Journal of Physics: Condensed Matter 28, 285601 (2016), URL http://stacks.iop.org/0953-8984/28/i=28/a=285601.
- Feng et al. (2001) Y. Feng, J. Y. Rhee, T. A. Wiener, D. W. Lynch, B. E. Hubbard, A. J. Sievers, D. L. Schlagel, T. A. Lograsso, and L. L. Miller, Phys. Rev. B 63, 165109 (2001), URL https://link.aps.org/doi/10.1103/PhysRevB.63.165109.
- Guo et al. (1998) G. Y. Guo, G. A. Botton, and Y. Nishino, Journal of Physics: Condensed Matter 10, L119 (1998), URL http://stacks.iop.org/0953-8984/10/i=8/a=002.
- Singh and Mazin (1998) D. J. Singh and I. I. Mazin, Phys. Rev. B 57, 14352 (1998), URL https://link.aps.org/doi/10.1103/PhysRevB.57.14352.
- Weht and Pickett (1998) R. Weht and W. E. Pickett, Phys. Rev. B 58, 6855 (1998), URL https://link.aps.org/doi/10.1103/PhysRevB.58.6855.
- Vasundhara et al. (2008) M. Vasundhara, V. Srinivas, and V. V. Rao, Phys. Rev. B 78, 064401 (2008), URL https://link.aps.org/doi/10.1103/PhysRevB.78.064401.
- Ishikawa et al. (2007) F. Ishikawa, K. Fukuda, N. Kawase, M. Mochigi, Y. Yamada, and A. Matsushita, Journal of Magnetism and Magnetic Materials 310, e616 (2007), ISSN 0304-8853, proceedings of the 17th International Conference on Magnetism, URL http://www.sciencedirect.com/science/article/pii/S0304885306018579.
- Shreder et al. (2008) E. Shreder, S. V. Streltsov, A. Svyazhin, A. Makhnev, V. V. Marchenkov, A. Lukoyanov, and H. W. Weber, Journal of Physics: Condensed Matter 20, 045212 (2008), URL http://stacks.iop.org/0953-8984/20/i=4/a=045212.
- Kato et al. (1998) M. Kato, Y. Nishino, S. Asano, and S. Ohara, Journal of the Japan Institute of Metals 62, 669 (1998).
- Nishino et al. (1997b) Y. Nishino, C. Kumada, and S. Asano, Scripta Materialia 36, 461 (1997b), ISSN 1359-6462, URL http://www.sciencedirect.com/science/article/pii/S1359646296003958.
- Naka et al. (2013) T. Naka, K. Sato, M. Taguchi, N. Shirakawa, T. Nakane, F. Ishikawa, Y. Yamada, Y. Takaesu, T. Nakama, and A. Matsushita, Journal of Physics: Condensed Matter 25, 275603 (2013), URL http://stacks.iop.org/0953-8984/25/i=27/a=275603.
- Matsushita et al. (2002) A. Matsushita, T. Naka, Y. Takano, T. Takeuchi, T. Shishido, and Y. Yamada, Phys. Rev. B 65, 075204 (2002), URL https://link.aps.org/doi/10.1103/PhysRevB.65.075204.
- Kato et al. (2001) H. Kato, M. Kato, Y. Nishino, U. Mizutani, and S. Asano, J. Japan Inst Metals 65, 652 (2001).
- Nishino et al. (2006) Y. Nishino, S. Deguchi, and U. Mizutani, Phys. Rev. B 74, 115115 (2006), URL https://link.aps.org/doi/10.1103/PhysRevB.74.115115.
- Nishino (2011) Y. Nishino, IOP Conference Series: Materials Science and Engineering 18, 142001 (2011), URL http://stacks.iop.org/1757-899X/18/i=14/a=142001.
- Skoug et al. (2009) E. J. Skoug, C. Zhou, Y. Pei, and D. T. Morelli, Journal of Electronic Materials 38, 1221 (2009), ISSN 1543-186X, URL https://doi.org/10.1007/s11664-008-0626-x.
- Soda et al. (2016) K. Soda, S. Harada, T. Hayashi, M. Kato, F. Ishikawa, Y. Yamada, S. ichi Fujimori, and Y. Saitoh, MATERIALS TRANSACTIONS 57, 1040 (2016).
- Weinert and Watson (1998) M. Weinert and R. E. Watson, Phys. Rev. B 58, 9732 (1998), URL https://link.aps.org/doi/10.1103/PhysRevB.58.9732.
- Bilc and Ghosez (2011) D. I. Bilc and P. Ghosez, Phys. Rev. B 83, 205204 (2011), URL https://link.aps.org/doi/10.1103/PhysRevB.83.205204.
- Do et al. (2011) D. Do, M.-S. Lee, and S. D. Mahanti, Phys. Rev. B 84, 125104 (2011), URL http://link.aps.org/doi/10.1103/PhysRevB.84.125104.
- Rai et al. (2016) D. P. Rai, Sandeep, A. Shankar, A. P. Sakhya, T. P. Sinha, R. Khenata, M. P. Ghimire, and R. K. Thapa, Materials Research Express 3, 075022 (2016), URL http://stacks.iop.org/2053-1591/3/i=7/a=075022.
- Kristanovski et al. (2017) O. Kristanovski, R. Richter, I. Krivenko, A. I. Lichtenstein, and F. Lechermann, Phys. Rev. B 95, 045114 (2017), URL http://link.aps.org/doi/10.1103/PhysRevB.95.045114.
- Galler et al. (2015) A. Galler, C. Taranto, M. Wallerberger, M. Kaltak, G. Kresse, G. Sangiovanni, A. Toschi, and K. Held, Phys. Rev. B 92, 205132 (2015), URL http://link.aps.org/doi/10.1103/PhysRevB.92.205132.
- Katsnelson et al. (2008) M. I. Katsnelson, V. Y. Irkhin, L. Chioncel, A. I. Lichtenstein, and R. A. de Groot, Rev. Mod. Phys. 80, 315 (2008), URL https://link.aps.org/doi/10.1103/RevModPhys.80.315.
- Minár (2011) J. Minár, Journal of Physics: Condensed Matter 23, 253201 (2011), URL http://stacks.iop.org/0953-8984/23/i=25/a=253201.
- Antonov et al. (2008) V. N. Antonov, A. Ernst, I. V. Maznichenko, A. N. Yaresko, and A. P. Shpak, Phys. Rev. B 77, 134444 (2008), URL https://link.aps.org/doi/10.1103/PhysRevB.77.134444.
- Fujii et al. (2003) S. Fujii, Y. Ienaga, S. Ishida, and S. Asano, Journal of the Physical Society of Japan 72, 698 (2003), URL https://doi.org/10.1143/JPSJ.72.698.
- Bandaru and Jund (2016) S. Bandaru and P. Jund, physica status solidi (b) pp. n/a–n/a (2016), ISSN 1521-3951, URL http://dx.doi.org/10.1002/pssb.201600441.
- Lechermann and Obermeyer (2015) F. Lechermann and M. Obermeyer, New Journal of Physics 17, 043026 (2015), URL http://stacks.iop.org/1367-2630/17/i=4/a=043026.
- Lechermann et al. (2017) F. Lechermann, W. Heckel, O. Kristanovski, and S. Müller, Phys. Rev. B 95, 195159 (2017), URL https://link.aps.org/doi/10.1103/PhysRevB.95.195159.
- Xu et al. (2013) B. Xu, X. Li, G. Yu, J. Zhang, S. Ma, Y. Wang, and L. Yi, Journal of Alloys and Compounds 565, 22 (2013), ISSN 0925-8388, URL http://www.sciencedirect.com/science/article/pii/S0925838813004908.
- Al-Yamani and Hamad (2016) H. Al-Yamani and B. Hamad, Journal of Electronic Materials 45, 1101 (2016), ISSN 1543-186X, URL https://doi.org/10.1007/s11664-015-4265-8.
- Bandaru et al. (2017) S. Bandaru, A. Katre, J. Carrete, N. Mingo, and P. Jund, Nanoscale and Microscale Thermophysical Engineering 0, 1 (2017), URL http://dx.doi.org/10.1080/15567265.2017.1355948.
- van Roekeghem et al. (2014) A. van Roekeghem, T. Ayral, J. M. Tomczak, M. Casula, N. Xu, H. Ding, M. Ferrero, O. Parcollet, H. Jiang, and S. Biermann, Phys. Rev. Lett. 113, 266403 (2014), preprint arXiv:1408.3136, URL http://link.aps.org/doi/10.1103/PhysRevLett.113.266403.
- Galler et al. (2017) A. Galler, P. Thunström, P. Gunacker, J. M. Tomczak, and K. Held, Phys. Rev. B 95, 115107 (2017), URL http://link.aps.org/doi/10.1103/PhysRevB.95.115107.
- Galler et al. (2018) A. Galler, J. Kaufmann, P. Gunacker, M. Pickem, P. Thunström, J. M. Tomczak, and K. Held, Journal of the Physical Society of Japan 87, 041004 (2018), preprint arXiv:1709.02663, URL https://doi.org/10.7566/JPSJ.87.041004.
- Galler et al. (2017) A. Galler, P. Thunström, J. Kaufmann, M. Pickem, J. M. Tomczak, and K. Held, ArXiv e-prints (2017), eprint 1710.06651.
