High-density two-dimensional electron system induced by oxygen vacancies in ZnO.
Abstract
We realize a two-dimensional electron system (2DES) in ZnO by simply depositing pure aluminum on its surface in ultra-high vacuum, and characterize its electronic structure using angle-resolved photoemission spectroscopy. The aluminum oxidizes into alumina by creating oxygen vacancies that dope the bulk conduction band of ZnO and confine the electrons near its surface. The electron density of the 2DES is up to two orders of magnitude higher than those obtained in ZnO heterostructures. The 2DES shows two -type subbands, that we compare to the -like 2DESs in titanates, with clear signatures of many-body interactions that we analyze through a self-consistent extraction of the system self-energy and a modeling as a coupling of a 2D Fermi liquid with a Debye distribution of phonons.
pacs:
79.60.-iZnO is a transparent, easy to fabricate, oxide semiconductor with a direct band gap eV. Its many uses include window layers in photovoltaic devices, varistors for voltage surge protection, UV absorbers, gas sensors, and catalytic devices ZnO-book ; Book-ZnO-Wiley . ZnO is also a candidate for novel applications, such as transparent field effect transistors, UV laser diodes, memristors, or high-temperature/high-field electronics ZnO-book ; Book-ZnO-Wiley ; Lorenz2016 ; Liu2015 ; Bakin2007 ; Ozgur2005 . In fact, ZnO can be seen as a link between the classical group-IV or III-V semiconductors, e.g. Si or GaAs, and transition metal oxides (TMOs), such as SrTiO3. Due to their valence -orbitals, the latter show a rich variety of collective electronic phenomena, like magnetism or high- superconductivity Tokura2000 ; Dagotto2005 . Moreover, the controlled fabrication of a two-dimensional electron system (2DES) in ZnO can result in extremely high electron mobilities, even competing with the ones of GaAs-based heterostructures, and showing the quantum hall effects Tsukazaki2007 ; Tsukazaki2010 .
2DES in TMOs have also improved in mobility over the last decade, but what makes them really unique is the control of superconductivity, magnetism and spin-orbit coupling by varying the electron density using a gate voltage Ohtomo2004 ; Thiel2006 ; Reyren2007 ; Ueno2008 ; Brinkman2007 ; Caviglia2008 ; Caviglia2010 ; Joshua2013 ; Chen2013 ; Chen2015 ; Ngo2015 ; Stornaiuolo2016 . Additionally, for many insulating TMOs, recent works demonstrated that oxygen vacancies near the surface provide a simple and efficient mechanism to produce a 2DES, with electron densities as high as cm-2 Santander-Syro2011 ; Meevasana2011 ; Santander-Syro2012 ; King2012 ; Bareille2014 ; Roedel2014 ; Walker2014 ; Roedel2015 ; Roedel2016 ; Roedel2017 ; Frantzeskakis2017 , and showing magnetic states linked to the presence of such vacancies Taniuchi2016 .
Here we show, using angle-resolved photoemission spectroscopy (ARPES), that the simple evaporation in ultra-high vacuum (UHV) of an atomic layer of pure aluminum on ZnO creates a 2DES with electron densities up to two orders of magnitude higher than in previous studies. We demonstrate that the 2DES results from oxidation of the Al layer and concomitant doping with oxygen vacancies of the underlying ZnO surface. The 2DES is composed of two subbands with different effective masses, as the mass of the inner band is wholly renormalized due to the energetic proximity of its band bottom with a phonon frequency, whereas the outer band, dispersing deeper in energy, shows only a kink due to the electron-phonon interaction. We thoroughly investigate the electron-phonon coupling by a self-consistent extraction of the electron self-energy. We deduce an Eliashberg coupling function wholly compatible with a 2D Debye-like distribution of phonons and a mass enhancement parameter .
Previous photoemission experiments on ZnO Powell1972 ; Gopel1982 ; Ozawa2005 ; Ozawa2009 ; Ozawa2010 ; Piper2010 ; Deinert2015 showed that hydrogenation of its polar or non-polar surfaces, for instance through chemisorption of hydrogen, methanol or water, induces a downward band-bending and the formation of a 2DES with a moderate electron density cm-2, showing only one broad shallow subband below the Fermi level () Piper2010 . More recently, several ARPES studies focused on the many-body phenomena of electron-phonon coupling in oxides, demonstrating that at low carrier densities the 2DES in TiO2, SrTiO3 and also ZnO are composed of polarons Moser2013 ; Wang2016 ; Yukawa2016 . Due to a non-adiabatic electron-phonon coupling, the polaronic regime changes to a Fermi liquid behavior with increasing electron densities, as electronic screening of the polar lattice becomes more efficient Verdi2017 . However, the Fermi liquid regime in ZnO has not been studied yet, as previous doping methods of the surface were insufficient to achieve high electron densities. Attaining large carrier densities for a 2DES in ZnO is also appealing for applications in high-power transparent electronics.
We now discuss our main findings. Henceforth, we will focus on data measured at the O-terminated ZnO surface. As shown in the Supplementary Material, similar results are obtained at the ZnO (zinc-terminated) interface, although the resulting 2DES has a slightly smaller electron density. Furthermore, to recall that we deposited pure Al (not aluminum oxide) on the ZnO surface, we note the resulting AlOx capping layer simply as “Al”, specifying in parenthesis the evaporated thickness. Additional details on the crystallographic nomenclature, surface preparation, aluminum evaporation, and ARPES measurements are provided in the Supplementary Material.
The creation of a 2DES using Al deposition is identical to the procedure described in Ref. Roedel2016 . It is worth noting that, for previously reported 2DES in oxides, the intense synchrotron beam can create oxygen vacancies due to desorption induced by electronic transitions Walker2015 . This process, based on the photo-excitation of core levels, is different in titanates and ZnO Tanaka2004 . Thus, our results demonstrate that the creation of 2DES in oxides using Al is a much more general mechanism, enabling furthermore ARPES studies independent from the relaxation mechanism of photo-excited core levels.
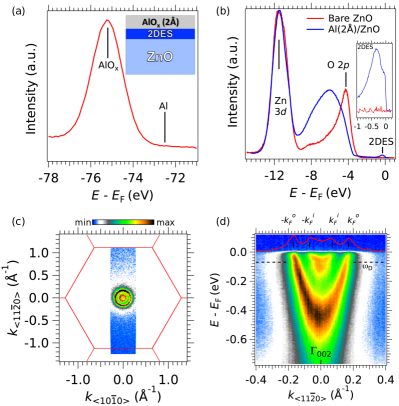
Fig. 1(a) shows that the Al- core-level peak at the Al(2 Å)/ZnO interface corresponds to oxidized aluminum, whose binding energy ( eV) is very different from the one of metallic aluminum ( eV) Roedel2016 . Fig. 1(b) compares the valence-band of the bare, stoichiometric ZnO surface (red curve) and of the Al(2 Å)/ZnO interface (blue curve). We observe that, contrary to oxygen-deficient surfaces or interfaces of TMOs Roedel2016 ; Backes2016 , there are no measurable states corresponding to localized electrons (i.e., deep donors) in the band gap of oxygen-deficient ZnO. The absence of such states in ZnO emphasizes the simpler character of a 2DES based on -valence electrons, compared to the -valence electrons in TMOs. On the other hand, the binding energy and shape of the O valence band are dramatically changed, possibly because the O- valence band of the oxidized Al layer is at a binding energy of eV. Moreover, as detailed in the inset of Fig. 1(b), the Al(2 Å)/ZnO interface shows a clear quasi-particle peak at , not present at the bare surface.
The contribution of oxygen vacancies to -type conductivity in bulk ZnO has been a controversial issue Janotti2005 ; Janotti2007 ; Janotti2009 ; Lany2010 ; Kim2009 . The photoemission signatures observed here after Al deposition, namely an oxidized Al core level and the appearance of a 2DES at , are identical to the ones reported in other oxides Roedel2016 , indicating that the mechanisms underlying the 2DES formation are similar. Future theoretical works should explore in detail the energetics and specific role of oxygen vacancies near the surface of ZnO.
We now characterize the electronic structure of the 2DES at the Al(2 Å)/ZnO (oxygen-terminated) interface. Fig. 1(c) shows the in-plane Fermi surface map measured by ARPES. There are two metallic states forming in-plane circular Fermi sheets around , that correspond to confined states of ZnO’s conduction band –which is formed by orbitals of -character. Fig. 1(d) presents the energy-momentum dispersion map of the two states forming the above concentric Fermi circles, henceforth called outer () and inner () subbands. They were measured around the bulk point along the in-plane direction. Such 2DES with two subbands in ZnO had not been observed before, as electron densities were not large enough in previous studies Gopel1982 ; Ozawa2005 ; Ozawa2009 ; Ozawa2010 ; Piper2010 ; Deinert2015 ; Yukawa2016 . Additional data presented in the Supplementary Material demonstrates that the in-plane periodicity of the electronic structure corresponds to the one of an unreconstructed surface, and that the two subbands form cylindrical, non-dispersive Fermi surfaces along the direction perpendicular to the interface, confirming their 2D character.
The subbands’ Fermi momenta, determined from the maxima of the momentum distribution curve (MDC) integrated over meV, red curve on top of Fig. 1(d), are Å-1 and Å-1. Their band bottoms, extracted from the maxima of the energy distribution curve (EDC) over Å-1 and the dispersion of the EDC peaks, Figs. 2(a, b), are located at binding energies meV and meV. Due to the light and isotropic band mass of the -type electrons forming the 2DES, the subband splitting in ZnO is times larger than in titanates Roedel2017 . The thickness of the 2DES can be estimated from the subbands’ binding energies and energy separation by assuming a triangular-wedge quantum well, yielding Å (or unit cells) along (see Supplementary Material for details).
From the area enclosed by the in-plane Fermi circles (), the density of electrons in the 2DES is cm-2, or about electrons per hexagonal unit cell in the plane. Such electron density is far larger than the critical value, estimated at cm-2, at which the crossover from a polaronic to a Fermi liquid regime for electron-phonon coupling occurs Verdi2017 . Additionally, the effective masses around of the outer and inner subbands, determined from their Fermi momenta and band bottoms using free-electron parabola approximations, are respectively and , where is the free-electron mass. The mass of the outer subband agrees well with the conduction-band mass along the plane calculated for bulk stoichiometric ZnO or determined from infrared reflectivity and cyclotron resonance experiments on lightly-doped ZnO ZnO-book ; Book-ZnO-Wiley . As the confinement of non-interacting electrons in a quantum well should result in subbands with the same effective mass, we will focus on analyzing the renormalization of inner band in the following paragraphs.
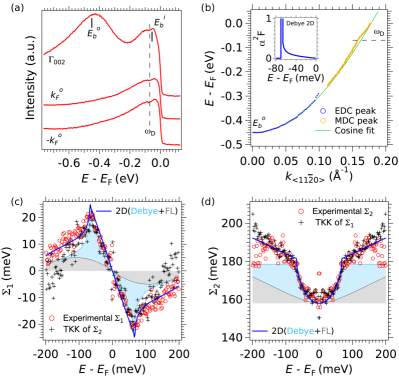
In fact, as seen from Figs. 1(d) and 2(a), the band bottom of the inner subband presents a complex structure, with a peak-dip-hump clearly seen in the EDC around . Likewise, as shown in Figs. 1(d) and 2(a, b), the outer subband shows a kink in its dispersion at approximately the same binding energy ( meV) of the dip observed in the inner band, together with a peak-dip-hump for the EDCs around its Fermi momenta. As will be shown shortly, all these features result from electron-phonon coupling.
The quantification of electron-phonon interaction is possible through the analysis of the energy-dependent real () and imaginary () parts of the electron self-energy. These can be inferred from the spectral function of the many-electron system, directly measured by ARPES Hufner-Book . Thus, we will extract and model the self energy of the outer band, and then use the results to renormalize the inner band, which is difficult to fit due to the the peak-dip-hump structure.
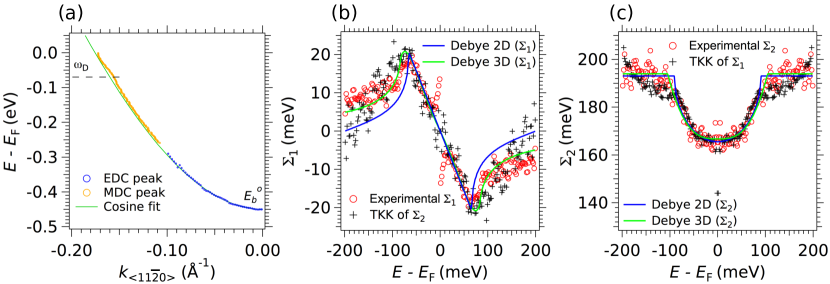
Fig. 2(b) shows the dispersion of the spectral function peak for the outer subband, extracted from the maxima of the EDCs (blue circles) and MDCs (orange circles). The continuous green line is a cosine fit to the data representing the bare (i.e., non-interacting) electron dispersion of this subband. The energy difference between the MDC peak and the bare band gives the real part of the electron self-energy, and is plotted in Fig. 2(c), red circles. The pronounced peak in at meV corresponds to the kink in the experimental dispersion. Likewise, the energy dependence of the MDCs line-widths gives the imaginary part of the electron self energy (or electronic scattering rate), and is shown in Fig. 2(d), red circles. Here, one observes a rapid increase of the scattering rate from down to the binding energy at which the real part of the self-energy peaks, followed by a less rapid but steady increase. To check the consistency of the self-energy extracted from our data, we compute the Kramers-Kronig transformation (TKK) of the experimental [respectively ], black crosses in Fig. 2(c) [respectively Fig. 2(d)]. We observe an excellent agreement between and [respectively between and ], ensuring that our analysis and choice of bare dispersion respect causality.
The simultaneous occurence of a pronounced peak in and an abrupt change in slope in at about the same energy , as observed in Figs. 2(c, d), are typical landmarks of the interaction between the electron liquid and some collective modes of the solid (e.g. phonons) having a characteristic energy Hufner-Book . Thus, we fit the experimental complex self-energy with a model of a Fermi liquid with Debye electron-phonon coupling, both in 2D Book-ElectronLiquids2005 ; Kostur1993 , as shown by the continuous blue curves in Figs. 2(c, d). The fit gives a Debye frequency of meV, in excellent agreement with our data and the phonon energies (up to about cm-1, or meV) measured by other techniques Ozgur2005 ; ZnO-book , and a dimensionless coupling constant , The isotropic Fermi liquid of the fit is characterized by a carrier density of cm-2, close to the experimental value. The electron-phonon, or Eliashberg, coupling function resulting from the used 2D Debye model is shown in the inset of Fig.2(b). We checked that a fit with a 3D Fermi liquid Debye model Book-ElectronLiquids2005 ; Engelsberg1963 yields a larger phonon cutoff energy, of the order of meV, and an overall poor agreement with the experimental self-energy. The details of the models and a comparison of the obtained fits are given in the Supplementary Material.
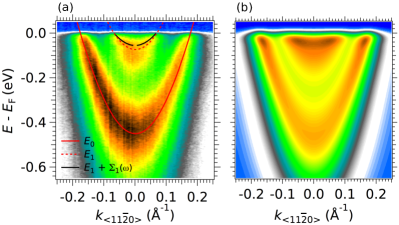
We now turn to the inner subband. To model it, we rigidly shift the bare outer band in energy and then renormalize it using the previously deduced self-energy. As shown by the red curve in Fig. 3(a), a shift of meV fits the experimental Fermi momenta, matching the required conservation of the 2D electron density. The resulting renormalized inner band, black curve in Fig. 3(a), compares excellently with the experimental inner band.
To cross-check the above analysis of the ARPES data, we simulated the whole 2DES spectral function using the self-energy of the 2D Fermi liquid Debye model fitted to the data. The resulting ARPES map, Fig. 3(b), compares well with the data. Thus, the entire electronic structure of the 2DES at the Al(2 Å)/ZnO surface can be understood from doping of the bulk conduction band by oxygen vacancies, electron confinement due to band-bending induced by those vacancies, and coupling of the ensuing subbands with a Debye-like distribution of phonons.
Note that, in the present case of a high carrier density, the coupling constant gives directly the electron mass renormalization due to electron-phonon interaction, namely Giustino2016 , where is the non-interacting band mass. Using parabolic approximations (i.e., energy-independent band masses) for the subbands’ dispersions, we can assume that the bottom of the outer band, located well below the phonon energies, gives the non-interacting band mass, while the inner band, located just above the Debye energy, gives the electron mass fully renormalized by coupling to phonons. This yields a coupling constant , subject to large errors, but in overall agreement with the more accurate value obtained above from the fit to the whole energy-dependent complex self-energy.
More generally, in insulating dielectric oxides, the electron-phonon coupling can significantly depend on the electron density, due to different screening mechanism of the oscillating ions. At low densities (i.e. band fillings smaller or comparable to the phonon cutoff frequency), screening based on dielectric polarization results in large, spatially delocalized, polarons. At high densities the increased electronic screening of the ionic lattice vibrations result in a Fermi liquid regime with weaker electron phonon coupling Verdi2017 . Those two regimes were recently characterized by ARPES in anatase-TiO2(001) Moser2013 and SrTiO3 Wang2016 . Note furthermore that the electron-phonon coupling constant obtained here is significantly smaller than the coupling constant observed in the Fermi liquid regime of anatase-TiO2 and SrTiO3 () Moser2013 ; Meevasana2010 ; Wang2016 . This suggests that, in the high carrier density regime, the electronic screening for electron-phonon coupling is more efficient for the electrons of the 2DESs in ZnO than for the electrons of the 2DESs in TMOs.
Notably, our self-consistent Kramers-Kronig analysis of the self energy in ZnO, and the deduction of the electron-phonon coupling parameter using a Debye model, is different from previous approaches used in other oxides, like SrTiO3 King2014 , where was inferred from the slope of at (i.e., the renormalization of quasiparticle mass), or TiO2 anatase, where it was estimated by modeling the self-energy to reproduce the data Moser2013 . Note that the coupling parameters deduced from the renormalization of quasiparticle mass, velocity and spectral weight in ARPES data are in general subject to large errors, as mentioned before, and distinct from the true microscopic coupling parameter Veenstra2010 .
As a whole, our results highlight the universal character of the approach based on surface redox reactions to create 2DESs in functional oxides Roedel2016 , unveil similarities and differences between - and -orbital type 2DES, and add new ingredients to the rich many-body physics displayed by confined electronic states in ZnO. Our observations suggest that oxygen vacancies can contribute to electron-doping near the surface of ZnO, motivating further experimental and theoretical studies on the formation and role of vacancies at surfaces/interfaces of this important transparent semiconductor oxide. Moreover, the realization of a highly doped 2DES in ZnO opens a new realm of possibilities, such as high-power applications using a transparent oxide semiconductor that presents many advantages with respect to standard Sn-doped In2O3 (ITO): ZnO is more abundant, cheaper, easier to fabricate and process, non toxic, and when doped it can attain mobilities comparable to those of ITO ZnO-book ; Book-ZnO-Wiley ; Lorenz2016 .
Acknowledgements.
Work at CSNSM was supported by public grants from the French National Research Agency (ANR), project LACUNES No ANR-13-BS04-0006-01, and the “Laboratoire d’Excellence Physique Atomes Lumière Matière” (LabEx PALM projects ELECTROX and 2DEG2USE) overseen by the ANR as part of the “Investissements d’Avenir” program (reference: ANR-10-LABX-0039). Work at KEK-PF was supported by Grants-in-Aid for Scientific Research (Nos. 16H02115 and 16KK0107) from the Japan Society for the Promotion of Science (JSPS). Experiments at KEK-PF were performed under the approval of the Program Advisory Committee (Proposals 2016G621 and 2015S2005) at the Institute of Materials Structure Science at KEK. T. C. R. acknowledges funding from the RTRA–Triangle de la Physique (project PEGASOS). A.F.S.-S. thanks support from the Institut Universitaire de France.SUPPLEMENTARY MATERIAL
ZnO structure and notation
ZnO crystallizes in the hexagonal wurtzite structure, with the oxygen anions forming a tetrahedron around the Zn cation. The lattice constants are Å and Å. All through this paper, we use the Miller-Bravais 4-index, or , convention for hexagonal systems, which makes permutation symmetries apparent, where are the regular Miller indices for an hexagonal lattice, and the third (redundant) index is defined as . Thus, we note the crystallographic directions in real space, the planes orthogonal to those directions, and the corresponding directions in reciprocal space.
Surface preparation and Aluminum deposition
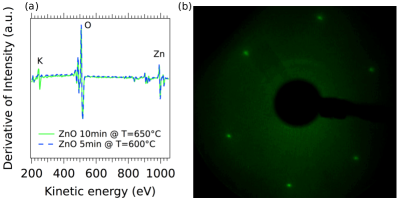
There are two possible terminations of the polar ZnO surface: Zn, or termination, and O, or termination Mariano1963 . Commercially available single crystals (SurfaceNet GmbH) with the two terminations at opposing faces were used in our experiments. The surfaces of ZnO were prepared based on the work of Dulub and coworkers Dulub2002 . The existence of potassium impurities in single crystals of ZnO is possible as potassium hydroxide is an educt in the hydrothermal synthesis of single crystals. Long annealing at elevated temperatures resulted in the migration of potassium impurities from the bulk to the surface as evidenced by the Auger spectra in Fig. 4(a).
We followed two procedures to reduce the presence of potassium and obtain an atomically clean and cristalline surface:
-
1.
Ar+ sputtering at kV for 10 minutes,
-
2.
short annealing for 5 min at C to C in UHV;
or alternatively:
-
1.
Ar+ sputtering at kV for 10 minutes at C,
-
2.
stop annealing approximately 5 minutes after sputtering.
These procedures resulted in LEED images similar to the one shown in Fig. 4(b).
Oxygen vacancies were then created on the UHV clean and cristalline ZnO surfaces by the deposition of 2 Å of aluminum at sample temperatures C. The complete details on the Al deposition are described elsewhere Roedel2016 .
Photoemission measurements
ARPES experiments were performed at the CASSIOPEE beamline of Synchrotron SOLEIL (France) and at beamline 2A of KEK-Photon Factory (KEK-PF, Japan) using hemispherical electron analyzers with vertical and horizontal slits, respectively. Pristine sample surfaces and oxygen-vacancy doping by Al-capping were obtained by in situ surface preparation as described in the previous section. The sample temperature during measurements was 7 K (SOLEIL) or 20 K (KEK-PF), without observing any -dependence between these two temperature values. The typical angular and energy resolutions were 0.25∘ and 15 meV, while the mean diameter of the incident photon beam was of the order of 50 m (SOLEIL) and 100 m (KEK-PF). We used variable energy and polarization of the incident photons. A systematic variation of the photon energy revealed no changes in the energy-momentum dispersion (see next section), a feature that is characteristic of 2D-like band structures. During the time window of our measurements the pressure was in the range of 10 mbar and no evolution or degradation of the spectra was observed.
Electronic structure of 2DES: in-plane periodicity and out-of-plane confinement
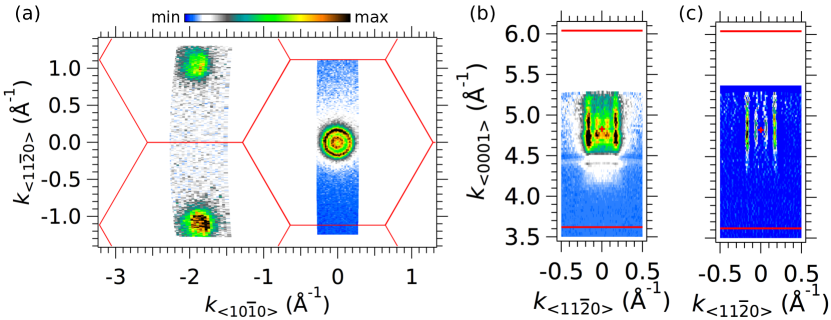
Fig. 5(a) shows the in-plane Fermi surface measured by ARPES, extended over three neighboring Brillouin zones of the unreconstructed ZnO surface. The two concentric circular Fermi sheets described in the main text are systematically observed around each of the points in these Brillouin zones, demonstrating that the electronic structure has the periodicity expected from an unreconstructed surface. Figs. 5(b, c) furthermore show that such two states form cylindrical, non-dispersive Fermi surfaces in the plane, i.e. along the direction perpendicular to the interface, confirming their 2D character. Note that the Fermi surface in the plane would be circular in the case of a 3D state, as the effective mass of the -electrons is isotropic.
Confinement potential and extension of the 2DES at the AlOx/ZnO interface
The characteristics of the confinement potential, assumed for simplicity as triangular-wedge shaped, can be readily extracted from the bottom energies of the outer and inner subbands Santander-Syro2011 . As the lowest edge of ZnO’s conduction-band is mainly -like ZnO-book , the out-of-plane effective masses, which enter into the computation of the quantum well eigen-energies, should be identical to the in-plane masses directly determined from our ARPES data. Thus, using the effective mass around of the outer subband, which is non-renormalized by electron-phonon interaction, and the energy difference of meV between the outer and inner subbands, we find that the 2DEG realized in our experiments corresponds to electrons confined by a field of about MVm in a well of depth eV. The geometrical depth of the quantum well is then Å. The thickness of the 2DEG can also be estimated from the average position of the inner subband’s wave-function, corresponding to the electrons in the quantum well farthest away from the surface. From the solutions to the Schrödinger equation in the above potential wedge, this yields approximately Å, or about 4 unit cells along , in agreement with the value inferred from the quantum-well geometrical depth.
Debye model for electron-phonon coupling
Eliashberg formalism
The theoretical tool to deal with the Hamiltonian including the electron-phonon interaction is the Eliashberg theory, at the center of which is the Eliashberg coupling function, frohlich1950theory ; echenique2004decay ; hofmann2009electron . This function can be interpreted as the phonon density of states (at energy ) weighted by the electron-phonon coupling matrix element.
The electron-phonon mass enhancement parameter , can be calculated from and understood as the dimensionless coupling strength:
| (1) |
Here, is the maximum phonon energy, and usually takes the value of Debye energy . The factor 2 appears as both the absorption and emission processes are counted in.
In the limit K that we will use, the electron-phonon self-energy can also be calculated from the Eliashberg coupling function as:
| (2) |
In principle, once the dispersion relation of the scattering phonon is given, the Eliashberg coupling function and the electron-phonon coupling strength can be calculated by applying some assumptions and approximations. In simple models, such as the Einstein model and the Debye model, analytical results can be derived.
Self-energy for the 2D and 3D Debye models
In the 2D Debye model, used in the main text to analyze our data, the Eliashberg coupling function can be analytically calculated Kostur1993 :
| (3) |
| (4) |
Here, is the mass enhancement parameter, also given by the negative slope of at .
The real part of the self-energy for the 2D Debye model () does not have an analytical expression, but can be readily calculated from the Hilbert transform of .
The 3D Debye model has simple analytical forms for both and Engelsberg1963 . For instance, for it is:
| (5) |
Thus, using either the 2D or 2D Debye models, one can extract accurate values of the Debye energy and the dimensionless coupling strength from fits to the whole energy dependent complex self-energy.
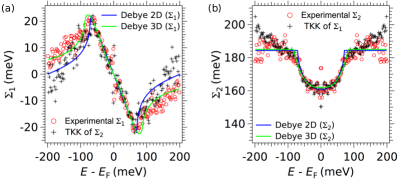
Figure 6 compares the fitting results with 3D and 2D Debye models for the outer subband (right branch, as in the main text) of the 2DES in ZnO. From this figure, it appears that the 3D Debye model fits better when , while the 2D Debye model shows a sharper inflection at . As for the fitting of , the two models give similar results, except that the 3D model tends to give a larger and a flatter bottom of , in less good agreement with experiments.
Fermi-liquid self-energy in 2D and 3D
At temperatures much smaller than the bottom of the conduction band (bare electron mass ), the self-energy of a 2D electron liquid can be written as Book-ElectronLiquids2005 :
| (6) |
where is a constant, , and is the density of electrons.
Similarly, the self-energy of a 3D electron liquid is Book-ElectronLiquids2005 :
| (7) |
where is a constant, and is the bottom of the conduction band for the electron system.
In both cases, the real part of the self-energy can be calculated from the Hilbert transform of .
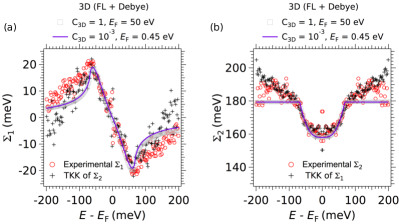
Fits to the experimental self-energy using 2D models for the Fermi liquid and the Debye electron-phonon coupling where presented in the main text. Figure 7 shows fits with 3D models of a Fermi-liquid Debye self-energy for the outer subband (right branch, as in the main text) of the 2DES in ZnO. It is clear that the 2D model used in the main text provides a much better fit. Moreover, the use of a 3D Fermi liquid model yields “reasonable” (albeit still poor) fits of the experimental data only for unphysical values of the model parameters, such as a vanishingly small constant (for metallic systems, it should be close to 1 Book-ElectronLiquids2005 ) or an exceedingly large eV.
Experimental self-energy for the left branch of the outer subband
| 0.066 | 0.099 | 0.070 | 0.070 | |
| 0.084 | 0.10 | 0.088 | 0.083 | |
| 0.33 | 0.276 | 0.34 | 0.34 | |
| 0. 27 | 0.25 | 0.28 | 0.27 |
Fig. 8 shows the experimental dispersion and complex self-energy extracted from the left branch of the outer subband of the 2DES in ZnO, together with fits using the 2D and 3D Debye models. Table 1 present a summary of the fitting parameters for (index ) and (index ) obtained from those two models for both the left (L) and right (R) branches of the outer subband of the 2DES in ZnO.
A comparison of Figs. 6 and 8, and an inspection of the parameters listed in table1, shows that the results are consistent with each other, except for a sensitively larger Debye frequency, and smaller coupling constant, extracted from the fit to in the left branch of the outer subband ( column). From all the other fits, the mean value of is eV, or cm-1 in spectroscopy units, while the average of is eV or cm-1. The mean value for compares very well to the and LO modes identified in previous measurements of phonon modes in ZnOphonon_mode . However, The mean value for does not correspond to any previously reported phonon energy in this material. Thus, all in all, the 2D Fermi-liquid Debye model appears as a better description of our ARPES data on ZnO, coherent with previous results from other experimental probes.
2DES at the Zn-terminated ZnO surface
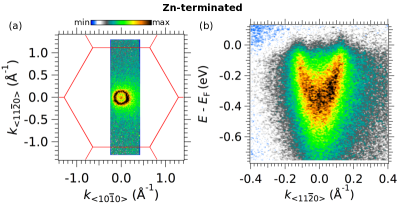
Fig. 9(a) shows the in-plane Fermi surface map measured by ARPES at the Zn-terminated plane of the Al(2 Å)/ZnO interface. Similar to the O-terminated plane, this surface also shows two states forming in-plane circular Fermi sheets around . However, their Fermi momenta are smaller than those obtained at the O-terminated surface. Accordingly, as shown by the the energy-momentum dispersion map in Fig. 9(b), the corresponding subbands disperse down to smaller (in absolute value) energies. In particular, the bottom of the inner subband is very close to .
References
- (1) Claus F. Klingshirn, Bruno K. Meyer, Andreas Waag, Axel Hoffmann, and Jean Geurts, Zinc Oxide: From Fundamental Properties Towards Novel Applications, Springer Series in Materials Science 120, Springer-Verlag (2010).
- (2) H. Morkoa̧nd Ü. Özgür, Zinc Oxide: Fundamentals, Materials and Device Technology, Wiley-VCH Verlag GmbH & Co. KGaA, Weinheim, Germany (2009). DOI: 10.1002/9783527623945.
- (3) M Lorenz et al., The 2016 oxide electronic materials and oxide interfaces roadmap, Journal of Physics D: Applied Physics 49, 433001 (2016).
- (4) X. Y. Liu, C. X. Shan, H. Zhu, B. H. Li, M. M. Jiang, S. F. Yu, and D. Z. Shen, Ultraviolet Lasers Realized via Electrostatic Doping Method, Sci. Rep. 5, 13641 (2015).
- (5) A. Bakin, A. El-Shaer, A. C. Mofor, M. Al-Suleiman, E. Schlenker, and A. Waag, ZnMgO-ZnO quantum wells embedded in ZnO nanopillars: Towards realization of nano-LEDS, Phys. Status Solidi (c) 4, 158-161 (2007).
- (6) Ü. Özgur, Ya. I. Alivov, C. Liu, A. Teke, M. A. Reshchikov, S. Doan, V. Avrutin, S.-J. Cho, and H. Morko,̧ A comprehensive review of ZnO materials and devices, J. Appl. Phys. 98, 041301 (2005).
- (7) Y. Tokura, Orbital Physics in Transition-Metal Oxides, Science 288, 462 (2000).
- (8) E. Dagotto, Complexity in strongly correlated electronic systems, Science, 309, 257 (2005).
- (9) A. Tsukazaki, A. Ohtomo, T. Kita, Y. Ohno, H. Ohno, and M. Kawasaki, Quantum Hall Effect in Polar Oxide Heterostructures, Science 315, 1388 (2007).
- (10) A. Tsukazaki, S. Akasaka, K. Nakahara, Y. Ohno, H. Ohno, D. Maryenko, A. Ohtomo, and M. Kawasaki, Observation of the fractional quantum Hall effect in an oxide, Nat. Mater. 9, 889 (2010).
- (11) A. Ohtomo and H.Y. Hwang, A high-mobility electron gas at the LaAlO3/SrTiO3heterointerface, Nature (London) 427, 423 (2004).
- (12) S. Thiel, G. Hammerl, A. Schmehl, C.W. Schneider, and J. Mannhart, Tunable Quasi-Two-Dimensional Electron Gases in Oxide Heterostructures, Science 313, 1942 (2006).
- (13) N. Reyren, S. Thiel, A.D. Caviglia, L. Fitting Kourkoutis, G. Hammerl, C. Richter, C.W. Schneider, T. Kopp, A.-S. Rüetschi, D. Jaccard, M. Gabay, D.A. Muller, J.-M. Triscone, and J. Mannhart, Superconducting interfaces between insulating oxides, Science 317, 1196 (2007).
- (14) K. Ueno, S. Nakamura, H. Shimotani, A. Ohtomo, N. Kimura, T. Nojima, H. Aoki, Y. Iwasa, and M. Kawasaki, Electric-field-induced superconductivity in an insulator, Nature Mater. 7, 855 (2008).
- (15) A. Brinkman, M. Huijben, M. van Zalk, J. Huijben, U. Zeitler, J.C. Maan, W.G. van der Wiel, G. Rijnders, D.H.A. Blank, and H. Hilgenkamp, Nature Mater. 6, 493 (2007).
- (16) A.D. Caviglia, S. Gariglio, N. Reyren, D. Jaccard, T. Schneider, M. Gabay, S. Thiel, G. Hammerl, J. Mannhart, and J.-M. Triscone, Nature (London) 456, 624 (2008).
- (17) A.D. Caviglia, M. Gabay, S. Gariglio, N. Reyren, C. Cancellieri, and J.M. Triscone, Tunable Rashba spin-orbit interaction at oxide interfaces, Phys. Rev. Lett. 104, 126803 (2010).
- (18) A. Joshua, J. Ruhman, S. Pecker, E. Altman, and S. Ilani, Gate-tunable polarized phase of two- dimensional electrons at the LaAlO3/SrTiO3 interface, Proc. Natl. Acad. Sci. 110, 9633 (2013).
- (19) Y.Z. Chen, N. Bovet, F. Trier, D.V. Christensen, F.M. Qu, N.H. Andersen, T. Kasama,W. Zhang, R. Giraud, J. Dufouleur, T.S. Jespersen, J.R. Sun, A. Smith, J. Nygård, L. Lu, B. Büchner, B.G. Shen, S. Linderoth, and N. Pryds, A high-mobility two-dimensional electron gas at the spinel/perovskite interface of -Al2O3/SrTiO3, Nat. Commun. 4, 1371 (2013).
- (20) Y. Z. Chen, F. Trier1-, T.Wijnands, R. J. Green, N. Gauquelin, R. Egoavil, D. V. Christensen, G. Koster, M. Huijben, N. Bovet, S. Macke, F. He, R. Sutarto, N. H. Andersen, J. A. Sulpizio, M. Honig, G. E. D. K. Prawiroatmodjo, T. S. Jespersen, S. Linderoth, S. Ilani, J. Verbeeck, G. Van Tendeloo, G. Rijnders, G. A. Sawatzky, and N. Pryds, Extreme mobility enhancement of two-dimensional electron gases at oxide interfaces by charge-transfer-induced modulation doping, Nat. Mater. 14, 801 (2015).
- (21) T. D. Ngo, J.-W. Chang, K. Lee, S. Han, J. S. Lee, Y. H. Kim, M.-H. Jung, Y.-J. Doh, M.-S. Choi, J. Song, and J. Kim, Polarity-tunable magnetic tunnel junctions based on ferromagnetism at oxide heterointerfaces, Nat. Commun. 6, 8035 (2015).
- (22) D. Stornaiuolo, C. Cantoni, G. M. De Luca, R. Di Capua, E. Di. Gennaro, G. Ghiringhelli, B. Jouault, D. Marrè, D. Massarotti, F. Miletto Granozio, I. Pallecchi, C. Piamonteze, S. Rusponi, F. Tafuri, and M. Salluzzo, Tunable spin polarization and superconductivity in engineered oxide interfaces, Nat. Mater. 15, 278 (2016).
- (23) A. F. Santander-Syro, O. Copie, T. Kondo, F. Fortuna, S. Pailhès, R. Weht, X. G. Qiu, F. Bertran, A. Nicolaou, A. Taleb-Ibrahimi, P. Le Fèvre, G. Herranz, M. Bibes, N. Reyren, Y. Apertet, P. Lecoeur, A. Barthélémy and M. J. Rozenberg, Two-dimensional electron gas with universal subbands at the surface of SrTiO3, Nature 469, 189 (2011).
- (24) W. Meevasana, P. D. C. King, R. H. He, S-K. Mo, M. Hashimoto, A. Tamai, P. Songsiriritthigul, F. Baumberger and Z-X. Shen, Creation and control of a two-dimensional electron liquid at the bare SrTiO3 surface, Nature Mater. 10, 114 (2011).
- (25) A. F. Santander-Syro, C. Bareille, F. Fortuna, O. Copie, M. Gabay, F. Bertran, A. Taleb-Ibrahimi, P. Le Fèvre, G. Herranz, N. Reyren, M. Bibes, A. Barthélémy, P. Lecoeur, J. Guevara, and M. J. Rozenberg, Orbital symmetry reconstruction and strong mass renormalization in the two-dimensional electron gas at the surface of KTaO3, Phys. Rev. B 86, 121107(R) (2012).
- (26) P. D. C. King, R. H. He, T. Eknapakul, P. Buaphet, S.-K. Mo, Y. Kaneko, S. Harashima, Y. Hikita, M. S. Bahramy, C. Bell, Z. Hussain, Y. Tokura, Z.-X. Shen, H. Y. Hwang, F. Baumberger, and W. Meevasana, Subband structure of a two-dimensional electron gas formed at the polar surface of the strong spin-orbit perovskite KTaO3, Phys. Rev. Lett. 108, 117602 (2012).
- (27) C. Bareille, F. Fortuna, T.C. Rödel, F. Bertran, M. Gabay, O. Hijano Cubelos, A. Taleb-Ibrahimi, P. Le Fèvre, M. Bibes, A. Barthélémy, T. Maroutian, P. Lecoeur, M.J. Rozenberg, A.F. Santander-Syro, Two-dimensional electron gas with six-fold symmetry at the surface of KTaO3, Sci. Rep. 4, 3586 (2014).
- (28) T. C. Rödel, C. Bareille, F. Fortuna, C. Baumier, F. Bertran, P. Le Fèvre, M. Gabay, O. Hijano Cubelos, M. J. Rozenberg, T. Maroutian, P. Lecoeur, and A. F. Santander-Syro, Orientational tuning of the Fermi sea of confined electrons at the SrTiO3(110) and (111) surfaces, Phys. Rev. Applied 1, 051002 (2014).
- (29) S. McKeown Walker, A. de la Torre, F. Y. Bruno, A. Tamai, T. K. Kim, M. Hoesch, M. Shi, M. S. Bahramy, P. D. C. King, and F. Baumberger, Control of a two-dimensional electron gas on SrTiO3(111) by atomic oxygen, Phys. Rev. Lett. 113, 177601 (2014).
- (30) T. C. Rödel, F. Fortuna, F. Bertran, M. Gabay, M. J. Rozenberg, A. F. Santander-Syro, and P. Le Fèvre, Engineering of two dimensional electron gases at the (001) and (101) surfaces of TiO2 anatase using light, Phys. Rev. B 92, 041106(R) (2015).
- (31) T. C. Rödel, F. Fortuna, S. Sengupta, E. Frantzeskakis, P. Le Fèvre, F. Bertran, B. Mercey, S. Matzen, G. Agnus, T. Maroutian, P. Lecoeur, and A. F. Santander-Syro, Universal Fabrication of 2D Electron Systems in Functional Oxides, Adv. Mater. 28, 1976-1980 (2016).
- (32) T. C. Rödel, M. Vivek, F. Fortuna, P. Le Fèvre, F. Bertran, R. Weht, J. Goniakowski, M. Gabay, and A. F. Santander-Syro, Two-dimensional electron systems in ATiO3 perovskites (ACa, Ba, Sr): Control of orbital hybridization and energy order, Phys. Rev. B 96, 041121(R) (2017).
- (33) E. Frantzeskakis, T. C. R del, F. Fortuna, and A. F. Santander-Syro. 2D surprises at the surface of 3D materials: Confined electron systems in transition metal oxides. J. Electron Spectrosc. Relat. Phenom. 219, 16 (2017).
- (34) T. Taniuchi, Y. Motoyui, K. Morozumi, T. C. Rödel, F. Fortuna, A. F. Santander-Syro, and S. Shin, Imaging of room-temperature ferromagnetic nano-domains at the surface of a non-magnetic oxide, Nat. Commun. 7, 11781 (2016).
- (35) R. A. Powell, W. E. Spicer, and J. C. McMenamin, Photoemission Studies of Wurtzite Zinc Oxide, Phys. Rev. B 6, 3056 (1972).
- (36) W. Göpel, J. Pollmann, I. Ivanov and B. Reihl, Angle-resolved photoemission from polar and non-polar zinc oxide surfaces, Phys. Rev. B 26, 3144 (1982).
- (37) K. Ozawa, K. Sawada, Y. Shirotori, and K. Edamoto, Angle-resolved photoemission study of the valence band structure of ZnO, J. Phys.: Condens. Matter 17, 1271-1278 (2005).
- (38) K. Ozawa, Y. Oba, K. Edamoto, M. Higashiguchi, Y. Miura, K. Tanaka, K. Shimada, H. Namatame, and M. Taniguchi, Valence-band structure of the polar ZnO surfaces studied by angle-resolved photoelectron spectroscopy, Phys. Rev. B 70, 075314 (2009).
- (39) K. Ozawa and K. Mase, Metallization of ZnO by adsorption of hydrogen, methanol, and water: Angle-resolved photoelectron spectroscopy, Phys. Rev. B 81, 205322 (2010).
- (40) L. F. J. Piper, A. R. H. Preston, A. Fedorov, S. W. Cho, A. DeMasi, and K. E. Smith, Direct evidence of metallicity at ZnO surfaces from angle-resolved photoemission spectroscopy, Phys. Rev. B 81, 233305 (2010).
- (41) J.-C. Deinert, O. T. Hofmann, M. Meyer, P. Rinke, and J. Stähler, Local aspects of hydrogen-induced metallization of the ZnO surface, Phys. Rev. B 91, 235313 (2015).
- (42) S. Moser, L. Moreschini, J. Jaćimović, O. S. Barišić, H. Berger, A. Magrez, Y. J. Chang, K. S. Kim, A. Bostwick, E. Rotenberg, L. Forró and M. Grioni, Tunable polaronic conduction in Anatase TiO2, Phys. Rev. Lett. 110, 196403 (2013).
- (43) Z. Wang, S. McKeown Walker, A. Tamai, Y. Wang, Z. Ristic, F. Y. Bruno, A. de la Torre, S. Ricco, N. C. Plumb, M. Shi, P. Hlawenka, J. Sanchez-Barriga, A. Varykhalov, T. K. Kim, M. Hoesch, P. D. C. King, W. Meevasana, U. Diebold, J. Mesot, B. Moritz, T. P. Devereaux, M. Radovic, and F. Baumberger, Tailoring the nature and strength of electron-phonon interactions in the SrTiO(001) 2D electron liquid, Nature. Mater. 15, 835 (2016).
- (44) R. Yukawa, K. Ozawa, S. Yamamoto, H. Iwasawa, K. Shimada, E. F. Schwier, K. Yoshimatsu, H. Kumigashira, H. Namatame, M. Taniguchi, and I. Matsuda, Phonon-dressed two-dimensional carriers on the ZnO surface, Phys. Rev. B 94, 165313 (2016).
- (45) C. Verdi, F, Caruso, and F. Giustino, Origin of the crossover from polarons to Fermi liquids in transition metal oxides, Nat. Commun. 8, 15769 (2017).
- (46) S. McKeown Walker, F. Y. Bruno, Z. Wang, A. de la Torre, S. Riccó, A. Tamai, T. K. Kim, M. Hoesch, M. Shi, M. S. Bahramy, P. D. C. King, and F. Baumberger, Carrier-density control of the SrTiO3 surface 2D electron gas studied by ARPES, Adv. Mater. 27, 3894 (2015).
- (47) S. Tanaka, K. Mase, and S. Nagaoka. Photostimulated ion desorption from the TiO2 (110) and ZnO surfaces. Surf. Sci., 572, 43 (2004).
- (48) S. Backes, T. C. Rödel, F. Fortuna, E. Frantzeskakis, P. Le F vre, F. Bertran, M. Kobayashi, R. Yukawa, T. Mitsuhashi, M. Kitamura, K. Horiba, H. Kumigashira, R. Saint-Martin, A. Fouchet, B. Berini, Y. Dumont, A. J. Kim, F. Lechermann, H. O. Jeschke, M. J. Rozenberg, R. Valent , and A. F. Santander-Syro, Hubbard band versus oxygen vacancy states in the correlated electron metal SrVO3, Phys. Rev. B 94, 241110(R) (2016).
- (49) A. Janotti and C. G. Van de Walle, Oxygen vacancies in ZnO, Appl. Phys. Lett. 87, 122102 (2005).
- (50) A. Janotti and C. G. Van de Walle, Hydrogen multicentre bonds, Nat. Mater. 6, 44 (2007).
- (51) A. Janotti and C. G. Van de Walle, Fundamentals of zinc oxide as a semiconductor, Rep. Prog. Phys. 72, 126501 (2009).
- (52) S. Lany and A. Zunger, Many-body GW calculation of the oxygen vacancy in ZnO, Phys. Rev. B 81, 113201 (2010).
- (53) Y.-S. Kim and C. H. Park, Rich variety of defects in ZnO via an attractive interaction between O vacancies and Zn interstitials: Origin of -type doping. Phys. Rev. Lett., 102, 086403 (2009).
- (54) S. Hüfner, Photoelectron Spectroscopy: Principles and Applications, Springer (Berlin), Third Edition (2003).
- (55) G. F. Giuliani abd G. Vignale, Quantum Theory of the Electron Liquid, Cambridge University Press (2005).
- (56) V. N. Kostur and B. Mitrović, Electron-phonon interaction in two dimensions: variations of with increasing , Phys. Rev. B 48, 16388 (1993).
- (57) S. Engelsberg and J. Schrieffer, Coupled Electron-Phonon System, Phys. Rev. 131, 993 (1963).
- (58) F. Giustino, Electron-phonon interactions from first principles, arXiv:1603.06965v1 (2016).
- (59) W. Meevasana, X. J. Zhou, B. Moritz, C.-C. Chen, R. H. He, S.-I. Fujimori, D. H. Lu, S.-K. Mo, R. G. Moore, F. Baumberger, T. P. Devereaux, D. van der Marel, N. Nagaosa, J. Zaanen, and Z.-X. Shen, Strong energy-momentum dispersion of phonon-dressed carriers in the lightly doped band insulator SrTiO3, New J. Phys. 12, 023004 (2010).
- (60) P. D. C. King, S. McKeown Walker, A. Tamai, A. de la Torre, T. Eknapakul, P. Buaphet, S.-K. Mo, W. Meevasana, M. S. Bahramy, and F. Baumberger, Quasiparticle dynamics and spin-orbital texture of the SrTiO3 two-dimensional electron gas, Nat. Commun. 5, 3414 (2014).
- (61) C. N. Veenstra, G. L. Goodvin, M. Berciu, and A. Damascelli, Elusive electron-phonon coupling in quantitative analyses of the spectral function, Phys. Rev. B 82, 012504 (2010).
- (62) A. N. Mariano and R. E. Hanneman. Crystallographic Polarity of ZnO Crystals. J. Appl. Phys. 34, 384-388 (1963).
- (63) O. Dulub, L. A. Boatner, and U. Diebold. STM study of the geometric and electronic structure of ZnO-Zn, -O, , and surfaces. Surf. Sci. 519, 201-217 (2002).
- (64) Herbert Fröhlich, Theory of the superconducting state. I. The ground state at the absolute zero of temperature, Phys. Rev. 79, 845 (1950).
- (65) P.M. Echenique, R. Berndt, E.V. Chulkov, Th. Fauster, A. Goldmann, and U. Höfer, Decay of electronic excitations at metal surfaces, Surface Science Reports 52, 219 (2004).
- (66) Ph. Hofmann, I. Yu. Sklyadneva, E.D.L. Rienks, and E. V. Chulkov, Electron-phonon coupling at surfaces and interfaces, New Journal of Physics 11, 125005 (2009).
- (67) N. Ashkenov et al., Infrared dielectric functions and phonon modes of high-quality ZnO films, Journal of Applied Physics 93, 126 (2003).