Identification and tunable optical coherent control of transition-metal spins in silicon carbide
Abstract
Color centers in wide-bandgap semiconductors are attractive systems for quantum technologies since they can combine long-coherent electronic spin and bright optical properties. Several suitable centers have been identified, most famously the nitrogen-vacancy defect in diamond. However, integration in communication technology is hindered by the fact that their optical transitions lie outside telecom wavelength bands. Several transition-metal impurities in silicon carbide do emit at and near telecom wavelengths, but knowledge about their spin and optical properties is incomplete. We present all-optical identification and coherent control of molybdenum-impurity spins in silicon carbide with transitions at near-infrared wavelengths. Our results identify spin for both the electronic ground and excited state, with highly anisotropic spin properties that we apply for implementing optical control of ground-state spin coherence. Our results show optical lifetimes of 60 ns and inhomogeneous spin dephasing times of 0.3 s, establishing relevance for quantum spin-photon interfacing.
Electronic spins of lattice defects in wide-bandgap semiconductors have come forward as an important platform for quantum technologiesGao et al. (2015), in particular for applications that require both manipulation of long-coherent spin and spin-photon interfacing via bright optical transitions. In recent years this field showed strong development, with demonstrations of distribution and storage of non-local entanglement in networks for quantum communicationTogan et al. (2010); Dolde et al. (2014); Klimov et al. (2015); Hensen et al. (2015); Kalb et al. (2017), and quantum-enhanced field-sensingBudker & Romalis (2007); Balasubramanian et al. (2008); Dolde et al. (2011); Kraus et al. (2014a); Bonato et al. (2016). The nitrogen-vacancy defect in diamond is the material system that is most widely usedDobrovitski et al. (2013); Childress & Hanson (2013) and best characterizedDoherty et al. (2011); Maze et al. (2011); Thiering & Gali (2017) for these applications. However, its zero-phonon-line (ZPL) transition wavelength (637 nm) is not optimal for integration in standard telecom technology, which uses near-infrared wavelength bands where losses in optical fibers are minimal. A workaround could be to convert photon energies between the emitter-resonance and telecom valuesRadnaev et al. (2010); Zaske et al. (2012); Dréau et al. (2018), but optimizing these processes is very challenging.
This situation has been driving a search for similar lattice defects that do combine favorable spin properties with bright emission directly at telecom wavelength. It was shown that both diamond and silicon carbide (SiC) can host many other spin-active color centers that could have suitable propertiesWeber et al. (2010, 2011); Von Bardeleben et al. (2016); Zargaleh et al. (2016) (where SiC is also an attractive material for its established position in the semiconductor device industryFriedrichs et al. (2010); Song et al. (2011)). However, for many of these color centers detailed knowledge about the spin and optical properties is lacking. In SiC the divacancyKoehl et al. (2011); Christle et al. (2015); Zwier et al. (2015) and silicon vacancyRiedel et al. (2012); Kraus et al. (2014a, b); Widmann et al. (2015) were recently explored, and these indeed show millisecond homogeneous spin coherence times with bright ZPL transitions closer to the telecom band.
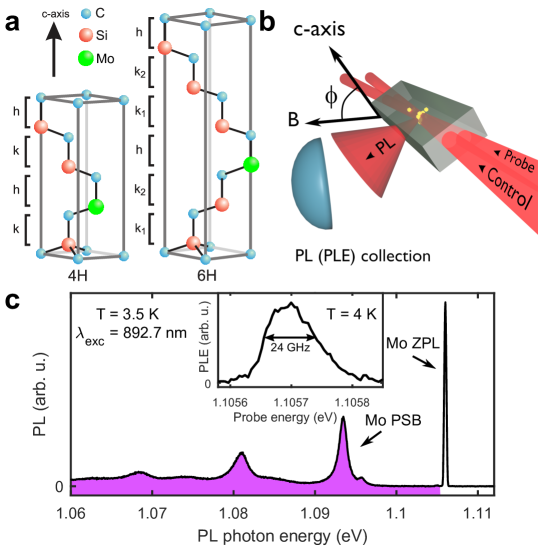
We present here a study of transition-metal impurity defects in SiC, which exist in great varietyHobgood et al. (1995); Baur et al. (1997); Magnusson & Janzén (2005); Ivády et al. (2011); Son et al. (2012); Koehl et al. (2017). There is at least one case (the vanadium impurity) that has ZPL transitions at telecom wavelengthsBaur et al. (1997), around 1300 nm, but we focus here (directed by availability of lasers in our lab) on the molybdenum impurity with ZPL transitions at 1076 nm (in 4H-SiC) and 1121 nm (in 6H-SiC), which turns out to be a highly analogous system. Theoretical investigationsCsóré et al. (2016), early electron paramagnetic resonanceDombrowski et al. (1996); Baur et al. (1997) (EPR), and photoluminescence (PL) studiesKimoto et al. (1996); Gällström et al. (2009); Gällström (2015) indicate that these transition-metal impurities have promising properties. These studies show that they are deep-level defects that can be in several stable charge states, each with a distinctive value for its electronic spin and near-infrared optical transitions. Further tuning and engineering possibilities come from the fact that these impurities can be embedded in a variety of SiC polytypes (4H, 6H, etc., see Fig. 1a). Recent work by Koehl et al.Koehl et al. (2017) studied chromium impurities in 4H-SiC using optically detected magnetic resonance. They identified efficient ZPL (little phonon-sideband) emission at 1042 nm and 1070 nm, and their charge state as neutral with an electronic spin for the ground state.
Our work is an all-optical study of ensembles of molybdenum impurities in p-type 4H-SiC and 6H-SiC material. The charge and spin configuration of these impurities, and the defect configuration in the SiC lattice that is energetically favored, was until our work not yet identified with certainty. Our results show that these Mo impurities are in the () charge state (we follow here conventional notationBaur et al. (1997): the label indicates that of an original Mo atom 4 electrons participate in bonds with SiC and that 1 electron is transferred to the p-type lattice environment). The single remaining electron in the 4d shell gives spin for the ground state and optically excited state that we address. While we will show later that this can be concluded from our measurements, we assume it as a fact from the beginning since this simplifies the explanation of our experimental approach.
In addition to this identification of the impurity properties, we explore whether ground-state spin coherence is compatible with optical control. Using a two-laser magneto-spectroscopy methodManson & Wei (1994); Santori et al. (2006); Zwier et al. (2015), we identify the spin Hamiltonian of the ground state and optically excited state, which behave as doublets with highly anisotropic Landé g-factors. This gives insight in how a situation with only spin-conserving transitions can be broken, and we find that we can use a weak magnetic field to enable optical transitions from both ground-state spin levels to a common excited-state level ( level scheme). Upon two-laser driving of such schemes, we observe coherent population trapping (CPT, all-optical control of ground-state spin coherence and fundamental to operating quantum memoriesFleischhauer et al. (2005); Kimble (2008)). The observed CPT reflects inhomogeneous spin dephasing times comparable to that of the SiC divacancyZwier et al. (2015); Zwier (2016) (near 1 s).
In what follows, we first present our methods and results of single-laser spectroscopy performed on ensembles of Mo impurities in both SiC polytypes. Next, we discuss a two-laser method where optical spin pumping is detected. This allows for characterizing the spin sublevels in the ground and excited state, and we demonstrate how this can be extended to controlling spin coherence.
I Materials and experimental methods
Both the 6H-SiC and 4H-SiC (Fig. 1a) samples were intentionally doped with Mo. There was no further intentional doping, but near-band-gap photoluminescence revealed that both materials had p-type characteristics. The Mo concentrations in the 4H and 6H samples were estimatedGällström et al. (2009); Gällström (2015) to be in the range - and - , respectively. The samples were cooled in a liquid-helium flow cryostat with optical access, which was equipped with a superconducting magnet system. The setup geometry is depicted in Fig. 1b. The angle between the direction of the magnetic field and the c-axis of the crystal could be varied, while both of these directions were kept orthogonal to the propagation direction of excitation laser beams. In all experiments where we resonantly addressed ZPL transitions the laser fields had linear polarization, and we always kept the direction of the linear polarization parallel to the c-axis. Earlier studiesGällström et al. (2009); Gällström (2015); Csóré et al. (2016) of these materials showed that the ZPL transition dipoles are parallel to the c-axis. For our experiments we confirmed that the photoluminescence response was clearly the strongest for excitation with linear polarization parallel to the c-axis, for all directions and magnitudes of the magnetic fields that we applied. All results presented in this work come from photoluminescence (PL) or photoluminescence-excitation (PLE) measurements. The excitation lasers were focused to a 100 m spot in the sample. PL emission was measured from the side. A more complete description of experimental aspects is presented in the Methods section.
II Single-laser characterization
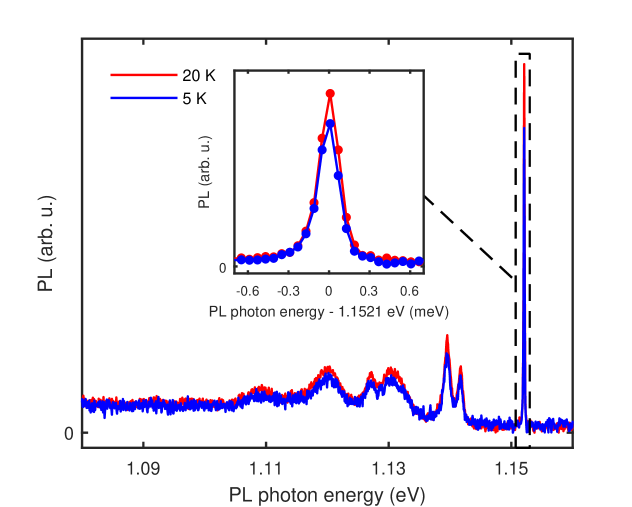
For initial characterization of Mo transitions in 6H-SiC and 4H-SiC we used PL and PLE spectroscopy (see Methods). Figure 1c shows the PL emission spectrum of the 6H-SiC sample at 3.5 K, measured using an 892.7 nm laser for excitation. The ZPL transition of the Mo defect visible in this spectrum will be studied in detail throughout this work. The shaded region indicates the emission of phonon replicas related to this ZPLGällström et al. (2009); Gällström (2015). While we could not perform a detailed analysis, the peak area of the ZPL in comparison with that of the phonon replicas indicates that the ZPL carries clearly more than a few percent of the full PL emission. Similar PL data from Mo in the 4H-SiC sample, together with a study of the temperature dependence of the PL, can be found in the Supplementary Information (Fig. S1).
For a more detailed study of the ZPL of the Mo defects, PLE was used. In PLE measurements, the photon energy of a narrow-linewidth excitation laser is scanned across the ZPL part of the spectrum, while resulting PL of phonon-sideband (phonon-replica) emission is detected (Fig. 1b, we used filters to keep light from the excitation laser from reaching the detector, see Methods). The inset of Fig. 1c shows the resulting ZPL for Mo in 6H-SiC at 1.1057 eV (1121.3 nm). For 4H-SiC we measured the ZPL at 1.1521 eV (1076.2 nm, see Supplementary Information). Both are in close agreement with literatureGällström et al. (2009); Gällström (2015). Temperature dependence of the PLE from the Mo defects in both 4H-SiC and 6H-SiC can be found in the Supplementary Information (Fig. S2).
The width of the ZPL is governed by the inhomogeneous broadening of the electronic transition throughout the ensemble of Mo impurities, which is typically caused by nonuniform strain in the crystal. For Mo in 6H-SiC we observe a broadening of GHz FWHM, and GHz for 4H-SiC. This inhomogeneous broadening is larger than the anticipated electronic spin splittingsBaur et al. (1997), and it thus masks signatures of spin levels in optical transitions between the ground and excited state.
III Two-laser characterization
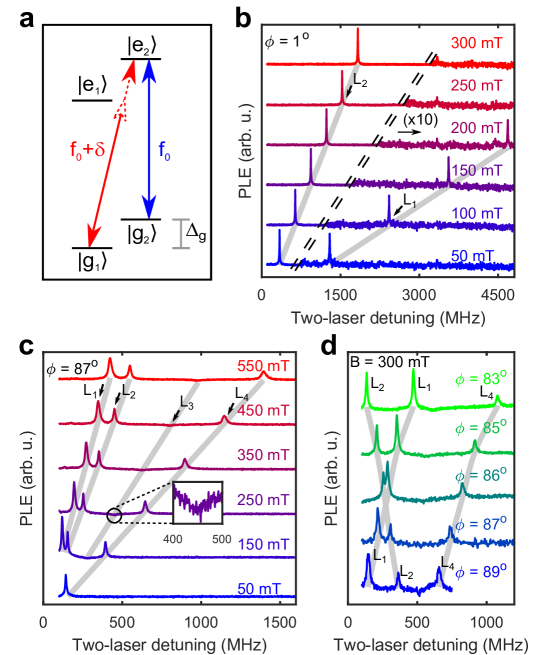
In order to characterize the spin-related fine structure of the Mo defects, a two-laser spectroscopy technique was employedSantori et al. (2006); Manson & Wei (1994); Zwier et al. (2015). We introduce this for the four-level system sketched in Fig. 2a. A laser fixed at frequency is resonant with one possible transition from ground to excited state (for the example in Fig. 2a to ), and causes PL from a sequence of excitation and emission events. However, if the system decays from the state to , the laser field at frequency is no longer resonantly driving optical excitations (the system goes dark due to optical pumping). In this situation, the PL is limited by the (typically long) lifetime of the state. Addressing the system with a second laser field, in frequency detuned from the first by an amount , counteracts optical pumping into off-resonant energy levels if the detuning equals the splitting between the ground-state sublevels. Thus, for specific two-laser detuning values corresponding to the energy spacings between ground-state and excited-state sublevels the PL response of the ensemble is greatly increased. Notably, this technique gives a clear signal for sublevel splittings that are smaller than the inhomogeneous broadening of the optical transition, and the spectral features now reflect the homogeneous linewidth of optical transitionsZwier et al. (2015); Zwier (2016).
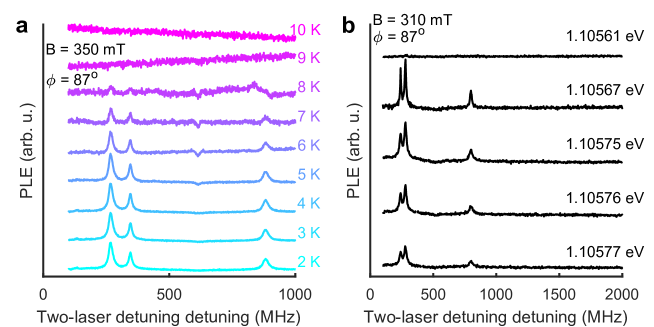
In our measurements a 200 W continuous-wave control and probe laser were made to overlap in the sample. For investigating Mo in 6H-SiC the control beam was tuned to the ZPL at 1121.32 nm (, the probe beam was detuned from by a variable detuning (i.e. ). In addition, a pulsed 770 nm re-pump laser was focused onto the defects to counteract bleaching of the Mo impurities due to charge-state switchingBeha et al. (2012); Zwier et al. (2015); Wolfowicz et al. (2017) (which we observed to only occur partially without re-pump laser). All three lasers were parallel to within inside the sample. A magnetic field was applied to ensure that the spin sublevels were at non-degenerate energies. Finally, we observed that the spectral signatures due to spin disappear in a broad background signal above a temperature of 10 K (Fig. S4), and we thus performed measurements at 4 K (unless stated otherwise).
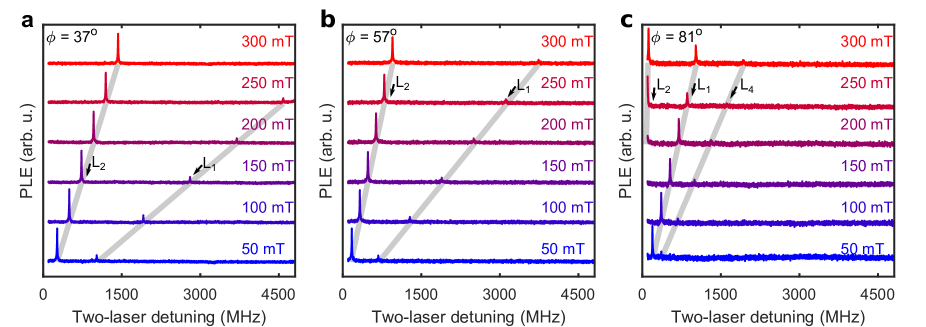
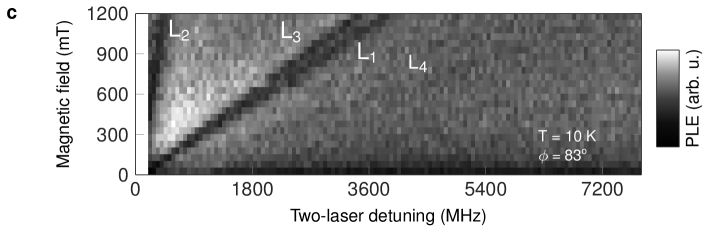
Figure 2b shows the dependence of the PLE on the two-laser detuning for the 6H-SiC sample (4H-SiC data in Supplementary Information Fig. S6), for a range of magnitudes of the magnetic field (here aligned close to parallel with the c-axis, ). Two emission peaks can be distinguished, labeled line and . The emission (peak height) of is much stronger than that of . Figure 2c shows the results of a similar measurement with the magnetic field nearly orthogonal to the crystal c-axis (), where four spin-related emission signatures are visible, labeled as lines through (a very small peak feature left from , at half its detuning, is an artifact that occurs due to a leakage effect in the spectral filtering that is used for beam preparation, see Methods). The two-laser detuning frequencies corresponding to all four lines emerge from the origin (, ) and evolve linearly with magnetic field (we checked this up to 1.2 T). The slopes of all four lines (in Hertz per Tesla) are smaller in Fig. 2c than in Fig 2b. In contrast to lines , and , which are peaks in the PLE spectrum, shows a dip.
In order to identify the lines at various angles between the magnetic field and the c-axis, we follow how each line evolves with increasing angle. Figure 2d shows that as increases, , , and move to the left, whereas moves to the right. Near , and cross. At this angle, the left-to-right order of the emission lines is swapped, justifying the assignment of , , and as in Fig. 2b,c. The Supplementary Information presents further results from two-laser magneto-spectroscopy at intermediate angles (section 2a).
IV Analysis
We show below that the results in Fig. 2 indicate that the Mo impurities have electronic spin for the ground and excited state. This contradicts predictions and interpretations of initial resultsBaur et al. (1997); Gällström et al. (2009); Gällström (2015); Csóré et al. (2016). Theoretically, it was predicted that the defect associated with the ZPL under study here is a Mo impurity in the asymmetric split-vacancy configuration (Mo impurity asymmetrically located inside a Si-C divacancy), where it would have a spin ground state with zero-field splittings of about 3 to 6 GHzBaur et al. (1997); Gällström et al. (2009); Gällström (2015); Csóré et al. (2016). However, this would lead to the observation of additional emission lines in our measurements. Particularly, in the presence of a zero-field splitting, we would expect to observe two-laser spectroscopy lines emerging from a nonzero detuningZwier et al. (2015). We have measured near zero fields and up to 1.2 T, as well as from 100 MHz to 21 GHz detuning (Supplementary Information section 2c), but found no more peaks than the four present in Fig. 2c. A larger splitting would have been visible as a splitting of the ZPL in measurements as presented in the inset of Fig. 1c, which was not observed in scans up to 1000 GHz. Additionally, a zero-field splitting and corresponding avoided crossings at certain magnetic fields would result in curved behavior for the positions of lines in magneto-spectroscopy. Thus, our observations rule out that there is a zero-field splitting for the ground-state and excited-state spin sublevels. In this case the effective spin-HamiltonianAbragam & Bleaney (1970) can only take the form of a Zeeman term
| (1) |
where is the g-factor for the electronic ground (excited) state (both assumed positive), the Bohr magneton, the magnetic field vector of an externally applied field, and the effective spin vector. The observation of four emission lines can be explained, in the simplest manner, by a system with spin (doublet) in both the ground and excited state.
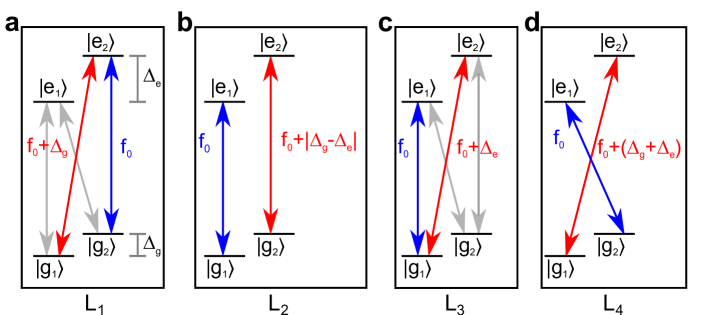
For such a system, Fig. 3 presents the two-laser optical pumping schemes that correspond to the observed emission lines through . Addressing the system with the V-scheme excitation pathways from Fig. 3c leads to increased pumping into a dark ground-state sublevel, since two excited states contribute to decay into the off-resonant ground-state energy level while optical excitation out of the other ground-state level is enhanced. This results in reduced emission observed as the PLE dip feature of in Fig. 2c (for details see Supplementary Information section 5).
We find that for data as in Fig. 2c the slopes of the emission lines are correlated by a set of sum rules
| (2) | ||||
| (3) |
Here denotes the slope of emission line in Hertz per Tesla. The two-laser detuning frequencies for the pumping schemes in Fig. 3a-d are related in the same way, which justifies the assignment of these four schemes to the emission lines through , respectively. These schemes and equations directly yield the g-factor values and for the ground and excited state (Supplementary Information section 2).
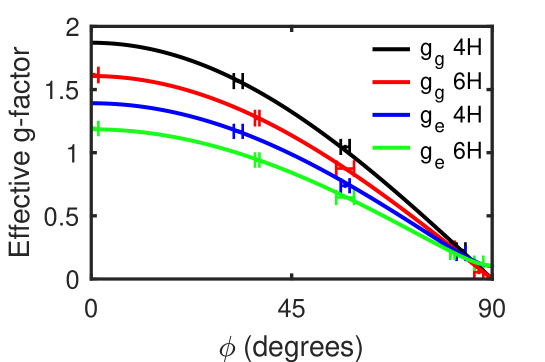
We find that the g-factor values and strongly depend on , that is, they are highly anisotropic. While this is in accordance with earlier observations for transition metal defects in SiCBaur et al. (1997), we did not find a comprehensive report on the underlying physical picture. In Supplementary Information section 7 we present a group-theoretical analysis that explains the anisotropy for and for , and similar behavior for (which we also use to identify the orbital character of the ground and excited state). In this scenario the effective Landé g-factorAbragam & Bleaney (1970) is given by
| (4) |
where represents the component of along the c-axis of the silicon carbide structure and the component in the basal plane. Figure 4 shows the ground and excited state effective g-factors extracted from our two-laser magnetospectroscopy experiments for 6H-SiC and 4H-SiC (additional experimental data can be found in the Supplementary Information). The solid lines represent fits to the equation (4) for the effective g-factor. The resulting and parameters are given in table 1.
The reason why diagonal transitions (in Fig. 3 panels a,c), and thus the and V scheme are allowed, lies in the different behavior of and . When the magnetic field direction coincides with the internal quantization axis of the defect, the spin states in both the ground and excited state are given by the basis of the operator, where the -axis is defined along the c-axis. This means that the spin-state overlap for vertical transitions, e.g. from to , is unity. In such cases, diagonal transitions are forbidden as the overlap between e.g. and is zero. Tilting the magnetic field away from the internal quantization axis introduces mixing of the spin states. The amount of mixing depends on the g-factor, such that it differs for the ground and excited state. This results in a tunable non-zero overlap for all transitions, allowing all four schemes to be observed (as in Fig. 2b where ). This reasoning also explains the suppression of all emission lines except in Fig. 2b, where the magnetic field is nearly along the c-axis. A detailed analysis of the relative peak heights in Fig. 2b-c compared to wave function overlap can be found in the Supplementary Information (section 4).
V Coherent Population Trapping
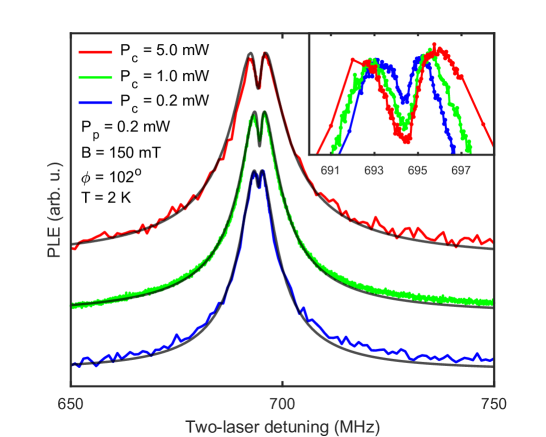
The driving scheme depicted in Fig. 3a, where both ground states are coupled to a common excited state, is of particular interest. In such cases it is possible to achieve all-optical coherent population trapping (CPT)Fleischhauer et al. (2005), which is of great significance in quantum-optical operations that use ground-state spin coherence. This phenomenon occurs when two lasers address a system at exact two-photon resonance, i.e. when the two-laser detuning matches the ground-state splitting. The ground-state spin system is then driven towards a superposition state that approaches for ideal spin coherence. Here is the Rabi frequency for the driven transition from the state to the common excited state. Since the system is now coherently trapped in the ground state, the photoluminescence decreases.
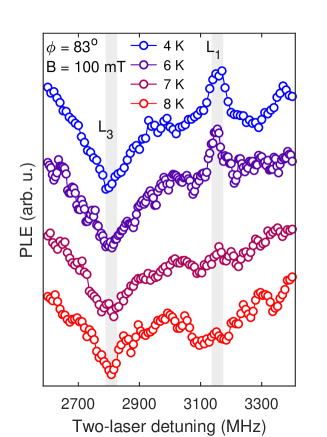
In order to study the occurrence of CPT, we focus on the two-laser PLE features that result from a scheme. A probe field with variable two-laser detuning relative to a fixed control laser was scanned across this line in frequency steps of 50 kHz, at . The control laser power was varied between and . This indeed yields signatures of CPT, as presented in Fig. 5. A clear power dependence is visible: when the control beam power is increased, the depth of the CPT dip increases (and can fully develop at higher laser powers or by concentrating laser fields in SiC waveguidesZwier (2016)). This observation of CPT confirms our earlier interpretation of lines -, in that it confirms that results from a scheme. It also strengthens the conclusion that this system is , since otherwise optical spin-pumping into the additional (dark) energy levels of the ground state would be detrimental for the observation of CPT.
Using a standard model for CPTFleischhauer et al. (2005), adapted to account for strong inhomogeneous broadening of the optical transitionsZwier (2016) (see also Supplementary Information section 6) we extract an inhomogeneous spin dephasing time of s and an optical lifetime of the excited state of ns. The optical lifetime is about a factor two longer than that of the nitrogen-vacancy defect in diamondDobrovitski et al. (2013); Doherty et al. (2013), indicating that the Mo defects can be applied as bright emitters (although we were not able to measure their quantum efficiency). The value of is relatively short but sufficient for applications based on CPTFleischhauer et al. (2005). Moreover, the EPR studies by Baur et al.Baur et al. (1997) on various transition-metal impurities show that the inhomogeneity probably has a strong static contribution from an effect linked to the spread in mass for Mo isotopes in natural abundance (nearly absent for the mentioned vanadium case), compatible with elongating spin coherence via spin-echo techniques. In addition, their work showed that the hyperfine coupling to the impurity nuclear spin can be resolved. There is thus clearly a prospect for storage times in quantum memory applications that are considerably longer than .
VI Further discussion
The anisotropic behavior of the g-factor that we observed for Mo was also observed for vanadium and titanium in the EPR studies by Baur et al.Baur et al. (1997) (they observed and for the ground state). In these cases the transition metal has a single electron in its 3d orbital and occupies the hexagonal (h) Si substitutional site. We show in Supplementary Information section 7 that the origin of this behavior can be traced back to a combination of a crystal field with symmetry and spin-orbit coupling for the specific case of an ion with one electron in its d-orbital.
The correspondence of this behavior with what we observe for the Mo impurity identifies that our materials have Mo impurities present as () systems residing on a hexagonal h silicon substitutional site. In this case of a hexagonal (h) substitutional site, the molybdenum is bonded in a tetrahedral geometry, sharing four electrons with its nearest neighbors. For () the defect is then in a singly ionized charge state ( denotes the elementary charge), due to the transfer of one electron to the p-type SiC host material.
An alternative scenario for our type of Mo impurities was recently proposed by Ivády et al.Ivády et al. (2011) They proposed, based on theoretical workIvády et al. (2011), the existence of the asymmetric split-vacancy (ASV) defect in SiC. An ASV defect in SiC occurs when an impurity occupies the interstitial site formed by adjacent silicon and carbon vacancies. The local symmetry of this defect is a distorted octahedron with a threefold symmetry axis in which the strong g-factor anisotropy () may also be present for the stateAbragam & Bleaney (1970). Considering six shared electrons for this divacancy environment, the () Mo configuration occurs for the singly charged state. For our observations this is a highly improbable scenario as compared to one based on the state, given the p-type SiC host material used in our work. We thus conclude that this scenario by Ivády et al. does not occur in our material. Interestingly, niobium defects have been shown to grow in this ASV configurationGällström et al. (2015), indicating there indeed exist large varieties in the crystal symmetries involved with transition metal defects in SiC. This defect displays spin with several optical transitions between nm in 4H-SiC and nm in 6H-SiCGällström et al. (2015).
Another defect worth comparing to is the aforementioned chromium defect, studied by Koehl et al.Koehl et al. (2017) Like Mo in SiC, the Cr defect is located at a silicon substitutional site, thus yielding a configuration for this defect in its neutral charge state. The observed spin state has a zero-field splitting parameter of 6.7 GHzKoehl et al. (2017). By employing optically detected magnetic resonance techniques they measured an inhomogeneous spin coherence time of nsKoehl et al. (2017), which is considerably shorter than observed for molybdenum in the present work. Regarding spin-qubit applications, the exceptionally low phonon-sideband emission of Cr seems favorable for optical interfacing. However, the optical lifetime for this Cr configuration (sKoehl et al. (2017)) is much longer than that of the Mo defect we studied, hampering its application as a bright emitter. It is clear that there is a wide variety in optical and spin properties throughout transition-metal impurities in SiC, which makes up a useful library for engineering quantum technologies with spin-active color centers.
VII Summary and Outlook
We have studied ensembles of molybdenum defect centers in 6H and 4H silicon carbide with 1.1521 eV and 1.1057 eV transition energies, respectively. The ground-state and excited-state spin of both defects was determined to be with large g-factor anisotropy. Since this is allowed in hexagonal symmetry, but forbidden in cubic, we find this to be consistent with theoretical descriptions that predict that Mo resides at a hexagonal lattice site in 4H-SiC and 6H-SiCIvády et al. (2011); Csóré et al. (2016), and our p-type host environment strongly suggests that this occurs for Mo at a silicon substitutional site. We used the measured insight in the spin Hamiltonians for tuning control schemes where two-laser driving addresses transitions of a system, and observed CPT for such cases. This demonstrates that the Mo defect and similar transition-metal impurities are promising for quantum information technology. In particular for the highly analogous vanadium color center, engineered to be in SiC material where it stays in its neutral () charge state, this holds promise for combining spin coherence with operation directly at telecom wavelengths.
Methods
Materials The samples used in this study were 1 mm thick epilayers grown with chemical vapor deposition, and they were intentionally doped with Mo during growth. The PL signals showed that a relatively low concentration of tungsten was present due to unintentional doping from metal parts of the growth setup (three PL peaks near 1.00 eV, outside the range presented in Fig. 1a). The concentration of various types of (di)vacancies was too low to be observed in the PL spectrum that was recorded. For more details see Ref. Gällström, 2015.
Cryostat During all measurements, the sample was mounted in a helium flow cryostat with optical access through four windows and equipped with a superconducting magnet system.
Photoluminescence (PL) The PL spectrum of the 6H-SiC sample was measured by exciting the material with an 892.7 nm laser, and using a double monochromator equipped with infrared-sensitive photomultiplier. For the 4H-SiC sample, we used a 514.5 nm excitation laser and an FTIR spectrometer.
Photoluminescence Excitation (PLE) The PLE spectrum was measured by exciting the defects using a CW diode laser tunable from 1050 nm to 1158 nm with linewidth below 50 kHz, stabilized within 1 MHz using feedback from a HighFinesse WS-7 wavelength meter. The polarization was linear along the sample c-axis. The laser spot diameter was 100 m at the sample. The PL exiting the sample sideways was collected with a high-NA lens, and detected by a single-photon counter. The peaks in the PLE data were typically recorded at a rate of about 10 kcounts/s by the single-photon counter. We present PLE count rates in arb. u. since the photon collection efficiency was not well defined, and it varied with changing the angle . For part of the settings we placed neutral density filters before the single-photon counter to keep it from saturating. The excitation laser was filtered from the PLE signals using a set of three 1082 nm (for the 4H-SiC case) or 1130 nm (for the 6H-SiC case) longpass interference filters. PLE was measured using an ID230 single-photon counter. Additionally, to counter charge state switching of the defects, a 770 nm re-pump beam from a tunable pulsed Ti:sapphire laser was focused at the same region in the sample. Laser powers as mentioned in the main text.
Two-laser characterization The PLE setup described above was modified by focusing a detuned laser beam to the sample, in addition to the present beams. The detuned laser field was generated by splitting off part of the stabilized diode laser beam. This secondary beam was coupled into a single-mode fiber and passed through an electro-optic phase modulator in which an RF signal (up to 5 GHz) modulated the phase. Several sidebands were created next to the fundamental laser frequency, the spacing of these sidebands was determined by the RF frequency. Next, a Fabry-Pérot interferometer was used to select one of the first-order sidebands (and it was locked to the selected mode). The resulting beam was focused on the same region in the sample as the original PLE beams (diode laser and re-pump) with similar spot size and polarization along the sample c-axis. Laser powers were as mentioned in the main text. Small rotations of the c-axis with respect to the magnetic field were performed using a piezo-actuated goniometer with 7.2 degrees travel.
Data processing For all graphs with PLE data a background count rate is subtracted from each line, determined by the minimum value of the PLE in that line (far away from resonance features). After this a fixed vertical offset is added for clarity. For each graph, the scaling is identical for all lines within that graph.
Data availability
The data sets generated and analyzed during the current study are available from the corresponding author upon reasonable request.
Acknowledgements
We thank A. Gali for discussions and M. de Roosz, J. G. Holstein, T. J. Schouten and H. Adema for technical support.
Early discussions with Prof. Erik Janzén leading to initiation of this study are gratefully acknowledged.
Financial support was provided by ERC Starting Grant 279931, the Zernike Institute BIS program, the Swedish Research Council grants VR 2016-04068 and VR 2016-05362, and the Carl-Trygger Stiftelse för Vetenskaplig Forskning grant CTS 15:339.
Competing interest
The authors declare no competing financial or non-financial interests.
Author Contributions
The project was initiated by C.H.W., O.V.Z, I.G.I and N.T.S. SiC materials were grown and prepared by A.E. and B.M. Experiments were performed by T.B., G.J.J.L. and O.V.Z, except for the PL measurements which were done by A.G. and I.G.I. Data analysis was performed by T.B., G.J.J.L., C.G., O.V.Z., F.H., R.W.A.H. and C.H.W. T.B., G.J.J.L. and C.H.W. had the lead on writing the paper, and T.B. and G.J.J.L. are co-first author. All authors read and commented on the manuscript.
REFERENCES FOR THE MAIN TEXT
References
- Gao et al. (2015) Gao, W., Imamoglu, A., Bernien, H. & Hanson, R. Coherent manipulation, measurement and entanglement of individual solid-state spins using optical fields. Nat. Phot. 9, 363 (2015).
- Togan et al. (2010) Togan, E. et al. Quantum entanglement between an optical photon and a solid-state spin qubit. Nature 466, 730 (2010).
- Dolde et al. (2014) Dolde, F. et al. High-fidelity spin entanglement using optimal control. Nat. Commun. 5, 3371 (2014).
- Klimov et al. (2015) Klimov, P. V., Falk, A. L., Christle, D. J., Dobrovitski, V. V. & Awschalom, D. D. Quantum entanglement at ambient conditions in a macroscopic solid-state spin ensemble. Sci. Adv. 1, e1501015 (2015).
- Hensen et al. (2015) Hensen, B. et al. Loophole-free Bell inequality violation using electron spins separated by 1.3 kilometres. Nature 526, 682–686 (2015).
- Kalb et al. (2017) Kalb, N. et al. Entanglement distillation between solid-state quantum network nodes. Science 356, 928–932 (2017).
- Budker & Romalis (2007) Budker, D. & Romalis, M. Optical magnetometry. Nat. Phys. 3, 227–234 (2007).
- Balasubramanian et al. (2008) Balasubramanian, G. et al. Nanoscale imaging magnetometry with diamond spins under ambient conditions. Nature 455, 648–651 (2008).
- Dolde et al. (2011) Dolde, F. et al. Electric-field sensing using single diamond spins. Nat. Phys. 7, 459–463 (2011).
- Kraus et al. (2014a) Kraus, H. et al. Magnetic field and temperature sensing with atomic-scale spin defects in silicon carbide. Sci. Rep. 4, 5303 (2014a).
- Bonato et al. (2016) Bonato, C. et al. Optimized quantum sensing with a single electron spin using real-time adaptive measurements. Nat. Nanotechnol. 11, 247–252 (2016).
- Dobrovitski et al. (2013) Dobrovitski, V., Fuchs, G., Falk, A., Santori, C. & Awschalom, D. Quantum control over single spins in diamond. Annu. Rev. Condens. Matter Phys. 4, 23–50 (2013).
- Childress & Hanson (2013) Childress, L. & Hanson, R. Diamond NV centers for quantum computing and quantum networks. MRS Bull 38, 134–138 (2013).
- Doherty et al. (2011) Doherty, M. W., Manson, N. B., Delaney, P. & Hollenberg, L. C. The negatively charged nitrogen-vacancy centre in diamond: the electronic solution. New Journal of Physics 13, 025019 (2011).
- Maze et al. (2011) Maze, J. et al. Properties of nitrogen-vacancy centers in diamond: the group theoretic approach. New Journal of Physics 13, 025025 (2011).
- Thiering & Gali (2017) Thiering, G. & Gali, A. Ab initio calculation of spin-orbit coupling for an NV center in diamond exhibiting dynamic Jahn-Teller effect. Physical Review B 96, 081115 (2017).
- Radnaev et al. (2010) Radnaev, A. et al. A quantum memory with telecom-wavelength conversion. Nat. Phys. 6, 894–899 (2010).
- Zaske et al. (2012) Zaske, S. et al. Visible-to-telecom quantum frequency conversion of light from a single quantum emitter. Phys. Rev. Lett. 109, 147404 (2012).
- Dréau et al. (2018) Dréau, A., Tcheborateva, A., El Mahdaoui, A., Bonato, C. & Hanson, R. Quantum frequency conversion of single photons from a nitrogen-vacancy center in diamond to telecommunication wavelengths. Phys. Rev. Appl. 9, 064031 (2018).
- Weber et al. (2010) Weber, J. et al. Quantum computing with defects. Proc. Natl. Acad. Sci. U.S.A. 107, 8513 (2010).
- Weber et al. (2011) Weber, J. et al. Defects in SiC for quantum computing. J. Appl. Phys. 109, 102417 (2011).
- Von Bardeleben et al. (2016) Von Bardeleben, H. et al. NV centers in 3C, 4H, and 6H silicon carbide: A variable platform for solid-state qubits and nanosensors. Phys. Rev. B 94, 121202 (2016).
- Zargaleh et al. (2016) Zargaleh, S. et al. Evidence for near-infrared photoluminescence of nitrogen vacancy centers in 4H-SiC. Phys. Rev. B 94, 060102 (2016).
- Friedrichs et al. (2010) Friedrichs, P., Kimoto, T., Ley, L. & Pensl, G. Silicon Carbide, vol. 1 (Wiley, Weinheim, 2010).
- Song et al. (2011) Song, B.-S., Yamada, S., Asano, T. & Noda, S. Demonstration of two-dimensional photonic crystals based on silicon carbide. Opt. Express 19, 11084–11089 (2011).
- Koehl et al. (2011) Koehl, W. F., Buckley, B. B., Heremans, F. J., Calusine, G. & Awschalom, D. D. Room temperature coherent control of defect spin qubits in silicon carbide. Nature 479, 84–87 (2011).
- Christle et al. (2015) Christle, D. J. et al. Isolated electron spins in silicon carbide with millisecond coherence times. Nat. Mater. 14, 160 (2015).
- Zwier et al. (2015) Zwier, O. V., O’Shea, D., Onur, A. R. & van der Wal, C. H. All–optical coherent population trapping with defect spin ensembles in silicon carbide. Sci. Rep. 5, 10931 (2015).
- Riedel et al. (2012) Riedel, D. et al. Resonant addressing and manipulation of silicon vacancy qubits in silicon carbide. Phys. Rev. Lett. 109, 226402 (2012).
- Kraus et al. (2014b) Kraus, H. et al. Room-temperature quantum microwave emitters based on spin defects in silicon carbide. Nat. Phys. 10, 157 (2014b).
- Widmann et al. (2015) Widmann, M. et al. Coherent control of single spins in silicon carbide at room temperature. Nat. Mater. 14, 164 (2015).
- Hobgood et al. (1995) Hobgood, H. M. et al. Semi–insulating 6H–-SiC grown by physical vapor transport. Appl. Phys. Lett. 66, 1364 (1995).
- Baur et al. (1997) Baur, J., Kunzer, M. & Schneider, J. Transition metals in SiC polytypes, as studied by magnetic resonance techniques. Phys. Status Solidi A 162, 153–172 (1997).
- Magnusson & Janzén (2005) Magnusson, B. & Janzén, E. Optical characterization of deep level defects in SiC. Mater. Sci. Forum 483, 341–346 (2005).
- Ivády et al. (2011) Ivády, V., Gällström, A., Son, N. T., Janzén, E. & Gali, A. Asymmetric split-vacancy defects in SiC polytypes: A combined theoretical and electron spin resonance study. Phys. Rev. Lett. 107, 195501 (2011).
- Son et al. (2012) Son, N. T. et al. Electron paramagnetic resonance and theoretical studies of Nb in 4H-and 6H-SiC. J. Appl. Phys. 112, 083711 (2012).
- Koehl et al. (2017) Koehl, W. F. et al. Resonant optical spectroscopy and coherent control of Cr4+ spin ensembles in SiC and GaN. Phys. Rev. B 95, 035207 (2017).
- Csóré et al. (2016) Csóré, A., Gällström, A., Janzén, E. & Gali, Á. Investigation of Mo defects in 4H-SiC by means of density functional theory. Mater. Sci. Forum 858, 261–264 (2016).
- Dombrowski et al. (1996) Dombrowski, K. et al. Identification of molybdenum in 6H-SiC by magnetic resonance techniques. Phys. Rev. B 54, 7323 (1996).
- Kimoto et al. (1996) Kimoto, T., Nakajima, T., Matsunami, H., Nakata, T. & Inoue, M. Formation of semi-insulating 6H-SiC layers by vanadium ion implantations. Appl. Phys. Lett. 69, 1113 (1996).
- Gällström et al. (2009) Gällström, A., Magnusson, B. & Janzén, E. Optical identification of Mo related deep level defect in 4H and 6H SiC. Mater. Sci. Forum 615, 405–408 (2009).
- Gällström (2015) Gällström, A. Optical characterization of deep level defects in SiC. PhD dissertation No. 1674, ISSN 0345-7524 (Linköping University, 2015).
- Manson & Wei (1994) Manson, N. & Wei, C. Transient hole burning in NV centre in diamond. J. Lumin. 58, 158–160 (1994).
- Santori et al. (2006) Santori, C. et al. Coherent population trapping in diamond NV centers at zero magnetic field. Opt. Express 14, 7986–7994 (2006).
- Fleischhauer et al. (2005) Fleischhauer, M., Imamoglu, A. & Marangos, J. P. Electromagnetically induced transparency: Optics in coherent media. Rev. Mod. Phys. 77, 633 (2005).
- Kimble (2008) Kimble, H. J. The quantum internet. Nature 453, 1023 (2008).
- Zwier (2016) Zwier, O. V. Two-laser spectroscopy and coherent manipulation of color-center spin ensembles in silicon carbide. Zernike Institute PhD thesis series, ISSN 1570-1530 (University of Groningen, 2016).
- Beha et al. (2012) Beha, K., Batalov, A., Manson, N. B., Bratschitsch, R. & Leitenstorfer, A. Optimum photoluminescence excitation and recharging cycle of single nitrogen-vacancy centers in ultrapure diamond. Phys. Rev. Lett. 109, 097404 (2012).
- Wolfowicz et al. (2017) Wolfowicz, G. et al. Optical charge state control of spin defects in 4H-SiC. Nat. Commun. 8, 1876 (2017).
- Abragam & Bleaney (1970) Abragam, A. & Bleaney, B. Electron Paramagnetic Resonance Of Transition Ions. International series of monographs on physics (Clarendon Press, Oxford, 1970).
- Doherty et al. (2013) Doherty, M. W. et al. The nitrogen-vacancy colour centre in diamond. Phys. Rep. 528, 1–45 (2013).
- Gällström et al. (2015) Gällström, A. et al. Optical properties and Zeeman spectroscopy of niobium in silicon carbide. Physical Review B 92, 075207 (2015).
| 4H-SiC | ||
|---|---|---|
| ground state | ||
| excited state | ||
| 6H-SiC | ||
| ground state | ||
| excited state |
Supplementary Information
for
Identification and tunable optical coherent control of transition-metal spins in silicon carbide
by
Tom Bosma *, Gerrit J. J. Lof *,Carmem M. Gilardoni, Olger V. Zwier, Freddie Hendriks, Björn Magnusson, Alexandre Ellison, Andreas Gällström, Ivan G. Ivanov, N. T. Son, Remco W. A. Havenith, and Caspar H. van der Wal
TABLE OF CONTENTS
![[Uncaptioned image]](/html/1802.06714/assets/x6.png)
REFERENCES FOR THE SUPPLEMENTARY INFORMATION
References
- (1) Fox, M. Optical properties of solids (2nd edition). Oxford master series in condensed matter physics (Oxford University Press, Oxford, 2010).
- (2) Fleischhauer, M., Imamoglu, A., & Marangos, J. P. Electromagnetically induced transparency: Optics in coherent media. Rev. Mod. Phys. 77, 633–673 (2005).
- (3) Ivády, V., Somogyi, B., Zólyomi, V., Gällström, A., Son, N. T., Janzén, E., & Gali, A. Transition metal defects in cubic and hexagonal polytypes of SiC: Site selection, magnetic and optical properties from AB INITIO calculations. Mat. Sci. Forum 717, 205–210 (2012).
- (4) Baur, J., Kunzer, M., & Schneider, J. Transition metals in SiC polytypes, as studied by magnetic resonance techniques. Phys. Status Solidi A 162, 153–172 (1997).
- (5) Abragam, A. & Bleaney, B. Electron paramagnetic resonance of transition ions. International series of monographs on physics (Clarendon Press, Oxford, 1970).
- (6) Chibotaru, L. F., Hendrickx, M. F. A., Clima, S., Larionova, J., & Ceulemans, A. Magnetic anisotropy of [Mo(CN)7]4- anions and fragments of cyano-bridged magnetic networks. The Journal of Physical Chemistry A 109, 7251–7257 (2005).
- (7) Kunzer, M., Müller, H. D., & Kaufmann, U. Magnetic circular dichroism and site-selective optically detected magnetic resonance of the deep amphoteric vanadium impurity in 6H-SiC. Physical Review B 48, 10846–10854 (1993).
- (8) Dietz, R., Kamimura, H., Sturge, M., & Yariv, A. Electronic structure of copper impurities in ZnO. Physical Review 132, 1559–1569 (1963).
1 Single-laser spectroscopy
Figure S1 shows the photoluminescence (PL) emission spectrum of the 4H-SiC sample at 5 and 20 K, characterized using a 514.5 nm excitation laser. The Mo zero-phonon line (ZPL) at 1.1521 eV is marked by a dashed box and shown enlarged in the inset. The broader peaks at lower energies are phonon replicas of the ZPL. There is almost no dependence on temperature for both the ZPL and the phonon replicas.
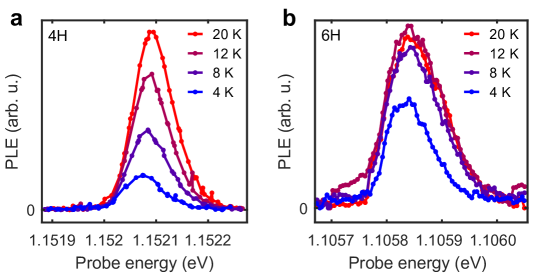
Figures S2a,b show results of PLE measurements of the ZPL for Mo in 4H-SiC at 1.1521 eV and 6H-SiC at 1.1057 eV, and the temperature dependence of these PLE signals. When the temperature is decreased, the width of the ZPL stays roughly the same, but its height drops significantly. Combined with the near-independence on temperature of the emission spectrum in Fig. S1, this is an indication for optical spin pumping for Mo-impurity states at lower temperatures, where a single resonant laser pumps then the system into long-lived off-resonant spin states.
2 Additional two-laser spectroscopy for in 6H-
Angle dependence.
In addition to Fig. 2b,c in the main text, we also measured the magnetic field dependence of the spin related emission signatures at intermediate angles . Figure S3 shows this dependence for , and . The spectroscopic position of emission lines show a linear dependence on magnetic field, with slopes (in Hertz per Tesla) that decrease as increases. The effective g-factors in Fig. 4 are acquired from the emission lines by relating their slopes to the Zeeman splittings in the ground and excited state. Using the four pumping schemes depicted in Fig. 3 in the main text, we derive
| (5) | ||||
| (6) | ||||
| (7) | ||||
| (8) |
where is Planck’s constant, the Bohr magneton and the ground (excited) state g-factor.
Temperature and photon-energy dependence.
We also measured the dependence of the two-laser PLE signal on temperature, see Fig. S4a. The PLE features disappear above 8 K in a much broader PLE background that starts to emit because of more rapid thermal spin mixing in the ground state. Other Mo systems in the ensemble for which the two-laser resonance condition is not met then also start emitting due to single-laser excitation (see also Fig. S2), since the optical pumping into an off-resonant state becomes shorter lived. Notably, the linewidths of the peaks in Fig. S4a do not change in the range 2 K to 8 K, indicating that the temperature does not affect the optical lifetime in this range. Above 8 K the temperature was a bit unstable during the measurements, which causes the drifting in the single-laser PLE contribution to this signal. Interestingly, the dip () is most pronounced at 6 K, since there are several competing processing responsible for this dip (see section 5).
Additionally, we measured how the two-laser PLE occurred throughout the inhomogenously broadened ensemble, by varying the photon energy of the control laser and sweeping the two-laser detuning for each case (Fig. S4b). For all photon energies the peaks are at the same position, indicating that all Mo atoms in the ensemble behave similarly. At 1.10561 eV the control laser is too far detuned from the ZPL to yield any two-laser PLE signal.
Two-laser spectroscopy for the 5-21 GHz detuning range.
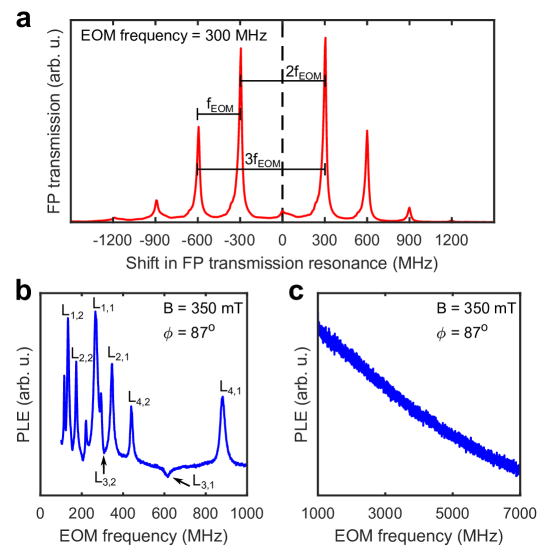
In order to check for a possible presence of spin-related emission features at detunings larger than 5 GHz (checking for a possible zero-field splitting), we modified the setup such that we could control two-laser detunings up to 21 GHz. The electro-optical phase modulator (EOM) we used for generating the detuned laser field could generate first-order sidebands up to 7 GHz. In order to check for two-laser spectroscopy emission features at larger detunings, we removed the Fabry-Pérot (FP) resonator that had the role of filtering out a single sideband. Now, all sidebands (on the same optical axis) were focused onto the sample with 2 mW total laser power. Apart from the re-pump beam, no additional laser was focused onto the sample in this experiment. In this way, the Mo defects could interact with several combinations of sidebands. Figure S5a shows the spectral content of this beam (here characterized by still using the FP resonator). The first and second order sidebands at negative and positive detuning take a significant portion of the total optical power. Hence, pairs of sidebands spaced by single, double or triple frequency intervals (EOM frequency ) now perform two-laser spectroscopy on the Mo defects. The relevant sideband spacings are indicated in Fig. S5a.
Figure S5b presents results of these measurements, showing various peaks that we identified and label as . Here is identifying the peak as a line as in the main text, while the label identifies it as a spectroscopic response for two-laser detuning at (that is, is for first-order EOM sideband spacing, etc.). Note that second-order manifestations of the known peaks - (from double sideband spacings, labeled as ) are now visible at , and third-order response of the known - occurs at (but for preserving clarity these have not been labeled in Fig. S5b).
Figure S5c depicts a continuation of this experiment with up to 7 GHz with the same resolution as Fig. S5b. No new peaks are observed. Considering that third-order peaks were clearly visible before, we conclude that no additional two-laser emission features exist up to 21 GHz.
3 Two-laser spectroscopy for in 4H-
We also studied the spin-related fine structure of Mo defects in 4H-SiC. Our 4H-SiC sample suffered from large background absorption, which drastically lowered the signal-to-noise ratio. We relate this absorption to a larger impurity content (of unknown character, but giving broad-band absorption) in our 4H-SiC material as compared to our 6H-SiC material. Therefore, the lasers were incident on a corner of the sample, so as to minimize the decay of the emitted PL. We present the results in gray-scale plots in Fig. S6 for optimized contrast. The figure shows the magnetic field and two-laser detuning dependence of the PLE.
Analogous to Fig. 2 for 6H-SiC in the main text, the spectroscopic position features appear as straight lines that emerge from zero detuning, indicating the absence of a zero-field splitting. When the magnetic field is nearly perpendicular to the c-axis (Fig. S6c), four lines are visible. This is consistent with an ground and excited state.
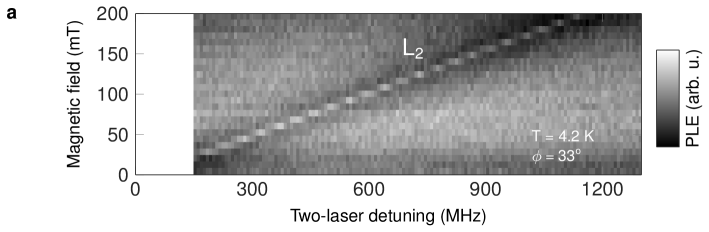
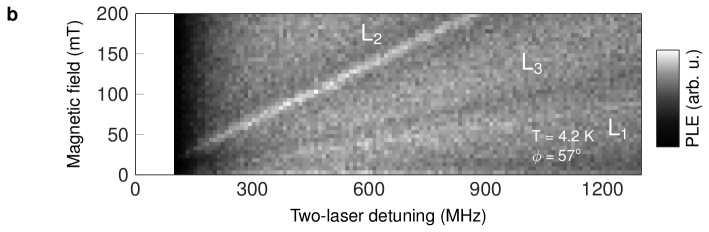
The data from Fig. S6c was measured at 10 K, whereas Fig. S6a,b was at 4.2 K. At 10 K, all emission lines become dips, while for 6H-SiC only the V system shows a dip. The temperature dependence of and is shown in Fig. S7 for the same configuration as in Fig. S6c (). At low temperatures shows a peak and shows a dip. Upon increasing the temperature, both features become dips. This phenomenon was only observed for Mo in 4H-SiC, it could not be seen in 6H-SiC. We therefore conclude that this probably arises from effects where Mo absorption and emission is influenced by the large background absorption in the 4H-SiC material.
The labels in Fig. S6 are assigned based on the sum rules from equation (2) and (3) (main text), which indeed also hold for the observed emission lines observed here. Like in the main text, through indicate , , V and X two-laser pumping schemes, respectively. The and labels are interchangeable in Fig. S6c when only considering the sum rules. However, the fact that the left feature in Fig. S7 shows a dip for all temperatures means that it should be related to a V scheme. Thus, the current assignment of the labels with corresponding pumping schemes is justified. Using equations 5 through 8 (Suppl. Inf.), the effective g-factors can be determined. Fitting these to equation (4) gives the values for and reported in the main text.
4 Franck-Condon principle with respect to spin
The amplitude of the two-laser emission signatures is determined by the strength of the underlying optical transitions. For a transition -, this strength is determined by the spin overlap , according to the Franck-Condon principle with respect to spinfox2001SI . The quantum states of the spin in the electronic ground and excited state can be described using effective spin Hamiltonian
| (9) |
with the Bohr magneton, the applied magnetic field vector, the effective spin vector, and where the ground (excited) state g-parameter is a tensor . Using Cartesian coordinates this can be written as
| (10) |
Here the -axis is parallel to the SiC c-axis, and the and -axes lay in the plane perpendicular to the c-axis. Due to the symmetry of the defect, the magnetic field can be written as
| (11) |
where indicates the magnitude of the magnetic field. The resulting Hamiltonian may be found by substituting B and into equation (9), and considering that . The basis of can be found from the eigenvectors.
For the ground state is zero, thus the bases of and coincide, independent of . Therefore, there is no mixing of spins in the ground state. However, in the excited state is nonzero, causing its eigenbasis to rotate if a magnetic field is applied non-parallel to the c-axis. The new eigenbasis is a linear combination of eigenstates of , and , such that there will be mixing for spins in the excited state for any nonzero angle .
We calculate the spin overlap for the - transition from the inner product of two basis states and . The strength of a two-laser pumping scheme is then the product of the strength of both transitions. For example, the strength of the scheme from Fig. 3a equals the inner product multiplied by . The resulting strengths for all four pumping schemes are depicted in Fig. S8.
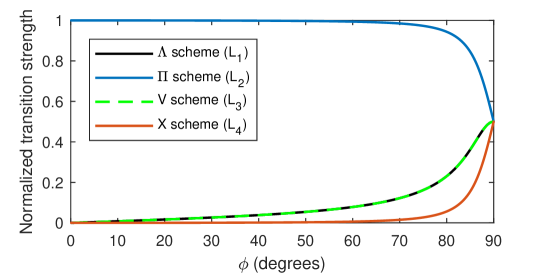
We now compare these transition strengths to the data in Fig. 2b,c and Fig. S3 and S6. It is clear that the scheme is the strongest pumping scheme for all angles . This explains the large relative amplitude of in our measurements. The and V scheme transition strengths are equal, starting from zero for and increasing as approaches . For the scheme, this is consistent with the increasing relative amplitude of . For close to the amplitude of is even larger than for . The reason for this is that a scheme is emitting more effectively than a scheme. The V scheme is harder to observe in the background emission, such that is only visible for close to . Finally, the transition strength of the X scheme is only significant for close to , which is why we have not been able to observe below in 6H-SiC.
5 V-scheme dip
Understanding the observation of a dip for the V pumping scheme in a four-level system (Fig. 2c in the main text) is less trivial than for the observation of peaks from the other three pumping schemes. The latter can be readily understood from the fact that for proper two-laser detuning values both ground states are addressed simultaneously, such that there is no optical pumping into dark states. In this section we will investigate how a dip feature can occur in the PLE signals. Our modeling will be based on solving a master equation in Lindblad form with a density matrix in rotating wave approximation for a four-level system with two near-resonant lasersfleischhauer2005SI .
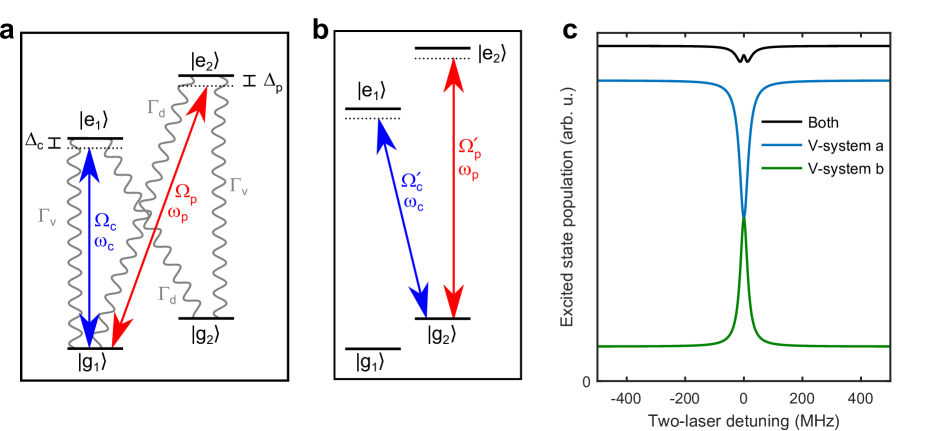
Consider the four-level system depicted in Fig. S9a. A control laser is near-resonant with the - (vertical) transition and a probe laser near-resonant with - (diagonal) transition. Here the two-laser detuning is defined as , i.e. the difference between the detunings of both lasers from their respective near-resonant transitions, such that the emission feature appears at zero two-laser detuning. The decay rates from the excited states are and for vertical and diagonal transitions, respectively. They are quadratically proportional to the spin-state overlap
| (12) | ||||
| (13) |
These rates are unequal, since the spin-state overlap for diagonal transitions is generally smaller than for vertical transitions (see previous section). The decay rates between excited-state levels and ground-state levels are assumed very small compared to the decay rates from the excited-state levels. The decay rates from ground-state levels towards the excited-state levels are set to zero. Dephasing rates are taken relative to the state (). The choices for parameters are listed in table S1. The Rabi frequencies and of the driven transitions are linearly proportional to the spin-state overlap
| (14) | ||||
| (15) |
| parameter | value (Hz) | parameter | value (Hz) |
|---|---|---|---|
Additionally, we have to consider a secondary V-scheme (Fig. S9b) resonant with another part of the inhomogeneously broadened ensemble. The control and probe laser are swapped, as the former now addresses a diagonal transition, while the latter addresses a vertical one. The new Rabi frequency is taken to be for the control beam, which is now driving a diagonal transition (with reduced strength). The probe beam is driving a vertical transition (with increased strength), and its Rabi frequency is .
Considering both V-schemes, we calculate the total population in both excited-state levels as it reflects the amount of photoluminescence resulting from decay back to the ground states. The two-laser detuning dependence of the excited-state population is shown in Fig. S9c. The black curve considers both schemes simultaneously, which represents the situation in our measurements. Here the dip indeed appears, although both separate schemes (a and b) display a dip and peak (respectively). The competition between both schemes limits the depth of the observed dip, which explains our observation of shallow dips in contrast to sharp peaks in Fig. 2c in the main text.
Interestingly, the black curve displays a peak within the dip, which might seem like a CPT feature. However, this feature is not visible in either curve from the two separate pumping schemes. This peak appears because the peak from the second V-scheme (green) is slightly sharper than the dip from the first one (blue). The peak might still be caused by CPT, as the blunting of the dip relative to the peak can be caused by a long dephasing time of the ground state.
Key to understanding the appearance of a dip in the total photoluminescence emission is the difference in decay rates, vertical decay being favored over diagonal decay. Consider the pumping scheme from Fig. S9a. When the probe laser is off-resonant the control laser drives the - transition. Decay will occur mostly towards the state and occasionally to the dark state. If the probe laser becomes resonant with the - transition, the increased population in the state will prefer to decay towards the dark state. The overall decay towards the dark state is now increased. The secondary pumping scheme (Fig. S9b) works the other way around, where the diagonal transition is always driven by the control beam and a resonant probe beam will counteract some of the pumping into the dark state (now ). However, the slightly increased emission from scheme b cannot fully counteract the decreased emission from scheme a (even when ).
6 Modeling of coherent population trapping
For fitting the CPT traces in Fig. 5 in the main text, we use a standard CPT descriptionfleischhauer2005SI , extended for strong inhomogeneous broadening of the optical transitions, and an approach similar to the one from the previous section. However (as compared to the previous section), the behavior of CPT has a more pronounced dependence on parameters, such that almost no assumptions have to be made. When taking the spin Hamiltonians as established input (section 4), the only assumption made is that the spin relaxation time in the ground state and excited state is much slower than all other decay process. This allows for setting up fitting of the CPT traces with only two free fit parameters, which correspond to the optical lifetime and the inhomogeneous dephasing time .
Since two lasers couple both ground-state levels to a single common excited-state level, the other excited-state level will be empty. Therefore, we may describe this situation with a three-level system, where the PL is directly proportional to the excited-state population. The decay rates and Rabi frequencies are proportional to the Franck-Condon factors for spin-state overlaps in the same way as before (equations (12)-(15)). At this angle () we calculate these factors to be
| (16) | ||||
| (17) |
according to the reasoning in section 4. We take that the - is a vertical transition and - a diagonal one.
In order to account for inhomogeneous broadening throughout the ensemble, the solution of the master equation is computed for a set of control-laser detunings (see Fig. S9a) around zero, its range extending far beyond the two-laser detuning values (since we experimentally observed an inhomogeneous broadening much in excess of the spin splittings). In this case the probe-laser detuning becomes . The resulting excited-state populations are integrated along the inhomogeneous broadening (up to the point where the signal contribution vanishes) to give the PL emission as a function of two-laser detuning . Analogous to the previous section, we have to consider a secondary -scheme in order to fully account for the inhomogeneous broadening. The total PL emission is found by adding together the excited-state populations from both schemes.
We fit this model to the data presented in Fig. 5 after subtracting a static background. We extract the inhomogeneous dephasing time s and an optical lifetime of ns. The errors are estimated from the spread in extracted dephasing times and lifetimes throughout the data sets.
7 Anisotropic -factor in the effective spin-Hamiltonian
7.1 Relationship between effective spin Hamiltonian and local configuration of the defect
An effective spin-Hamiltonian as the one used in the main text is a convenient tool which allows us to describe the behavior of the system in a wide range of configurations, as long as the effective parameters are experimentally determined and all relevant states are considered. It is often the meeting point between experimentalists, who measure the relevant parameters, and theoreticians, who attempt to correlate them to the Hamiltonian that describes the configuration of the system. A careful description of the latter, and how it modifies the parameters at hand, allows us to rationalize our choices when investigating defects with varying characteristics (such as a different charge state or element). This task is more approachable when we consider the group-theoretical properties of the system at hand. Here we combine group-theoretical considerations with ligand field theory in order to qualitatively describe the features observed in our experiment. In particular, we aim at explaining the large Zeeman splitting anisotropy observed in both ground and excited states, and correlating it to the charge and spatial configuration of the defect.
In our experiments, we observe a single zero-phonon line (ZPL) associated with optical transitions between two Kramers doublets (KD, doublets whose degeneracy is protected by time-reversal symmetry and is thus broken in the presence of a magnetic field) in defects which contain Mo. The presence of a single zero-phonon line in both 4H and 6H-SiC samples indicates that the defect occupies a lattice site with hexagonal symmetry. The lattice of 6H-SiC has two inequivalent sites with cubic symmetry. Thus, if the defect were to occupy sites of cubic symmetry, we would expect to observe two ZPLs closely spaced in this sample. The absence of the ZPL associated with this defect in samples of 3C-SiCivady2012SI further corroborates this assumption. Additionally, we observe strong anisotropy in the Zeeman splitting of the ground and excited states. Specifically, when the magnetic field is perpendicular to the symmetry axis of the crystal, the Zeeman splitting of the ground state goes to zero, whereas that of the excited state is very small. This feature is observed in other transition-metal defects in SiC situated at Si substitutional sites of hexagonal symmetry and with one electron in its d orbitalbaur1997SI , but we are not aware of a clear explanation of the phenomenon.
In our experiments, we observed transitions between sublevels of doubly degenerate ground and excited states, whose degeneracy is broken in the presence of a magnetic field. Thus, we note that ground and excited states are isolated KDs, indicating that the defect contains an odd number of electrons. A Mo atom has electrons in its valence shell. The atom can occupy a Si substitutional site (), where it needs to bond to neighboring atoms, or an asymmetric split vacancy (ASV) site (), where it bonds to neighboring atoms. These defects can, respectively, be described by a Mo ion in the configurations and , indicating that the defect must be ionized in order to contain an odd number of electrons. Its charge state, which could be , , etc., is determined by the Fermi level in the crystal of interest. We note that the ZPL could only be observed in p-doped samples, which indicates that the features investigated here are unlikely to arise from negatively charged defect. The defect (where represents the charge state of the defect, not the Mo atom) can be approximately described by a Mo in a configuration , which facilitates the treatment of its configuration in terms of d orbitals. In contrast, the defect is described by an electronic configuration containing a hole in the bonding orbitals. These orbitals show strong hybridization between the d orbitals of the Mo and the orbitals of the ligands, and cannot be straight-forwardly analyzed using the formalism described below. Nonetheless, inspired by the similarities between our system and other transition-metal defects reported in SiCbaur1997SI , we investigate the effect of the crystal field of symmetry –which is expected to be significant in hexagonal lattice sites in 4H-SiC and 6H-SiC– on the one-electron levels of the sublevels (, if spin multiplicity is included) of the d shell of a Mo atom. We qualitatively predict the spin-hamiltonian parameters expected for a Mo ion in a configuration, and compare our analysis to the experimental results.
7.2 Ion in configuration in the presence of crystal field of symmetry and spin-orbit coupling
The degenerate sublevels of a d-orbital are split by a crystal field of symmetryabragam1970SI . The energy splittings induced by this field are much smaller than the energy difference between the d shell and the next orbital excited state (s). This allows us to, initially, consider the orbitals of the d shell as a complete set. Since Mo is a heavy atom, we cannot disregard the effect of spin-orbit interaction. However, we assume that the crystal field is larger than the effect of SOC, that is, , where denotes the energy splitting induced by each term (see Fig. S10).

The orbital states of the d-orbital form a 5-dimensional irreducible representation (irrep) of the full rotation group SO(). When the symmetry is lowered by the crystal field to , the -dimensional representation is split into doublets (, ) and singlet () that are irreps of . Writing the components of the d orbital in terms of the quadratic functions , , , , allows us to identify which orbitals are degenerate in the presence of a crystal field of trigonal symmetry. We find that the singlet is composed of the orbital . Furthermore, the orbitals and are degenerate upon action of the crystal field and make up doublet . Finally the orbitals and correspond to doublet . Group-theoretical considerations alone are not capable of elucidating which irrep corresponds to the ground state, that is, it does not provide information about the order of the energy levels.
Comparison between the Cartesian form of these orbitals and the spherical harmonics which span a -dimensional space (that is, the spherical harmonics with ) allows us to rewrite the relevant orbitals as linear combinations of the eigenstates of the operators , . This yields a new basis for each irrep considered above:
| 1st orbital doublet | (18) | |||
| 2nd orbital doublet | (19) | |||
| orbital singlet | (20) |
When the spin multiplicity is considered, each orbital doublet yields possible states, whereas the orbital singlet yields possible states. Spin-orbit coupling (represented by the operator ) is responsible for splitting these states into 5 different Kramers doublets:
| (21) | |||
| (22) | |||
| (23) | |||
| (24) | |||
| (25) |
where the basis vectors are given in terms of the quantum numbers and which denote the projection of the orbital and spin angular momentum along the quantization axis, respectively (Fig. S10). Here, the spin-orbit coupling is considered up to first order in the energy correction, whereas the wave function is corrected up to zeroth order.
A magnetic field lifts the degeneracy between the two components of each KD. This splitting is usually described phenomenologically by an effective Zeeman Hamiltonian in a system with pseudospin .
| (26) |
where is the Bohr magneton, the magnetic field vector, the pseudo spin operator and the g-tensor. In the presence of axial symmetry, can be diagonalized such that equation (26) can be rewritten in terms of the symmetry axis of the crystal
| (27) |
In terms of the eigenstates belonging to each KD, the splitting is described by the Zeeman Hamiltonian given by
| (28) |
where is the magnetic moment operator, the g-factor for a free electron, the total spin operator, the orbital reduction factor, and the orbital angular momentum operatorabragam1970SI ; chibotaru2005SI . The orbital reduction factor , is a factor between and which corrects for partial covalent bonding between the electron and the ligandsabragam1970SI (note that the value of differs for each of the 5 KDs in equations (21-25)). Comparison of equations (27) and (28) shows that
| (29) | ||||
| (30) |
As long as the magnitude of this Zeeman splitting is small compared to the spin-orbit interaction we can consider, to first order, the effect of the magnetic field in the sets formed by each KD independently. That is, we consider that the magnetic field does not mix states pertaining to two different KDs.
In order to calculate the values of and for each KD defined by trigonal symmetry and spin-orbit coupling, we rewrite equation (28) as
| (31) |
where the and subindices denote the raising and lowering magnetic moment operators and the linear combinations , respectively. When we consider the basis given in equations (21-24), the matrix elements of both and are zero between two eigenvectors pertaining to one KD. This arises from the fact that the operator couples states with to states with or . Since, within a KD, there is a change in both and when going from one eigenvector to the other, the operators and cannot couple these states to each other. Explicitly, for KD1 for example, we obtain
| (32) | |||
| (33) | |||
| (34) |
and in a similar way for KDs 2 through 4. Thus, up to first order, a magnetic field applied perpendicular to the crystal c-axis is not capable of lifting the degeneracies of the 4 KDs given in equations (21)-(24). Comparing these results to equation (30) we conclude that, for the sublevels of the KDs 1 through 4, . This arises from the effect of both the crystal field of C3v symmetry and SOC in decoupling and isolating KDs with the properties mentioned above. This is not the case for KD5, given in equation (25). In this case,
| (35) |
and the degeneracy of this KD is broken in the presence of a magnetic field perpendicular to the c-axis of the crystal.
We can consider in addition the effect of spin-orbit coupling in mixing the eigenstates presented in equations (21-25). Spin-orbit coupling is responsible for mixing between the eigenstates of KD2 and KD3 (equations (22) and (23)). Since both of these KDs show , this mixing does not modify the expected value of in neither KD. In contrast, the SOC induced mixing between KD4 and KD5 causes some deviation of from in KD4, since in KD5. The values of and for one electron in each of the KDs described in this section are presented in table S2.
From the 5 KDs in equations (21-25), one KD is the ground state and one KD is the excited state that we address in our experiments. As said before, our group-theoretical approach cannot identify the ordering in energy of these 5 KDs. However, by looking at the g-factor properties of the KDs in table S2 we can check which ones show consistent behavior with that of the observed ground and excited state. For the observed ground state, we found and . Concerning possible values for the orbital reduction factor , by definition , and we must have since deviates substantially from 2. This suggests that KD2 is the ground state. For the excited state, we also have , but with . This suggests KD4 is the excited state we observed in our experiments. In addition, the optical transition observed is mainly polarized along the crystal c-axis of the defect. Careful analysis of the selection rules associated with the double trigonal group (which includes, besides the spatial symmetry, the spin of the electron) has been reported by Kunzer et al.kunzer1993SI . Comparing their results to the considerations presented in the previous paragraphs confirms that the transition between KD2 and KD4 is predominantly polarized along the crystal c-axis, as observed. Finally, we note that we could not experimentally identify secondary ZPLs corresponding to transitions between other sets of KDs, even though they are allowed by symmetry. This could be explained by a series of factors. On the one hand, some of the KDs treated could have energies above the conduction band edge in the crystal, which would impede the observation of optical transitions from and into these levels. On the other hand, the presence of these lines could be masked by the intense phonon sideband at the red side of the ZPL, or the associated photon energies fall outside our detection window.
| Spin-Orbit | |||
|---|---|---|---|
| Doublet, | KD1, eq. 21 | 0 | |
| KD2, eq. 22 | 0 | ||
| Doublet, | KD3, eq. 23 | 0 | |
| KD4, eq. 24 | |||
| Singlet, | KD5, eq. 25 | 2 |
7.3 Validity of our assumptions
The model considered here is capable of qualitatively informing us about the behavior of orbitals with d character in the presence of trigonal crystal field and spin orbit coupling. It is clear that the full description of the configuration of the defect is far more subtle than the simple model applied here. We intend to comment on this in the next paragraphs.
Symmetry of the crystal field.
In our derivation, we assume that the trigonal crystal field is the prevailing term in the Hamiltonian describing the defect. This assumption is not rigorously correct, since the symmetry of defects in SiC is more accurately described by a ligand field of cubic symmetry – which determine most of its ground and excited state properties. This field is modified in the presence of axial symmetry, as is the case for defects in hexagonal lattice sites, which is generally included as a first-order perturbation term in the Hamiltonian. Nonetheless, it can be shownabragam1970SI ; dietz1963SI that the large anisotropy in the Zeeman response described above, with the cancelation of , is also observed in the case of a cubic field with trigonal distortion and spin-orbit coupling of similar magnitudes. The analysis, in this case, is more laborious due to the fact that mixing of the orbitals is involved, and calculating the matrix elements of the operators , , and is less trivial. Furthermore, this analysis would not increase our level of understanding of the system at this point, since we were only capable of observing transitions between the sublevels of two KDs in this experiment. This approach would be more profitable if transitions between other sets of KDs were observed, allowing us to unravel several parameters associated with the system, such as the strength of the spin-orbit coupling and trigonal crystal field.
Charge state of the defect.
Similarly, it can be shown that the considerations presented here can be expanded to configurations where the d orbitals are filled by multiple electrons (for instance, a defect in a configuration ). In this case, a doubly degenerate orbital configuration (in symmetry terms, a configuration of the kind mE, where is the spin multiplicity) in the presence of a crystal field of symmetry gives rise to at least one KD with when SOC is take into account. Nonetheless, only a negatively charged Mo in a Si substitutional site would give rise to a defect in the configuration . The absence of the ZPL in n-doped samples indicates that this is unlikely.
In addition, a similar group theoretical analysis can show that one hole in a bonding orbital of symmetry E would also give rise to . Thus, the features observed here could also correspond to a positively charged defect (where one of the six Mo electrons that participate in bonding is lost to the crystal lattice). Due to the strong hybridization between the Mo and the divacancy orbitals in this case, the description of this case is more subtle and will not be performed here.
7.4 Summary
We showed that an analysis of the effect of the defect symmetry on the Zeeman energy splittings of its ground and excited states, combined with the experimental observations, helps us unravel the configuration of the defect studied in this work. We show that, in symmetry, a combination of the crystal field and spin-orbit interaction is responsible for the strong magnetic anisotropy observed experimentally. Furthermore, the fact that the defect studied in this work is only observed optically in samples which are p-doped indicates that the charge of the defect is more likely positive than negative. In this way, we conclude that the most probable configuration of our defect is a Mo ion on a Si substitutional site of h symmetry, with a charge , which can be approximately described by a Mo atom in a configuration. The absence of other lines associated with the defect prevents us from providing a more accurate description of the system. Nonetheless, we have developed a qualitative description based on symmetry, which explains the Zeeman splittings observed. The considerations presented here allow us to predict and rationalize the presence of strong anisotropy in other transition-metal defects in SiC. We expect neutrally charged vanadium defects in hexagonal lattice sites to show a magnetic behavior similar to the one observed in the Mo defects investigated in this work.