Cavity-enhanced spectroscopy of a few-ion ensemble in Eu3+:Y2O3
Abstract
We report on the coupling of the emission from a single europium-doped nanocrystal to a fiber-based microcavity under cryogenic conditions. As a first step, we study the properties of nanocrystals that are relevant for cavity experiments and show that embedding them in a dielectric thin film can significantly reduce scattering loss and increase the light matter coupling strength for dopant ions. The latter is supported by the observation of a fluorescence lifetime reduction, which is explained by an increased local field strength. We then couple an isolated nanocrystal to an optical microcavity, determine its size and ion number, and perform cavity-enhanced spectroscopy by resonantly coupling a cavity mode to a selected transition. We measure the inhomogeneous linewidth of the coherent transition and find a value that agrees with the linewidth in bulk crystals, evidencing a high crystal quality. We detect the fluorescence from an ensemble of few ions in the regime of power broadening and observe an increased fluorescence rate consistent with Purcell enhancement. The results represent an important step towards the efficient readout of single rare-earth ions with excellent optical and spin coherence properties, which is promising for applications in quantum communication and distributed quantum computation.
I Introduction
Rare earth ion-doped crystals constitute a promising solid state system for quantum information processing and networking Goldner et al. (2015). They provide nuclear spin states with very long coherence times, up to six hours Zhong et al. (2015), in which quantum information can be storedKolesov et al. (2013); Laplane et al. (2015); Gündoğan et al. (2015). They also offer optical transitions with exceptionally good coherence properties, up to ms Böttger et al. (2009), that can be used as a photonic interface for the spin states. Furthermore, electric dipole interactions can be used for an excitation blockade similar to the one studied for Rydberg atoms, and are thus a resource to realize quantum gates Ohlsson et al. (2002); Longdell et al. (2004). However, due to the dipole-forbidden transitions, the excited-state lifetime is long, leading to very low emission rates. This has limited most experiments to macroscopic ensembles so far, which hinders scalability towards multi-qubit systems.
Recently, individual rare earth ions have been detected either by upconversion spectroscopy Kolesov et al. (2012), direct high-resolution spectroscopy of transitions Utikal et al. (2014); Nakamura et al. (2014), or by using strong transitions Kolesov et al. (2013); Siyushev et al. (2014). For the realization of spin-photon interfaces, the coherent transitions appear to be best suited. However, their low scattering rate makes single ion detection in free space challenging. Moreover, the excited state lifetime is typically significantly longer than the coherence time, deteriorating the indistinguishability of the emitted photons. Both issues can be overcome by coupling the emitters to optical microcavities. This increases the low scattering rates to achieve practically useful detection rates Zhong et al. (2015); Dibos et al. (2017); Zhong et al. (2018). Coupling the emitters to optical microcavities increases the spontaneous emission rate by the Purcell factor , where is the emission wavelength, the quality factor of the resonator, its mode volume, and the branching ratio of the respective transition. Additionally, the emission is coupled to a well-collectible cavity mode, yielding a collection efficiency given by with the cavity outcoupling efficiency . Near-unity collection efficiency can be reached for sufficiently large and . Finally, for , where is the excited state lifetime and is the homogeneous linewidth, emitted photons are Fourier limited Zhong et al. (2018), thus allowing for interference between photons from different ions as required for scalable entanglement distribution using entanglement swapping Zukowski et al. (1993) as already shown in other systems Pan et al. (1998); Olmschenk et al. (2009).
Here, we report on a promising approach for achieving efficient access to individual or small ensembles of ions by coupling ion-doped nanocrystals to a high-finesse fiber-based Fabry-Perot microcavity Hunger et al. (2010); Benedikter et al. (2017). Fiber cavities can achieve high Purcell factors up to , provide open access to the cavity mode for optimal overlap between the ions and the cavity field, and offer full tunability of the resonance frequency to target all regions of the inhomogeneous line. We show that introducing small enough nanoparticles into the cavity does not significantly affect the cavity, and allows one to independently optimize the cavity and the sample. In particular, we demonstrate that embedding nanoparticles into a dielectric layer on a cavity mirror is beneficial for both reducing scattering loss and increasing the local field strength at the ions, significantly improving ion-cavity coupling. Nanoparticles naturally select a small ensemble of ions, such that due to a large ratio between the inhomogeneous and the homogeneous linewidth, individual ions can be addressed via their transition frequency. We study Eu3+:Y2O3 nanocrystals, which to date have shown the best optical and spin coherence within a nanoscale host, with a homogeneous linewidth kHz Perrot et al. (2013); Bartholomew et al. (2017) and ms nuclear spin coherence Serrano et al. (2017) observed in nanoparticle powders. Europium also offers a hyperfine structure that can be used to store and process quantum information Lauritzen et al. (2012). We demonstrate cavity-enhanced low-temperature spectroscopy of a few-ion ensemble in a crystal where the size and thus the contained ion number is known. We estimate the achieved cavity enhancement and deduce the number of ions that contribute to the signal. The approach is promising for efficient single ion detection and could be a basis to realize quantum nodes for quantum communication and information processing.
II Single nanocrystal fluorescence, scattering and lifetime
We investigate the properties of nanocrystals with a confocal setup (air objective with NA=0.9) at room temperature to obtain reference values of optical properties and to optimize the integration of crystals into a microcavity with the aim to minimize scattering loss and maximize the light-matter coupling.
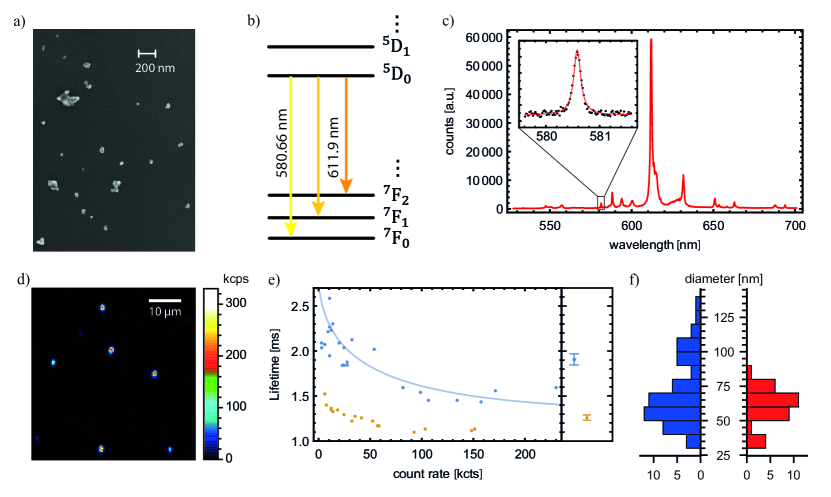
We study Eu3+:Y2O3 nanoparticles with an average size of nm synthesized by homogeneous precipitation de Oliveira Lima et al. (2015). Figure 1(a) shows a scanning electron micrograph of nanocrystals dispersed on a substrate. Figure 1(d) shows a confocal fluorescence image of individual nanocrystals spin-coated on a mirror. We excite under saturation conditions ( mW, NA) with nm light, which is close to the transition. The emission occurs from with several transitions into different spin-orbit ground state levels. Figure 1(b) shows a simplified scheme of the relevant levels and transitions studied here. We record spectra of individual crystals and assess the room-temperature linewidth of the transition, which gives a first impression of the crystal quality. Figure 1(c) shows a broadband fluorescence spectrum of a single crystal, and the inset shows the transition in high resolution. Even for nanocrystals with very low count rate, which are correspondingly small and thus compatible with cavity experiments, we observe a linewidth of GHz, which is as narrow as in bulk samples.
Next, we study a large number of isolated nanocrystals and infer the peak count rate per crystal. By looking at the count rate distribution and comparing with a size distribution obtained from SEM images such as the one shown in figure 1(a), we can get an order of magnitude estimate for the typical count rate per single ion. Figure 1(f) shows a histogram of the measured crystal size (red, right) and the expected crystal size distribution calculated from the measured fluorescence values (blue, left). Here we assume that the count rate and crystal radius are directly related via , where is the single ion count rate and the number of ions. From the size and doping concentration, and knowing that the Y concentration in the C2 site is , single crystals of e.g. 60 nm diameter contain ions. The two distributions match if we assume an excited state population of (several ground state levels are thermally populated, but only one is excited at about one saturation intensity) and an overall fluorescence detection efficiency of . This value is smaller than the expected maximally achievable detection efficiency of for our setup, which we calculate from the modified dipole emission pattern on a Bragg mirror averaged over dipole orientations, the angular collection efficiency of the microscope objective, the maximal transmission through the optics, and the detector quantum efficiency Benedikter et al. (2017). The smaller experimental value is ascribed to suboptimal collection and transmission efficiency and a potential overestimation of the excited state population. The analysis shows that we detect about 2 photons per second per ion, which at best could be increased to photons/s, rendering single ion experiments unpractical under free space conditions.
Two crucial aspects for the cavity experiment are the scattering loss introduced by the nanocrystal and the achievable ion-photon coupling strength, where the latter depends on the partially suppressed local electric field inside the crystal. Indeed, scattering loss and local field suppression both arise from the boundary condition introduced by the nanocrystal surface, and are related to modes outside or inside the crystal, respectively. In the Rayleigh regime , the scattering loss
| (1) |
can be calculated from the cavity mode waist and the scattering cross section
| (2) |
with the polarizability of the crystal Wind et al. (1987)
| (3) |
with and the refractive indices of the crystal and surrounding medium, the vacuum dielectric constant, and the volume of the crystal. It is apparent that particles embedded in a dielectric layer lead to a reduced scattering loss. For the case of Y2O3 particles () embedded in a PMMA layer (), the calculation above yields a reduction of by a factor of 6.7 compared to a crystal in air.
Furthermore, the presence of the nanocrystal and the surrounding dielectric sensitively influence the excited state lifetime of atomic dipoles inside, and thereby affect the light-matter coupling strength. For a nanocrystal far in the Rayleigh regime (diameter nm) embedded in a medium, the lifetime is given by Chew (1988); Le Kien et al. (2000); Schniepp and Sandoghdar (2002); Duan et al. (2005)
| (4) |
where is the lifetime in bulk Y2O3 and is the relative refractive index with the effective surrounding refractive index described by the medium refractive index and the filling factor Duan et al. (2005). The latter takes into account partially surrounding media, as is the case e.g. for a nanocrystal on a glass substrate. The resulting prolonged lifetime for small crystals is due to the boundary condition of the crystal-air interface, which makes the crystal act as an off-resonant cavity that suppresses the local field inside. According to equation 4, ions in small Y2O3 nanocrystals in air should show a lifetime . For larger crystals, calculations Le Kien et al. (2000); Duan et al. (2005) and measurements Schniepp and Sandoghdar (2002); Duan et al. (2005) show that decreases with size, and the presence of a surrounding dielectric further reduces .
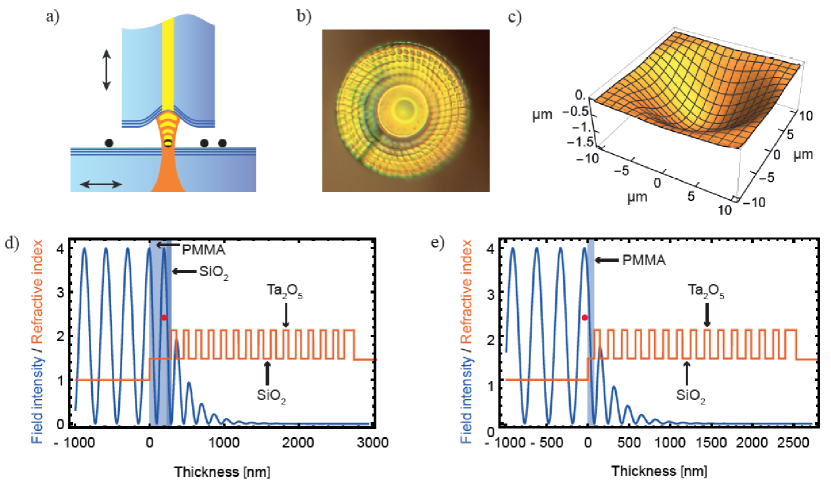
To estimate the effect of embedding, the calculations referred to above are not adequate for our situation, since we do not embed into a bulk medium but into a thin film on a mirror. We therefore perform finite difference time domain simulations (Lumerical) and analyze the spontaneous emission of a dipole located in a 80nm cube of Y2O3 on a Bragg mirror with embedding, see figure 2 (d). We find that the emission rate increases by up to a factor of 3.8 as compared to the dipole in a crystal in free space. This shows that embedding increases the local field strength within the crystal, and it will in the same way increase the coupling strength to the cavity field.
We experimentally study these effects for our sample. Figure 1(e) shows fluorescence lifetime measurements as function of the count rate for crystals prepared in two different ways. First, the particles are spin coated onto a fused silica substrate to serve as a reference. Second, we embed the particles into a PMMA layer on top of a dielectric mirror (see figure 2(d)). To ensure that the nanoparticle resides in a field maximum of the standing wave that will be formed in a cavity, a three-step preparation was used: First, a layer of 55 nm of SiO2 was applied to the mirror by electron beam evaporation. Then, nanocrystals are deposited on this layer and are thus centered on an electric field maximum. Third, a 235 nm thick layer of PMMA is spin-coated to cover the particles. The total optical thickness of the two layers of comparable refractive index is for the transition wavelength nm. For this thickness, a simulation of the electric field inside the layer Furman and Tikhonravov (1992) shows that it is as large as in the vacuum part of the cavity, thereby maximizing light-matter coupling (see figure 2(d)).
In the experiment, we observe the expected correlation between lifetime and count rate for both samples, when again assuming the relation between count rate and crystal size as discussed above. The solid line shown in figure 1(e) agrees with the measurement and is a fit to a prediction of the size-dependent lifetime of a dipole in the center of a dielectric sphere Le Kien et al. (2000),
| (5) |
with as given in equation (28) in Le Kien et al. (2000). Assuming a single central dipole reasonably approximates the continuous ion distribution in the nanocrystals as long as nm. We use the filling factor as a fit parameter and obtain best agreement for . This value is smaller than expected, such that other factors that reduce the lifetime in addition to the presence of the substrate cannot be excluded.
We can also observe the effect of embedding the crystals in a thin film, which leads to a marked reduction of the lifetime in the measurement Khalid et al. (2015). The right panel of Fig. 1(e) shows the lifetime for the two cases averaged over all crystals, and we observe an averaged lifetime reduction by a factor of 1.5 for the embedded sample, which features a lifetime of ms as compared to ms for the sample on silica. The observed average lifetime reduction is in agreement with the FDTD simulation when considering that the simulation compares a crystal in free space with an embedded one, while the measurement compares crystals on a substrate with embedded ones. If we rely on the model used for the fit of the lifetime data, we can use the ratio to calculate the expected lifetime in air for the measured data. With this, we obtain an overall lifetime reduction compared to a crystal in air of , close to the FDTD prediction.
III Cavity properties
The main goal of our work is to achieve cavity enhancement of the fluorescence to obtain efficient access to small ensembles and finally individual ions. To realize such a setting, we have developed a fully tunable, cryogenic-compatible Fabry-Perot microcavity as schematically shown in Figure 2(a). The setup allows us to locate suitable nanocrystals inside the cavity, and to set the mirror separation to a particular longitudinal mode order to achieve resonance conditions with the ions. The microcavity consists of a macroscopic planar mirror and a concave micro mirror at the end facet of a single-mode optical fiber. The micro mirror is fabricated by -laser machining Hunger et al. (2012), where we produce a concave profile with a radius of curvature of m and depth of m. The fiber tip is furthermore shaped into a conical tip to reduce the tip diameter to m, which enables a smallest mirror separation of m, see figure 2 (b,c). The fiber and the planar mirror are then coated to have a transmission of ppm at nm as specified and measured by the coating manufacturer. The fiber is mounted on a shear piezoelectric actuator for cavity length stabilization, while the large mirror is mounted on a commercial closed-loop three-axis attocube nanopositioning stage.
The finesse of the cavity is measured to be with a variation of depending on the particular fundamental longitudinal mode, values which are in agreement with simulation and calculations, see below. The variation of the finesse originates from mode mixing between the fundamental and higher order modes due to the non-spherical shape of the concave structure Benedikter et al. (2015). From the finesse measurement and the known mirror transmission, we can deduce the residual scattering and absorption losses of the mirrors and obtain a value ppm.
When the cavity is tuned on resonance, a Purcell factor of is expected for a cavity with a length of m, which for quantifies the enhancement of fluorescence of a particular transition. The coherent can thus be significantly enhanced, however due to its small branching ratio 1/60, the lifetime change is correspondingly smaller, and a Purcell factor is expected. In the experiments described here, we were not yet able to stabilize the cavity on resonance in the cryostat, and we investigate an alternative approach, which is less sensitive to the cavity resonance condition. We use the transition for excitation and the transition for emission, both being simultaneously resonant with the cavity. More detail is given below. This scheme provides high scattering rates also without optimal Purcell enhancement, and reduced background due to the wavelength separation of excitation and detection.
IV Cavity-enhanced spectroscopy
To perform low-temperature spectroscopy, we introduce a mirror carrying nanocrystals in the cavity and cool it down to 8 K. Since the experiments were performed in parallel with the nanocrystal studies described above, an earlier version of sample preparation was used. Here, the particles are not embedded within PMMA but reside on top of a PMMA spacer layer, whose thickness is chosen to locate the nanocrystals in an electric field maximum of the cavity modes, see Figure 2(e). To spatially locate a well-isolated crystal of suitable size within the cavity mode, we measure the scattering loss signal of nanocrystals by scanning cavity microscopy Mader et al. (2015). We evaluate the cavity transmission at nm, which is given by
| (6) |
where accounts for the additional scattering loss introduced by the crystal, ppm is the fiber mirror transmission, ppm the planar mirror transmission, which is increased due to the spacer layer, and ppm the average mirror loss. We calculate from a transfer matrix model Furman and Tikhonravov (1992) that also reproduces , and find from the empty cavity finesse measurement. From the uncertainty of the finesse measurement we find an uncertainty for of , and a similar value for . From the scattering loss (Equation 1) and the mode waist we calculate the scattering cross section and the volume of the crystal with radius .
We select crystals that are large enough to provide a suitable ion ensemble for fluorescence measurements, but small enough to maintain the out-coupling efficiency of the fluorescence light from the cavity
| (7) |
at a high level. Figure 3(a) shows the scattering loss of a single crystal when scanning the cavity mode across it at a cavity length m. The shape represents the cavity mode, while the asymmetry is due to a miscalibration of the nanopositioning stage at short length scales. From the peak loss ppm observed for perfect spatial alignment, for which , we can calculate the crystal size and obtain a value of nm. Together with the doping concentration of , this allows us to estimate the number of ions contained in the crystal, yielding ions in this case.
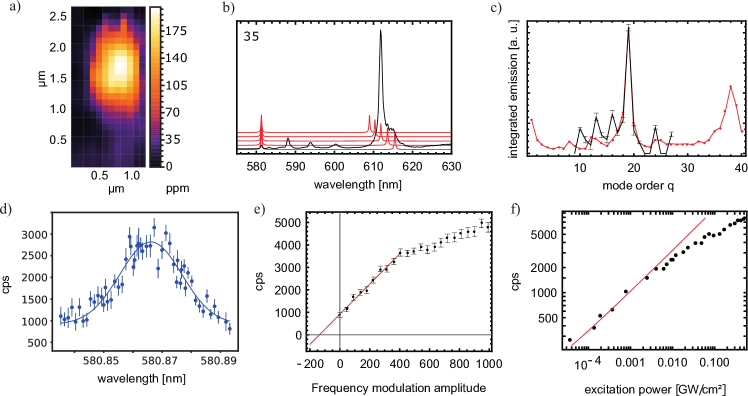
To obtain a fluorescence signal from the cavity, we take advantage of the dominant emission of the transition at nm, which provides larger signals also for an unstabilized cavity. We excite the transition at nm and couple the emission of the transition to the cavity. This detection scheme requires having the cavity resonant with both the excitation light at nm and the emission light at nm. Figure 3(b) shows the principle of the scheme, where the Eu3+spectrum is overlapped with the cavity resonances at nm and nm, where at the former wavelength, the longitudinal cavity mode order is varied from . For , both nm and nm light are resonant. Figure 3(c) shows a calculation and a measurement of the count rate as a function of mode order for nm cavity excitation. To perform the measurement, the cavity length was tuned to a particular mode order , and modulated around the set value with an amplitude close to 4nm, which is more than 250 cavity linewidths GHz at nm, with a rate of Hz. We use a single photon counter to collect the fluorescence light from the cavity, and we perform time resolved counting synchronized with the modulation. We make a histogram of the detected counts with a bin size corresponding to about , and evaluate the averaged peak count rate per bin after several seconds of data acquisition.
Next, we perform spectroscopy of the transition. We set the cavity length to and measure the count rate as describe above as a function of the laser wavelength across the range of the inhomogeneous line of the transition. Figure 3(d) shows the obtained spectrum. We fit it with a Gaussian profile and find a FWHM linewidth of 22 GHz, which agrees very well with the linewidth in bulk samples at this doping concentration, and thereby confirms the high crystal quality Kunkel et al. (2015). We note that this represents the first low-temperature spectroscopy of a single Eu3+:Y2O3 nanocrystal of such a small size.
To understand the origin of the observed spectrum, we estimate the number of ions in the crystal within the frequency interval of the homogeneous linewidth of a single ion. We assume a Gaussian spectral ion density and neglect the hyperfine structure. With ions in the crystal with an expected homogeneous linewidth of about kHz at K Bartholomew et al. (2017) spread over an inhomogeneous linewidth of GHz. This estimate leads to a peak density , i.e. the ion transitions are spaced by about four linewidths, and low power spectroscopy would in most cases address no or at most a single ion.
To obtain the observed signal, we use a very high excitation intensity (several GW/cm2), which leads to strong power broadening, and thus off resonant excitation of small ion ensembles. To calibrate the amount of power broadening, we modulate the frequency of the excitation laser and measure the count rate as a function of the modulation amplitude (Figure 3e). We observe a linear signal increase up to an amplitude that approximately corresponds to the cavity linewidth. From an extrapolation of the linear dependence to zero count rate, we can estimate the power broadening. For the measurement shown, this amounts to MHz, taken at an intracavity power of mW and an intensity of GW/cm2.
We furthermore measure the count rate on resonance (without frequency modulation) as a function of the excitation power. The scattering rate of a two-level system is given by , and the power broadened linewidth scales with , where is the saturation parameter, the Rabi frequency, and the excited state decay rate. Figure 3(f) shows a measurement of the count rate as function of the excitation power. The observed power dependence follows the expected relation over a large range (red solid line). For the weakest accessible excitation power of mW, where we still have a significant signal to background ratio of , the excitation is a factor weaker than for the value used for the calibration, such that the broadening is a factor smaller, i.e. MHz. With an average spectral ion separation of kHz, this corresponds to probing ions. At this power level, we measure counts/s on resonance, such that the single ion count rate is approximately counts/s. This value is already larger than the estimated single-ion count rate for confocal detection, despite the fact that we collect only a single transition.
We can obtain an order of magnitude estimate of the achieved effective Purcell factor by comparing the total measured count rate with the expected free space scattering rate after estimating the collection and detection efficiencies and integrating over the power-broadened distribution. The emission rate in the cavity can be calculated from the inferred total count rate by s, where includes the detector quantum efficiency, the loss on the optical path, and the cavity outcoupling efficiency . Compared to the integrated free space scattering rate for the ensemble under the inferred power broadening, s with Hz the measured decay rate and MHz, we obtain . This shows a net improvement of the signal due to the cavity.
We can compare the observed value with an estimate of the theoretically achievable Purcell factor for this configuration. At the transition wavelength of nm, the cavity finesse amounts to , and for the double resonance condition at , the mode volume amounts to , such that for a branching ratio into the particular crystal field level as inferred from the spectrum. The linewidth of the transition is inferred from spectroscopy on a powder and estimated to be GHz. This is larger than the cavity linewidth GHz and reduces the achievable Purcell factor to , in agreement with the measured value.
V Conclusion
We have performed cavity-enhanced spectroscopy measurements of ensembles of a few Eu3+ions in an isolated nanocrystal. We characterized the crystal size, such that an estimation of important parameters such as the number of ions probed and the single ion count rate was possible. From an order of magnitude estimate, we infer an effective Purcell factor , evidencing the benefit of cavity enhancement. We have also shown that embedding the crystals in a thin film leads to an additional reduction of the lifetime, and calculations show a significant reduction of scattering loss.
A much larger enhancement is expected for an actively stabilized cavity which is continuously coupled to the transition for both excitation and detection. We are currently developing a custom-built nanopositioning stage with significantly improved passive stability, which has recently enabled us to stabilize the cavity on resonance during the entire cooling cycle of the cryostat, giving good prospects for future experiments. For a realistic cavity with and m, is expected, such that up to photons/s can be scattered into the cavity, enabling efficient single ion readout. This can open the way to address several individual Eu ions as a multi-qubit register with promising coherence properties. We are also exploring different materials including Er3+:Y2O3 , which has a narrow optical transition in the telecom band, ideal for long distance quantum communication applications.
Acknowledgements.
We acknowledge support from T. Bagci and Q. Unterreithmeier during early phases of the experiment. This work was partially funded by the European Union H2020 research and innovation programme under grant agreement No. 712721 (NanOQTech), and the DFG Cluster of Excellence Nanosystems Initiative Munich. T.W.H. acknowledges funding from the Max-Planck Foundation, B.C. acknowledges financial support from the Cellex ICFO-MPQ postdoctoral fellowship programme. ICFO is also supported by MINECO Severo Ochoa through grant SEV-2015-0522, by fundació Cellex, by CERCA Programme/Generalitat de Catalunya, and from the Spanish Ministerio de Economía y Competitividad (MINECO, FIS2016-81696-ERC).References
- Goldner et al. (2015) P. Goldner, A. Ferrier, and O. Guillot-Noël, edited by J.-C. G. Bünzli and V. K. Pecharsky, Chapter 267 - Rare Earth-Doped Crystals for Quantum Information Processing, Handbook on the Physics and Chemistry of Rare Earths, Vol. 46 (Elsevier, 2015) pp. 1 – 78.
- Zhong et al. (2015) M. Zhong, M. P. Hedges, R. L. Ahlefeldt, J. G. Bartholomew, S. E. Beavan, S. M. Wittig, J. J. Longdell, and M. J. Sellars, Nature 517, 177 (2015).
- Kolesov et al. (2013) R. Kolesov, K. Xia, R. Reuter, M. Jamali, R. Stöhr, T. Inal, P. Siyushev, and J. Wrachtrup, Physical review letters 111, 120502 (2013).
- Laplane et al. (2015) C. Laplane, P. Jobez, J. Etesse, N. Timoney, N. Gisin, and M. Afzelius, New Journal of Physics 18, 013006 (2015).
- Gündoğan et al. (2015) M. Gündoğan, P. M. Ledingham, K. Kutluer, M. Mazzera, and H. de Riedmatten, Physical review letters 114, 230501 (2015).
- Böttger et al. (2009) T. Böttger, C. Thiel, R. Cone, and Y. Sun, Physical Review B 79, 115104 (2009).
- Ohlsson et al. (2002) N. Ohlsson, R. K. Mohan, and S. Kröll, Optics communications 201, 71 (2002).
- Longdell et al. (2004) J. Longdell, M. Sellars, and N. Manson, Physical review letters 93, 130503 (2004).
- Kolesov et al. (2012) R. Kolesov, K. Xia, R. Reuter, R. Stöhr, A. Zappe, J. Meijer, P. Hemmer, and J. Wrachtrup, Nature communications 3, 1029 (2012).
- Utikal et al. (2014) T. Utikal, E. Eichhammer, L. Petersen, A. Renn, S. Götzinger, and V. Sandoghdar, Nature communications 5, 3627 (2014).
- Nakamura et al. (2014) I. Nakamura, T. Yoshihiro, H. Inagawa, S. Fujiyoshi, and M. Matsushita, Scientific reports 4, 7364 (2014).
- Siyushev et al. (2014) P. Siyushev, K. Xia, R. Reuter, M. Jamali, N. Zhao, N. Yang, C. Duan, N. Kukharchyk, A. Wieck, R. Kolesov, et al., Nature communications 5, 3895 (2014).
- Dibos et al. (2017) A. Dibos, M. Raha, C. Phenicie, and J. Thompson, arXiv preprint arXiv:1711.10368 (2017).
- Zhong et al. (2018) T. Zhong, J. M. Kindem, J. G. Bartholomew, J. Rochman, I. Craiciu, V. Verma, S. W. Nam, F. Marsili, M. D. Shaw, A. D. Beyer, et al., arXiv preprint arXiv:1803.07520 (2018).
- Zukowski et al. (1993) M. Zukowski, A. Zeilinger, M. A. Horne, and A. K. Ekert, Physical Review Letters 71, 4287 (1993).
- Pan et al. (1998) J.-W. Pan, D. Bouwmeester, H. Weinfurter, and A. Zeilinger, Physical Review Letters 80, 3891 (1998).
- Olmschenk et al. (2009) S. Olmschenk, D. Matsukevich, P. Maunz, D. Hayes, L.-M. Duan, and C. Monroe, Science 323, 486 (2009).
- Hunger et al. (2010) D. Hunger, T. Steinmetz, Y. Colombe, C. Deutsch, T. W. Hänsch, and J. Reichel, New Journal of Physics 12, 065038 (2010).
- Benedikter et al. (2017) J. Benedikter, H. Kaupp, T. Hümmer, Y. Liang, A. Bommer, C. Becher, A. Krueger, J. M. Smith, T. W. Hänsch, and D. Hunger, Physical Review Applied 7, 024031 (2017).
- Perrot et al. (2013) A. Perrot, P. Goldner, D. Giaume, M. Lovrić, C. Andriamiadamanana, R. Gonçalves, and A. Ferrier, Physical review letters 111, 203601 (2013).
- Bartholomew et al. (2017) J. G. Bartholomew, K. de Oliveira Lima, A. Ferrier, and P. Goldner, Nano letters 17, 778 (2017).
- Serrano et al. (2017) D. Serrano, J. Karlsson, A. Fossati, A. Ferrier, and P. Goldner, arXiv preprint arXiv:1711.03934 (2017).
- Lauritzen et al. (2012) B. Lauritzen, N. Timoney, N. Gisin, M. Afzelius, H. de Riedmatten, Y. Sun, R. Macfarlane, and R. Cone, Physical Review B 85, 115111 (2012).
- de Oliveira Lima et al. (2015) K. de Oliveira Lima, R. R. Gonçalves, D. Giaume, A. Ferrier, and P. Goldner, Journal of Luminescence 168, 276 (2015).
- Wind et al. (1987) M. Wind, J. Vlieger, and D. Bedeaux, Physica A: Statistical Mechanics and its Applications 141, 33 (1987).
- Chew (1988) H. Chew, Physical Review A 38, 3410 (1988).
- Le Kien et al. (2000) F. Le Kien, N. H. Quang, and K. Hakuta, Optics communications 178, 151 (2000).
- Schniepp and Sandoghdar (2002) H. Schniepp and V. Sandoghdar, Physical review letters 89, 257403 (2002).
- Duan et al. (2005) C.-K. Duan, M. F. Reid, and Z. Wang, Physics Letters A 343, 474 (2005).
- Furman and Tikhonravov (1992) S. A. Furman and A. Tikhonravov, Basics of optics of multilayer systems (Atlantica Séguier Frontieres, 1992).
- Khalid et al. (2015) A. Khalid, K. Chung, R. Rajasekharan, D. W. Lau, T. J. Karle, B. C. Gibson, and S. Tomljenovic-Hanic, Scientific reports 5, 11179 (2015).
- Hunger et al. (2012) D. Hunger, C. Deutsch, R. J. Barbour, R. J. Warburton, and J. Reichel, Aip Advances 2, 012119 (2012).
- Benedikter et al. (2015) J. Benedikter, T. Hümmer, M. Mader, B. Schlederer, J. Reichel, T. W. Hänsch, and D. Hunger, New Journal of Physics 17, 053051 (2015).
- Mader et al. (2015) M. Mader, J. Reichel, T. W. Hänsch, and D. Hunger, Nature communications 6, 7249 (2015).
- Kunkel et al. (2015) N. Kunkel, A. Ferrier, C. W. Thiel, M. O. Ramírez, L. E. Bausa, R. L. Cone, A. Ikesue, and P. Goldner, APL Materials 3, 096103 (2015).