Superconductivity in Cage Compounds LaAl20 with = Ti, V, Nb, and Ta
Abstract
Electrical resistivity, magnetic susceptibility, and specific heat measurements on single crystals of LaAl20 ( = Ti, V, Nb, and Ta) revealed that these four compounds exhibit weak-coupling superconductivity with transition temperatures = 0.46, 0.15, 1.05, and 1.03 K, respectively. LaTi2Al20 is most probably a type-I superconductor, which is quite rare among intermetallic compounds. Single-crystal X-ray diffraction suggests “rattling” anharmonic large-amplitude oscillations of Al ions (16 site) on the Al16 cage, while no such feature is suggested for the cage-center La ion. Using a parameter quantifying the “guest free space” of the cage-center ion, we demonstrate that nonmagnetic Al20 superconductors are classified into two groups, i.e., (A) and correlates with , and (B) and seems to be governed by other factors.
Intermetallic compounds ( : rare earth, : transition metals, : Al, Zn, and Cd), which crystallize in the cubic CeCr2Al20-type structure (, ), have attracted considerable attention in recent years, because a wide variety of strongly correlated electron phenomena caused by strong - hybridization have been observed. YbCo2Zn20 is a heavy fermion (HF) compound with an electronic specific heat coefficient of 8 J/(mol K2), which is the largest among Yb compounds [1]. SmAl20 ( = Ti, V, Cr, and Ta) exhibit rare Sm-based HF behaviors, which are anomalously field-insensitive [2, 3, 4]. Many of the Pr compounds have a non-Kramers doublet crystalline-electric-field ground state, and exhibit quadrupole Kondo lattice behaviors [5, 6, 7, 8]. Therefore, it is presumed that the superconductivity (SC) appearing in the Pr compounds is induced by quadrupolar fluctuations [9, 10, 11, 12].
The SC appearing in with nonmagnetic ions has been discussed in terms of the cage structure, which is one of the characteristic features of the CeCr2Al20-type crystal structure. The ions at the site with cubic symmetry are located at the center of an cage (CN 16 Frank-Kasper polyhedron). In V2Al20 with = Al and Ga (the SC transition temperatures are 1.49 and 1.66 K, respectively), the cage-center ions show anharmonic large-amplitude oscillations, which are considered to enhance through the electron-phonon coupling [13, 15, 14, 16]. Similar discussions have also been made for = Sc, Y, Lu, and La [17].
In contrast, compounds with = Zn have different characteristics of lattice oscillations. LaZn20 with = Ru, Ir, and Os show structural phase transitions at 150, 200, and 151 K, followed by SC transitions at 0.2, 0.6, and 0.07 K, respectively [18, 19]. Inelastic X-ray scattering measurements and a first-principle calculation suggest that the structural transitions are associated with the low-frequency vibrations of Zn at the site on the cage [20, 21]. The relation between the structural phase transition and SC in these compounds is yet to be understood.
For = Al, the physical properties have not been fully investigated yet, except V mentioned above. In this paper, we report our studies on LaAl20 ( = Ti, V, Nb, and Ta) using single crystals, which reveal that these compounds exhibit superconductivity.
Single crystals of LaAl20 ( Ti, V, Nb, and Ta) were grown using the self-Al flux method. The starting materials were La chips (99.9), Al grains (99.99) and powders of Ti (99.99), V (99.9), Nb (99.9) and Ta (99.95). With an atomic ratio of La::Al = 1:2:90, the starting materials were put in an alumina crucible and sealed in a quartz tube. The quartz tube was heated to 1050 oC and then was slowly cooled. Single crystals were obtained by spinning the ampoule in a centrifuge in order to remove the excess Al flux.
The electrical resistance and specific heat were measured using a Quantum Design (QD) Physical Property Measurement System (PPMS) equipped with a Helium-3 cryostat and an adiabatic demagnetization refrigerator (ADR). The ac magnetic susceptibility was measured by a mutual inductance method [22] down to 0.18 K with a modulation field of = 0.3 Oe using a 3He-4He dilution refrigerator.
| LaTi2Al20 | 2.46, 4.88 | ||||
|---|---|---|---|---|---|
| (227) (origin choice 2) | 14.7946(15) , 3238.2(6) | ||||
| Position | |||||
| Atom | site | () | |||
| La | 1/8 | 1/8 | 1/8 | 0.62(2) | |
| Ti | 1/2 | 1/2 | 1/2 | 0.39(3) | |
| Al(1) | 0.05910(6) | 0.05910(6) | 0.3257(8) | 0.88(2) | |
| Al(2) | 0.48709(12) | 1/8 | 1/8 | 0.67(3) | |
| Al(3) | 0 | 0 | 0 | 1.65(6) | |
| LaV2Al20 | 2.30, 4.96 | ||||
| (227) (origin choice 2) | 14.6125(15) , 3120.1(6) | ||||
| Position | |||||
| Atom | site | () | |||
| La | 1/8 | 1/8 | 1/8 | 0.72(2) | |
| V | 1/2 | 1/2 | 1/2 | 0.29(3) | |
| Al(1) | 0.05871(8) | 0.05871(8) | 0.32618(6) | 0.71(2) | |
| Al(2) | 0.4871(11) | 1/8 | 1/8 | 0.52(3) | |
| Al(3) | 0 | 0 | 0 | 1.57(4) | |
| LaNb2Al20 | 2.44, 4.94 | ||||
| (227) (origin choice 2) | 14.8180(15) , 3253.6(6) | ||||
| Position | |||||
| Atom | site | () | |||
| La | 1/8 | 1/8 | 1/8 | 0.66(2) | |
| Nb | 1/2 | 1/2 | 1/2 | 0.41(2) | |
| Al(1) | 0.05949(7) | 0.05949(7) | 0.32431(10) | 0.88(3) | |
| Al(2) | 0.48547(14) | 1/8 | 1/8 | 0.74(4) | |
| Al(3) | 0 | 0 | 0 | 1.77(7) | |
| LaTa2Al20 | 1.62, 3.45 | ||||
| (227) (origin choice 2) | 14.8231(13) , 3257.0(5) | ||||
| Position | |||||
| Atom | site | () | |||
| La | 1/8 | 1/8 | 1/8 | 0.61(2) | |
| Ta | 1/2 | 1/2 | 1/2 | 0.332(14) | |
| Al(1) | 0.05946(8) | 0.05946(8) | 0.32445(11) | 0.82(3) | |
| Al(2) | 0.48536(15) | 1/8 | 1/8 | 0.68(4) | |
| Al(3) | 0 | 0 | 0 | 1.57(8) | |
Single crystal X-ray diffraction analysis was performed using a Rigaku XtaLABmini with graphite monochromated Mo-Kα radiation. The structural parameters refined using the program SHELXL [23] are shown in Table 1. The lattice parameters are close to those in the previous reports [24, 25]. Note that the equivalent isotropic atomic displacement parameters of Al(3) at the 16 site have relatively large values: . This feature is characteristic to compounds; see Refs.[26, 27] for = Al and Refs. [9, 20, 21] for = Zn. The cage-center La ions at the 8 site have normal values of , in contrast to V2Al20 ( = Al and Ga), in which the cage-center ions are suggested to have anharmonic rattling modes [13, 15, 14, 16].

The temperature dependence of resistivity divided by (300 K) is shown in Fig. 1(a). Note that it is difficult to obtain the absolute values of due to the smallness (typically mm in length) of the grown single crystals. The residual resistivity ratio is (300 K)/(1.2 K) = 41.2 for Ti, (300 K)/(1.8 K) = 9.5 for Nb, (300 K)/(1.8 K) = 9.2 for Ta, and (300 K)/(0.2 K) = 5.4 for V. Figures 1(b-e) show the low-temperature expansion of data for each compound. In zero field, all the compounds show SC transitions at 0.30, 0.15, 1.15, and 1.10 K (determined by the 50% transition in ) for = Ti, V, Nb, and Ta, respectively. These values are slightly different from those determined by the thermodynamic quantities as shown below. In the applied fields, the transition temperature shifts to lower temperatures. The superconductivity is completely suppressed in 1 kOe above 0.4 K.
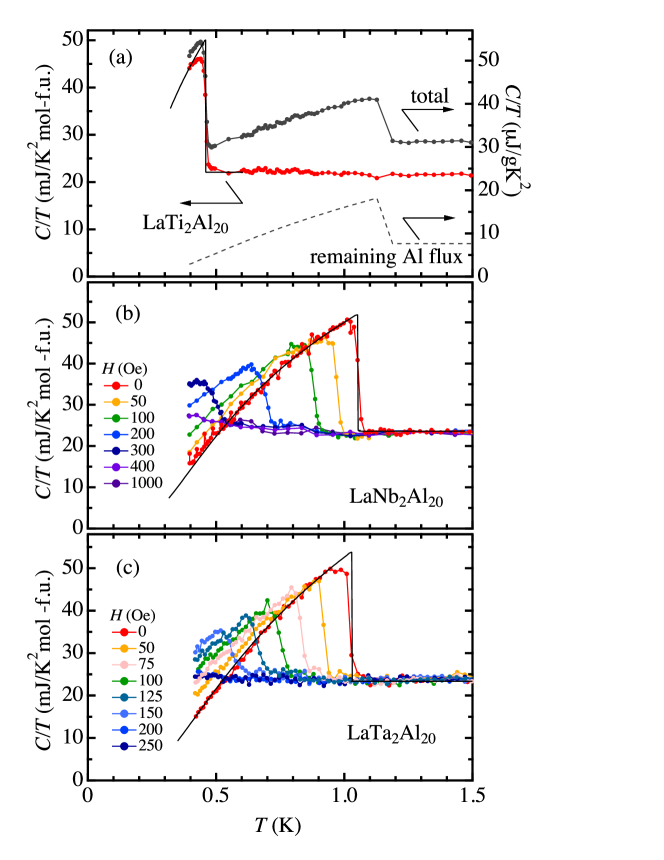
Figure 2 shows the temperature dependence of specific heat divided by temperature. A clear specific heat jump appears at 0.46 K (Ti), 1.05 K (Nb) and 1.03 K (Ta), which is referred to as the bulk SC transition temperature hereinafter. Considering that we used 3-7 pieces of single crystals for the measurements, the small transition width indicates high degree of uniformity of the SC phase in the crystals. For LaTi2Al20, a jump appears at 1.14 K, indicating Al-flux inclusion in the crystal. Using data obtained for Al metal, the contribution from LaTi2Al20 is separated as shown in Fig. 2.
The normal-state data below 5 K can be described by , where and are the electronic and phonon specific heat coefficients, respectively. The specific heat jump at the SC transition )/ is 1.26, 1.25, and 1.36 for Ti, Nb, and Ta, respectively. These values are close to and slightly smaller than 1.43 expected from the BCS theory, indicating that they are weak-coupling superconductors. The fitting of the data by the model [29, 28] is shown by the thin curve in Fig. 2. The obtained value is 1.67, 1.62, and 1.70 for Ti, Nb, and Ta, respectively, which is smaller than 1.764 expected from the BCS theory. This feature indicates that the size of the SC gap differs slightly in each of the multiple conduction bands.
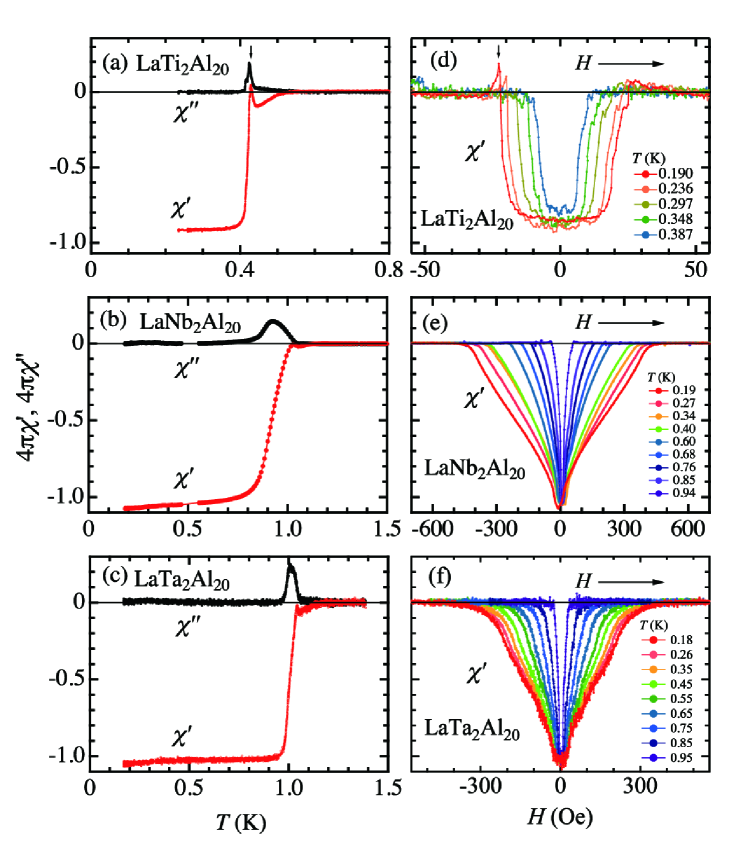
The temperature dependence of ac magnetic susceptibility is shown in Figs. 3 (a-c). The real-part shows that the superconducting volume fraction reaches approximately 100, confirming that the SC in La2Al20 is of bulk nature. Considering that we used 10-20 pieces of single crystals for the measurements, the small transition width indicates high degree of uniformity of the SC phase in the crystals. Figures 3 (d-f) show the magnetic field dependence of at several selected temperatures. With decreasing temperature, the onset of the SC transition shifts to higher fields.
| compounds | LaTi2Al20 | LaV2Al20 | LaNb2Al20 | LaTa2Al20 | ScV2Al20 [17] | YV2Al20 [17] | LuV2Al20 [17] |
|---|---|---|---|---|---|---|---|
| (K) | 0.46(1) | 0.15(2) | 1.05(2) | 1.03(2) | 1.00 | 0.60 | 0.57 |
| (mJ/molK2) | 22 | 19.6 [17] | 23.4 | 22.1 | 29.68 | 26.46 | 30.05 |
| (mJ/molK2) | 17.4 [43] | – | – | – | 21.2 | 18.5 | |
| 1.67(1) | – | 1.62(2) | 1.70(2) | 1.78 | 1.65 | 1.68 | |
| 1.26 | – | 1.25 | 1.36 | 1.46 | 1.24 | 1.29 | |
| (K) | 510 [44] | 525 [17] | 505 | 480 | 536 | 516 | 502 |
| 0.376 | 0.34 | 0.414 | 0.418 | 0.41 | 0.39 | 0.39 | |
| (0) (Oe) | 25 | – | 57 | 56 | 66 | 36 | 37 |
| (Oe/K) | – | – | -586 | -390 | -4820 | -670 | -5010 |
| (0) (Oe) | – | – | 449 | 292 | 3330 | 280 | 2070 |
| () | – | – | 856 | 1060 | 314 | 1084 | 399 |
| – | – | 3.2 | 2.2 | 20.6 | 3.4 | 22.6 | |
| () | – | – | 2760 | 2310 | 6450 | 3650 | 9020 |
| (0) (Oe) | – | – | 15 | 14 | 7 | 9 | 4 |
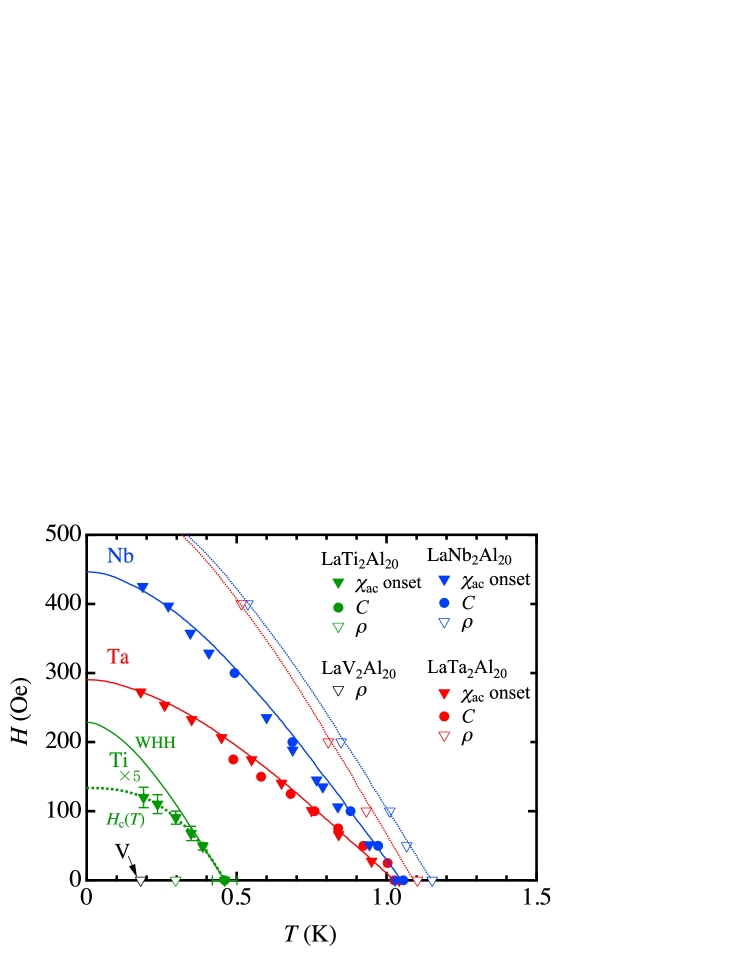
Using the and data measured in applied fields, the SC phase diagram is constructed as shown in Fig. 4. The two sets of the SC boundary data agree well with each other. is much lower than the Pauli-limiting field = (1.84 Oe/K) [33], suggesting that is determined by the orbital depairing effect. The temperature dependence of can be well described by the Werthamer-Helfand-Hohenberg (WHH) clean-limit expression [30, 31], as shown by the solid curves in Fig. 4. In this model, at satisfies
| (1) |
where and are the quantum magnetic flux and the Ginzburg-Landau (GL) coherence length, respectively. The GL parameter , which is equal to the Maki parameter [34] , is determined using the thermodynamic relation [35]:
| (2) |
where is measured per unit volume [unit: erg/(K cm3)], and for a triangular vortex lattice. The thermodynamic critical field [29], the London penetration depth , and the lower critical field are also calculated. The obtained characteristic parameters are summarized in Table 2.
The SC properties of LaTi2Al20, which are significantly different from the others, strongly suggest that it is a type-I superconductor. (1) The SC phase boundary is well described by rather than the WHH model; the best fit parameters are ( is expected for a conventional type-I SC) and Oe, which agrees well with Oe. (2) The Meissner state ( const.) dominates and extends over a large range in the SC phase (see Fig. 3). (3) Positive peaks appear in at the SC phase boundary (i.e., ), which are ascribable to the ”differential paramagnetic effect (DPE)” often observed in type-I superconductors [36, 37, 38]. Note that most known type-I superconductors are pure metals and only a handful are reported among compounds and alloys.
The electron-phonon coupling constant is obtained using the modified McMillan’s formula
| (3) |
where the Coulomb coupling constant is assumed to be 0.13 [39] and the Debye temperature is obtained from ( is the number of atoms per formula unit and is the gas constant). The fact that ranges between 0.34 and 0.42 is consistent with the above-mentioned weak-coupling nature of the superconductivity in Al20.
One of the important features here is that the large distribution of ( = 0.15-1.05 K) is mainly caused by the different ( = 0.34-0.42) in LaAl20. Note that correlates strongly with but not with , which is determined below 5 K. This fact suggests that acoustic phonons are not playing a major role in the Cooper pairing.
For LaTi2Al20, the mass enhancement factor is 1.26, which is slightly smaller than the expected . These values are in good agreement with a de Haas-van Alphen (dHvA) experiment, which showed that the cyclotron mass is approximately 1.2 times larger than that obtained from a band structural calculation [40, 41].
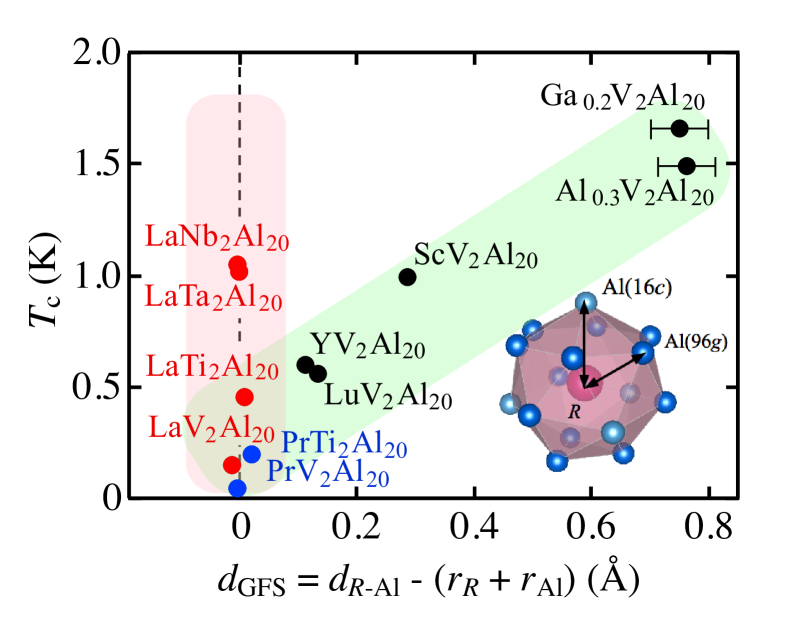
Here, we examine the crystallographic features of the Al16 cage, which includes a La ion at the center ( site). For Al20 with lanthanide ions, it is considered that a guest ion does not have a free space around it inside the Al16 cage as suggested by the fact that the lattice parameter depends almost linearly on the covalent radius of the lanthanide ion [17]. On the contrary, for Ga, Al, Sc and Lu, (= 14.49-14.51 ) is almost independent of , which is smaller than those for lanthanide ions, suggesting the existence of a free space around the ions. Some of the anomalous SC properties observed for Ga, Al, Sc and Lu are attributable to the “rattling” anharmonic low-frequency vibrations of the ions, which are considered to couple strongly with conduction electrons and to enhance [13, 15, 14, 16, 17].
We introduce a parameter to quantify the “guest free space” as , where is the average distance between and Al in a cage (see the inset of Fig. 5), and and are the covalent radii for and Al ions, respectively [42]. is calculated using the results of the single-crystal X-ray diffraction analysis shown in Table 1. is plotted as a function of in Fig. 5 for Al20 with nonmagnetic ions. For = V, increases almost linearly with . This behavior agrees well with the interpretation that is enhanced by the “rattling” anharmonic vibration modes of Ga, Al, Sc, and Lu ions. In contrast, the four data points of the present study fall almost into a vertical line with , indicating that these La compounds do not have guest free space and the large distribution is not associated with the La ion oscillations. We speculate that the distribution may be caused by differences in (i) anharmonic large-amplitude vibration modes of Al(16c) ions and/or (ii) characteristics of the electrons of ions (, stronger spin-orbit interaction for and than ).
In summary, we have grown single crystals of LaAl20 ( = Ti, V, Nb, and Ta) and have revealed that they are new weak-coupling superconductors. The single-crystal X-ray diffraction analyses have clarified that they form a group of superconductors characterized by no “guest free space” for the cage-center La ions.
This work was supported by MEXT/JSPS KAKENHI grants 15H03693, 15H05884, 15J07600, and 15K05178.
References
- [1] M. S. Torikachvili, S. Jia, E. D. Mun, S. T. Hannahs, R. C. Black, W. K. Neils, D. Martien, S. L. Bud′ko, and P. C. Canfield, Proc. Natl. Acad. Sci. U.S.A. 104, 9960 (2007).
- [2] R. Higashinaka, T. Maruyama, A. Nakama, R. Miyazaki, Y. Aoki, and H. Sato, J. Phys. Soc. Jpn. 80, 093703 (2011).
- [3] A. Sakai and S. Nakatsuji, Phys. Rev. B 84, 201106(R) (2011).
- [4] A. Yamada, R. Higashinaka, R. Miyazaki, K. Fushiya, T. D. Matsuda, Y. Aoki, W. Fujita, H. Harima, and H. Sato, J. Phys. Soc. Jpn. 82, 123710 (2013).
- [5] A. Sakai and S. Nakatsuji, J. Phys. Soc. Jpn. 80, 063701 (2011).
- [6] T. Onimaru and H. Kusunose, J. Phys. Soc. Jpn. 85, 082002 (2016).
- [7] T. Yoshida, Y. Machida, K. Izawa, Y. Shimada, N. Nagasawa, T.Onimaru, T. Takabatake, A. Gourgout, A. Pourret, G. Knebel, and J.-P.Brison, J. Phys. Soc. Jpn. 86, 044711 (2017).
- [8] R. Higashinaka, A. Nakama, R. Miyazaki, J. Yamaura, H. Sato, and Y. Aoki, J. Phys. Soc. Jpn. 86, 103703 (2017).
- [9] T. Onimaru, K. T. Matsumoto, Y. F. Inoue, K. Umeo, T. Sakakibara, Y. Karaki, M. Kubota, and T. Takabatake, Phys. Rev. Lett. 106, 177001 (2011).
- [10] A. Sakai, K. Kuga, and S. Nakatsuji, J. Phys. Soc. Jpn. 81, 083702 (2012).
- [11] K. Matsubayashi, T. Tanaka, A. Sakai, S. Nakatsuji, Y. Kubo, and Y. Uwatoko, Phys. Rev. Lett. 109, 187004 (2012).
- [12] M. Tsujimoto, Y. Matsumoto, T. Tomita, A. Sakai, and S. Nakatsuji, Phys. Rev. Lett. 113, 267001 (2014).
- [13] Z. Hiroi, A. Onosaka, Y. Okamoto, J. Yamaura, and H. Harima, J. Phys. Soc. Jpn. 81, 124707 (2012).
- [14] D. J. Safarik, T. Klimczuk, A. Llobet, D. D. Byler, J. C. Lashley, J. R. O’Brien, and N. R. Dilley, Phys. Rev. B 85, 014103 (2012).
- [15] A. Onosaka, Y. Okamoto, J. Yamaura, and Z. Hiroi, J. Phys. Soc. Jpn. 81, 023703 (2012).
- [16] M. M. Koza, A. Leithe-Jasper, E. Sischka, W. Schnelle, H. Borrmann, H. Mutka, and Y. Grin, Phys. Chem. Chem. Phys. 16, 27119 (2014).
- [17] M. J. Winiarski, B. Wiendlocha, M. Sternik, P. Winiewski, J. R. O’Brien, D. Kaczorowski, and T. Klimczuk, Phys. Rev. B 93, 134507 (2016).
- [18] T. Onimaru, K. T. Matsumoto, Y. F. Inoue, K. Umeo, Y. Saiga, Y. Matsushita, R. Tamura, K. Nishimoto, I. Ishii, T. Suzuki, and T. Takabatake, J. Phys. Soc. Jpn. 79, 033704 (2010).
- [19] K. Wakiya, T. Onimaru, K. Matsumoto, Y. Yamane, N. Nagasawa, K. Umeo, S. Kittaka, T. Sakakibara, Y. Matsushita, and T. Takabatake, J. Phys. Soc. Jpn. 86, 034707 (2017).
- [20] T. Hasegawa, N. Ogita, and M. Udagawa: J. Phys. Conf. Ser. 391 (2012) 012016.
- [21] K. Wakiya, T. Onimaru, S. Tsutsui, T. Hasegawa, K. T. Matsumoto, N. Nagasawa, A. Q. R. Baron, N. Ogita, M. Udagawa, and T. Takabatake, Phys. Rev. 93, 064105 (2016).
- [22] The susceptometer consists of a magnetizing (primary) coil and two identical pick-up (secondary) coils connected in series opposition. The generated ac voltage across the pick-up coils, which is proportional to of a sample centered in one of the secondary coils, was measured using an ac resistance bridge LR-700 (Linear Research Inc.). The absolute values of is calculated considering the geometry of the coils [see, e.g., R. B. Goldfarb and J. V. Minervini, Rev. Sci.Instrum. 55, 761 (1984)].
- [23] G. M. Sheldrick, Acta Cryst. A64 , 112 (2008).
- [24] S. Niemann and W. Jeitschko, J. Solid State Chem. 114, 337 (1995).
- [25] V. M. T. Thiede, W. Jeitschko, S. Niemann, and T. Ebel, J. Alloys Compd. 267, 23 (1998).
- [26] T. Nasch, W. Jeitschko, and U. C. Rodewald, Z. Naturforsch. B 52, 1023 (1997).
- [27] M. J. Kangas, D. C. Schmitt, A. Sakai, S. Nakatsuji, J. Y. Chan, J. Solid State Chem. 196, 274 (2012).
- [28] H. Padamsee, J. E Neighbor, and C. A. Shiffman, J. Low Temp. Phys. 12, 387 (1973).
- [29] D. C. Johnston, Supercond. Sci. Technol. 26, 115011 (2013).
- [30] E. Helfand and N. R. Werthamer, Phys. Rev. 147, 288 (1966).
- [31] N. R. Werthamer, E. Helfand, and P. C. Hohenberg, Phys. Rev. 147, 295 (1966).
- [32] D. Saint-James and P. G. Gennes, Phys. Lett. 7, 306 (1963).
- [33] A. M. Clogston, Phys. Rev. Lett. 9, 266 (1962).
- [34] K. Maki, Physics (Long Island City, N.Y.) 1, 21 (1964).
- [35] B. Serin: in Superconductivity, ed. R. D. Parks (Marcel Dekker, New York, 1969) Vol. 2, Chap. 15.
- [36] R. A. Hein and R. L. Falge, Jr., Phys. Rev. 123, 407 (1961).
- [37] S. Yonezawa and Y. Maeno, Phys. Rev. B 72, 180504(R) (2005).
- [38] The rather small size of the DPE peak in LaTi2Al20 may possibly be due to distribution of the diamagnetic field in the crystals and/or the existence of domain wall pinning in the intermediate state.
- [39] W. L. McMillan, Phys. Rev. 167, 331 (1968).
- [40] S. Nagashima, T. Nishiwaki, A. Otani, M. Sakoda, E. Matsuoka, H. Harima, and H. Sugawara, JPS Conf. Proc. 3, 011019 (2014).
- [41] As shown in Table 2, has a large distribution in nonmagnetic Al20. This quantity is expected to be proportional to the mass enhancement factor . To check this relation, theoretical calculations for are desired.
- [42] B. Cordero, V. Gmez, A. E. Platero-Prats, M. Revs, J. Echeverra, E. Cremades, F. Barragn, and S. Alvarez, Dalton Trans. 21, 2832 (2008).
- [43] T. Tanaka and Y. Kubo, J. Phys. Soc. Jpn. 80, SA125 (2011).
- [44] A. Sakai and S. Nakatsuji, J. Phys. Soc. Jpn. 81, SB049 (2012).