Diversity from the Topology of Citation Networks
V. Vasiliauskaite,
T.S. Evans
Centre for Complexity Science, and Theoretical Physics Group,
Imperial College London, SW7 2AZ, U.K.
Abstract
We study transitivity in directed acyclic graphs and its usefulness in capturing nodes that act as bridges between more densely interconnected parts in such type of network. In transitively reduced citation networks degree centrality could be used as a measure of interdisciplinarity or diversity. We study the measure’s ability to capture “diverse” nodes in random directed acyclic graphs and citation networks. We show that transitively reduced degree centrality is capable of capturing “diverse” nodes, thus this measure could be a timely alternative to text analysis techniques for retrieving papers, influential in a variety of research fields.
Keywords: Directed Acyclic Graph, Centrality, Citation Network, Transitive Reduction
Introduction
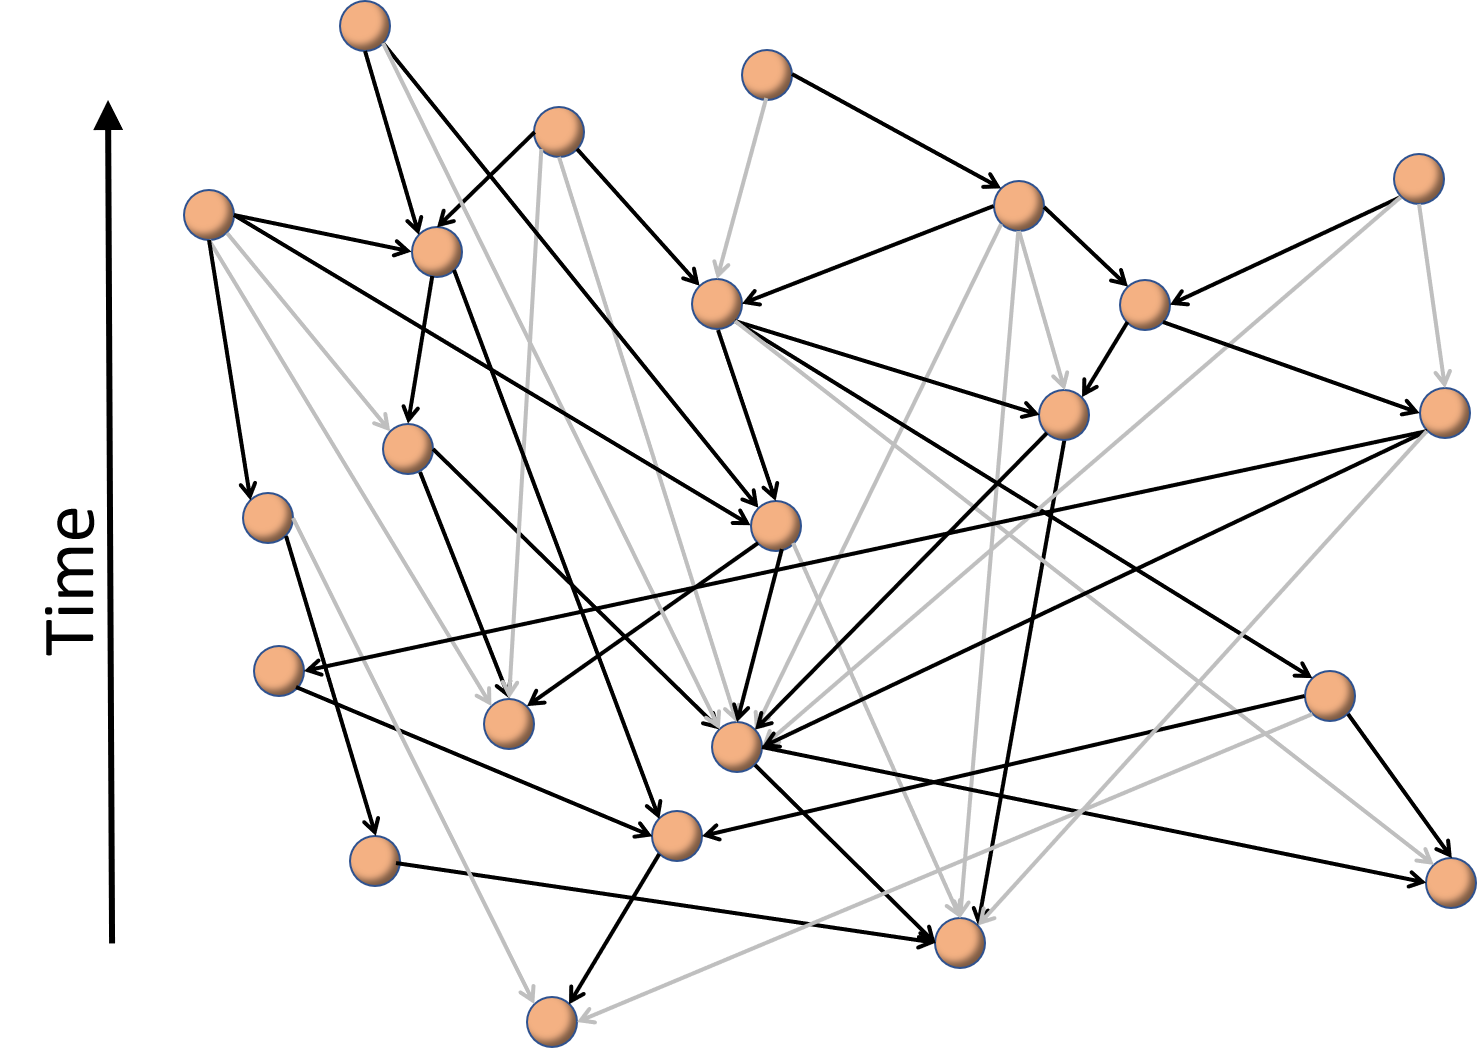
A Directed acyclic graph (DAG) is a network with a distinct topological structure. Foremost, DAGs do not contain cycles, reflecting some intrinsic constraint present in the system. This lack of cycles ensures that the process of transitive reduction (TR) [1, 2] results in a unique network. During the TR process as many links as possible are eliminated from the network, with a requirement that the connectivity of a network remains unchanged. An example of a DAG and its transitively reduced version is shown in Fig. 1(a). Since the result of transitive reduction is unique, it hinders that only structurally essential links are kept after the process.
DAGs are a common representation of various data. For instance, a food chain can be represented as a DAG where the nodes are species and directed edges are linking predators to prey. Trophic levels are unveiled by an analysis of paths in this DAG [3]. Another example is the dependencies (the edges) between different parts (typically each class is a node) of a software package.
In this paper we will analyse data from another type of DAG: a citation network. Citations between documents such as scientific papers, court judgements or patents are also well represented by DAGs [4, 5]. In such citation networks, nodes represent documents and a directed edge, pointing from node to node indicates citation of a document by a document . The constraint here is time; all edges point backward in time since one paper cannot cite another if the latter has not yet been published.
Network analysis has long been an important part of bibliometric analysis [4]. Centrality measures may be used to indicate the most important scientific papers. The simplest centrality measure is degree centrality — a count of number of connections a node has. In this bibliometric context degree is citation count: the more a paper is cited, the more important it is [6].
Researchers’ motivations for citing are ambiguous and varied among research disciplines [7]. Thus it is unclear whether the number of citations acquired by a paper is due to its significance, specificity of the research field it is published in, or the fact that high degree nodes in growing networks tend to acquire ever more edges due to some preferential attachment mechanisms [8]. It poses a question whether importance, captured by degree in such networks, is affected by node’s age and whether any of the edges, adjacent to the node are better indicators of importance.
In terms of network analysis, degree is a tool used across all types of networks. The question we ask here is if there is another simple network centrality measure that is sensitive to the special topological properties of a DAG. A previous study [5] showed that TR eliminates as many as 80% of edges in citation networks of scientific papers and significantly reduces degree centrality of many highly cited publications. Clough et al. [5] suggested that the ideas of the papers that retained high degree count after TR are those with high impact among multiple research areas. Consequently, they are essential for linking ideas across research fields. We explore this idea in this work and prove it by using text analysis and clustering tools.
We will test and validate following propositions.
Proposition 1.
If two nodes and in a DAG have the same high in- or out- degree centrality (or, simply, degree , ) maintains high degree centrality after transitive reduction (thereafter called reduced degree and defined ), this node is in between more densely interconnected parts of a network.
Proposition 2.
Consider citation network in which an edge indicates citation of an older paper by a newer paper . In this network high in-degree of a node , indicates high citation count of a paper . If after TR maintains high in-degree centrality, ideas in that paper must have influenced papers across a variety of disciplines. In other words, interdisciplinarity of a paper is depicted in its reduced in-degree.
Research methodology
Notation
A DAG is a set of nodes and edges: , that contains nodes and directed edges, none of which induce cycles in the graph. Here a directed edge from node to node is denoted .
We define the predecessors of a node to be . These will be the immediate neighbours which are in the future of document in the context of our citation networks.
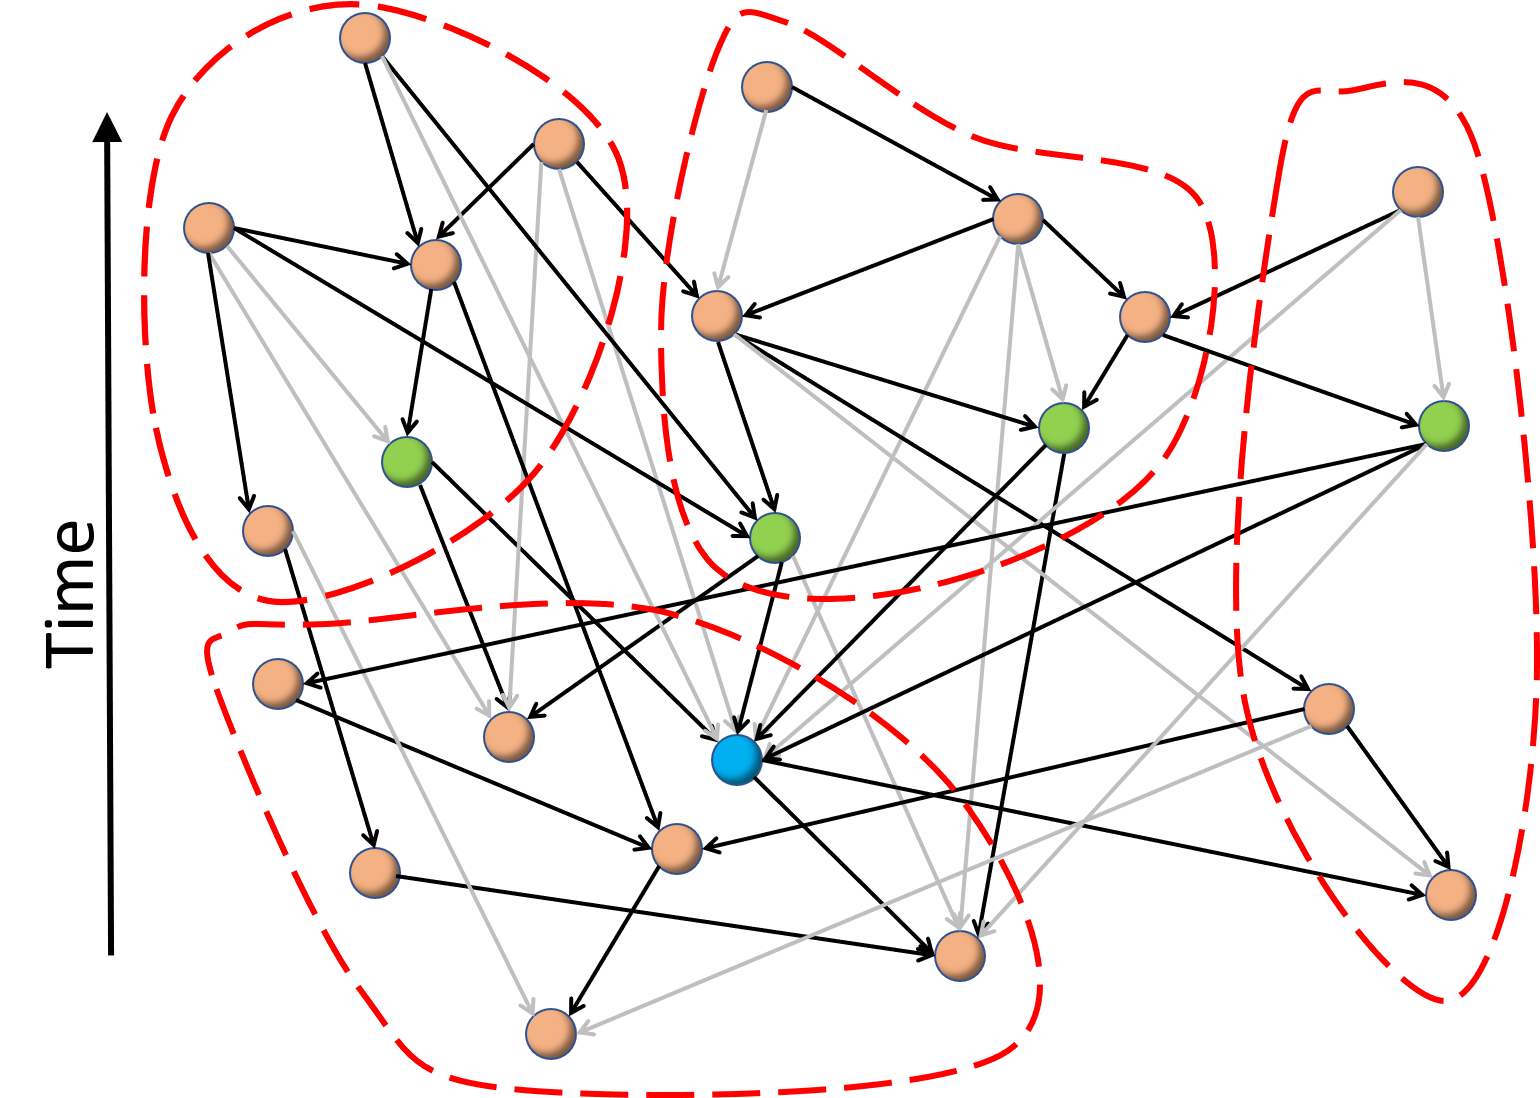
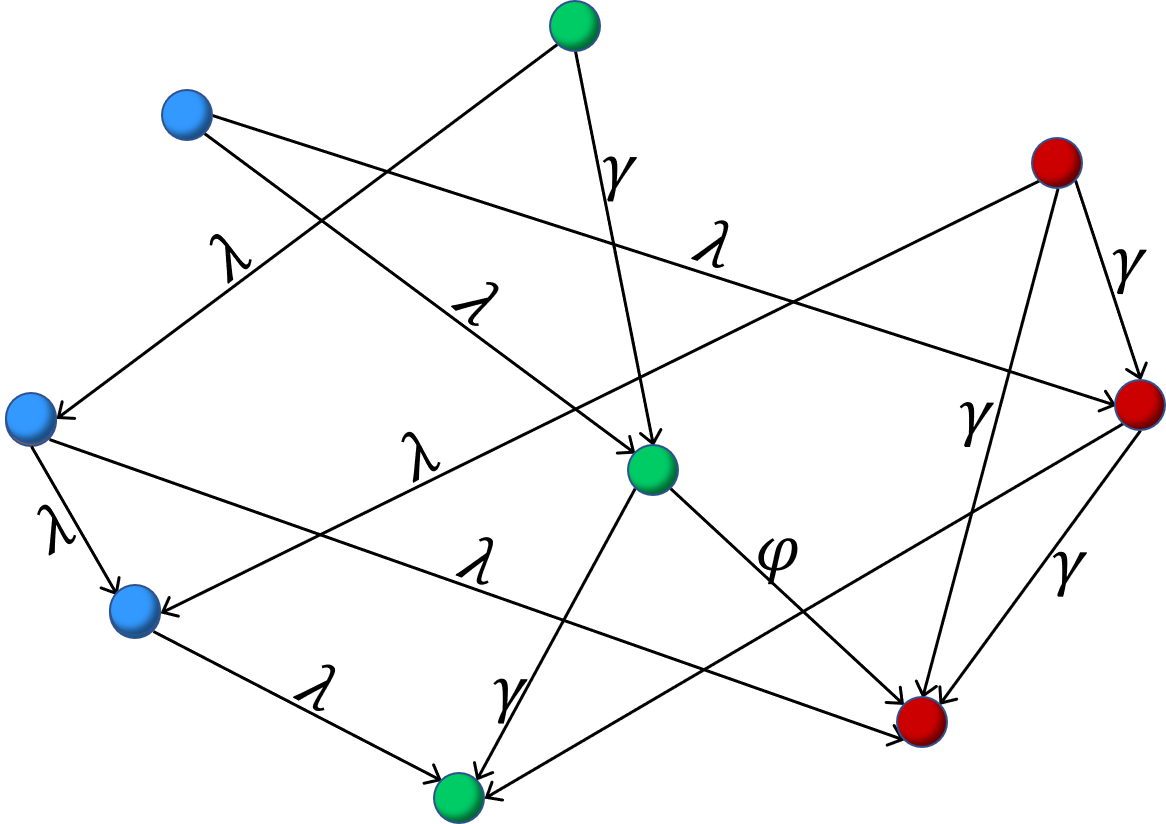
Our nodes will also carry a label taken from a set which we use to label different clusters. The label for node is denoted . It is also useful to refer to the set cluster labels carried by neighbours of a node and this set of labels is denoted as . Our assumption is that while each node is a member of a single cluster, the cluster labels of the predecessor nodes will give us a more nuanced indication of the relationship between one node and the different clusters. For example many academic papers may be assigned to a single academic field for convenience, they are published in journals associated with one field or are uploaded first to one particular section of a repository such as arXiv. So we calculate a measure of the diversity of cluster membership for each node, what we call the interdisciplinarity of node . Our interdisciplinarity index is a measure of diversity, in this case it is a normalised version of what is called “richness” in ecology (we also consider another measure based on entropy in Appendix A which is referred to as “diversity” in ecology). This diversity score is equal to the fraction of unique clusters to which node’s predecessors belong to, that is
| (1) |
An example of how we calculate diversity is illustrated in Fig. 1(b).
To test propositions 1 and 2, we study the correlations between the node measures: interdisciplinarity , the in-degree, and the corresponding in-degree in the transitively reduced network . For instance, the Pearson correlation between two vectors defined over the nodes, and , would be
| (2) |
with similar definitions of mean and standard deviation for the vector. For propositions 1 and 2 to be correct we are looking for .
Stochastic model
One way we test our propositions is to use a stochastic model to create a DAG with an appropriate planted structure. In our model we have two main types of nodes: interdisciplinary and intradisciplinary nodes. The interdisciplinary nodes connect to all other nodes with equal likelihood, while the intradisciplinary nodes prefer to connect to nodes with the same cluster label. We keep the average degree the same for all nodes and the size of each cluster the same.
We impose an order on the nodes to ensure we have a directed acyclic graph and we will do this with an integer index . Our convention will be that if and are allowed indices with then and are vertices while the only edge possible is from the larger index vertex to the smaller index vertex , so an edge is possible but is never present. Our aim is to see if the in-degree of nodes in the transitively reduced graph is positively correlated with indicators of interdisciplinarity of networks based on the metadata of the nodes in our model, the cluster labels.
There are many ways to define a suitable model but for our purposes we implement the simplest version. This is not intended to model any particular real world context. Instead our model is used to illustrate the principle behind our propositions and the methods we use to demonstrate them.
In more detail, we first choose how many clusters we will work with, . We then select one cluster, say the one labelled by , to be the subset of interdisciplinary nodes. The remaining clusters contain intradisciplinary nodes which we will label with integers to for convenience. We assign the cluster labels to vertices sequentially in terms of the vertex index , that is the cluster label of is the remainder of divided by , . We then connect an edge from to with probability where
| (3) |
Here is the cluster label of the node so then .
In order to keep the average degree the same for all nodes, we will choose
| (4) |
The average total degree (in-degree plus out-degree) is then for large . This leaves us with two free parameters controlling the number of and distribution of edges and we choose these to satisfy so that intradisciplinary nodes prefer to connect to nodes of the same label. For the two types of nodes we have for intradisciplinary nodes while for interdisciplinary nodes, which are identical when relation 4 is enforced. The expressions for the average out-degrees are identical as the probabilities defined in Eq. 3 are symmetric in terms of the cluster labels, and , and the clusters are spread evenly throughout the DAG.
Citation data
To test our approach on actual data, we use the example of a citation network in which documents are nodes and we will draw an edge from a newer document when it cites an older document. In the context of citation networks, our clusters of nodes represent collections of documents all on a single subtopic. Our assumption that each document has a single label corresponds to the common assignment of a single label for every document, perhaps as part of some hierarchical classification system. The reality is that many documents deal with several topics and we are looking to measure that “diversity”, the “interdisciplinary” nature of documents and to show that it is related to the high value for the degree in the transitively reduced network, a purely topological graph measure.
We used two datasets: citations between papers in the arXiv High Energy Physics-Theory repository, for papers published between 1992 and 2003 (referred to here as hep-th) [9] and Web of Science Astronomy and Astrophysics papers, published between 2003 and 2010 (referred to below as astro) [10, 11]. The hep-th dataset contains a set of 27,770 papers and 351,500 edges, that represent citations between the papers. The astro dataset contains a set of 103,526 papers and 921,880 edges.111In practice there are often “bad” links which are in the “wrong” direction, from an older to a newer document. This is because documents are published in different versions and the text available may not have been created at the time associated with the document in the data set. For instance, a revised version of an arXiv paper carry the same index as the first version. A journal article has several associated dates: first submitted, date accepted, published online, formal publication date and so forth. Such bad links can introduce cycles and these must be dealt with. For our arXiv data we simply dropped these bad links as they account for less than 1% of the data. For the astro data we use ISI identifiers and assume that the larger the value, the older the paper, and only add links when there is a citation from one paper of higher ISI identifier than the paper being. This eliminates all cycles but 5973 citations are not encoded as edges in our network as a result, which is 0.64% of the total in this data. Note that in this paper we use a “conventional” edge direction: edge indicates citation of by , is the citation count of document , whereas is the length of the bibliography of document .
Text analysis for node clustering
One way to group documents is to look for similarities in their texts. We will use standard text analysis methods to find such groups of similar texts and these will be our “clusters”. We will assume that the clusters we find in our academic paper datasets represent different research subfields.
First, we create a list of the stems of important words and their frequency from the abstract of each paper [12], see Appendix B for details. Important words are those which occur in many documents, but do not occur too often. For instance, the values could be and respectively. This would mean that a term is considered important if it does not occur in more than of documents, as then it probably is generic and carries little meaning. On the other hand, if it occurs in less than of documents, it is probably insignificant. We found that in this study of research abstracts, values of and respectively were sufficient.
The frequency vectors for each paper were used to create a term frequency–inverse document frequency matrix tf-idf matrix [12]. Clusters of the abstracts and, consequently, of papers themselves were obtained by using K-means algorithm [13].This algorithm creates a pre-determined number of clusters; we chose values of 10, 20 and 30.
Data Availability
The data that was generated to support the findings of this study is available from the corresponding author on reasonable request. The hep-th dataset is available from the KDD Cup 2003 website [9]. Access to the astro dataset is on request as described in the paper of Gläser et al.[10] and the official website of the Topic Extraction Challenge [14].
Data Analysis
Stochastic Model DAGs
Using our stochastic model we generated DAGs ranging in size from 1,000 to 15,000 nodes in increments of 1,000 nodes. For each size of network, 100 random graphs were generated. We varied the predetermined number of clusters, , 10, 20 and 30. Lastly, we used edge formation probabilities and . Values of the variables are summarised in Table 1.
| Variable | Values |
|---|---|
| with increment of 1,000 | |
| 0.00112, 0.0005358, 0.0003545 for | |
| 0.00001 | |
| 0.01 |
The results are shown in Fig. 3. The figure illustrates that the importance of a node, which is depicted by in-degree centrality, is reduced by a significantly smaller amount for nodes that are interconnected. In contrast, the nodes with a high intraconnectivity and small interconnectivity seem to lose a substantial amount of edges. This is expected, as within a cluster which is, by definition, highly connected, most of the edges are redundant. Since all redundant edges are removed, for nodes which degree centrality is acquired mainly from the nodes in the same cluster, their centrality is reduced significantly after TR. This effect is also notably more prominent for larger networks. Since in all cases, edge loss is significantly larger for intradisciplinary nodes, proposition 1 is proven.


Citation networks
To test proposition 2, we clustered papers using the methodology described in section Text analysis for node clustering and used these clusters to calculate our interdisciplinary measure of (1) for each paper. We correlated diversity score for individual papers with their actual degrees and reduced degrees. We also varied a number of clusters, which again was selected to be either 10, 20 or 30.
The results are provided in Fig. 4 for the astro dataset and in Fig. 5 for the hep-th dataset. These figures show that the diversity of topics covered by a paper, as given by our measure of interdisciplinarity of (1), does appear to be well correlated with the reduced in-degree in both datasets. This relationship is much less visible in the plots of interdisciplinarity and the full in-degree. Correlation coefficients, given in Table 2, show that there is indeed a very strong non-linear correlation between the reduced degree and our diversity measure regardless of the number of clusters. At the same time we see a significantly lower correlation between diversity and the in-degree in the citation network. This tendency is seen using both Pearson correlation measure and Spearman correlation measure.


| hep-th | ||||
|---|---|---|---|---|
| PearsonR() | PearsonR() | SpearmanR() | SpearmanR() | |
| 10 | 0.8247 | 0.374 | 0.9232 | 0.7719 |
| 20 | 0.8864 | 0.4128 | 0.9507 | 0.7825 |
| 30 | 0.9134 | 0.4303 | 0.959 | 0.7867 |
| astro | ||||
| PearsonR() | PearsonR() | SpearmanR() | SpearmanR() | |
| 10 | 0.6791 | 0.4751 | 0.8425 | 0.7902 |
| 20 | 0.7617 | 0.5472 | 0.8873 | 0.8267 |
| 30 | 0.8013 | 0.5863 | 0.9051 | 0.8433 |
Discussion and conclusions
In this paper we validated the proposition, initially suggested by Clough et al. [5], that for citation networks, in-degree centrality remains high after transitive reduction for nodes (papers) that have a large cross-disciplinary influence. We further validated this result using a simple model which produced random DAGs with planted partitions including nodes which connected homogeneously to others (interdisciplinary nodes) while most nodes preferred to connect within their community (intradisciplinary nodes).
This study has shown several important results. It seems that cross-disciplinary nodes are highlighted by a large reduced degree in networks that contain a large number of clusters. This result is expected as in a network with only a few clusters, edges between clusters are more frequent, and the edges adjacent to interdisciplinary nodes will play a less important role. However, when the number of clusters increases, interdisciplinary nodes start to play a key role in sustaining these connections. Such connections are essential for the causal structure of the DAG and so a large proportion will be retained under transitive reduction. These edges contribute to so a high value will flag interdisciplinary nodes.
In a citation network, highly cross-disciplinary nodes represent papers with a wide range of influence. For example, consider two papers from the hep-th dataset: “Large N Field Theories, String Theory and Gravity” by Aharony et al. (hep-th/9905111) and “The Large N Limit of Superconformal Field Theories and Supergravity” by Malcadena (hep-th/9711200). The first paper has a relatively large in-degree: and the largest reduced degree of all papers: . This paper also has a very large diversity score: 1.0, 0.9 and 0.73(3) for clusterings of size 10, 20, 30 respectively. By investigating it’s arXiv frontpage, one can find that it is listed under a number of different fields: High Energy Physics - Theory, General Relativity and Quantum Cosmology, High Energy Physics - Lattice and High Energy Physics - Phenomenology. Thus the paper seems highly interdisciplinary. In contrast, Malcadena’s paper has a smaller interdisciplinarity score of 0.8, 0.5 and 0.43(3) for clusterings of size 10, 20 and 30 respectively and it is also listed only under the hep-th section of arXiv which suggests this paper is much more field specific. Indeed, its degree is reduced from 2414 to 15 and it is not highlighted by the reduced degree as a paper that is cross-disciplinary.
The measure of a reduced in-degree centrality has a potential to be a useful bibliometric metric. We have proved here that it highlights the interdisciplinarity of scientific papers, an important topic in bibliometrics [15, 16]. Furthermore, it has also been demonstrated that transitive reduction of a growing directed acyclic network is a fast calculation, taking for nodes and vertices [1, 2], so it would be a computationally cheap metric to implement. It could be used to produce recommendations of papers which might appeal to researchers from outside a given topic. For instance, if a physicist searches for a paper on transitive reduction algorithms, a search engine could return a list ordered by reduced degree . That would highlight papers written by computer scientists specifically for non-specialists which are likely to be more digestible by researchers in other fields looking to use the latest algorithms on their data, or examples of scientists using transitive reduction algorithms but in specialised contexts that is more readily appreciated by the physicist searching for information.
Lastly, our successful demonstration of reduced degree as a measure of interdisciplinarity in a generative and structureless random DAG gives us an inkling that the result may give important insights in other networks with such structure. For instance with food webs, degree quantifies species’ participation in the food web. Let us choose such edge direction that in-degree of a species is equivalent to the number of species dependent on it as a food source. However, some of these dependencies are non-essential, i.e. if this species becomes extinct, alternative prey could be found. On the contrary, species with high reduced degree are essential in the ecosystem represented by the food web, as alternative food source is impossible for many predators if this prey becomes extinct. Another application could be to improve software. Representing software dependencies as a DAG, a high shows that a piece of software plays a critical role across a wide range of software packages.
Our work also highlights the importance of using centrality measures which are adapted to their context. Although there are a vast number of centrality measures available, simple measures as degree if appropriately adapted can give us important insights without unnecessary over-complications.
Acknowledgement
This work was funded by Engineering and Physical Sciences Research Council grant EP-R512540-1.
Author contributions statement
V.V. conducted the data analysis. The rest of the work was done jointly by both authors. Both authors reviewed the manuscript.
Competing interests
The authors declare no competing interest.
References
- [1] Dennis M Moyles and Gerald L Thompson. An algorithm for finding a minimum equivalent graph of a digraph. Journal of the ACM (JACM), 16(3):455–460, 1969.
- [2] A. V. Aho, M. R. Garey, and J. D. Ullman. The transitive reduction of a directed graph. SIAM Journal on Computing, 1(2):131–137, jun 1972.
- [3] Tomasz Łuczak and Joel E. Cohen. Stratigraphy of a random acyclic directed graph: The size of trophic levels in the cascade model. The Annals of Applied Probability, 3(2):403–420, 1993.
- [4] Derek J. de Solla Price. Networks of scientific papers. Science, 149(3683):510–515, 1965.
- [5] J. R. Clough, J. Gollings, T. V. Loach, and T. S. Evans. Transitive reduction of citation networks. Journal of Complex Networks, 3(2):189–203, sep 2014.
- [6] Eugene Garfield. Citation frequency as a measure of research activity and performance. Essays of an Information Scientist, 1(2):406–408, 1973.
- [7] Lutz Bornmann and Hans-Dieter Daniel. What do citation counts measure? a review of studies on citing behavior. Journal of Documentation, 64(1):45–80, jan 2008.
- [8] Mingyang Wang, Guang Yu, and Daren Yu. Measuring the preferential attachment mechanism in citation networks. Physica A: Statistical Mechanics and its Applications, 387(18):4692 – 4698, 2008.
- [9] Kdd cup. https://www.cs.cornell.edu/projects/kddcup/datasets.html, 2003.
- [10] Jochen Gläser, Wolfgang Glänzel, and Andrea Scharnhorst. Same data—different results? towards a comparative approach to the identification of thematic structures in science. Scientometrics, 111(2):981–998, mar 2017.
- [11] Kevin Boyack, Wolfgang Glänzel, Jochen Gläser, Frank Havemann, Andrea Scharnhorst, Bart Thijs, Nees Jan van Eck, Theresa Velden, and Ludo Waltmann. Topic identification challenge. Scientometrics, 111(2):1223–1224, mar 2017.
- [12] Stephen Robertson. Understanding inverse document frequency: on theoretical arguments for idf. Journal of documentation, 60(5):503–520, 2004.
- [13] T. Kanungo, D.M. Mount, N.S. Netanyahu, C.D. Piatko, R. Silverman, and A.Y. Wu. An efficient k-means clustering algorithm: analysis and implementation. IEEE Transactions on Pattern Analysis and Machine Intelligence, 24(7):881–892, jul 2002.
- [14] Topic Extraction Challenge. http://www.topic-challenge.info/, 2017.
- [15] Ismael Rafols and Martin Meyer. Diversity and network coherence as indicators of interdisciplinarity: case studies in bionanoscience. Scientometrics, 82(2):263–287, 2010.
- [16] Loet Leydesdorff and Ismael Rafols. Indicators of the interdisciplinarity of journals: Diversity, centrality, and citations. Journal of Informetrics, 5(1):87–100, Jan 2011.
- [17] Lou Jost. Entropy and diversity. Oikos, 113(2):363–375, 2006.
- [18] Patrick Glenisson, Wolfgang Glänzel, Frizo Janssens, and Bart De Moor. Combining full text and bibliometric information in mapping scientific disciplines. Information Processing & Management, 41(6):1548–1572, 2005.
Supplementary Information
Appendix A Interdisciplinarity using alternative diversity measures
There are various ways to evaluate diversity. Indices of diversity are commonly used in ecosystem analysis: they provide information about composition of communities and abundances of species in those communities. In our context, a node’s “ecosystem” is a set of its predecessors.222For instance, in a citation network, a node’s “ecosystem” is composed of papers that cited that paper. What we called interdisciplinarity is closely related to species richness - number of species present in an ecosystem. Alternatively, one could use measures of diversity that could give more information about the composition and infrastructure of ecosystems in contrast to measures of richness, as they also account for commonness of species. One example of such measures is Shannon’s entropy [17]. For a node it is defines as
| (A1) |
where is proportion of the system, composed of species . Then interdisciplinarity, defined in terms of (normalised) diversity is
| (A2) |
where is the number of unique species. In our context, is a number of cluster of semantically similar papers. is equal to a number neighbours of that belong to the same community, as a fraction of all neighbours of . This value is then summed over all communities that constitute the “ecosystem” of node .
Fig. A6 shows results of this measure of interdisciplinarity, applied to our previously studied hep-th and astro datasets. It is clear that the correlation between interdisciplinarity and reduced degree is higher than the real degree. Results are summarised in Table A3.


| hep-th | ||||
|---|---|---|---|---|
| PearsonR() | PearsonR() | SpearmanR() | SpearmanR() | |
| 10 | 0.745 | 0.35354 | 0.8089 | 0.6421 |
| 20 | 0.8315 | 0.38796 | 0.86838 | 0.675 |
| 30 | 0.86678 | 0.42527 | 0.8859 | 0.6876 |
| astro | ||||
| PearsonR() | PearsonR() | SpearmanR() | SpearmanR() | |
| 10 | 0.566 | 0.4005 | 0.709 | 0.6471 |
| 20 | 0.641 | 0.4603 | 0.7583 | 0.694 |
| 30 | 0.689 | 0.48265 | 0.8003 | 0.7302 |
Appendix B Terms
Producing the terms
We used the abstract to characterise each paper. There are many reasons for doing this. The primary reason is that we had easy access to the abstracts. We also believe that in the context of the two data sets we used here, that the prominence and brevity of abstracts leads to assumption that authors choose their words carefully, making an abstract an effective list of keywords. By way of comparison, the full text contains too many generic terms, too many terms used in generic discussions of wider contexts to reflect the specific content of a paper. Abstracts also have few equations and abbreviations, and they do not contain other complicated structures such as figures and tables. Equations we will discuss in more detail below. As for abbreviations, these are often avoided in an abstract or, if not a widely used and standard abbreviation, the full text will be given as well and that text will be correctly processed in our approach. Since abstracts are read by both experts and to a large extent by non-experts, they ought to be geared toward non-experts. However we also note that for a study of much smaller number of papers in bibliometrics [18], researchers found that clustering based on abstracts and titles alone gave a poorer match with an expert based classification than when clustering using full texts.
For text analysis we used corresponding NLTK (Python natural language toolkit) tokenize package functions. We also used the list of English stopwords provided in the NLTK. These words, such as “the”, “are” were removed from the list of words that would be considered for being important words – terms. Furthermore, purely numeric stems are not considered either. We decided not to alter the list of stopwords manually in order not to introduce any subjectivity to our analysis. We also considered terms, composed of more than one stem. For instance, in Astronomy, “dark” could be related to “dark matter” or “dark energy” which are essentially distinct topics. Such word combinations, composed of tokens are called n-grams. We used n-grams composed of maximum 3 stemmed tokens.
Punctuation is used to detect sentences, which are further split into words (“tokens”) by spaces. A token is then stemmed - broken down into the word’s root. Apostrophes are not dealt with very well; for instance “McDonald’s” would be split into two tokens “mcdonald” and “’s”. Brackets, however, are removed so that a term such as “SU(2)” becomes two tokens, “su” and “2”. This also means that the symbol “$” is removed so that the characters in LaTeXequations (which are surrounded by $ symbols) are then processed like other text. For instance “$\lambda = \sqrt(2)$” would leave us with tokens “\\lambda, \\sqrt”. Backslashes signify regular expressions, in this case special mathematical symbols.
Many of the resulting tokens are not useful nor reliable as terms; they often have multiple meanings or are used only in exactly the same form by a tiny number of authors. In many cases these will be excluded by the the requirement that a term must appear in a minimum number of documents but not more than a maximum number, thresholds frequencies which we discuss below. So for instance a stem “lambda” is too frequent to be considered a term, whereas the stems of are too rare. The role of equations in these academic documents is another reason why abstracts are a better source to use than the full texts. It is hard to find examples of abstracts with sufficiently large numbers of large equations.
Geared with terms for all abstracts, we formed a term frequency - inverse document frequency (tfi-df) matrix by using tf-idf vectoriser. It creates a matrix in which rows correspond to terms and columns correspond to documents: an entry is equal to the number of times term occurred in document. Two thresholds define whether a stem is considered a term and is included in the matrix, these are the minimum and maximum frequency of the feature (stem) within documents. The texts are then clustered based on the frequency vectors of these terms (the tfi-df matrix) using K-means algorithm.
Stems of Important words in the hep-th data
yang-mil, expans, boundari, classic, equival, way, argu, limit, class, hole, associ, group, descript, exist, discuss, dual, black, effect, n=2, obtain, potenti, invari, manifold, analysi, field theori, arbitrari, previous, coupl, interact, interpret, studi, correspond, number, topolog, quantize, vacuum, matter, differ, dynam, boson, propos, onli, point, valu, supergrav, structur, graviti, term, represent, depend, symmetri, singular, defin, phase, properti, u, conform, deriv, close, massless, consist, perturb, gaug, provid, paramet, appear, result, explicit, space-tim, generat, formal, set, dimension, determin, shown, equat, n, correct, given, complet, known, calcul, consid, contain, constant, possibl, supersymmetr, natur, transform, problem, string theori, hamiltonian, work, magnet, exact, introduc, paper, extend, describ, base, construct, certain, cosmolog, general, includ, loop, charg, oper, finit, local, standard, spectrum, present, larg, quantum, vector, new, ’s, model, formul, gaug theori, chiral, relat, use, matrix, geometri, scalar, theori, dualiti, string, investig, particular, space, free, black hole, lead, brane, massiv, form, order, connect, fix, approach, condit, supersymmetri, action, mechan, appli, mass, physic, metric, level, recent, exampl, background, simpl, energi, spin, ani, direct, allow, method, spacetim, configur, express, particl, time, su, univers, type, integr, fermion, function, comput, field, zero, case, aris, tensor, algebra, dimens, solut, state, scale.
Stems of Important words in the astro data
general galaxi, object, galaxi cluster, techniqu photometr, supernova general, star format, sun flare, star variabl, gamma ray burst, shock, starburst, radiat transfer, large-scal, galaxi individu, star, oscil, abund star, survey, high-redshift, galaxi high-redshift, plasma, evolut galaxi, radiat mechan, galaxi structur, galaxi nuclei, extinct, hole, kinemat, quasar general, observ, open cluster, associ, mhd, galaxi kinemat, nuclei, evolut star, rotat, general star, kinemat dynam galaxi, sun magnet, cluster general, supernova remnant, black, x-ray binari, photometr, stellar content, cluster general galaxi, kinemat dynam, galaxi ism, analysi, fundament, continuum, sun corona sun, radiat, format star, agb, lens, globular cluster, activ, interact, radio continuum, intergalact, galaxi halo, matter, dynam, sun magnet field, abund, na, instabl, data, gamma, structur, magnet field, circumstellar, statist, magnetospher, galaxi starburst, sun, galaxi evolut galaxi, medium, large-scal structur, supernova, neutron, shock wave, hydrodynam, ngc, close, wind, wave, planet, paramet, x-ray, stellar, jet, x-ray star, jet outflow, galaxi evolut, burst, ionospher, disk, variabl, numer, intergalact medium, accret accret disk, individu ngc, method data analysi, format galaxi, star oscil, polar, method statist, acceler, eclips, quasar, cluster associ, process, ism individu, flare, corona, format, radio, techniqu, data analysi, solar, dust extinct, dust, cosmic ray, magnet, ray burst, black hole physic, techniqu spectroscop, accret disk, molecul, atmospher, cosmolog theori, cosmolog, general, infrar star, galaxi activ galaxi, region, ism jet outflow, circumstellar matter, ellipt, dynam galaxi, evolut, disc, infrar, corona sun, galaxi individu ngc, spectroscop, cluster, galaxi, large-scal structur univers, dark matter, star format star, gravit lens, dark, activ galaxi, x-ray galaxi, relat, individu, star individu, line, ism, open cluster associ, binari, theori, radio line, ism cloud, ism molecul, space, fundament paramet, dwarf, black hole, distanc, hole physic, sun corona, star abund, mechan, infrar galaxi, turbul, mass, cluster individu, star evolut, ism jet, galaxi kinemat dynam, evolut galaxi format, galaxi stellar content, physic, globular, method numer, halo, structur univers, gravit, gamma ray, content, galaxi stellar, outflow, galaxi format, background, star fundament paramet, satellit, pulsar, simul, cosmolog observ, method, planetari, star neutron, star agb, star fundament, univers, particl, cloud, accret accret, remnant, gamma-ray, galaxi format galaxi, field, open, method data, instrument, transfer, galaxi activ, binari close, ray, cosmic, accret, galaxi cluster general.