∎
Single Track Melt Pool Measurements and Microstructures in Inconel 625
Abstract
We use single track laser melting experiments and simulations on Inconel 625 to estimate the dimensions and microstructures of the resulting melt pools. Our work is based on a design-of-experiments approach which uses multiple laser power and scan speed combinations. Single track experiments generate melt pools of certain dimensions. These dimensions reasonably agree with our finite element calculations. Phase-field simulations predict the size and segregation of the cellular microstructures that form along the melt pool boundaries for the solidification conditions that change as a function of melt pool dimensions.
Keywords:
Additive manufacturing Melt pool Finite element Phase-field Solidification Dendrite1 Introduction
Additive manufacturing (AM) technologies are rapidly being used to fabricate near-full density and high-value metallic parts for aerospace, medical, and defense applications Murr2012 ; King2015 ; Francois2017 . When a laser source with a given power () and power distribution scans at a programmed speed () across an alloy substrate or powder, a melt pool of certain dimensions (length , width and depth ) results. These dimensions are important, as they determine the density of the parts through subsequent solidification processes which affect the material properties.
Measurements of melt pool dimensions have been reported for various combinations of and using single track experiments on Ni alloys Heigel2017 ; Heigel2017b ; Montgomery2015 , stainless steels Childs2005 , and Ti alloys Gong2014 . High values of and low values of resulted in large melt pools in the above experiments. A thermographic camera was used to estimate the thermal history in the material, from which the melt pool dimensions were determined Heigel2017 ; Brandon2015 . Although the melt pool shape was similar in both powder and substrate cases, the powder case was complicated by surface roughness of the unmolten powder particles and by width and height variations and pore formations through keyholing events Childs2005 ; Gong2014 . The molten pools that form during experiments Heigel2017 ; Heigel2017b on an Inconel 625 (IN625) surface become fully developed and reach a steady state for a single line laser scan after the first to . However, when the experiments were performed with multiple laser scans, the melt pool length deviated from the steady state as the scan line count increased Heigel2017b . Therefore, a single track laser scan on a bare IN625 substrate is used for validation simulations.
The interaction between the laser beam and the irradiated material can be very complex King2015 ; King2014 ; Khairallah2016 , leading to rapid vaporization of the melt surface under the beam, which results in a recoil pressure coupled with Marangoni and other hydrodynamic effects within the melt pool King2015 ; King2014 ; Khairallah2016 , determining the steady state melt pool dimensions in real systems. Modeling of such a multi-physics phenomenon is extremely difficult within a feasible computational time and resources. Therefore, laser melting processes with a relatively low power beam are often modeled using finite element methods with simplified assumptions of the melt pool dynamics in order to simplify calculations without any qualitative changes in the resultant melt pool shapes Montgomery2015 ; Guo2000 ; Gong2015 .
The shape of a melt pool is important from a solidification perspective. Solidification begins in the trailing edge of the melt pool, and the temperature gradient and the solid-liquid interface growth rate change as a function of the melt pool dimensions. A rapid solidification condition kurzbook ; Rappazbook is reported Suresh2016 ; Trevor2017 to exist along the melt pool boundary and the resultant local solidification features, such as the grain size and the solute distribution increasingly deviate from local equilibrium with increasing and combinations Gong2015 ; supriyo2017 . There have been no studies to understand the single track melting, solidification, and microstructure evolution phenomena in IN625. Design-of-experiments Heigel2017 ; Gong2014 ; Li2015 based modeling of melt pool dimensions and microstructures can potentially be used for rapid optimization of and combinations to produce high-fidelity parts, since it can save significant time and cost when compared with conducting numerous physical experiments. In what follows, we present the laser single track experiments for melt pool shapes, finite element simulations for melt pool shapes and temperatures, and phase-field simulations for melt pool solidification microstructures.
2 Melt pool shape
2.1 Single track experiments
Well separated, single laser tracks on a solid IN625 plate were produced using a commercial laser powder bed fusion (LPBF) machine with a Nd:YAG laser. The IN625 plate had approximate dimensions of 25.4 mm 25.4 mm 3.2 mm. The plate was polished to a controlled surface finish (400 grit) and annealed at 870 ∘C for 1 hour in vacuum to relieve residual stresses. Seven laser tracks were produced, each 4 mm long, with different combinations of and . The dynamic lengths of the melt pools were measured in situ using thermography, as reported and described previously Heigel2017 . The widths of the laser tracks were measured ex situ using a confocal laser scanning microscope (CLSM). The laser tracks were cross sectioned at the center positions (after the melt pool reaches a steady state length) and polished prior to chemical etching with aqua regia. These cross sections were then imaged using the same CLSM.
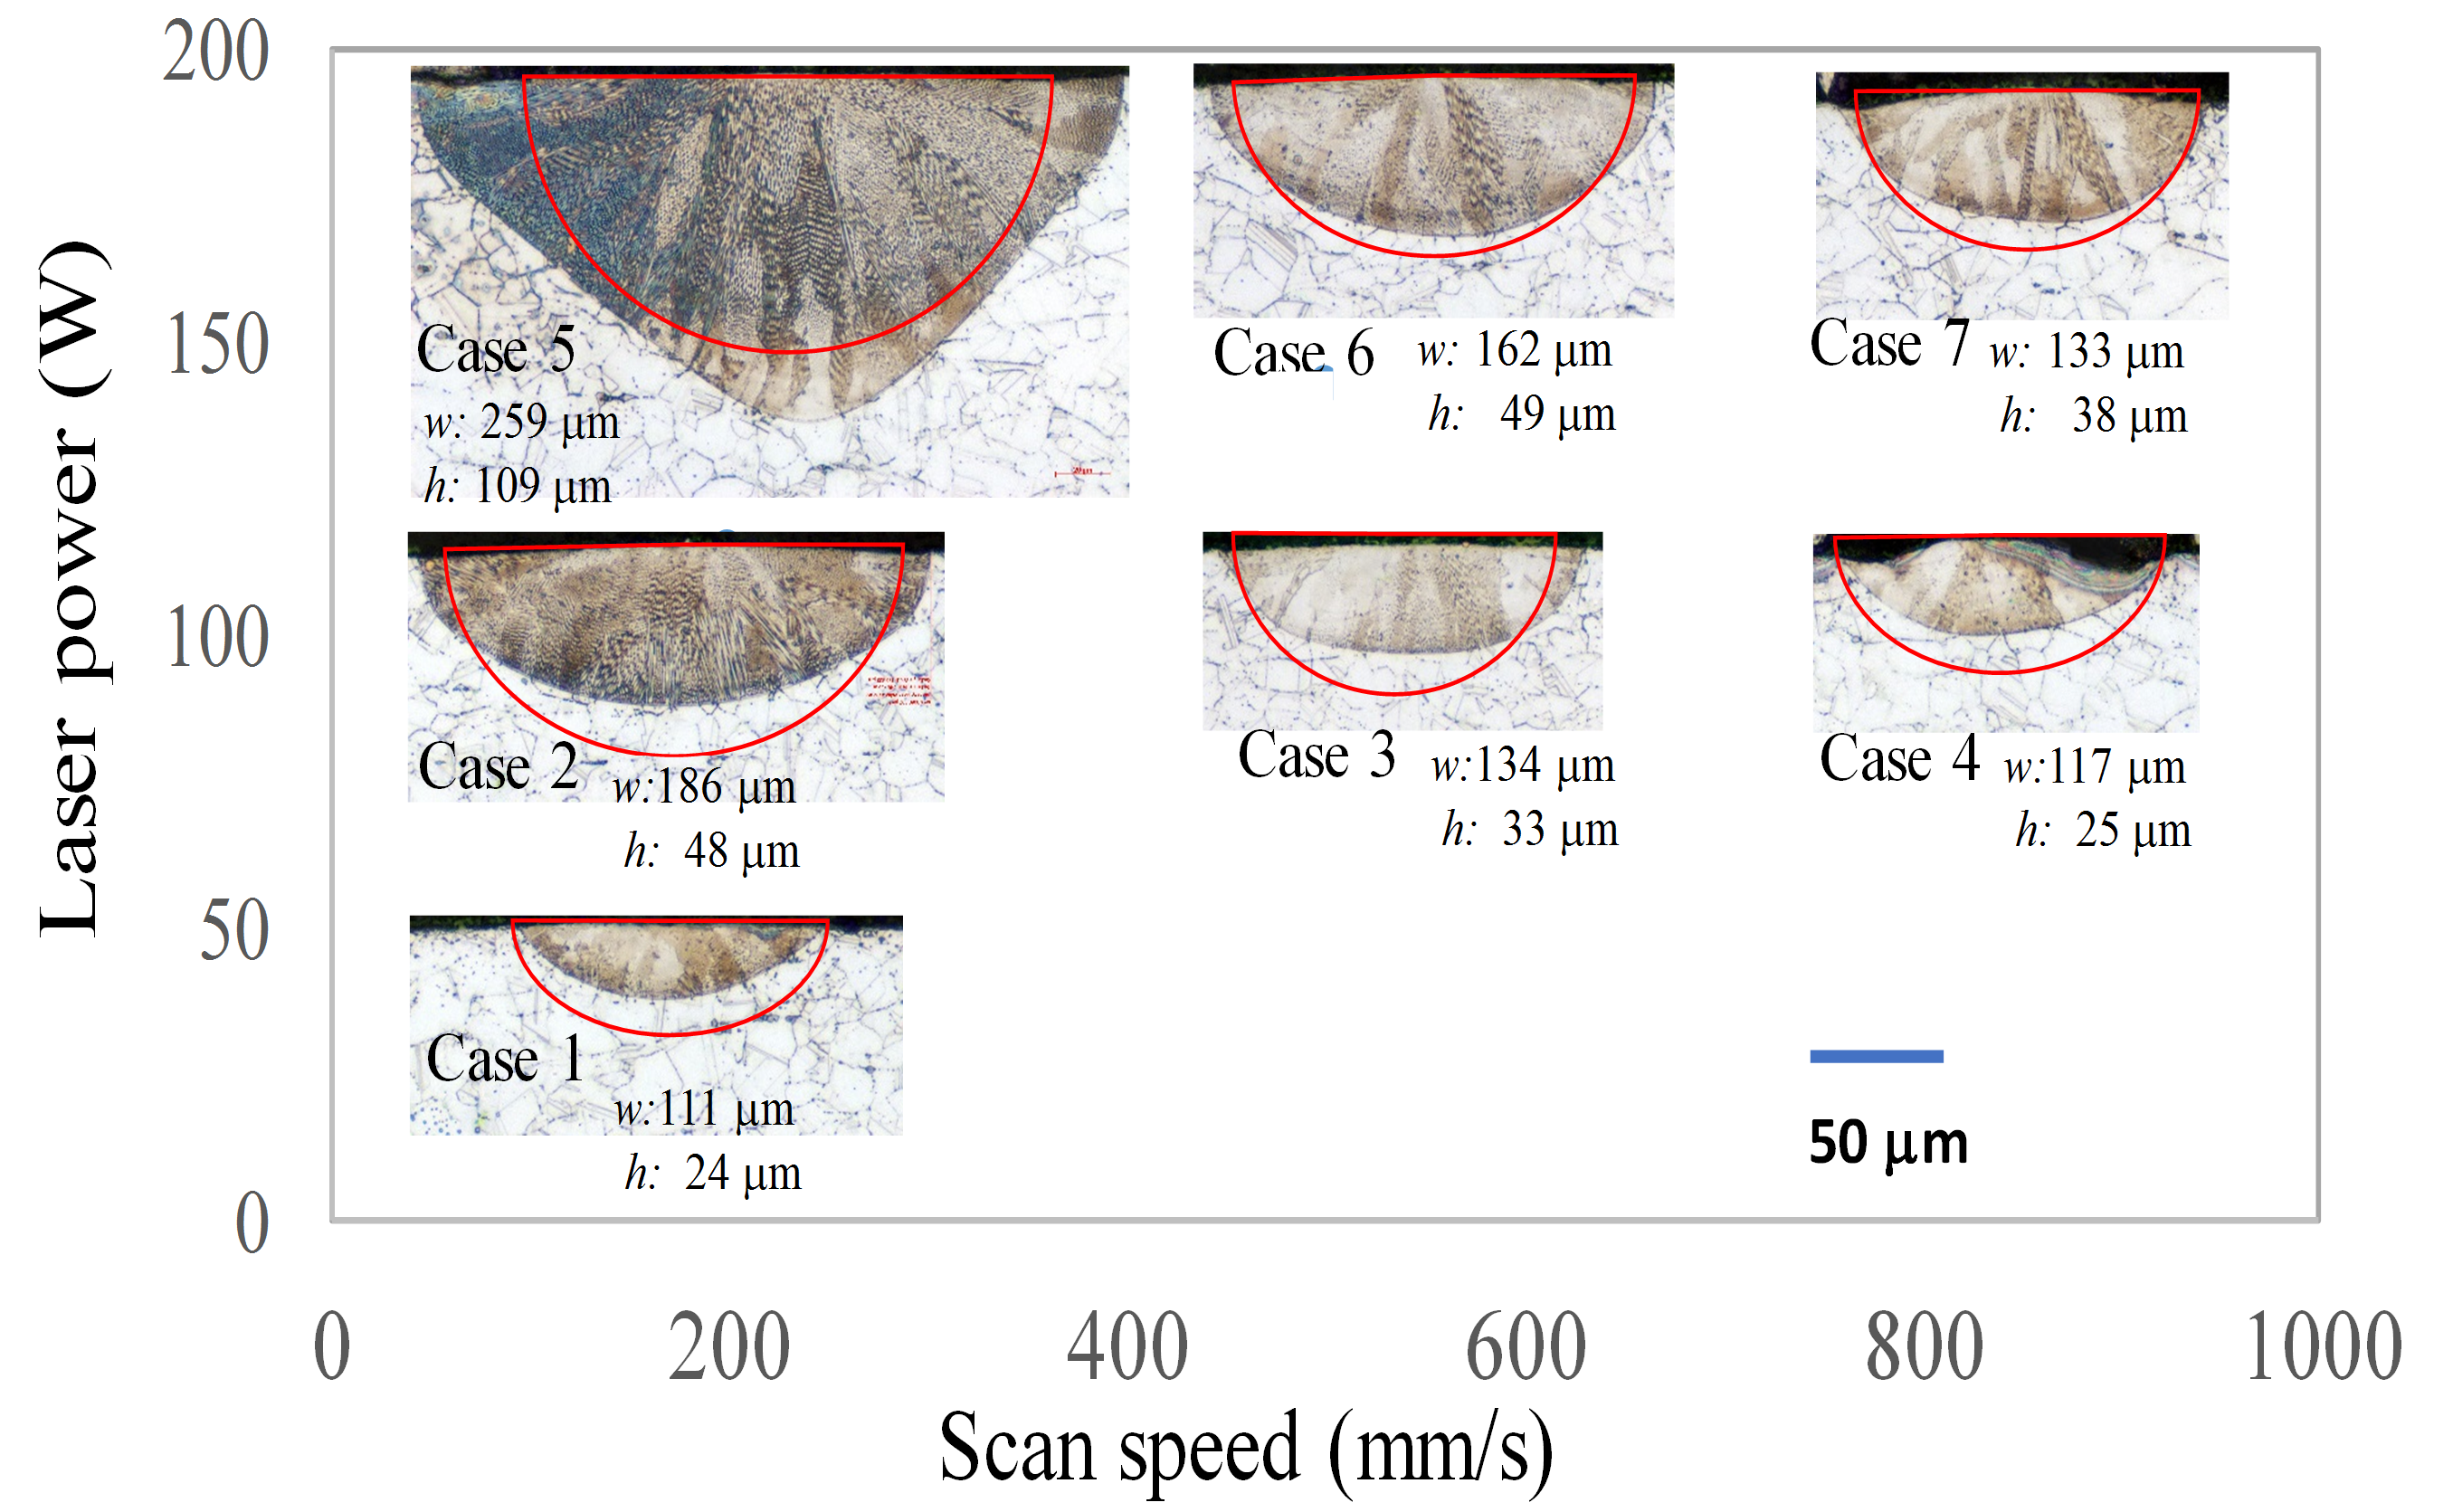
Figure 1 shows the CLSM images of the laser track cross sections as a function of and . Clearly, the cross section geometry is highly sensitive to both and . Except for the laser track formed using 195 W and 200 mm s-1 (Case 5), the cross sections exhibit straightforward systematic changes with respect to both and . The Case 5 cross section has a different shape indicative of the onset of keyholing. Another case worth mentioning is Case 7, with 195 W and 800 mm s-1. These are the nominal settings used for building solid components from IN625 powder for the LPBF machine used in this study. The measured melt pool width (), and melt pool depth () are listed below each image. The standard deviation measurement uncertainties for the and measurements are approximately . The uncertainties in the melt pool length are described in Heigel2017 and are shown graphically in Fig. 2.
2.2 Finite element simulations
We perform heat transfer based finite element simulations and validate the resulting melt pool dimensions and temperature distributions using the above experiments Heigel2017 ; Heigel2017b . Similar to the experiments Heigel2017 ; Heigel2017b , a single track laser scan on a solid IN625 substrate of 25.4 mm 25.4 mm 3.2 mm at initial uniform temperature of 293 K is modeled. The laser beam is modeled to have a Gaussian power distribution with a radius of Dayal2014 , which scans at a velocity for a length of 4 mm. Seven combinations of (49 W to 195 W) and (200 m s-1 to 800 m s-1) are designed for simulations, which were based on the LPBF measurements Heigel2017 ; Heigel2017b . The finite element thermal model and surface laser heat input are based on our previous works Trevor2017 ; Li2015 . We consider the bulk material properties from Refs. Trevor2017 ; Li2015 with no powder material or melt-state change considered. As a first approximation, the thermal conductivity is treated as a function of temperature only Trevor2017 . The temperature-dependent bulk material density, latent heat and specific heat are calculated using thermodynamic calculations Trevor2017 . For more details, please refer to Trevor2017 ; Li2015 .
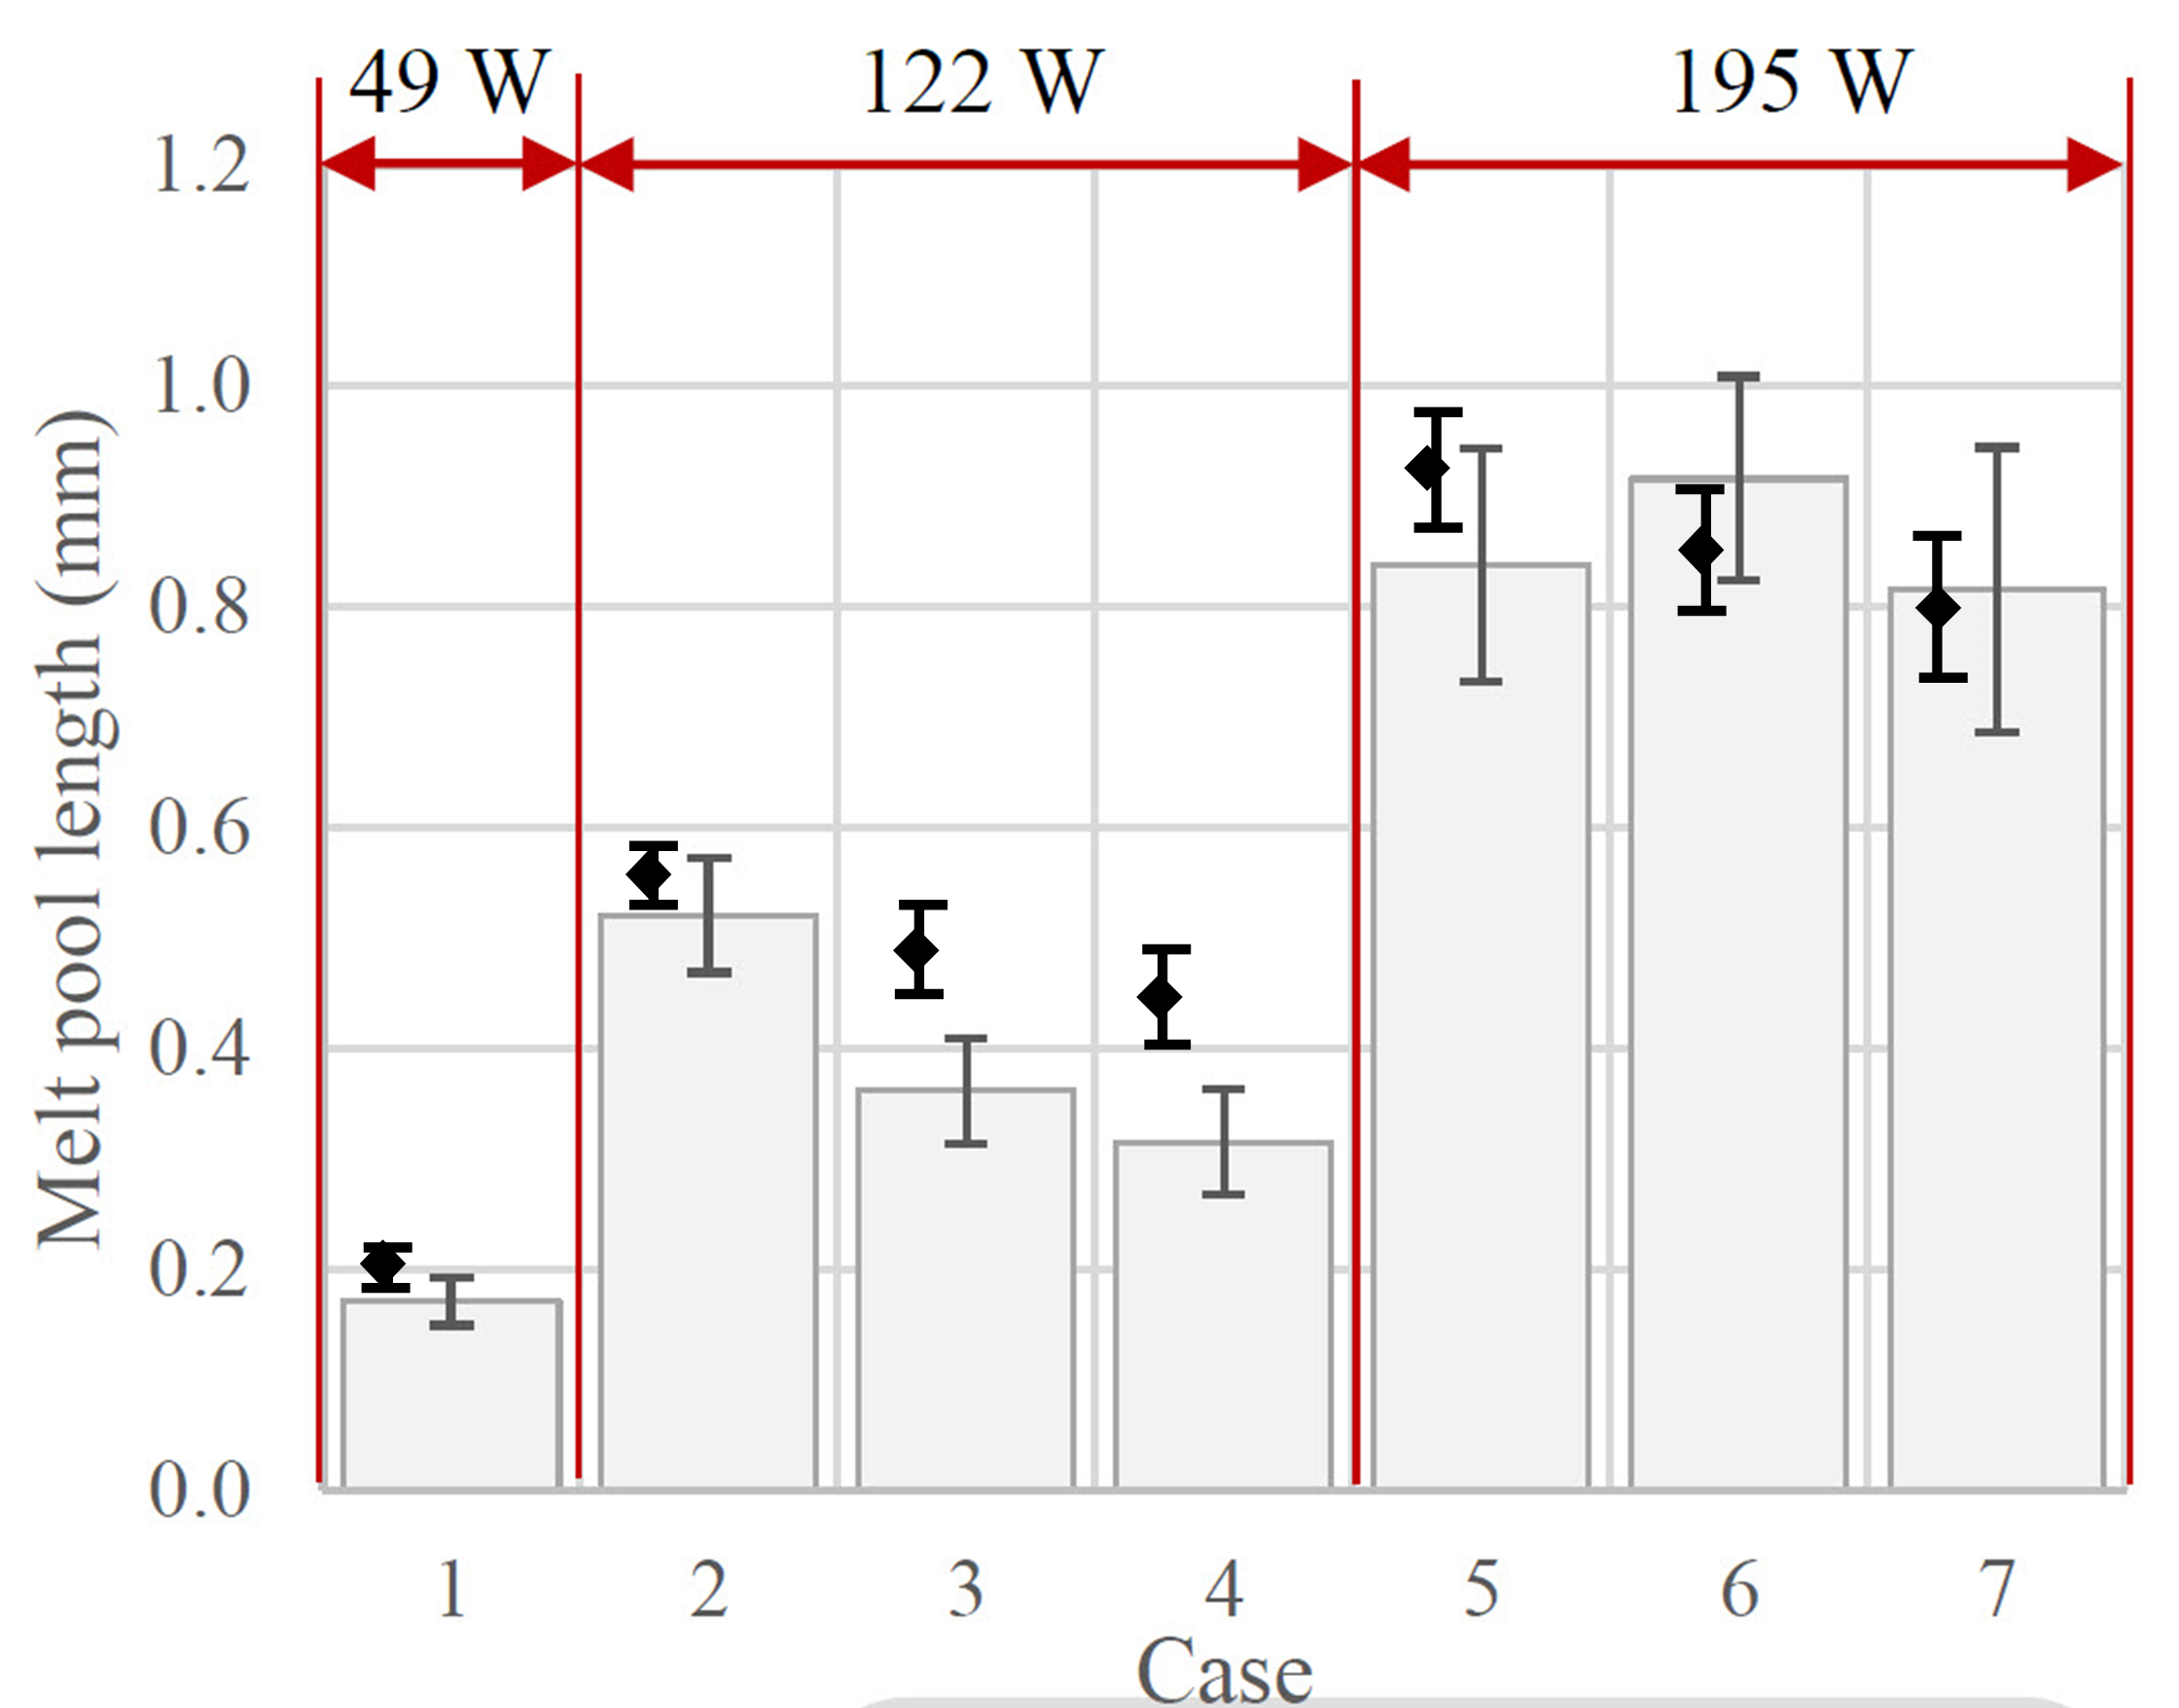
Although not shown here, the temperature is maximum at the top surface of the melt pool and varies along the melt pool length, width and height. The leading edge (in the direction of length) of the melt pool close to the laser is wide while the trailing edge of the melt pool is narrow as the material cools with increasing distance from the laser, consistent with the experiments Heigel2017 ; Heigel2017b . The periphery of such a typical melt pool shape is given by the solidus temperature (1587 K) isotherm for IN625, from which we extract the melt pool dimensions (Fig. 1). The melt pool length stabilizes typically after 2 mm from the start of the laser scan in our simulations, reaching a steady state value. Figure 2 presents the simulated melt pool length measured between and at steady state, which compares reasonably with the length values from the experiments Heigel2017 . The melt pool length increases as the laser power increases and decreases similarly as the beam speed increases, consistent with the experimental observations Heigel2017 . The melt pool length is only 5% smaller compared to the experimental value with 195 W and 800 mm s-1 (Case 7), and well within the experimental uncertainties.
Next, we present the width and height measurements of the melt pool cross section having maximum depth in the build direction (Fig. 1). Consistent with our experiments, both and increase with increasing for a constant and decrease with increasing for a constant ; varies between and , and varies between and . The calculated is within 2% of the experimental value with = 800 mm s-1. Combining the measurements of and , on average, the simulated are within 6% of the experimental measurements.
The model systematically overpredicts the melt pool depth for all the Cases (except Case 5), which is presumably due to the use of a large laser absorptivity ( = 0.5) in our simulations King2015 ; Khairallah2016 . The model underpredicts the width and depth and produces an incorrect melt pool shape for Case 5, which can be attributed to complex melt pool dynamics, such as the surface tension and recoil pressure, which we do not model as a first approximation. Case 5 signifies the onset of keyholing in experiments Heigel2017 ; Heigel2017b in which a topological depression is formed owing to the vaporization of the material under high energy input and the melt pool becomes -shaped.
3 Melt pool solidification
3.1 Experimental microstructures
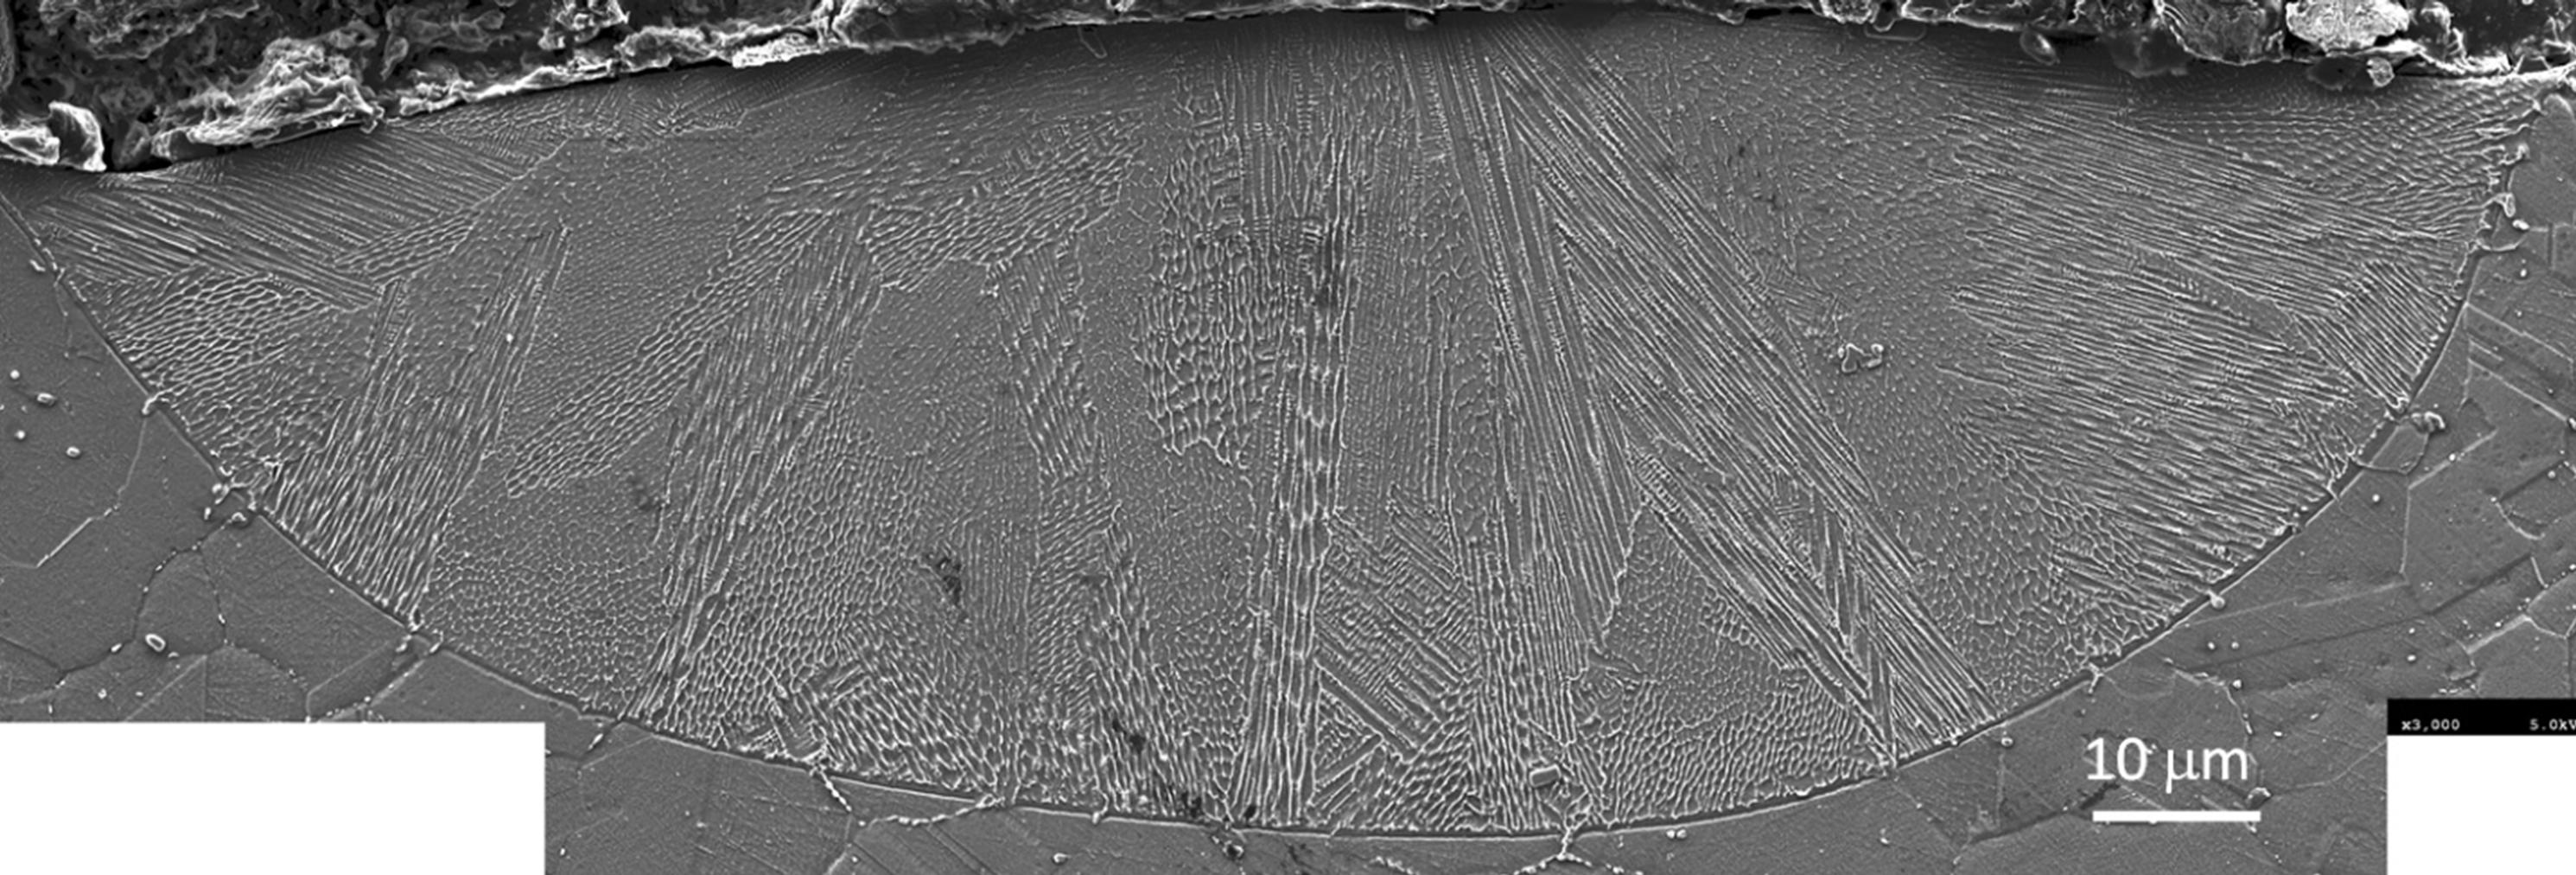
A scanning electron microscopy (SEM) analysis with standard metallographic techniques Vander1999 was used to reveal the microstructure of the solidified melt pool for 195 W and 800 mm s-1 (Case 7). The initial solid-liquid interface can be easily distinguished in Fig. 3, which evolves primarily into a cellular dendritic microstructure at steady state. On average, the microstructure is coarse close to the bottom and fine close to the rear of the solidified melt pool interface Murr2012 ; Suresh2016 ; supriyo2017 . The individual cellular grains with distinct misorientations predominantly grow throughout the melt pool, which are often observed to solidify in the same misorientation during multi-track solidification Murr2012 ; Suresh2016 . The average spacing between the primary dendrites varies between and , and the average grain size consisting of dendrites having the same orientation ranges between and . Although not shown here, one could expect from an electron backscatter diffraction analysis to show a strong, fine-scale microsegregation of Nb, Mo and others in between the dendrites Zhang2017_nist ; Eric2017 . The dendrite sizes, orientations, morphologies, and microsegregation are different at different locations within the melt pool. This is primarily due to different positions and orientations of the initial nuclei combined with different thermal gradients and solidification velocities along the melt pool boundary. In situ measurements of these solidification conditions are difficult due to the high temperature and small volume of the melt pools, and finite element simulations are used instead.
3.2 Solidification parameters
Solidification parameters are extracted from the simulated temperature and velocity fields along the melt pool dimensions. The trailing edge of the moving melt pool is the solidification front where the microstructural evolution takes place. The resulting complex solid-liquid interface morphologies such as the cells and dendrites can be characterized locally within the trailing edge of the melt pool by the average temperature gradient = and the average solidification rate . is the number of elements present between the bottom and the rear of the melt pool along the solidification front, is the temperature, and is the solidification angle at element supriyo2017 . Both and vary as a function of the melt pool dimensions. We note that both and increase as the melt pool becomes smaller with increasing (Fig. 4). On the other hand, decreases as the melt pools become larger with increasing for a constant . On average, is minimum ( K m-1) for the largest melt pool (Case 5) and maximum ( K m-1) for the smallest melt pool (Case 1). As expected, is minimum (0.05 m s-1) for the cases with smallest and maximum (0.2 m s-1) for the cases with largest .
3.3 Phase-field simulations
With the preceding calculations of the melt pool parameters, it is now possible to model the solidification process in the melt pool. We use a binary alloy phase-field model Echebarria2004 to simulate -Ni cells and microsegregation of Nb (nominal mass fraction of 4%) as a binary approximation of an IN625 microstructure. The time-dependent order parameter () and concentration () model equations of motion are solved on a uniform mesh (4805000), using the finite volume method, explicit time stepping scheme and zero-flux boundary conditions. Since the solid-liquid interface equilibrium does not hold during AM solidification supriyo2017 , the present simulations are conducted for vanishing anti-trapping solute flux term (second term inside bracket in Eq. (5) in Trevor2017 ; supriyo2017 ) to model realistic solute redistribution across the solid-liquid interfaces. The original purpose of adding this extra solute flux term to the standard Fickian diffusion flux in the concentration equation was meant to enforce local equilibrium during low velocity casting solidification simulations Echebarria2004 . The solid-liquid interfacial energy = 0.3 J m-2 Hoyt2003 , the solid-liquid cubic anisotropy parameter = 0.02 Hoyt2003 and the solid-liquid interface thickness = are approximated for a Ni-Nb alloy. For the model equations and other numerical and thermophysical parameters, refer to Trevor2017 ; supriyo2017 . Each simulation begins with a thin layer of solid at the bottom of the simulation box, accompanied with a small, random amplitude perturbation in at the initial solid-liquid interface, from which stable perturbations grow with time and break into steady state -Ni cells (Fig. 4).
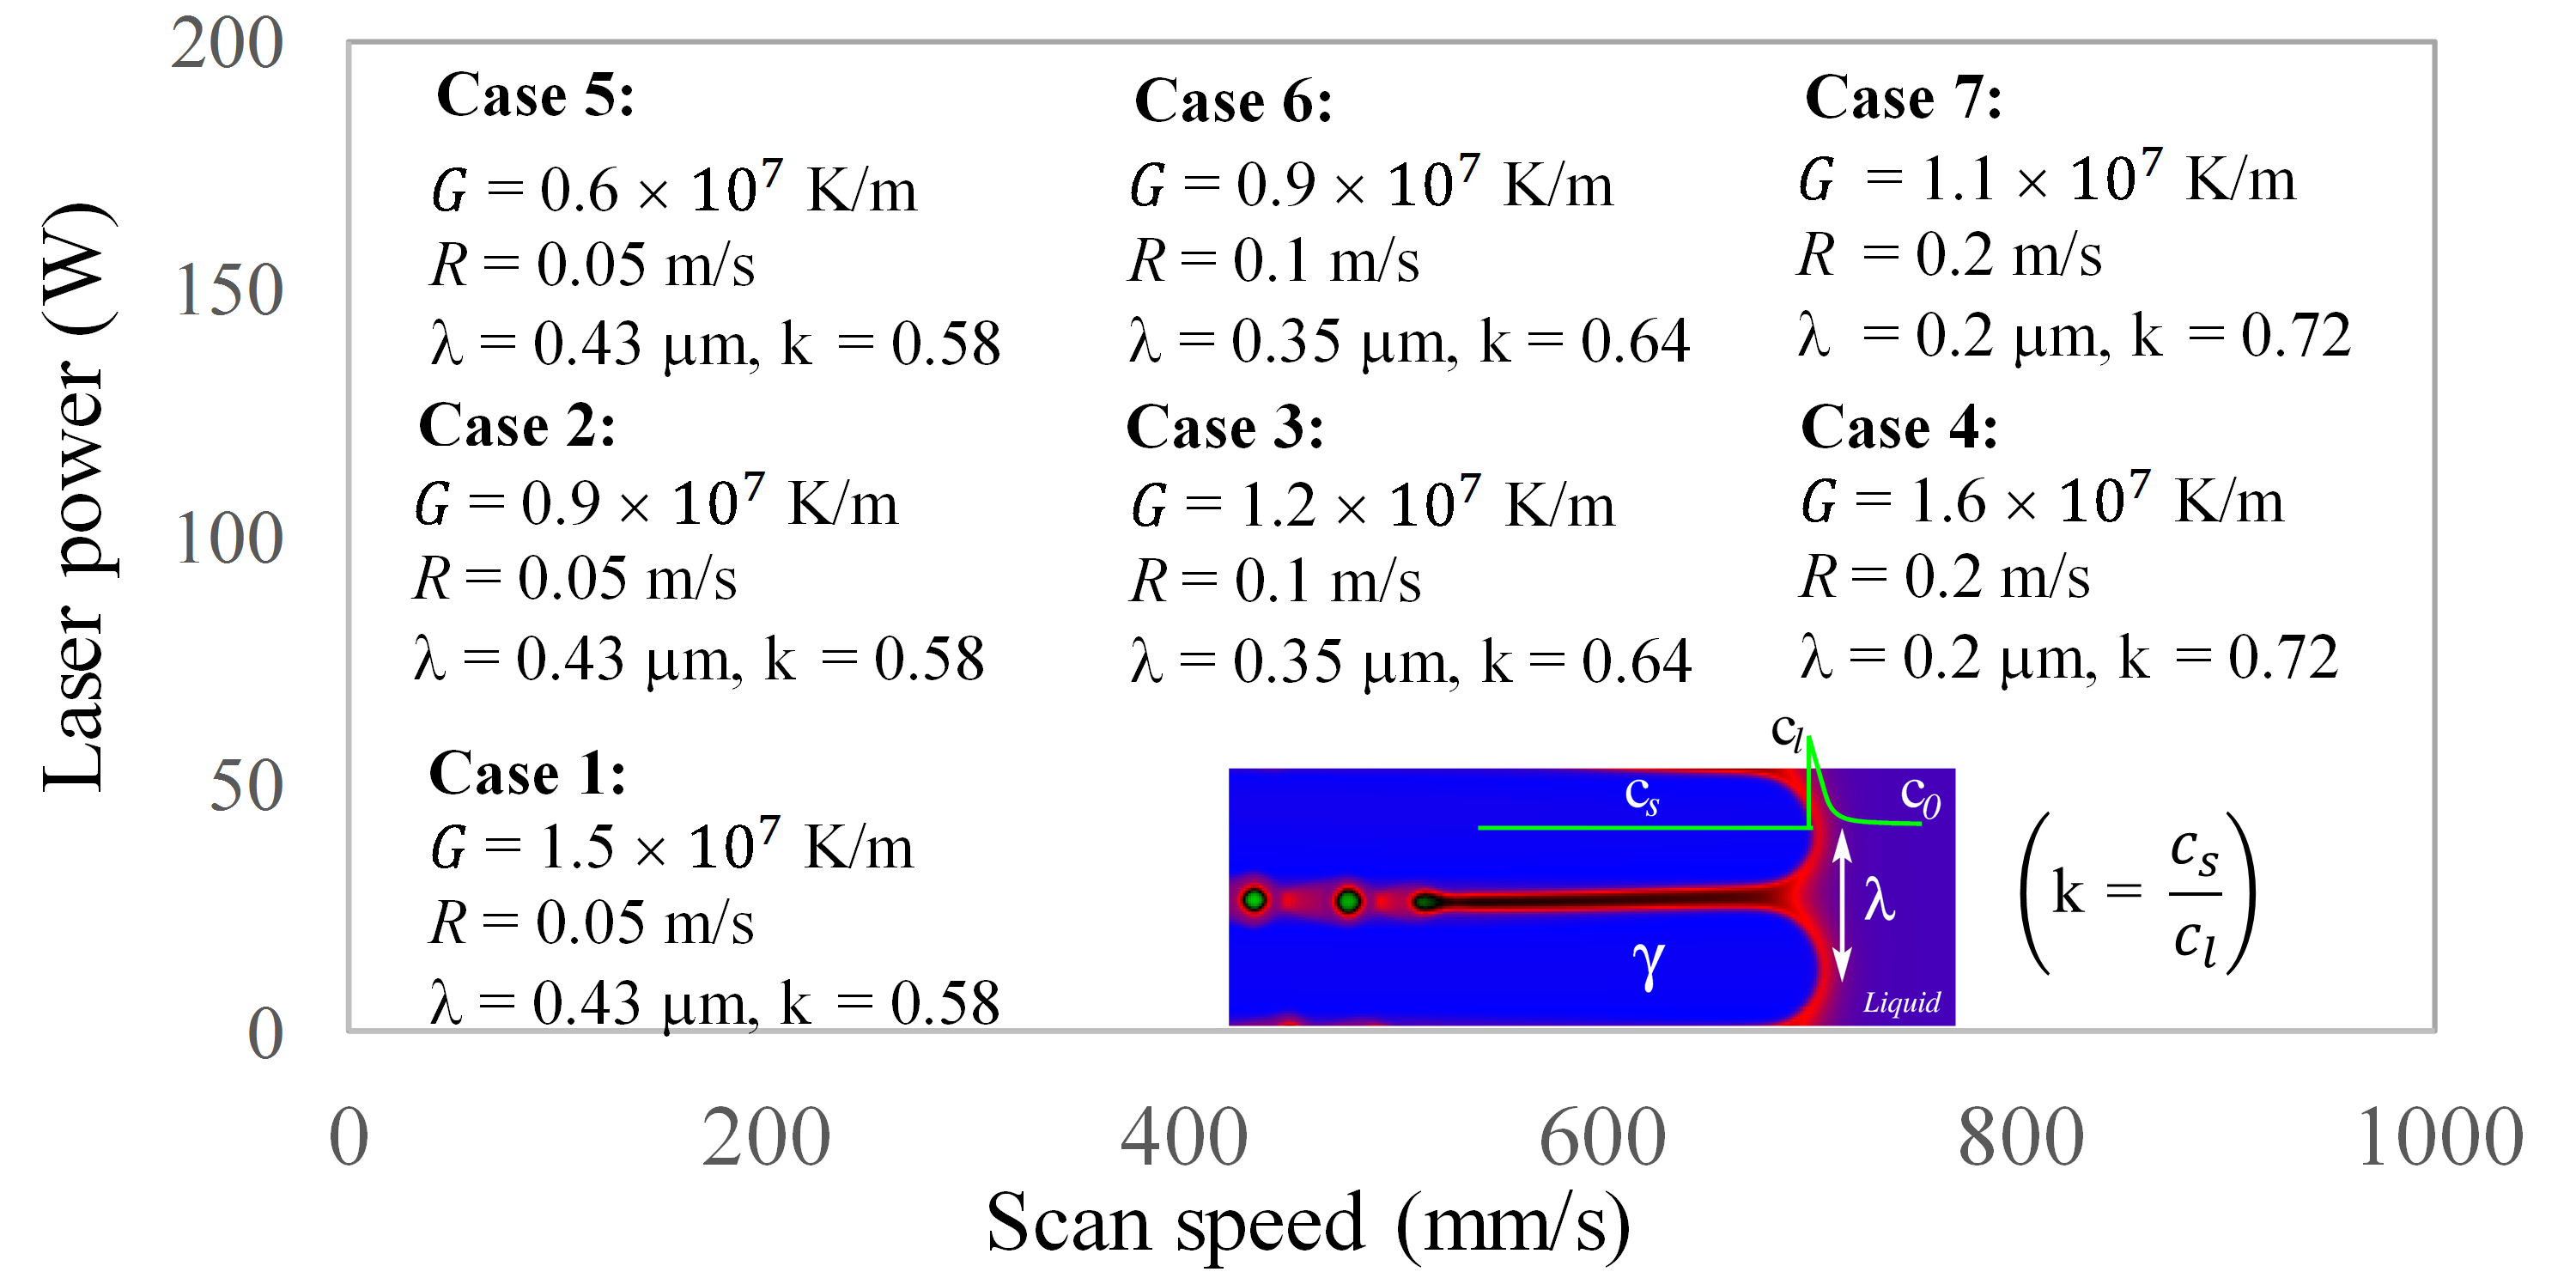
The microstructures that form during laser resolidification are governed by the combinations of and . determines the nature of the solidification front (planar, cellular or dendritic) and (cooling rate) controls the size of the solidification structure kurzbook ; Rappazbook . In our finite element calculations, varies between 80 K s mm-2 and 300 K s mm-2 and varies between K s-1 and K s-1. In this space, our simulations predict columnar dendritic morphology of the Ni-rich matrix phase. The average distance between the cells remains constant at steady state (Fig. 4), which is the primary dendrite arm spacing . We use the Fourier spectrum analysis Greenwood2004 of the solid-liquid interface of the cellular microstructures to estimate . In our simulations, decreases with increasing and ranges between and , which can be approximated following Hunt Hunt1979book : () = , where is the partition coefficient, the Gibbs Thomson coefficient, the equilibrium freezing range, the diffusivity of the liquid, and the coefficient is calculated between 0.13 to 0.17. Such extremely dense cellular microstructures improve the yield, tensile and fatigue strengths of the as-deposited material and reduce melt flow effects Tan2011 . decreases significantly with increasing , while does not seem to be affected by increasing in our simulations.
Niobium is the most important alloying element in IN625. Niobium segregates most severely from the solid cell core () to the liquid () due to the smallest equilibrium partition coefficient () among all elements in IN625, and determines the solidification pathways and the precipitation of strengthening phases in the solid state Liu2013 . Our simulations show strong microsegregation of Nb in between the cells, illustrating the presence of non-equilibrium Nb redistribution during single line laser resolidification. As a result, becomes a function of the solid-liquid interface growth rate and ranges between (Fig. 4). Note that the limit is reportedly reached only at 9 m s-1 Kurz1994 . In contrast to , increases significantly with increasing (or ), while does not seem to be affected with increasing . Such a response of the solidifying Ni-Nb melt pool boundary due to the laser treatment can be characterized using the Aziz Aziz1982 solute-trapping function given by , where = 0.23 m s-1 is the diffusion velocity of Nb during laser resolidification in IN625. The Nb-rich liquid droplets (Fig. 4) that shed from the root region of the dendrites subsequently freeze, leading to regions of highest microsegregation which could transform to intermetallic phases in the solid state Zhang2017_nist .
4 Discussion and Conclusions
In this work, we used experimental measurements of the melt pool dimensions (, and ) to validate heat conduction based finite element simulations for the map of single track laser treatments. The size of the melt pool increases with increasing and decreasing . Our simulations showed reasonable match of , , , and with experiments except when keyhole melting is observed experimentally. The ratio calculated in this case is , which is close to the value when the melt pool dimensions become a function of the surface tension, recoil pressure and other hydrodynamic effects King2015 ; Childs2005 which affect the shape and stability of the keyhole. The laser absorptivity also becomes an increasing function of the beam power, which we model as a constant ( = 0.5) for simplification reasons. Note that keyhole solidification often results in porosity, leading to poor mechanical behavior of the parts and is therefore not recommended for AM processing Montgomery2015 ; Rai2007 . The finite element simulations in Ref. Jon2017 are particularly interesting in that they characterize the melt pool dynamics on its dimensions using a high power laser beam ( = 500 W) and it was observed that the simulated melt pool dimensions increasingly deviated from the experimental measurements with increasing . For a system with low to moderate power of the laser beam and very small melt pool depth ( ), our simulations may be appropriate, as discussed in Guo2000 ; Suresh2016 .
As demonstrated by multiphysics modeling of the laser-powder-substrate interaction in Ref. King2015 , the vaporization-induced recoil force on the melt pool typically produces a “hollow” under the laser beam that extends through the powder layer into the substrate. This is even true in the conduction regime where additive manufacturing is typically carried out. Such behavior cannot be readily incorporated into a finite element model, so all such models must be seen as severe approximations, and the best way we know to validate such a model is to test if the predicted melt geometry is correct. That is the approach taken here. If the steady-state melt pool length and cross-sectional size and shape are correct, then the resulting thermal behavior as a function of time and position should be adequate for microstructure evolution studies. One drawback to this approach is that it is only valid for one material system at a time, IN625 in this case. Also, although the current finite element model should be adequate for the results reported here, it should be mentioned that although the melt pool lengths agree well with the in situ melt-pool measurements, the shapes of the melt pools are not perfect. Decreasing the absorptivity and slightly increasing the width of the laser beam would likely improve the agreement, and work in this direction is in progress along with in situ measurements of the absorptivity Matthews2017 .
The melt pool cooling rates estimated from both experiments and simulations are on the same order of magnitude K s-1. The microstructural features that form in these cooling rates in our simulations change primarily as a function of , signifying that is a more important parameter than during AM. Previous studies have shown that 1 K s mm-2 resulted in an equiaxed mode of dendritic solidification, 1 K s mm-2 80 K s mm-2 resulted in a mixed equiaxed and columnar solidification, and 80 K s mm-2 resulted in columnar solidification in Inconel alloys Raghavan2016 . In our simulations, ranges between 80 K s mm-2 s and 300 K s mm-2 and produces columnar dendritic morphologies. The solidification map is determined by various combinations of and and therefore can be used, for example, to engineer the appropriate grain morphology and grain size for different sections of the AM parts. The simulations of melt pool solidification in Ref. Ranadip2017 are particularly interesting where an initial solid-liquid interface, similar to the resolidification boundary in our Fig. 3, resulted in local nucleation and growth of multiple dendrites with a misorientation with the vertical direction between 0∘ to 20∘ depending on the scan velocity, thermal gradient, interface roughness and initial seed position.
Unlike finite element simulations, the microstructure evolution for the calculated solidification map does not depend much on melt pool dynamics. This is precisely due to the extremely fine cellular structures, which provide significant resistance to fluid flow following an exponential increase of the damping effect in the semisolid mushy region Tan2011 . Phase-field simulations performed on Ni-Nb alloys showed that the solute redistribution across dendrites remained similar when simulations were conducted with and without convection Lee2010 . The effects of convection on the spacing between primary dendrite arms is not as pronounced as compared to the spacing between side arms Lee2010 , which we do not observe in our simulations. Therefore, melt pool solidification is modeled with reasonable approximations for the same parameter combinations in both experiments and simulations. Further research is required for more accurate characterization of the melt pool dimensions and multicomponent solidification microstructures Ghosh2017_eutectic with and without melt pool dynamics in order to improve the predictive capabilities for the quality of the as-built parts, although it will be computationally intensive.
References
- (1) Murr, L.E., Martinez, E., Amato, K.N., Gaytan, S.M., Hernandez, J., Ramirez, D.A., Shindo, P.W., Medina, F., Wicker, R.B.: Journal of Materials Research and Technology 1(1), 42 – 54 (2012)
- (2) King, W.E., Anderson, A.T., Ferencz, R.M., Hodge, N.E., Kamath, C., Khairallah, S.A., Rubenchik, A.M.: Applied Physics Reviews 2(4), 041,304 (2015)
- (3) Francois, M., Sun, A., King, W., Henson, N., Tourret, D., Bronkhorst, C., Carlson, N., Newman, C., Haut, T., Bakosi, J., Gibbs, J., Livescu, V., Wiel, S.V., Clarke, A., Schraad, M., Blacker, T., Lim, H., Rodgers, T., Owen, S., Abdeljawad, F., Madison, J., Anderson, A., Fattebert, J.L., Ferencz, R., Hodge, N., Khairallah, S., Walton, O.: Current Opinion in Solid State and Materials Science 21(4), 198–206 (2017)
- (4) Heigel, J.C., Lane, B.M.: In: MSEC, vol. 2017 (2017)
- (5) Heigel, J.C., Lane, B.M.: In: Solid Freeform Fabrication Symposium, vol. 2017 (2017)
- (6) Montgomery, C., Beuth, J., Sheridan, L., Klingbeil, N.: In: Solid Freeform Fabrication Symposium, vol. 2015, pp. 1195–1204 (2015)
- (7) Childs, T., Hauser, C., Badrossamay, M.: Proc. Inst. Mech. Eng., Part B: Journal Engineering Manufacturing 219(4), 339–357 (2005)
- (8) Gong, H., Gu, H., Zeng, K., Dilip, J., Pal, D., Stucker, B., Christiansen, D., Beuth, J., Lewandowski, J.J.: In: Solid freeform fabrication symposium, vol. 2014, pp. 256–267 (2014)
- (9) Lane, B., Moylan, S., Whitenton, E., Ma, L.: Rapid Prototyping Journal 22(5), 778–787 (2016)
- (10) King, W.E., Barth, H.D., Castillo, V.M., Gallegos, G.F., Gibbs, J.W., Hahn, D.E., Kamath, C., Rubenchik, A.M.: Journal of Materials Processing Technology 214(12), 2915 – 2925 (2014)
- (11) Khairallah, S.A., Anderson, A.T., Rubenchik, A., King, W.E.: Acta Materialia 108, 36 – 45 (2016)
- (12) Guo, W., Kar, A.: Science and Technology of Welding and Joining 5(5), 317–323 (2000)
- (13) Gong, X., Chou, K.: JOM 67(5), 1176–1182 (2015)
- (14) Kurz, W., Fisher, D.J.: Fundamentals of Solidification. Trans Tech Publications, Zurich, Switzerland (1998)
- (15) Rappaz, M., Dantzig, J.A.: Solidification. Engineering sciences. EFPL Press (2009)
- (16) Sames, W.J., List, F.A., Pannala, S., Dehoff, R.R., Babu, S.S.: International Materials Reviews 61(5), 315–360 (2016)
- (17) Keller, T., Lindwall, G., Ghosh, S., Ma, L., Lane, B., Zhang, F., Kattner, U.R., Lass, E.A., Heigel, J.C., Idell, Y., Williams, M.E., Allen, A.J., Guyer, J.E., Levine, L.E.: Acta Materialia 139, 244–253 (2017)
- (18) Ghosh, S., Ma, L., Ofori-Opoku, N., Guyer, J.E.: Modelling and simulation in materials science and engineering 25(6), 065,002 (2017)
- (19) Ma, L., Fong, J., Lane, B., Moylan, S., Fillibenm, J., Hecker, A., Levine, L.: In: Proceedings of the 26th Annual International Solid Freeform Fabrication Symposium: An Additive Manufacturing Conference, pp. 219–228 (2015)
- (20) Dayal, R.: Ph.D. thesis, Technische Universität (2014)
- (21) Vander Voort, G.: Metallography, principles and practice. McGraw-Hill series in materials science and engineering. ASM International, Materials Park, OH (1999)
- (22) Zhang, F., Levine, L.E., Allen, A.J., Campbell, C.E., Lass, E.A., Cheruvathur, S., Stoudt, M.R., Williams, M.E., Idell, Y.: Scripta Materialia 131, 98 – 102 (2017)
- (23) Lass, E.A., Stoudt, M.R., Wililiams, M.E., Katz, M., Levine, L.E., Phan, T., Gnaeupel-Herold, T., Ng, D.: Metall. Mater. Trans. A 48(11), 5547–5558 (2017)
- (24) Echebarria, B., Folch, R., Karma, A., Plapp, M.: Physical Review E 70(6), 061,604 (2004)
- (25) Hoyt, J., Asta, M., Karma, A.: Materials Science and Engineering: R: Reports 41(6), 121–163 (2003)
- (26) Greenwood, M., Haataja, M., Provatas, N.: Phys. Rev. Lett. 93, 246,101 (2004)
- (27) Hunt, J.D.: The Metal Society, London 3 (1979)
- (28) Tan, W., Bailey, N.S., Shin, Y.C.: Computational Materials Science 50(9), 2573 – 2585 (2011)
- (29) Liu, F., Lin, X., Leng, H., Cao, J., Liu, Q., Huang, C., Huang, W.: Optics & Laser Technology 45, 330 – 335 (2013)
- (30) Kurz, W., Trivedi, R.: Materials Science and Engineering: A 179, 46 – 51 (1994)
- (31) Aziz, M.J.: Journal of Applied Physics 53(2), 1158–1168 (1982)
- (32) Rai, R., Elmer, J.W., Palmer, T.A., DebRoy, T.: Journal of physics D: Applied physics 40(18), 5753 (2007)
- (33) Arrizubieta, J.I., Lamikiz, A., Klocke, F., Martínez, S., Arntz, K., Ukar, E.: International Journal of Heat and Mass Transfer 115, 80–91 (2017)
- (34) Matthews, M.: (2017). Private communication
- (35) Raghavan, N., Dehoff, R., Pannala, S., Simunovic, S., Kirka, M., Turner, J., Carlson, N., Babu, S.S.: Acta Materialia 112, 303–314 (2016)
- (36) Acharya, R., Sharon, J.A., Staroselsky, A.: Acta Materialia 124, 360–371 (2017)
- (37) Yuan, L., Lee, P.D.: Modelling and Simulation in Materials Science and Engineering 18(5), 055,008 (2010)
- (38) Ghosh, S., Plapp, M.: Acta Materialia 140, 140 – 148 (2017)