2017 December 08 \Accepted2018 February 14 \Publishedpublication date ${\dagger}$${\dagger}$affiliationtext: NAOJ Fellow ${\ddagger}$${\ddagger}$affiliationtext: EACOA Fellow \KeyWordsquasars: general — galaxies: high-redshift — galaxies: starburst — galaxies: ISM
Subaru High-z Exploration of Low-Luminosity Quasars (SHELLQs) III. Star formation properties of the host galaxies at studied with ALMA
Abstract
We present our ALMA Cycle 4 measurements of the [C \emissiontypeII] emission line and the underlying far-infrared (FIR) continuum emission from four optically low-luminosity () quasars at discovered by the Subaru Hyper Suprime Cam (HSC) survey. The [C \emissiontypeII] line and FIR continuum luminosities lie in the ranges and , which are at least one order of magnitude smaller than those of optically-luminous quasars at . We estimate the star formation rates (SFR) of our targets as . Their line and continuum-emitting regions are marginally resolved, and found to be comparable in size to those of optically luminous quasars, indicating that their SFR or likely gas mass surface densities (key controlling parameter of mass accretion) are accordingly different. The ratios of the hosts, , are fully consistent with local star-forming galaxies. Using the [C \emissiontypeII] dynamics, we derived their dynamical masses within a radius of 1.5–2.5 kpc as . By interpreting these masses as stellar ones, we suggest that these faint quasar hosts are on or even below the star-forming main sequence at , i.e., they appear to be transforming into quiescent galaxies. This is in contrast to the optically luminous quasars at those redshifts, which show starburst-like properties. Finally, we find that the ratios of black hole mass to host galaxy dynamical mass of the most of low-luminosity quasars including the HSC ones are consistent with the local value. The mass ratios of the HSC quasars can be reproduced by a semi-analytical model that assumes merger-induced black hole-host galaxy evolution.
1 Introduction
Mass accretion onto a supermassive black hole (SMBH, with a mass of ) produces an enormous amount of energy, observable as an active galactic nucleus (AGN) or a quasar (Salpeter, 1964). SMBHs reside at the centers of massive galaxies, and show tight correlations between and the properties of the host galaxies, such as bulge stellar mass () and stellar velocity dispersion () in the local universe (e.g., Ferrarese & Merritt, 2000; Marconi & Hunt, 2003; Kormendy & Ho, 2013). The remarkable similarity between global star formation and mass accretion histories (Madau & Dickinson, 2014, for a review), as well as correlations between luminosities associated with AGN and with star formation in luminous systems 111Note that recent works suggest that this trend is driven by a dependence of SFR on the redshift and stellar mass (e.g., Yang et al., 2017). (e.g., Lutz et al., 2010; Chen et al., 2013), support the rapid growth of SMBHs in tandem with the stellar mass build-up of galaxies.
Physical mechanisms that may lead to such co-evolutionary scenarios include mergers of galaxies and subsequent AGN feedback to regulate star formation in the host. Both AGN and star formation may fed by a common supply of the cold interstellar medium (ISM). Hydrodynamic simulations based on this framework reproduce the observed properties of AGN and star formation (e.g., Di Matteo et al., 2005; Hopkins et al., 2006; Li et al., 2007). Detections of massive AGN-driven outflows (e.g., Nesvadba et al., 2008; Aalto et al., 2012; Greene et al., 2012; Maiolino et al., 2012; Cicone et al., 2014; Toba et al., 2017) may also provide an important coupling between the SMBH and its host galaxy. Semi-analytic galaxy evolution models (Somerville & Davé, 2015, for a review) predict intense star formation (star formation rate (SFR) reaching yr-1) and SMBH accretion (accretion rate reaching yr-1) with very short characteristic time scales, on the order of 100 Myr (e.g., Hopkins et al., 2008; Volonteri et al., 2015), particularly at the peak epoch of galaxy formation ().
One effective way to further test galaxy evolution models is to determine whether co-evolutionary scenarios have arisen in the early universe (Volonteri, 2012; Gallerani et al., 2017; Valiante et al., 2017). To date, more than 200 quasars have been discovered through various wide-field optical to near-infrared surveys, including SDSS (e.g., Fan et al., 2003, 2006; Jiang et al., 2016), CFHQS (Willott et al., 2007, 2009, 2010b), VIKING (Venemans et al., 2013, 2015b), UKIDSS (Mortlock et al., 2009, 2011), Pan-STARRS1 (e.g., Bañados et al., 2014, 2016; Mazzucchelli et al., 2017), DES (e.g., Reed et al., 2017), DECaLS (Wang et al., 2017), SCam and HSC (Kashikawa et al., 2015; Matsuoka et al., 2016, 2017), and several other projects (e.g., Carnall et al., 2015; Wu et al., 2015). Most of these surveys probed the bright end of the quasar population (UV magnitude ) powered by almost Eddington-limited mass accretion onto massive ( ) SMBHs (Willott et al., 2010a; De Rosa et al., 2014).
It is very challenging to detect the rest-frame optical emission from the host galaxy of a quasar at high redshift (), due to surface brightness dimming and the large brightness contrast (Mechtley et al., 2012; Targett et al., 2012). However, cold gas and dust emission from star-forming regions have been used instead to probe the hosts at wavelengths relatively free from quasar emission. This approach has been advanced thanks to the advent of large and sensitive (sub)millimeter (hereafter sub/mm) interferometric arrays, such as the IRAM Plateau de Bure interferometer (now NOEMA) and the Atacama Large Millimeter/submillimeter Array (ALMA). Observations of galaxies hosting luminous quasars at have revealed large reservoirs of dust () and cold molecular gas () with high far-infrared (FIR) luminosities (), indicating vigorous star formation activity (SFR yr-1) coeval with the central AGNs (e.g., Bertoldi et al., 2003a, b; Petric et al., 2003; Priddey et al., 2003, 2008; Robson et al., 2004; Walter et al., 2004; Wang et al., 2007, 2008, 2010, 2011a, 2011b; Omont et al., 2013; Gallerani et al., 2014; Stefan et al., 2015), and placing tight constraints on early star formation and dust formation histories (e.g., Calura et al., 2014; Valiante et al., 2014).
Interferometric studies of the strong 157.74 [C \emissiontypeII] 2P3/2 2P1/2 emission line (rest frequency 1900.539 GHz), which is the principal coolant of photodissociation regions of galaxies (Stacey et al., 1991; Hollenbach & Tielens, 1999), has also been an important tracer of the hosts of high- quasars. Such observations have revealed vigorous star-forming activity located in relatively compact regions (a few kpc in diameter) as well as the cold gas dynamics of galaxies, hosting not only luminous quasars (Maiolino et al., 2005; Wang et al., 2013, 2016; Bañados et al., 2015; Venemans et al., 2016, 2017; Decarli et al., 2017, 2018; Mazzucchelli et al., 2017) but also less luminous () quasars (Willott et al., 2013, 2015, 2017). These dynamical studies revealed that luminous quasars have, on average, 10 times more massive SMBHs than the local co-evolutionary relations for a given velocity dispersion or dynamical mass of the host 222[C \emissiontypeII] velocity dispersion () is widely used as a surrogate for a stellar velocity dispersion in the case of high- quasars., implying that SMBHs were formed significantly earlier than their hosts (e.g., Lamastra et al., 2010).
However, there would be a selection bias for high redshift quasars toward more luminous objects or more massive SMBHs if the underlying distribution has a large scatter for a given galaxy mass (Willott et al., 2005; Lauer et al., 2007; Schulze & Wisotzki, 2014). Therefore, it is vital to probe lower luminosity quasars and their hosts to obtain an unbiased view of early co-evolution that accounts for the bulk of the SMBH population at that time (e.g., Schramm & Silverman, 2013). Indeed, studies of less luminous () CFHQS quasars with lower mass SMBHs () have revealed that their dynamical masses are well matched to those of local galaxies (Willott et al., 2015, 2017). This lower luminosity regime is now being extensively explored with our wide-field and sensitive survey with the Hyper Suprime-Cam (HSC; Miyazaki et al., 2012, 2017; Komiyama et al., 2017; Kawanomoto et al., 2017; Furusawa et al., 2017) mounted on the Subaru telescope: we have discovered more than 50 quasars at (Matsuoka et al., 2016, 2017). We have organized an extensive multiwavelength follow-up consortium: Subaru High-z Exploration of Low-Luminosity Quasars (SHELLQs).
In this paper, we report ALMA Cycle 4 observations of the [C \emissiontypeII] 158 m emission line and the underlying rest-frame FIR continuum emission of four HSC quasar host galaxies at (Table 2), i.e., J0859+0022 (Ly-based redshift ), J1152+0055 (), J2216-0016 (), and J1202-0057 (), originally discovered by Matsuoka et al. (2016). These HSC quasars are magnitudes fainter than most of the luminous-end quasars () so far studied in the rest-FIR, and are comparably faint to the low-luminosity CFHQS quasars at (Willott et al., 2007, 2010b). We describe our observations in section 2. The observed properties of both [C \emissiontypeII] line and FIR continuum emission are presented in section 3. Then we discuss the star-forming nature of the HSC quasar hosts and the less biased early co-evolution in section 4, and present our conclusions in section 5. Throughout the paper, we assume the standard cosmology with = 70 km s-1 Mpc-1, = 0.3, and = 0.7.
2 Observations and data reduction
Four HSC quasars were observed during ALMA Cycle 4 (ID = 2016.1.01423.S, PI: T. Izumi) at band 6 between 2016 December 2 and 2017 April 13. Our observations are summarized in Table 2, along with the basic target information. These observations were conducted in a single pointing (2 side-band dual-polarization mode) with diameter field of view, which corresponds to kpc at the source redshifts (1 corresponds to 5.5–5.8 kpc). The phase tracking centers were set to the optical quasar locations (Matsuoka et al., 2016). The absolute positional uncertainty is according to the ALMA Knowledgebase333https://help.almascience.org/index.php?/Knowledgebase/List. With the minimum baseline length (15.1 m), the maximum recoverable scale of our observations is .
The receivers were tuned to cover the redshifted [C \emissiontypeII] line emissions whose frequencies were estimated from the measured redshifts of Ly. The total bandwidth of these observations was GHz, divided into four spectral windows of width 1.875 GHz. The native spectral resolution was 3.906 MHz (4.4–4.8 km s-1), but 11–12 channels were binned to improve the signal-to-noise ratio (), resulting in a final common velocity resolution of km s-1.
Reduction and calibration of the data were performed
with the Common Astronomy Software Applications (CASA)
package (McMullin et al., 2007) version 4.7 in the standard manner.
All images were reconstructed with the CASA task clean
(gain = 0.1, weighting = briggs, robust = 0.5).
The achieved synthesized beams and rms sensitivities
at a velocity resolution of 50 km s-1 are summarized in Table 2.
All channels free of line emissions ( GHz) were averaged
to generate a continuum map for each source.
The synthesized beams and rms sensitivities
of these maps are also listed in Table 2.
For each source, the continuum emission was subtracted
in the (, ) plane before making the line cube.
We used line intensities corrected for the primary beam attenuation for quantitative discussions,
but this had a negligible effect, as all emission
was found to lie in the central of each image.
The pixel scale of all maps in this paper is set to 0.1.
Only statistical errors are displayed unless otherwise mentioned.
Note that the systematic uncertainty of the absolute flux calibration at ALMA band 6 is 10%,
according to the ALMA Cycle 4 Proposer’s Guide
444https://almascience.nao.ac.jp/proposing/documents-and-tools/cycle4/alma-proposers-guide.
*5c
Description of our sample and the ALMA observations
J0859+0022 J1152+0055 J2216-0016 J1202-0057
\endhead\endfootNote. Rest-frame UV properties are adapted from Matsuoka et al. (2016, 2017).
\endlastfootRA (J2000.0) \timeform08h59m07s.19 \timeform11h52m21s.27 \timeform22h16m44s.47 \timeform12h02m46s.37
Dec (J2000.0) \timeform00D22’55”.9 \timeform00D55’36”.6 \timeform00D16’50’.1 \timeform00D57’01”.7
6.39 6.37 6.10 5.93
24.09 25.31 23.82 22.83
Number of antennas 45 45 40–41 42–45
Baseline (m) 15.1–704.1 15.1–704.1 15.1–704.1 15.1–492.0
On-source time (minute) 105 17 99 205
Bandpass calibrator J0854+2006 J1229+0203 J2148+0657 J1229+0203
Complex gain calibrator J0909+0121 J1220+0203 J2226+0052 J1220+0203
Flux calibrator J0750+1231, J0854+2006 J1229+0203 J2148+0657 J1229+0203
(K) 80–100 70 80–110 90–150
[C \emissiontypeII] cube
Beam size: 0.64 0.47 0.52 0.47 0.54 0.43 0.79 0.71
Position Angle (East of North) 60.9 72.3 62.2 79.4
rms noise per 50 km s-1 0.12 0.24 0.18 0.12
(mJy beam-1)
rms noise per 50 km s-1 0.25 0.52 0.41 0.21
(mJy beam-1; 1.5 aperture)
Continuum map
Observed continuum frequency (GHz) 249.5 250.0 259.6 265.5
Beam size: 0.56 0.50 0.54 0.50 0.56 0.45 0.81 0.73
Position Angle (East of North) 61.2 70.1 62.2 80.0
rms noise: 9.5 20.7 13.2 8.8
(Jy beam-1)
rms noise: 23.4 32.3 27.1 12.2
(Jy beam-1; 1.5 aperture)
3 Results
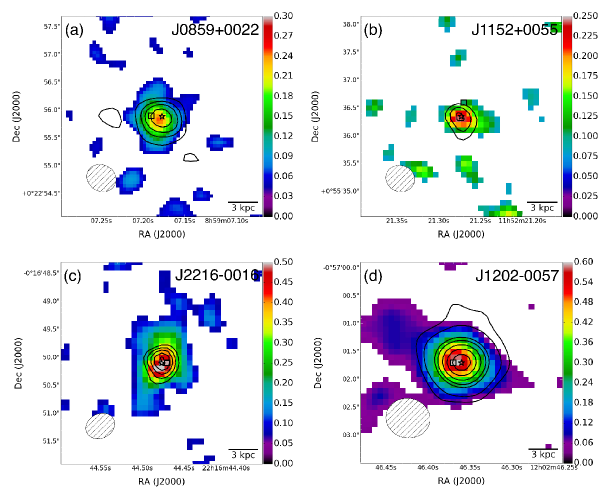
Figure 1 shows the spatial distribution of
the velocity-integrated (i.e., 0th moment) [C \emissiontypeII] line
and mm (or m)
continuum emission of the HSC quasars.
Both line and continuum emission were clearly detected for all sources,
with no apparent spatial offset among the line, 1.2 mm continuum, and optical centroids.
Note that the velocity ranges which encompass the [C \emissiontypeII] line emission
were integrated over (using CASA task immoments) to make the moment-0 maps.
The emission appears to be slightly extended relative to the synthesized beams.
Given this, we decided to measure the rest-frame FIR properties
with a common 1.5 diameter circular aperture.
The rms sensitivities within this aperture are also listed in Table 2.
The resultant properties are summarized in Table 3.
*5c
Rest-frame FIR properties of the HSC quasars
J0859+0022 J1152+0055 J2216-0016 J1202-0057
\endhead\endfootNote. These were measured with a common 1.5 aperture.
The (far-)infrared luminosities were estimated with a gray body spectrum model.
/ yr-1 = 1.0 10-7 (/)0.98 (De Looze et al., 2011).
(Murphy et al., 2011).
\endlastfoot 6.3903 0.0005 6.3637 0.0005 6.0962 0.0003 5.9289 0.0002
FWHM (km s-1) 346 46 192 45 356 33 335 24
(Jy km s-1) 0.45 0.05 0.37 0.08 1.05 0.08 0.68 0.04
(108 ) 4.6 0.5 3.8 0.8 10.2 0.8 6.2 0.4
(Jy) 157 23 189 32 136 27 246 12
EW (m) 1.50 0.28 1.02 0.27 4.08 0.87 1.44 0.11
SFR ( yr-1) 31 4 25 5 67 5 42 3
= 47 K, = 1.6
(1011 ) 3.4 0.5 4.1 0.7 2.8 0.6 4.8 0.2
(1011 ) 4.8 0.7 5.8 1.0 3.9 0.8 6.7 0.3
SFRTIR ( yr-1) 71 10 86 14 58 11 100 5
() 2.4 0.4 2.9 0.5 2.0 0.4 3.4 0.2
() 1.4 0.3 0.9 0.2 3.7 0.8 1.3 0.1
= 35 K, = 1.6
(1011 ) 1.5 0.2 1.7 0.3 1.2 0.2 2.0 0.1
(1011 ) 1.9 0.3 2.3 0.4 1.5 0.3 2.7 0.1
SFRTIR ( yr-1) 28 4 34 6 23 5 40 2
() 5.0 0.7 6.0 1.0 4.1 0.8 7.1 0.3
() 3.2 0.6 2.2 0.6 8.7 1.8 3.1 0.2
3.1 [C \emissiontypeII] line properties
Figure 2 shows the [C \emissiontypeII] line spectra measured with the 1.5 diameter aperture. We fit each continuum-subtracted spectrum with a single Gaussian profile to extract the redshift (), line width (full width at half maximum = FWHM), and the velocity-integrated line flux () of each source, as listed in Table 2. The line profiles were well fit with the single Gaussians (i.e., we found no strong indication of [C \emissiontypeII] outflows), although we will examine the case of a double-Gaussian fit to J2216-0016 in subsection 3.5, as it is a broad absorption line quasar clearly showing nuclear outflows associated with it. However, as further observations are needed to confirm the necessity of the double-Gaussian fit, we use the results from the single Gaussian fit to be consistent across the sample.
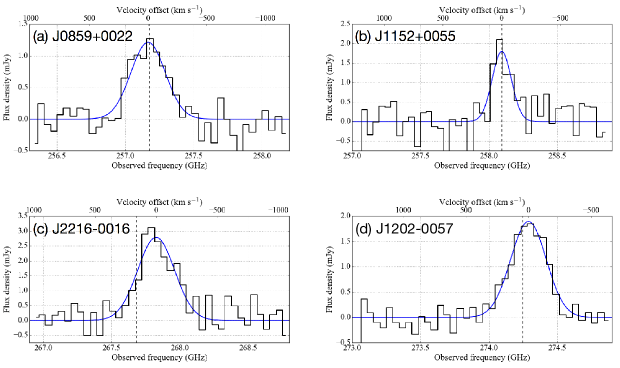
The velocity centroids of the [C \emissiontypeII] lines show no significant offset from those determined based on their Ly emission lines (Matsuoka et al., 2016), even though the latter could have considerable uncertainties, due to intergalactic absorption (e.g., Eilers et al., 2017). On the other hand, some quasars show km s-1 shifts (mostly blueshifts) of the Mg \emissiontypeII line relative to the [C \emissiontypeII] line (e.g., Bañados et al., 2015; Willott et al., 2015; Venemans et al., 2016; Wang et al., 2016; Trakhtenbrot et al., 2017), suggesting fast ionized outflows at the nuclei of those quasars. The difference between and is a measure of the neutral fraction of the intergalactic medium at , but this analysis is beyond the scope of this paper. The FWHMs of our HSC quasars are comparable to those of previously observed high-redshift quasars (e.g., Wang et al., 2013; Willott et al., 2015; Venemans et al., 2016), which lie in the range of km s-1.
We also calculated the [C \emissiontypeII] line luminosities of our sources with the standard equation of (Solomon & Vanden Bout, 2005). Here, is the [C \emissiontypeII] line luminosity in units of , is in units of GHz, is in units of Jy km s-1, and is the luminosity distance in units of Mpc, respectively. We obtained , with only the most luminous J2216-0016 reaching 109 . This is in clear contrast to the corresponding values for optically luminous quasars, (Maiolino et al., 2005; Venemans et al., 2012, 2016, 2017; Wang et al., 2013, 2016; Bañados et al., 2015). At these redshifts, FIR/submm-selected dusty starburst galaxies also exhibit (Riechers et al., 2013; Strandet et al., 2017). On the other hand, the values for the HSC quasars are comparable to those of the less luminous CFHQS quasars (Willott et al., 2013, 2015, 2017), as well as to those of UV/optically-selected galaxies at (e.g., Aravena et al., 2016).
If we attribute the heating source of the [C \emissiontypeII] emission to young stars, as is commonly assumed, the above trend indicates a lower SFR in the host galaxies of less luminous quasars. We then applied the relation in De Looze et al. (2011) of / yr-1 = 1.0 10-7 (/)0.98 to derive the values listed in Table 2. This relation, with a dispersion of dex (this is not included in the errors of the derived SFR), is calibrated with the Kroupa initial mass function (IMF; Kroupa, 2001) for galaxies of . It is consistent with that in Sargsyan et al. (2014), which is independently calibrated with infrared [Ne \emissiontypeII] and [Ne \emissiontypeIII] lines (see also Herrera-Camus et al., 2015). The possible contribution of quasars to the [C \emissiontypeII] line heating (e.g., Stacey et al., 2010) is neglected here, as (i) the so-called [C \emissiontypeII]-deficit that would imply an influence of AGN on the FIR properties in cases of quasars was not seen in our sample (subsection 4.1), and (ii) the measured [C \emissiontypeII] equivalent widths of the HSC quasars (EW; Table 2) are consistent with the typical values of local starburst galaxies (e.g., Díaz-Santos et al., 2013; Sargsyan et al., 2014). J2216-0016 even has an EW (4.08 0.87 ) at the high-end of the range for local galaxies. Furthermore, a possible dependence of [C \emissiontypeII] strength on the gas-phase metallicity (Harikane et al., 2017) is also neglected as the HSC quasar hosts are found to be massive (section 4), implying that they would be evolved systems. The derived SFRs (25–67 yr-1), and the values themselves, are well within the range of local luminous infrared galaxy (LIRG)-class systems, (e.g., De Looze et al., 2011; Díaz-Santos et al., 2013; Sargsyan et al., 2014), although the HSC quasars are located at .
3.2 FIR continuum properties
The observed mm continuum emission (; Table 2) is primarily emitted from the thermal dust (e.g., Yun et al., 2000; Carilli et al., 2001; Beelen et al., 2006). We used this to derive the FIR (42.5–122.5 m; Helou et al., 1988) continuum luminosity , which traces SFR if we assume that the cold dust is primarily heated by young stars (e.g., Kennicutt, 1998). This assumption is thought to be valid for quasars (e.g., Schweitzer et al., 2006; Leipski et al., 2014), although contrary arguments have also been proposed (e.g., Symeonidis et al., 2016; Symeonidis, 2017). In practice, the intrinsic (i.e., AGN-heated) FIR spectral shape of quasars would vary from source to source (Lyu & Rieke, 2017), but handling of this effect is quite challenging at this moment.
To compute , we first adopted an optically thin gray body spectrum model with dust temperature = 47 K and emissivity index = 1.6 (emissivity ) to be consistent with previous quasar studies (e.g., Wang et al., 2013; Willott et al., 2015; Venemans et al., 2016). These fixed parameters are based on the mean spectral energy distribution of high-redshift optically/FIR-luminous quasars at (Beelen et al., 2006, see also Leipski et al. 2014). However, it is uncertain whether these values are applicable to the much less luminous (at both the optical and FIR bands) HSC quasars, which should be studied further with future multiwavelengths observations. We also explore the consequence of lower below, which may be more realistic.
We also considered the influence of the cosmic microwave background (CMB) on the submm observations at high redshifts (da Cunha et al., 2013), as the CMB provides additional source of dust heating. However, as those effects are negligible as long as we adopt K. We thus do not make any correction to the observed submm fluxes in this study: we should revise our estimation on, e.g., , once accurate is obtained.
The resultant ( = 47 K) listed in Table 2. They all fall within a relatively narrow range, , corresponding to the luminosity range of LIRGs. This is consistent with the [C \emissiontypeII]-based results, where we also found LIRG-like line luminosities. The of our HSC quasars are then much fainter than the optically luminous quasars by factors of (e.g., Wang et al., 2007, 2008, 2011a). On the other hand, their are higher than some optically-selected normal galaxies (not AGN) at that are not detected at FIR even with the high sensitivity of ALMA (Capak et al., 2015), indicating that quasars are indeed dust-enriched systems.
The SFR were simply estimated by (i) extending the gray body spectrum to the total-IR (TIR: 8–1000 m, Table 3) range, (ii) assuming that star-forming activity fully accounts for the TIR, and (iii) applying the conversion, (Murphy et al., 2011). This conversion is also grounded on the Kroupa IMF and is in accord with other studies (e.g., Kennicutt, 1998) after accounting for the differing IMFs assumed therein. We found SFR = 58–100 yr-1 for our sources. Note that we here neglected a contribution of UV luminosity to SFR estimate as a UV-to-IR luminosity ratio is small for massive star-forming galaxies such as having stellar mass of (e.g., Whitaker et al., 2012; Dunlop et al., 2017), which would be the case for quasars (see also section 4). We also derived the cold dust mass (), using with a mass absorption coefficient and cm2 g-1 (Alton et al., 2004; Beelen et al., 2006). Assuming K, we found . As expected from our methodology, the values of SFR and are comparable to those observed in local LIRG-class systems (e.g., U et al., 2012; Tateuchi et al., 2015).
However, the above TIR-based SFR (SFRTIR) are systematically larger than the [C \emissiontypeII]-based SFR (SFR) except for the case of J2216-0016. This could not be due to significant AGN contamination to the dust heating, as the observed EW values are comparable to star-forming LIRGs. On the other hand, itself is usually very uncertain even among star-forming galaxies: our less luminous HSC quasars (at both the optical and FIR bands) may have lower than the luminous-end quasars. If we adopt K instead, which is a typical value observed in local LIRGs (e.g., U et al., 2012) and SMGs at having U/LIRG-class (e.g., Chapman et al., 2005; Kovács et al., 2006; Coppin et al., 2008), the resultant is reduced by %, by fixing to 1.6. In this case (Table 3), the relevant FIR continuum properties are then, , SFRTIR = 23–40 yr-1, , respectively. The SFRTIR now agrees better with SFR for J0859+0022, J1152+0055, and J1202-0057, although the discrepancy in between the HSC quasars and the optically-luminous quasars becomes larger (Figure 3).
3.3 Spatial extent of the star-forming region
The spatial extent of the star-forming region
555This could have a different distribution from the already existing stellar component
(see recent discussion in, e.g., Simpson et al., 2015).
of each source was estimated by applying
a two-dimensional Gaussian fit to both the [C \emissiontypeII]
integrated intensity and the continuum maps, using the CASA task IMFIT.
This method (i.e., image-plane fitting) is consistent with those
used in the previous submm studies on quasar host galaxies,
which enables us a fair comparison of our results with them.
We note another possibility to estimate the source sizes by using -plane fitting,
but such a method only applies for data with decent
(, e.g., Ikarashi et al., 2015),
which is not the case for our work.
The native resolution data (Table 2 and Figure 1) were used for our size measurements with 3 clipping to avoid noise contamination. The resultant values are listed in Table 3.3: the [C \emissiontypeII] emitting regions have sizes of FWHM 2.6–5.2 kpc, while the associated uncertainties are still large.
We found good consistency between the [C \emissiontypeII]-based sizes and continuum-based sizes within the uncertainties, except for the case of J2216-0016, where the [C \emissiontypeII]-based size is times larger than the continuum-based size along its major axis (see also Figure 1 and subsection 3.5). Interestingly, the spatial extents of our HSC quasars (even including J2216-0016) are comparable to those of the optically-luminous quasars observed at submm, having several 10 (e.g., Wang et al., 2013; Venemans et al., 2016), within the uncertainties. Thus, an order of magnitude difference in SFR (or ) between these populations could directly translate to a similar level of difference in the SFR (or ISM mass under a certain gas-to-dust mass ratio, e.g., Draine et al., 2007) surface density. Indeed, gas mass surface density around an AGN is a key parameter for the black hole mass accretion, as it controls the gravitational instability therein, which can transport gas inward (e.g., Hopkins & Quataert, 2010).
*3c
Spatial extent of the star-forming region of the HSC quasars
Name Size ([C \emissiontypeII] FWHM) Size (continuum FWHM)
\endhead\endfoot\endlastfootJ0859+0022 (0.51 0.15) (0.33 0.19) (0.39 0.16) (0.27 0.15)
(2.8 0.8) kpc (1.8 1.0) kpc (2.2 0.9) kpc (1.5 0.8) kpc
J1152+0055 (0.58 0.20) (0.25 0.13) (0.61 0.19) (0.24 0.17)
(3.0 1.1) kpc (1.4 0.7) kpc (3.4 1.0) kpc (1.3 0.9) kpc
J2216-0016 (0.91 0.15) (0.44 0.12) (0.52 0.16) (0.41 0.23)
(5.2 0.8) kpc (2.5 0.7) kpc (2.9 0.9) kpc (2.3 1.3) kpc
J1202-0057 (0.45 0.12) (0.27 0.19) (0.47 0.10) (0.42 0.14)
(2.6 0.7) kpc (1.5 1.1) kpc (2.7 0.6) kpc (2.4 0.8) kpc
3.4 Other emitters within the fields
We searched for other emitters within the fields of view (FoV; HPBW ) of each source. The line cubes and the continuum maps with the native angular resolutions were used here.
3.4.1 [C \emissiontypeII] emitters adjacent to the quasars?
We first searched for [C \emissiontypeII] emitters within the FoVs,
particularly those associated with the central quasars.
We applied the procedure described in Yamaguchi et al. (2017)
to our continuum-subtracted cubes.
To this end, spectral windows (1.875 GHz width with MHz binning)
that contain the quasar [C \emissiontypeII] emission were surveyed.
We used the CLUMPFIND software (Williams et al., 1994)
to search for line emitters other than the HSC quasars themselves with a peak .
The relevant parameters were and ,
where is the contouring interval,
and is the starting contour level.
To avoid spurious detections, we rejected candidates
that do not show emission in any of the channels adjacent to the peak ones.
The frequency resolution (43 MHz) or the velocity resolution
of 50 km s-1 for objects near the quasar redshifts would be sufficient to
resolve a typical line width ( km s-1; e.g., Aravena et al., 2016)
of galaxies at into several spectral elements.
As a result, we did not detect any significant line emitter within the FoVs. This result holds if we decrease the detection threshold to 4.5, which is roughly consistent with the negative tail of the distributions of our cubes. Note that Venemans et al. (2016) also reported a non-detection of other line emitters within the ALMA band 6 FoVs of three luminous VIKING quasars. Regarding luminous [C \emissiontypeII] emitters (), our non-detection is broadly consistent with Decarli et al. (2017) as well, who reported four companion luminous [C \emissiontypeII] emitting galaxies out of 25 luminous quasar fields at : based on their detection rate (16%), the expected number of such luminous [C \emissiontypeII] emitters for our observations is at most one. Furthermore, Trakhtenbrot et al. (2017) reported three detections of associated luminous SMGs () out of six luminous quasar fields at , implying a higher merger frequency at that redshift than at . As compared to those observations (Decarli et al., 2017; Trakhtenbrot et al., 2017), our observations are much deeper. Therefore, the non-detection of [C \emissiontypeII] emitters in our fields would place a more stringent constraint on a [C \emissiontypeII] luminosity function at that redshift, which is although beyond the scope of this paper.
3.4.2 Continuum emitters
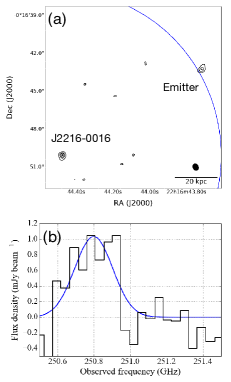
With the rms values listed in Table 2, we conservatively considered sources with a signal-to-noise ratio () as continuum emitters. In the fields of J0859+0022 (5 = 48Jy beam-1), J1152+0055 (104 Jy beam-1), and J1202-0057 (44 Jy beam-1), no significant emitter was found. In contrast, one emitter candidate was found slightly outside the nominal FoV of J2216-0016 (5 = 66 Jy beam-1; Figure 4a), 13.2 away from the quasar. Its coordinates are R.A. = \timeform22h16m43s.718, Dec. = \timeform00D16’43”.28.
However, this source turned out to be a line emitter, after a careful inspection of all spectral windows (Figure 4b), rather than a continuum emitter. That is, this source is not detected in the continuum map of J2216-0016 after the channels with faint line emission were removed. A single Gaussian fit to the line gave an amplitude, centroid, and integrated intensity of 1.03 0.09 mJy, 250.80 0.01 GHz, and 0.32 0.03 Jy km s-1, respectively. We suggest that the source is a lower-redshift object, as it is detected in all of the HSC bands as mag, mag, mag, mag, and mag, which is typically not the case for high-redshift galaxies. Indeed, the HSC photometric-redshift catalog from the first data release (with the Mizuki-code, Tanaka, 2015; Tanaka et al., 2017) suggests that the source is at . In this case, the line could be CO(5–4) emission (expected redshift ).
In short, we did not find any significant continuum emitter in these four fields (each has arcmin2 field of view; arcmin2 total) even at our high sensitivities (5 = 44–104 Jy beam-1). It is noteworthy, on the other hand, that many studies suggest that luminous quasars tend to reside in over-dense region of continuum emitters (e.g., Silva et al., 2015, and references therein): our result of the lower luminosity quasars at seems not to match those findings. Further studies on, e.g., halo masses of those less-luminous quasars, are needed to reveal underlying physical differences between the environments of various kinds of quasars.
The non-detection in the four fields seems to be lower than the expectation from recent 1.2 mm number counts (e.g., Aravena et al., 2016; Fujimoto et al., 2016). For example, the cumulative number count in Fujimoto et al. (2016) is (total number) in our four fields ( in each 0.135 arcmin2 field), whilst no source was detected. However, the discrepancy in each field is still statistically not so significant (; Gehrels, 1986): we would also suggest several possible factors that can further reconcile the discrepancy. One factor is cosmic variance given the small area we probed. A low selection-completeness expected for high resolution (e.g., ) observations (see Figure 5 in Fujimoto et al., 2017) will reduce the detection rate. It is also possible that previous counts using low-significance detections are contaminated by noise components, as suggested by Oteo et al. (2016) and Umehata et al. (2017). Pseudo continuum emitters, which we found in the J2216-0016 field (Figure 4), could also be contaminants, particularly at the faint end. The accumulation of datasets of individually very deep observations will help to further constrain the true mm/submm number count at the faint end ( Jy): this will be investigated with our growing SHELLQs sample.
3.5 Any peculiarity in the BAL quasar J2216-0016?
Among the four HSC quasars studied here, J2216-0016 shows a clear broad absorption line (BAL) feature (e.g., Weymann et al., 1991; Trump et al., 2006) in its N \emissiontypeV spectrum (Matsuoka et al., 2016). As the BAL feature is a clear manifestation of nuclear outflows, which could be an indication of AGN-feedback on the host galaxy, it is interesting to see if there is any peculiarity in the host galaxy. Indeed, the relatively large spatial extent of the [C \emissiontypeII] emitting region (5.2 0.8 kpc; Table 3.3) as well as the high EW (4.08 0.87 , compared to the value of for local starburst galaxies; Sargsyan et al., 2014) already stands out among the four HSC quasars.
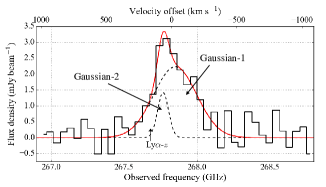
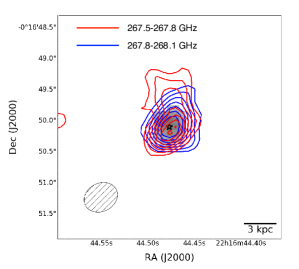
As an initial investigation, we fit the observed [C \emissiontypeII] spectrum with a double-Gaussian profile (Figure 5): the resultant reduced is 1.05 (degree of freedom 666We evaluated the fit within the frequency range of 267.41–268.30 GHz., d.o.f. = 14), which is improved over the single-Gaussian fit (reduced = 1.24 with d.o.f = 17). The two double-Gaussian constituents have centroid frequencies of 267.851 GHz (Gaussian-1) and 267.768 GHz (Gaussian-2), respectively. The Gaussian-2 has a much narrower FWHM (99.1 km s-1) than the Gaussian-1 (389.7 km s-1) has. It is therefore plausible that the Gaussian-1 component corresponds to the quasar host, once we take into account the [C \emissiontypeII] FWHM of the quasar host galaxies studied so far. Figure 6 shows the integrated intensity of the [C \emissiontypeII] emission divided into the redder and bluer velocity components. The redder component that contains the Gaussian-2 is spatially more extended than the bluer one, toward the north to northeast direction. That elongation has a different position angle (P.A.) of from the bluer component, and most of the redder component around the continuum peak (P.A. to ), implying that the elongation traces a physically different structure from the quasar host galaxy.
One plausible origin for the elongated structure is an AGN-driven [C \emissiontypeII] outflow, such as that observed in the luminous quasar SDSS J1148+5251 (Maiolino et al., 2012; Cicone et al., 2015). In this case, the decomposed line profile suggests that the outflow is single-sided relative to the systemic velocity of the quasar host, although its width is rather narrow as compared to previously observed [C \emissiontypeII] outflows. Similar single-sided outflows have been observed in many systems (e.g., Cicone et al., 2014; Feruglio et al., 2017). Note that the blueshifted BAL absorption feature does not necessarily preclude the existence of redshifted outflows.
Another plausible origin of the offset is a galaxy merging with the quasar host with a projected separation of kpc. High resolution and deep optical/infrared imaging data, which is not available at this moment, will give a crucial hint on the nature of the extended component. A similarly close (projected distance kpc) galaxy was also found near the moderate luminosity () quasar PSO J167-13 (Willott et al., 2017), which demonstrates the importance of high angular resolution in unveiling such close companion(s). If we suppose that the merging system has the same spatial extent as the quasar host itself, the much narrower FWHM roughly translates to dynamical mass an order of magnitude smaller, i.e., this event will be a minor merger, which would enhance nuclear activity (e.g., Taniguchi, 1999; Kaviraj, 2014). Such an evolutionary link between the BAL and early galaxy evolution is an appealing topic for further investigations (e.g., Farrah et al., 2007).
In either case, we clearly need higher resolution and sensitivity to spatially isolate the candidate structure and to distinguish these two scenarios, particularly via studying the gas dynamics. In what follows, we use dynamical properties from the single Gaussian fit.
4 Discussion
In this section, we first explore the star-forming nature of the HSC quasar host galaxies, and then discuss the early co-evolutionary relationship at , paying attention to the physical differences between optically luminous () and low-luminosity () quasars. We will also compare the observed properties with theoretical predictions from semi-analytic models, particularly those from a new numerical galaxy catalog (= GC; Makiya et al., 2016). In this catalog, the underlying merging histories of dark matter haloes are based on state-of-the-art cosmological -body simulations (Ishiyama et al., 2015), which have high mass resolution and quite large volumes relative to previous simulations, which are particularly suitable to study statistical properties of rare populations such as massive/luminous quasars at high redshifts (H. Shirakata et al. in preparation). The GC simulation uses prescriptions for star formation, gas heating by UV feedback, supernova feedback, SMBH growth, and AGN feedback (see also Enoki et al., 2014; Shirakata et al., 2015), to trace galaxy evolution. In this study, we adopt the results from a subset of the GC with the largest volume, i.e., GC-L (Ishiyama et al., 2015), for which the box size is 1.12 cGpc and the dark-matter mass resolution is 2.20 108 (number of particles = 81923).
4.1 The [C \emissiontypeII]-FIR luminosity relation
The [C \emissiontypeII]/FIR luminosity ratio can reflect physical conditions in the star-forming clouds. It has long been known that this ratio is more than an order of magnitude smaller in sources with high than low (e.g., Malhotra et al., 1997; Luhman et al., 2003; Brauher et al., 2008; Stacey et al., 2010; Graciá-Carpio et al., 2011; Díaz-Santos et al., 2013). This trend has been extensively studied in the high-redshift universe as well (e.g., Carilli & Walter, 2013). Possible causes of the [C \emissiontypeII]-deficit in FIR-luminous objects include AGN contamination to (Sargsyan et al., 2014), reduction of C+ abundance due to AGN-heating (Langer & Pineda, 2015), charging of dust grains (Malhotra et al., 1997), saturation of the line flux due to high gas density (Kaufman et al., 1999), high dust opacity with respect to gas in dust-bounded region due to an increase of the average ionization parameter (Abel et al., 2009; Graciá-Carpio et al., 2011), and high gas surface density of individual cloud (or higher molecular-to-atomic gas fraction, Narayanan & Krumholz, 2017).
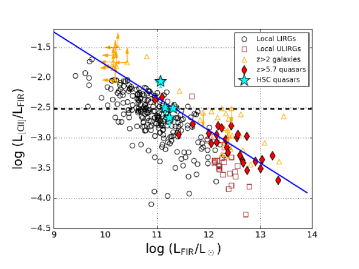
Figure 7 shows this [C \emissiontypeII]-deficit in the FIR-luminous regime with a compilation of galaxies in both the nearby and high-redshift universes, including quasars. Those quasars also show a deficit with increasing (e.g., Venemans et al., 2016; Wang et al., 2013). However, the HSC quasars777We use ( = 35 K) in Table 3 as this case yields better agreement with [C \emissiontypeII]-based SFR than that of = 47 K. The same is assigned for J2216-0016 as well to keep consistency, although its SFR with K better agrees with that derived from the [C \emissiontypeII] luminosity., as well as other less-luminous quasars (i.e., CFHQS quasars, Willott et al., 2013, 2015, 2017), exhibit / ratios comparable to or slightly higher ratios than the local LIRG-class objects at fixed (Díaz-Santos et al., 2013). In terms of EW, we also found that the HSC quasars have comparable values to local star-forming galaxies in Table 3, while the luminous-end quasars tend to show lower EW (Venemans et al., 2016).
The physical origin of the difference in / between those optically-luminous and -faint quasars is thus of interest. Both a higher AGN contribution to and reduction of C+ abundance due to too strong X-ray irradiation can reduce the ratio in luminous-end AGNs (Sargsyan et al., 2014; Langer & Pineda, 2015). As the spatial extent of [C \emissiontypeII] or FIR continuum-emitting regions are comparable between the HSC quasars and optically luminous quasars (see Table 3.3), a higher charge on dust grains due to enhanced star-forming activity (Malhotra et al., 1997) and higher gas surface density that shields ionizing radiation or cosmic rays could also cause the discrepancy as well (Narayanan & Krumholz, 2017).
High-redshift quasars follow a correlation in this plane that has comparable slope to the relation seen for lower redshift objects, but is offset to the higher / direction. We fit the relationship for the high-redshift quasar sample including the objects in this study following Willott et al. (2017). The orthogonal distance regression gives
| (1) |
which is consistent with the relation derived in Willott et al. (2017). This relation is offset from the trend for the local galaxies and U/LIRGs by a factor of in the sense that / is higher for the quasars. It is also noteworthy that high-redshift FIR-luminous star-forming galaxies (i.e., non-AGN objects) also show an offset from the local trend (e.g., Maiolino et al., 2009). Thus, this trend is characteristic of high-redshift FIR-luminous objects regardless of the nature of their nuclear heating source(s). This could be due to the fact that those objects have more available gas (Narayanan & Krumholz, 2017) : at a fixed or SFR, higher gas mass can translate to lower gas mass surface density of individual cloud (linked to a star formation efficiency), which reduces the ability of shielding ionizing photons and cosmic rays. In that case, we would expect a higher [C \emissiontypeII]/CO abundance ratio, as the column density for shielding ionizing photons and cosmic rays decreases there (low surface density). However, a more thorough study of the true shape of the FIR spectra of high-redshift objects is necessary to accurately constrain / ratios and to infer the physical properties of the gas content (e.g., Stacey et al., 2010) in the early universe.
4.2 Cold dust content
The rapid enrichment of the ISM at the universe, which is reflected in the large amounts of cold dust in quasar hosts (e.g., several 108 in SDSS quasars, Wang et al., 2008, 2011a), has been a challenge for many theoretical studies (Valiante et al., 2017, for a recent review). Similar high (or even higher) have also been observed in SMGs at as well (Riechers et al., 2013; Strandet et al., 2017). Recent models particularly stress the importance of grain growth in cold, dense gas clouds rather than stellar yields as the dominant source of the early dust production (e.g., Michałowski et al., 2010; Mancini et al., 2015; Popping et al., 2017). In these models, the observed of both optically/FIR-luminous quasars (e.g., SDSS) and faint HSC quasars (several 107 ; Table 3) can be reproduced by modifying the characteristic dust accretion time scale (, e.g., Hirashita & Voshchinnikov, 2014).
According to the latest dust evolution model of Popping et al. (2017), which incorporates several other dust formation and destruction processes as well, a Myr model can yield several in a galaxy with a stellar mass () of several 1010 at . Meanwhile, decelerated dust growth with Myr is sufficient to produce several 107 in a similar galaxy. This would be valid for the quasar hosts observed so far at the rest-FIR, as long as their dynamical masses (subsection 4.3) mostly reflect their . As this timescale depends on the molecular gas density of the system () as , the possible factor of difference in gas mass surface density between optically-luminous quasars and the HSC quasars at (subsection 3.3) can explain the difference in as well. Note that also depends on the inverse of the gas phase metallicity. Thus, if the difference in is eventually attributable to the difference in , we expect that the gas-phase metallicity of optically-luminous and faint systems will not differ markedly. On the other hand, if is somehow comparable between them, the less luminous HSC quasars would have the gas metallicity as would the luminous-end quasars. These can be tested by a multi-species excitation analysis (e.g., Wang et al., 2016) or by metallicity measurements that combine multiple fine-structure lines (e.g., Nagao et al., 2012).
4.3 Star-forming activity
The majority of star-forming galaxies are found to populate the so-called main sequence (MS) of star formation on the –SFR plane (e.g., Daddi et al., 2007; Elbaz et al., 2007), and the evolution of the MS over cosmic time has been studied extensively, even up to (Speagle et al., 2014; Steinhardt et al., 2014; Tasca et al., 2015; Salmon et al., 2015). The MS can be used to define starburst galaxies, normal star-forming galaxies, and quenched/quiescent galaxies at each redshift. While the MS is not well constrained at , it is still informative to place quasars on the vs SFR plane and compare the levels of star formation among other galaxies.
To this end, we first computed dynamical masses () of the HSC quasars by following the standard procedure in previous quasar studies (e.g., Wang et al., 2010, 2013; Willott et al., 2015; Venemans et al., 2016): here, we assumed that the observed [C \emissiontypeII] emission came from a thin disk such that the velocity structure reflects rotational motion. The inclination angle of the disk () is determined by the ratio of the deconvolved (Table 3.3) major () and minor () axes of the [C \emissiontypeII] emitting regions, = cos-1(/). The circular velocity () is calculated as = 0.75 FWHM/ (Wang et al., 2010): the FWHM of the HSC quasars are listed in Table 3. The disk size (diameter, ) is approximated as = 1.5 to account for the spatially extended component (i.e., full width at 20% of the peak intensity for a Gaussian profile) to keep consistency with the previous works shown above.
Then, the enclosed within is given by,
| (2) |
The resultant values are listed in Table 4.3. Note that the errors on are estimated from the FWHM and source size. On the other hand, formal errors on themselves (i.e., after correcting for the inclination angles) are not given due to multiple uncertainties including those of the inclination angles and the true geometry of the line emitting regions.
Keeping the existence of such large unconstrained systematic uncertainty in mind, hereafter we use the above as a surrogate for , which is a common procedure in high-redshift quasar studies (e.g., Wang et al., 2010, 2013; Willott et al., 2015, 2017; Venemans et al., 2016). Note that in three of our HSC quasars, gas masses obtained by applying a plausible gas-to-dust mass ratio (e.g., 100, Draine et al., 2007) to our derived , are small relative to , indicating that stellar components dominate their . The one exception is J1152+0055, whose inferred gas mass is of , but this still has a limited impact on our conclusions. The resultant clearly constitute the massive end of galaxies (e.g., Grazian et al., 2015).
Dynamical properties of the HSC quasars Name (1010 ) (1010 ) (108 ) J0859+0022 3.3 1.1 5.6 0.2 J1152+0055 1.1 0.5 1.4 4.3 J2216-0016 6.4 1.3 8.2 6.1 J1202-0057 2.9 0.8 4.4 0.4 {tabnote} Formal errors on are not given due to multiple unconstrained uncertainties including those of the inclination angles and the geometry of the line emitting regions. See details about the measurement of J0859+0022 and J2216-0016 with the Mg \emissiontypeII-based calibrations (Vestergaard & Osmer, 2009) in M. Onoue et al. (in preparation). For the remaining two quasars, Eddington-limited mass accretion is assumed, which gives the lower limit on . A typical uncertainty is 0.3 dex for the Mg \emissiontypeII-based (Shen et al., 2008), and 0.45 dex for the Eddington ratio-based (Willott et al., 2015), respectively.
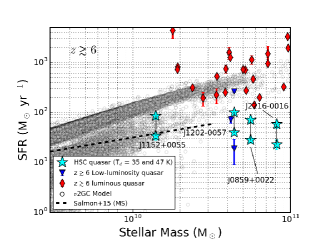
The relationship between and SFR (calculated with ) of the HSC quasars is plotted in Figure 8, along with results from the GC simulation: the simulated values (not ) are used here. We selected galaxies hosting SMBHs from the simulated catalog (see also subsection 4.4), all of which are indeed high- galaxies. The simulated galaxies show two sequences, a starburst sequence (upper) and MS (lower): the gap between these two sequences is artificial due to the limited mass- and time-resolution of the model (see details in H. Shirakata et al. in preparation) 888We confirmed that this effect has little impact on time-integrated quantities such as , , and , which are used in subsection 4.4.. Keeping this in mind, the simulated galaxies are used to infer the star-formation levels of the observed quasars. The model-MS is consistent with other semi-analytic models (e.g., Somerville et al., 2008), and roughly matches the recently observed MS at (investigated at Salmon et al., 2015). At lower-, the model is also consistent with observations (e.g., Daddi et al., 2007; Elbaz et al., 2007). As seen in Figure 8, the HSC quasars studied here all reside on or even below the MS at , both compared to the GC model and to the observed relationship. Therefore, we suggest that these HSC quasars are now ceasing their star-forming activities, and are transforming into the quiescent population.
We also plot optically luminous () and low-luminosity () quasars with [C \emissiontypeII] observations (Maiolino et al., 2005; Venemans et al., 2012, 2016; Wang et al., 2013, 2016; Bañados et al., 2015; Willott et al., 2015, 2017; Decarli et al., 2017, 2018; Mazzucchelli et al., 2017) in Figure 8. Here, we limit the sample to have for fair comparison with the HSC quasars, after considering a recent argument that both the SFR and mass accretion rate may depend on the of the host galaxy (Yang et al., 2017). Again their are used as surrogates for .
We found that these optically-luminous quasars all reside on or above the MS, i.e., their hosts are indeed starburst galaxies. On the other hand, two of the three (optically) low-luminosity quasars (CFHQS quasars, Willott et al., 2015, 2017) having comparable to our HSC quasars, also exhibit similarly low SFR. Therefore, host galaxies of those optically luminous quasars and less luminous quasars including our HSC quasars, plotted in Figure 8, constitute different populations in terms of the evolutionary stages of star formation. The order of magnitude difference in gas mass surface density implied in this work could drive the above difference in both SFR and mass accretion rate (e.g., Hopkins & Quataert, 2010). We also point out that a gap between the luminous quasars and the HSC quasars stands out. A transformation from the starburst phase to the quiescent phase would thus be quite rapid: merger-induced galaxy evolution models, for example, indeed predict such evolution (e.g., Hopkins et al., 2008; Volonteri et al., 2015).
Note that, however, those FIR luminous quasars could only be a subset of all optically luminous quasars at , according to the compilation in Calura et al. (2014), as the majority of the quasars reported there only have upper limits on (mostly measured with single-dish observations). The reported upper limits in Calura et al. (2014) are typically . Thus, it is plausible that a large number of optically luminous quasars could lie on the MS, which makes the actual fraction of luminous quasars that are hosted by starburst galaxies highly uncertain. Meanwhile, the recent ALMA survey toward optically luminous quasars, without prior information on their FIR fluxes, revealed that the bulk of them indeed have ULIRG-like (Decarli et al., 2018). It is therefore also possible that the quasars compiled in Calura et al. (2014) actually have ULIRG-like (or luminous LIRG-like) , which are yet below the detection limits of previous single dish observations. Deeper submm observations are clearly required to depict the true quasar distribution on the –SFR plane.
It is also noteworthy that the spatial extents (both [C \emissiontypeII] and continuum) of the HSC quasars are consistent with the typical size of the stellar components of some compact quiescent galaxies (cQGs, e.g., van Dokkum et al., 2008; Krogager et al., 2014) exhibiting little ongoing star formation. Such cQGs have been found even at (Straatman et al., 2014, 2015). Multi-band photometric analysis (Straatman et al., 2014) suggests that the stellar mass of cQGs (several 10) had been formed at with intense starburst (characteristic time scale Myr). Within the context of this scenario, the host galaxies of HSC quasars at may represent an earlier phase in the formation of massive compact galaxies, possible through mergers, when star formation is beginning to its cessation. Indeed, recent studies on the sizes and star formation histories of submillimeter galaxies (SMGs) and cQGs suggest that cQGs are descendants of SMGs at higher redshifts, having passes through the optical quasar phase, which will further evolve into local giant ellipticals through dry mergers (e.g., Toft et al., 2014; Ikarashi et al., 2015; Fujimoto et al., 2017).
4.4 Early SMBH-host galaxy co-evolution in the less-luminous quasars
Finally, we investigate the nature of the early co-evolution of SMBHs and their hosts. To this end, we compute of the HSC quasars (Table 4.3). For J0859+0022 and J2216-0016, a virial calibration using broad Mg \emissiontypeII emission line (Vestergaard & Osmer, 2009) was applied to derive their (M. Onoue et al. in preparation). It is noteworthy that J0859+0022 has a very low () as compared to previously known quasars, clearly demonstrating the high sensitivity of our HSC survey to discover such lower mass objects. For the remaining two cases, the Eddington-limited mass accretion was assumed, following previous quasar studies (e.g., Wang et al., 2013; Venemans et al., 2016), which gives the lower-limit on . Their bolometric luminosities were calculated from the rest-frame UV luminosity at 1450 Å with a correction factor of 4.4 (Richards et al., 2006). The values derived in subsection 4.3 are again used here as surrogates for .
We have also compiled or (Willott et al., 2003, 2010a; De Rosa et al., 2014; Venemans et al., 2015a, b; Kashikawa et al., 2015; Wu et al., 2015; Bañados et al., 2016, 2017; Jiang et al., 2016; Shao et al., 2017; Mazzucchelli et al., 2017; Decarli et al., 2018) and [C \emissiontypeII]-based (Maiolino et al., 2005; Venemans et al., 2012, 2016, 2017; Wang et al., 2013, 2016; Bañados et al., 2015; Willott et al., 2015, 2017; Decarli et al., 2017, 2018; Mazzucchelli et al., 2017) measurements for quasars from the literature. The estimates are based on Mg \emissiontypeII measurements with a typical uncertainty of 0.3 dex (Shen et al., 2008), which is added in quadrature to their measurement uncertainties. We assumed Eddington-limited accretion for those objects without Mg \emissiontypeII data after deriving their bolometric luminosities from : 0.45 dex uncertainty is assumed for those (Wang et al., 2013; Willott et al., 2015). While this provides a lower limit to their , this assumption would be reasonable since optically luminous quasars are known to radiate closely at the Eddington limit (e.g., Willott et al., 2010a). Following the procedure of Willott et al. (2017), we assigned = 4.5 kpc and random orientation angle = 55∘ for some unresolved host galaxies to estimate their average sizes.
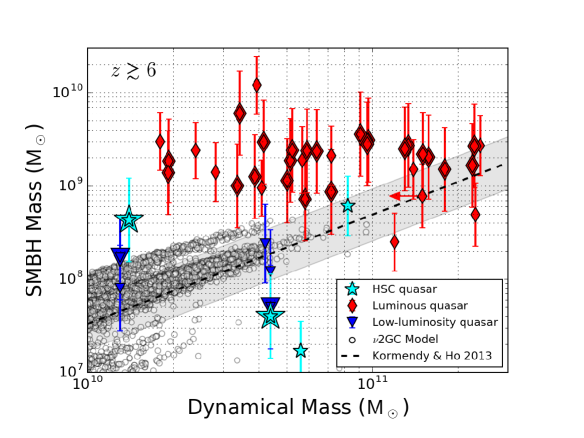
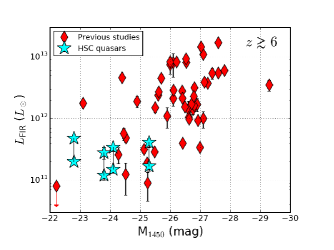
All of the above-mentioned quasars are plotted in Figure 9, overlaid with the local – relation (Kormendy & Ho, 2013). The of the central few kpc regions of high-redshift quasars can be equivalent to local in the absence of further gas accretion and/or mergers. Thus, it is instructive to place the high-redshift quasars on this plane. As selection bias favoring the most luminous objects (or most massive objects) would have distorted the shape of the early co-evolutionary relations studied previously (section 1), we further divide the literature sample into (i) optically luminous objects (; mostly ) and (ii) less luminous objects (), based on the compiled quasar and galaxy luminosity functions at in Matsuoka et al. (2016).
Figure 9 confirms the previous argument of Willott et al. (2017) that there is no clear correlation between the two quantities when we focus on the all quasars observed so far, and the scatter is much larger than the local relation, particularly at . At least in this galaxy mass range, the underlying distribution would have a wide scatter, and thus observations can be biased toward more luminous or more massive objects (e.g., Lauer et al., 2007; Schulze & Wisotzki, 2014). This is demonstrated by the different distributions of the optically luminous (e.g., SDSS quasars) and less luminous (including HSC) quasar populations: the luminous quasars clearly have over-massive SMBHs as compared to the local relation in this mass range, whereas less luminous quasars are roughly consistent with the local relation within their uncertainties. We now see this difference more clearly than previous studies, since we almost double the number of the low luminosity quasars with measurements in this study. Therefore, our study highlights the importance of probing low luminosity quasars to understand the unbiased early co-evolutionary relation reflecting the bulk of the AGN-host galaxies in this epoch, although the sample is still too small to statistically claim this argument.
We also compare the observed distributions of quasars on the plane with simulated galaxies from the GC model, which are also plotted in Figure 9. Here, we selected all galaxies containing SMBHs at as we focused on massive quasars. The simulation traces the SMBH growth from the seed mass of 999Changing the seed BH mass to does not affect the results at the high or high regions, primarily because the GC model allows super-Eddington accretion (Shirakata et al., 2016). The galaxy bulge and the central SMBH gain masses, while maintaining the relation (Makiya et al., 2016),
| (3) |
where is the total mass of stars newly formed during a starburst episode in a bulge induced mainly by galaxy mergers, is the total SMBH mass growth, and is a constant (= 0.01) selected to match the local – relation. It is thus apparent that the simulated galaxies tend to follow the local relation. Note that we use returned by the model, which indicates either (i) total mass within a half-mass radius (bulge-dominated galaxy) or (ii) total mass within a disk effective radius (disk-dominated galaxy). The mass of the dark matter would not be important at these spatial scales (Genzel et al., 2017). Thus, our comparison with observed data is fair.
It is intriguing in Figure 9 that and of the low luminosity quasars (HSC + CFHQS) are close to the simulated values. This implies, based on the GC model, that these quasars could have been formed through the standard, (quasi-) synchronized galaxy–SMBH formation scenario (e.g., Di Matteo et al., 2005; Hopkins et al., 2006), although we cannot exclude other evolutionary scenarios. The significantly lower of J0859+0022 () than the local relation seems to support that standard galaxy evolutionary scheme, where a starburst phase (or growth of stellar content) occurs earlier and an SMBH growth later (see also a recent ALMA work by Ueda et al., 2017). Note that expected halo masses are several for those lower mass quasars based on our model, which will be observationally tested in future.
On the other hand, it is still challenging to form massive-end galaxies () that contain SMBHs with this GC simulation. We would also point out that the scatter around the local relation is smaller at , likely indicating (several episodes of) AGN feedbacks to regulate galaxy growth to finally converge to the local relation. As such massive-end objects should be quite rare, this remains a room that we will be able to generate those objects once we simulate much larger volumes. It is, however, virtually impossible to form quasars having and with our model, as long as we use the fixed . One other possibility is that these over-massive objects were formed through different path(s) from those incorporated in the GC simulation. For example, additional supply of cold gas directly from the intergalactic medium would boost the mass, especially in the nuclear region of galaxies (e.g., Dekel et al., 2009): the potential importance of fueling mechanisms other than the standard merger picture has been investigated recently (e.g., Trakhtenbrot et al., 2017). It is even plausible that such quasars with over-massive SMBHs will accordingly evolve into galaxies with over-massive SMBHs at , which are start to be found recently (van den Bosch et al., 2012), although dry mergers will move them toward the local relation as time goes by from to . Further investigations of galaxy properties as well as environments around the quasars are essential to better understand the underlying processes of co-evolution.
5 Summary and future prospects
We have presented ALMA observations of four optically low-luminosity () quasars at recently discovered by our wide and deep optical survey with the Hyper Suprime-Cam (HSC) on the Subaru telescope (Matsuoka et al., 2016). This study significantly increased the known sample in the low-luminosity regime at reported in works of Willott et al. (2013, 2015, 2017), giving us a less-biased view of high-redshift galaxy-SMBH evolution. All four quasars have been detected in the [C \emissiontypeII] emission line and the underlying rest-FIR continuum emission. The main findings of this paper can be summarized as follows:
-
1.
The [C \emissiontypeII] line fluxes are as low as 0.4–1.1 Jy km s-1, which corresponds to line luminosities of . These are more than one order of magnitude fainter than in optically-luminous quasars (e.g., Wang et al., 2013; Venemans et al., 2016), and are comparable to local LIRGs (Díaz-Santos et al., 2013). The line FWHM ranges from 192 to 356 km s-1, similar to other quasars (e.g., Wang et al., 2013; Willott et al., 2015; Venemans et al., 2016). The inferred star formation rates are similarly low (SFR yr-1) as compared to the luminous quasar hosts ( yr-1).
-
2.
The underlying rest-FIR continuum emission was detected in all objects (136–246 Jy beam-1). A modified black body fit with a dust temperature = 47 K to the measurements yielded FIR luminosities , i.e., LIRG-class . Meanwhile, we found that = 35 K () yields IR-based SFR ( yr-1) that better match the [C \emissiontypeII]-based SFR. In either case, the inferred dust masses are several 107 , which are an order of magnitude smaller than the optically-luminous quasar host galaxies at 6 (e.g., Wang et al., 2007; Venemans et al., 2016).
-
3.
The spatial extent of the barely resolved [C \emissiontypeII] emitting regions are mostly kpc for the HSC quasars (J2216-0016 shows kpc), which agree with the continuum-derived sizes despite the large errors. These numbers are comparable to those of the optically-luminous quasars having at least an order of magnitude higher (or dust mass). It thus implies that the correspondingly different ISM mass surface density (Hopkins & Quataert, 2010) drives the difference in AGN activity between the HSC quasars and the more luminous quasars.
-
4.
We did not find any continuum or line emitter physically close to the HSC quasars within the nominal FoVs, except for one likely lower-redshift weak line emitter. Recent number counts suggest that we could have seen some objects in our deep observations (5 = 44–104 Jy beam-1), but several factors could reconcile this discrepancy.
-
5.
The BAL quasar J2216-0016 seems to show two components in the [C \emissiontypeII] emission line spectrum and its velocity-integrated spatial distribution. This may reflect either [C \emissiontypeII]-outflows or a galaxy merger. Higher resolution observations are required to further elucidate the nature of this high-redshift BAL quasar host.
-
6.
The ratios of the HSC quasars are fully consistent with the local LIRG-class objects, whereas optically-luminous quasars tend to show a [C \emissiontypeII]-deficit trend at increasing . This suggests that a star formation mode similar to local LIRGs (not ULIRG-like bursts) prevails in the HSC quasars. The order of magnitude of difference in the SFR (and likely ISM mass) surface densities between the HSC quasars and optically-luminous quasars may be the one of the physical origin(s) of the deficit.
-
7.
Our attempt to place the HSC quasars on the stellar mass (; we used dynamical masses as surrogates for them) vs. SFR plane suggests that the HSC quasars and other similarly less-luminous quasars are on or even below the star formation main sequence (MS), i.e., they are now ceasing their star formation. This is supported by both recent observations and a semi-analytical galaxy evolution model (GC, Makiya et al., 2016). As optically-luminous quasars reside on or even above the MS (i.e., starburst galaxies), there could be an evolutionary difference between these luminous and less luminous quasar hosts.
-
8.
Our dynamical measurements suggest that the HSC quasars along with similarly less luminous quasars at (e.g., Willott et al., 2015, 2017) tend to follow the local co-evolutionary relation, whereas luminous objects show clear departures from it (over-massive SMBHs) particularly at . This highlights the importance of probing less luminous quasars to depict the unbiased shape of the early co-evolution. The mass properties of those less-luminous quasars can be reproduced by the GC model, implying they could be formed with quasi-synchronized galaxy (bulge)–SMBH evolution scheme, although we do not argue that this is the only scenario to explain the results. On the other hand, we may need to consider some other evolution paths to generate galaxies hosting over-massive SMBHs.
A higher spatial resolution that that provided in this study (), which is achievable with ALMA, is necessary to elucidate the physical origin of the spectral peculiarity of J2216-0016. Furthermore, the trends of low-luminosity quasars shown above, which are clearly different from those of optically luminous quasars, are based on the small sample. This will be statistically confirmed with our growing SHELLQs sample.
{ack}
We thank the anonymous referee for his/her thorough reading and useful comments which greatly improved this paper. T.I. particularly thank Dr. T. Suzuki at NAOJ for her fruitful comments. This paper makes use of the following ALMA data: ADS/JAO.ALMA#2016.1.01423.S. ALMA is a partnership of ESO (representing its member states), NSF (USA) and NINS (Japan), together with NRC (Canada), NSC and ASIAA (Taiwan), and KASI (Republic of Korea), in cooperation with the Republic of Chile. The Joint ALMA Observatory is operated by ESO, AUI/ NRAO and NAOJ.
The Hyper Suprime-Cam (HSC) collaboration includes the astronomical communities of Japan and Taiwan, and Princeton University. The HSC instrumentation and software were developed by the National Astronomical Observatory of Japan (NAOJ), the Kavli Institute for the Physics and Mathematics of the Universe (Kavli IPMU), the University of Tokyo, the High Energy Accelerator Research Organization (KEK), the Academia Sinica Institute for Astronomy and Astrophysics in Taiwan (ASIAA), and Princeton University. Funding was contributed by the FIRST program from Japanese Cabinet Office, the Ministry of Education, Culture, Sports, Science and Technology (MEXT), the Japan Society for the Promotion of Science (JSPS), Japan Science and Technology Agency (JST), the Toray Science Foundation, NAOJ, Kavli IPMU, KEK, ASIAA, and Princeton University.
This paper makes use of software developed for the Large Synoptic Survey Telescope. We thank the LSST Project for making their code available as free software at http://dm.lsstcorp.org.
The Pan-STARRS1 Surveys (PS1) have been made possible through contributions of the Institute for Astronomy, the University of Hawaii, the Pan-STARRS Project Office, the Max-Planck Society and its participating institutes, the Max Planck Institute for Astronomy, Heidelberg and the Max Planck Institute for Extraterrestrial Physics, Garching, The Johns Hopkins University, Durham University, the University of Edinburgh, Queen’s University Belfast, the Harvard-Smithsonian Center for Astrophysics, the Las Cumbres Observatory Global Telescope Network Incorporated, the National Central University of Taiwan, the Space Telescope Science Institute, the National Aeronautics and Space Administration under Grant No. NNX08AR22G issued through the Planetary Science Division of the NASA Science Mission Directorate, the National Science Foundation under Grant No. AST-1238877, the University of Maryland, and Eotvos Lorand University (ELTE).
T.I., M.O., K.K, N.K., H.U., R.M., and T.N. are supported by JSPS KAKENHI grant numbers 17K14247 (T.I.), 15J02115 (M.O.), 17H06130 (K.K.), 15H03645 (N.K.), 17K14252 (H.U.), 15H05896 (R.M.), 16H01101, 16H03958, and 17H01114 (T.N.), respectively. H.S. has been supported by the Sasakawa Scientific Research Grant from the Japan Science Society (29-214). T.I. is supported by the ALMA Japan Research Grant of NAOJ Chile Observatory, NAOJ-ALMA-175.
References
- Aalto et al. (2012) Aalto, S., García-Burillo, S., Muller, S., Winters, J. M., van der Werf, P., Henkel, C., Costagliola, F., & Neri, R. 2012, A&A, 537, A44
- Abel et al. (2009) Abel, N. P., Dudley, C., Fischer, J., Satyapal, S. & van Hoof, P. A. M. 2009, ApJ, 701, 1147
- Alton et al. (2004) Alton, P. B., Xilouris, E. M., Misiriotis, A., Dasyra, K. M., & Dumke, M. 2004, A&A, 425, 109
- Aravena et al. (2016) Aravena, M., et al. 2016, ApJ, 833, 68
- Bañados et al. (2014) Bañados, E., et al. 2014, AJ, 148, 14
- Bañados et al. (2015) Bañados, E., Decarli, R., Walter, F., Venemans, B. P., Farina, E. P., & Fan, X. 2015, ApJ, 805, L8
- Bañados et al. (2017) Bañados, E., et al. 2017, arXiv:1712.01860
- Bañados et al. (2016) Bañados, E., et al. 2016, ApJS, 227, 11
- Beelen et al. (2006) Beelen, A., Cox, P., Benford, D. J., Dowell, C. D., Kovács, A., Bertoldi, F., Omont, A., & Carilli, C. L. 2006, ApJ, 642, 694
- Bertoldi et al. (2003a) Bertoldi, F., Carilli, C. L., Cox, P., Fan, X., Strauss, M. A., Beelen, A., Omont, A., & Zylka, R. 2003a, A&A, 406, L55
- Bertoldi et al. (2003b) Bertoldi, F., et al. 2003b, A&A, 409, L47
- Brauher et al. (2008) Brauher, J. R., Dale, D. A., & Helou, G. 2008, ApJS, 178, 280
- Calura et al. (2014) Calura, F., Gilli, R., Vignali, C., Pozzi, F., Pipino, A., Matteucci, F. 2014, MNRAS, 438, 2765
- Capak et al. (2015) Capak, P. L., et al. 2015, Nature, 522, 455
- Carilli et al. (2001) Carilli, C. L., et al. 2001, ApJ, 555, 625
- Carilli & Walter (2013) Carilli, C. L. & Walter, F. 2013, ARA&A, 51, 105
- Carnall et al. (2015) Carnall, A. C., et al. 2015, MNRAS, 451, L16
- Chapman et al. (2005) Chapman, S. C., Blain, A. W., Smail, I., & Ivison, R. J. 2005, ApJ, 622, 772
- Chen et al. (2013) Chen, C.-T. J., et al. 2013, ApJ, 773, 3
- Cicone et al. (2014) Cicone, C., et al. 2014, A&A, 562, A21
- Cicone et al. (2015) Cicone, C., et al. 2015, A&A, 574, A14
- Coppin et al. (2008) Coppin, K., et al. 2008, MNRAS, 384, 1597
- da Cunha et al. (2013) da Cunha, E., et al. 2013, ApJ, 766, 13
- Daddi et al. (2007) Daddi, E., et al. 2007, ApJ, 670, 156
- De Breuck et al. (2011) De Breuck, C., Maiolino, R., Caselli, P., Coppin, K., Hailey-Dunsheath, S., & Nagao, T. 2011, A&A, 530, L8
- Decarli et al. (2017) Decarli, R., et al. 2017, Nature, 545, 457
- Decarli et al. (2018) Decarli, R., et al. 2018, arXiv:1801.02641
- Dekel et al. (2009) Dekel, A., et al. 2009, Nature, 457, 451
- De Looze et al. (2011) De Looze, I., Baes, M., Bendo, G. J., Cortese, L., & Fritz, J. 2011, MNRAS, 416, 2712
- De Rosa et al. (2014) De Rosa, G., et al. 2014, ApJ, 790, 145
- Díaz-Santos et al. (2013) Díaz-Santos, T., et al. 2013, ApJ, 774, 68
- Di Matteo et al. (2005) Di Matteo, T., Springel, V., & Hernquist, L. 2005, Nature, 433, 604
- Draine et al. (2007) Draine, B. T., et al. 2007, ApJ, 663, 866
- Dunlop et al. (2017) Dunlop, J. S., et al. 2017, MNRAS, 466, 861
- Eilers et al. (2017) Eilers, A.-C., Davies, F. B., Hennawi, J. F., Prochaska, J. X., Lukić, Z., & Mazzucchelli, C. 2017, ApJ, 840, 24
- Elbaz et al. (2007) Elbaz, D., et al. 2007, A&A, 468, 33
- Enoki et al. (2014) Enoki, M., Ishiyama, T., Kobayashi, M. A. R., & Nagashima, M. 2014, ApJ, 794, 69
- Fan et al. (2003) Fan, X., et al. 2003, AJ, 125, 1649
- Fan et al. (2006) Fan, X., et al. 2006, AJ, 131, 1203
- Farrah et al. (2007) Farrah, D., Lacy, M., Priddey, R., Borys, C., & Afonso, J. 2007, ApJ, 662, L59
- Farrah et al. (2013) Farrah, D., et al. 2013, ApJ, 776, 38
- Ferrarese & Merritt (2000) Ferrarese, L. & Merritt, D. 2000, ApJ, 539, L9
- Feruglio et al. (2017) Feruglio, C., et al. 2017, A&A, 608, A30
- Fujimoto et al. (2016) Fujimoto, S., Ouchi, M., Ono, Y., Shibuya, T., Ishigaki, M., Nagai, H., & Momose, R. 2016, ApJS, 222, 1
- Fujimoto et al. (2017) Fujimoto, S., Ouchi, M., Shibuya, T., & Nagai, H. 2017, ApJ, 850, 83
- Furusawa et al. (2017) Furusawa, H., et al. 2017, PASJ, in press (doi: 10.1093/pasj/psx079)
- Gallerani et al. (2014) Gallerani, S., Ferrara, A., Neri, R., & Maiolino, R. 2014, MNRAS, 445, 2848
- Gallerani et al. (2017) Gallerani, S., Fan, X., Maiolino, R., & Pacucci, F. 2017, PASA, 34, e022
- Gehrels (1986) Gehrels, N. 1986, ApJ, 303, 336
- Genzel et al. (2017) Genzel, R., et al. 2017, Nature, 543, 397
- Graciá-Carpio et al. (2011) Graciá-Carpio, J., et al. 2011, ApJ, 728, L7
- Grazian et al. (2015) Grazian, A., et al. 2015, A&A, 575, A96
- Greene et al. (2012) Greene, J. E., Zakamska, N. L., & Smith, P. S. 2012, ApJ, 746, 86
- Gullberg et al. (2015) Gullberg, B., et al. 2015, MNRAS, 449, 2883
- Harikane et al. (2017) Harikane, Y., et al. 2017, arXiv:1711.03735
- Helou et al. (1988) Helou, G., Khan, I. R., Malek, L., & Boehmer, L. 1988, ApJS, 68, 151
- Herrera-Camus et al. (2015) Herrera-Camus, R., et al. 2015, ApJ, 800, 1
- Hirashita & Voshchinnikov (2014) Hirashita, H. & Voshchinnikov, N. V. 2014, MNRAS, 437, 1636
- Hollenbach & Tielens (1999) Hollenbach, D. J. & Tielens, A. G. G. M. 1999, Reviews of Modern Physics, 71, 173
- Hopkins et al. (2006) Hopkins, P. F., Hernquist, L., Cox, T. J., Di Matteo, T., Robertson, B., & Springel, V. 2006, ApJS, 163, 1
- Hopkins et al. (2008) Hopkins, P. F., Hernquist, L., Cox, T. J., & Kereš, D. 2008, ApJS, 175, 356
- Hopkins & Quataert (2010) Hopkins, P. F. & Quataert, E. 2010, MNRAS, 407, 1529
- Ikarashi et al. (2015) Ikarashi, S., et al. 2015, ApJ, 810, 133
- Ishiyama et al. (2015) Ishiyama, T., Enoki, M., Kobayashi, M. A. R., Makiya, R., Nagashima, M., & Oogi, T. 2015, PASJ, 67, 61
- Ivison et al. (2010) Ivison, R. J., et al. 2010, A&A, 518, L35
- Jiang et al. (2016) Jiang, L., et al. 2016, ApJ, 833, 222
- Kashikawa et al. (2015) Kashikawa, N., et al. 2015, ApJ, 798, 28
- Kaufman et al. (1999) Kaufman, M. J., Wolfire, M. G., Hollenbach, D. J., & Luhman, M. L. 1999, ApJ, 527, 795
- Kaviraj (2014) Kaviraj, S. 2014, MNRAS, 440, 2944
- Kawanomoto et al. (2017) Kawanomoto, S., et al. 2017, PASJ, in press
- Kennicutt (1998) Kennicutt, R. C. 1998, ARA&A, 36, 189
- Komiyama et al. (2017) Komiyama, Y., et al. 2017, PASJ, in press (doi: 10.1093/pasj/psx069)
- Kormendy & Ho (2013) Kormendy, J. & Ho, L. C. 2013, ARA&A, 51, 511
- Kovács et al. (2006) Kovács, A., Chapman, S. C., Dowell, C. D., Blain, A. W., Ivison, R. J., Smail, I., & Phillips, T. G. 2006, ApJ, 650, 592
- Krogager et al. (2014) Krogager, J.-K., Zirm, A. W., Toft, S., Man, A., & Brammer, G. 2014, ApJ, 797, 17
- Kroupa (2001) Kroupa, P. 2001, MNRAS, 322, 231
- Langer & Pineda (2015) Langer, W. D. & Pineda, J. L. 2015, A&A, 580, A5
- Lamastra et al. (2010) Lamastra, A., Menci, N., Maiolino, R., Fiore, F., & Merloni, A. 2010, MNRAS, 405, 29
- Lauer et al. (2007) Lauer, T. R., Tremaine, S., Richstone, D., & Faber, S. M. 2007, ApJ, 670, 249
- Leipski et al. (2014) Leipski, C., et al. 2014, ApJ, 785, 154
- Li et al. (2007) Li, Y., et al. 2007, ApJ, 665, 187
- Luhman et al. (2003) Luhman, M. L., Satyapal, S., Fischer, J., Wolfire, M. G., Sturm, E., Dudley, C. C., Lutz, D., & Genzel, R. 2003, ApJ, 594, 758
- Lutz et al. (2010) Lutz, D., et al. 2010, ApJ, 712, 1287
- Lyu & Rieke (2017) Lyu, J. & Rieke, G. H. 2017, ApJ, 841, 76
- Madau & Dickinson (2014) Madau, P. & Dickinson, M. 2014, ARA&A, 52, 415
- Maiolino et al. (2005) Maiolino, R., et al. 2005, A&A, 440, L51
- Maiolino et al. (2009) Maiolino, R., Caselli, P., Nagao, T., Walmsley, M., De Breuck, C., & Meneghetti, M. 2009, A&A, 500, L1
- Maiolino et al. (2012) Maiolino, R., et al. 2012, MNRAS, 425, L66
- Makiya et al. (2016) Makiya, R., et al. 2016, PASJ, 68, 25
- Malhotra et al. (1997) Malhotra, S., et al. 1997, ApJ, 491, L27
- Mancini et al. (2015) Mancini, M., Schneider, R., Graziani, L., Valiante, R., Dayal, P., Maio, U., Ciardi, B., & Hunt, L. K. 2015, MNRAS, 451, L70
- Marconi & Hunt (2003) Marconi, A. & Hunt, L. K. 2003, ApJ, 589, L21
- Matsuoka et al. (2016) Matsuoka, Y., et al. 2016, ApJ, 828, 26
- Matsuoka et al. (2017) Matsuoka, Y., et al. 2017, arXiv:1704.05854
- Mazzucchelli et al. (2017) Mazzucchelli, C., et al. 2017, ApJ, 849, 91
- McMullin et al. (2007) McMullin, J. P., Waters, B., Schiebel, D., Young, W., & Golap, K. 2007, in ASP Conf. Ser. 376, Astronomical Data Analysis Software and Systems XVI, ed. R. A. Shaw, F. Hill, & D. J. Bell (San Francisco, CA: ASP), 127
- Mechtley et al. (2012) Mechtley, M., et al. 2012, ApJ, 756, L38
- Michałowski et al. (2010) Michałowski, M. J., Murphy, E. J., Hjorth, J., Watson, D., Gall, C., & Dunlop, J. S. 2010, A&A, 522, A15
- Miyazaki et al. (2012) Miyazaki, S., et al. 2012, Proc. SPIE, 8446, 84460Z
- Miyazaki et al. (2017) Miyazaki, S., et al. 2017, PASJ, in press (doi: 10.1093/pasj/psx063)
- Mortlock et al. (2009) Mortlock, D. J., et al. 2009, A&A, 505, 97
- Mortlock et al. (2011) Mortlock, D. J., et al. 2011, Nature, 474, 616
- Murphy et al. (2011) Murphy, E. J., et al. (2011), ApJ, 737, 67
- Nagao et al. (2012) Nagao, T., Maiolino, R., De Breuck, C., Caselli, P., Hatsukade, B., & Saigo, K. 2012, A&A, 542, L34
- Narayanan & Krumholz (2017) Narayanan, D. & Krumholz, M. R. 2017, MNRAS, 467, 50
- Nesvadba et al. (2008) Nesvadba, N. P. H., Lehnert, M. D., De Breuck, C., Gilbert, A. M., & van Breugel, W. 2008, A&A, 491, 407
- Omont et al. (2013) Omont, A., Willott, C. J., Beelen, A., Bergeron, J., Orellana, G., & Delorme, P. 2013, A&A, 552, A43
- Oteo et al. (2016) Oteo, I., Zwaan, M. A., Ivison, R. J., Smail, I., & Biggs, A. D. 2016, ApJ, 822, 36
- Petric et al. (2003) Petric, A. O., Carilli, C. L., Bertoldi, F., Fan, X., Cox, P., Strauss, M. A., Omont, A., & Schneider, D. P. 2003, AJ, 126, 15
- Popping et al. (2017) Popping, G., Somerville, R. S., & Galametz, M. 2017, MNRAS, 471, 3152
- Priddey et al. (2003) Priddey, R. S., Isaak, K. G., McMahon, R. G., Robson, E. I., & Pearson, C. P. 2003, MNRAS, 344, L74
- Priddey et al. (2008) Priddey, R. S., Ivison, R. J., & Isaak, K. G. 2008, MNRAS, 383, 289
- Reed et al. (2017) Reed, S. L., et al. 2017, MNRAS, 468, 4702
- Rémy-Ruyer et al. (2014) Rémy-Ruyer, A., et al. (2014), A&A, 563, A31
- Richards et al. (2006) Richards, G. T., et al. 2006, ApJS, 166, 470
- Riechers et al. (2013) Riechers, D. A., et al. 2013, Nature, 496, 329
- Robson et al. (2004) Robson, I., Priddey, R. S., Isaak, K. G., & McMahon, R. G. 2004, MNRAS, 351, L29
- Rosario et al. (2013) Rosario, D. J., et al. 2013, A&A, 560, A72
- Salmon et al. (2015) Salmon, B., et al. 2015, ApJ, 799, 183
- Salpeter (1964) Salpeter, E. E. 1964, ApJ, 140, 796
- Sargsyan et al. (2014) Sargsyan, L., Samsonyan, A., Lebouteiller, V., Weedman, D., Barry, D., Bernard-Salas, J., Houck, J., & Spoon, H. 2014, ApJ, 790, 15
- Schramm & Silverman (2013) Schramm, M., & Silverman, J. D. 2013, ApJ, 767, 13
- Schulze & Wisotzki (2014) Schulze, A., & Wisotzki, L. 2014, MNRAS, 438, 3422
- Schweitzer et al. (2006) Schweitzer, M., et al. 2006, ApJ, 649, 79
- Shao et al. (2017) Shao, Y., et al. 2017, ApJ, 845, 138
- Shen et al. (2008) Shen, Y., Greene, J. E., Strauss, M. A., Richards, G. T., & Schneider, D. P. 2008, ApJ, 680, 169
- Shirakata et al. (2015) Shirakata, H., Okamoto, T., Enoki, M., Nagashima, M., Kobayashi, M. A. R., Ishiyama, T., & Makiya, R. 2015, MNRAS, 450, L6
- Shirakata et al. (2016) Shirakata, H., et al. 2016, MNRAS, 461, 4389
- Silva et al. (2015) Silva, A., Sajina, A., Lonsdale, C., & Lacy, M. 2015, ApJ, 806, L25
- Simpson et al. (2015) Simpson, J. M., et al. 2015, ApJ, 807, 128
- Solomon & Vanden Bout (2005) Solomon, P. M., & Vanden Bout, P. A. 2005, ARA&A, 43, 677
- Somerville et al. (2008) Somerville, R. S., Hopkins, P. F., Cox, T. J., Robertson, B. E., & Hernquist, L. 2008, MNRAS, 391, 481
- Somerville & Davé (2015) Somerville, R. S., & Davé, R. 2015, ARA&A, 53, 51
- Speagle et al. (2014) Speagle, J. S., Steinhardt, C. L., Capak, P. L., & Silverman, J. D. 2014, ApJS, 214, 15
- Stacey et al. (1991) Stacey, G. J., Geis, N., Genzel, R., Lugten, J. B., Poglitsch, A., Sternberg, A., & Townes, C. H. 1991, ApJ, 373, 423
- Stacey et al. (2010) Stacey, G. J., Hailey-Dunsheath, S., Ferkinhoff, C., Nikola, T., Parshley, S. C., Benford, D. J., Staguhn, J. G., & Fiolet, N. 2010, ApJ, 724, 957
- Stefan et al. (2015) Stefan, I. I., et al. 2015, MNRAS, 451, 1713
- Steinhardt et al. (2014) Steinhardt, C. L., et al. 2014, ApJ, 791, 25
- Straatman et al. (2014) Straatman, C. M. S., et al. 2014, ApJ, 783, L14
- Straatman et al. (2015) Straatman, C. M. S., et al. 2015, ApJ, 808, L29
- Strandet et al. (2017) Strandet, M. L., et al. 2017, ApJ, 842, L15
- Symeonidis et al. (2016) Symeonidis, M., Giblin, B. M., Page, M. J., Pearson, C., Bendo, G., Seymour, N., & Oliver, S. J. 2016, MNRAS, 459, 257
- Symeonidis (2017) Symeonidis, M. 2017, MNRAS, 465, 1401
- Tanaka (2015) Tanaka, M. 2015, ApJ, 801, 20
- Tanaka et al. (2017) Tanaka, M., et al. 2017, arXiv:1704.05988
- Taniguchi (1999) Taniguchi, Y. 1999, ApJ, 524, 65
- Targett et al. (2012) Targett, T. A., Dunlop, J. S., & McLure, R. J. 2012, MNRAS, 420, 3621
- Tasca et al. (2015) Tasca, L. A. M., et al. 2015, A&A, 581, A54
- Tateuchi et al. (2015) Tateuchi, K., et al. 2015, ApJS, 217, 1
- Toba et al. (2017) Toba, Y., Bae, H.-J., Nagao, T., Woo, J.-H., Wang, W.-H., Wagner, A. Y., Sun, A.-L., & Chang, Y.-Y. 2017, ApJ, 850, 140
- Toft et al. (2014) Toft, S., et al. 2014, ApJ, 782, 68
- Trakhtenbrot et al. (2017) Trakhtenbrot, B., Lira, P., Netzer, H., Cicone, C., Maiolino, R., & Shemmer, O. 2017, ApJ, 836, 8
- Trump et al. (2006) Trump, J. R., et al. 2006, ApJS, 165, 1
- U et al. (2012) U, V., et al. 2012, ApJS, 203, 9
- Ueda et al. (2017) Ueda, Y., et al. 2017, arXiv:1712.03350
- Umehata et al. (2017) Umehata, H., et al. 2017, ApJ, 835, 98
- Valiante et al. (2014) Valiante, R., Schneider, R., Salvadori, S., & Gallerani, S. 2014, MNRAS, 444, 2442
- Valiante et al. (2017) Valiante, R., Agarwal, B., Habouzit, M., & Pezzulli, E. 2017, PASA, 34, e031
- van den Bosch et al. (2012) van den Bosch, R. C. E., Gebhardt, K., Gültekin, K., van de Ven, G., van der Wel, A., & Walsh, J. L. 2012, Nature, 491, 729
- van Dokkum et al. (2008) van Dokkum, P. G., et al. 2008, ApJ, 677, L5
- Venemans et al. (2012) Venemans, B. P., et al. 2012, ApJ, 751, L25
- Venemans et al. (2013) Venemans, B. P., et al. 2013, ApJ, 779, 24
- Venemans et al. (2015a) Venemans, B. P., et al. 2015a, ApJ, 801, L11
- Venemans et al. (2015b) Venemans, B. P., et al. 2015b, MNRAS, 453, 2259
- Venemans et al. (2016) Venemans, B. P., Walter, F., Zschaechner, L., Decarli, R., De Rosa, G., Findlay, J. R., McMahon, R. G., & Sutherland, W. J. 2016, ApJ, 816, 37
- Venemans et al. (2017) Venemans, B. P., et al. 2017, ApJ, 851, L8
- Vestergaard & Osmer (2009) Vestergaard, M., & Osmer, P. S. 2009, ApJ, 699, 800
- Volonteri (2012) Volonteri, M. 2012, Science, 337, 544
- Volonteri et al. (2015) Volonteri, M., Capelo, P. R., Netzer, H., Bellovary, J., Dotti, M., & Governato, F. 2015, MNRAS, 449, 1470
- Wagg et al. (2012) Wagg, J., et al. 2012, ApJ, 752, L30
- Walter et al. (2004) Walter, F., Carilli, C., Bertoldi, F., Menten, K., Cox, P., Lo, K. Y., Fan, X., & Strauss, M. A. 2004, ApJ, 615, L17
- Wang et al. (2017) Wang, F., et al. 2017, ApJ, 839, 27
- Wang et al. (2007) Wang, R., et al. 2007, AJ, 134, 617
- Wang et al. (2008) Wang, R., et al. 2008, ApJ, 687, 848
- Wang et al. (2010) Wang, R., et al. 2010, ApJ, 714, 699
- Wang et al. (2011a) Wang, R., et al. 2011a, AJ, 142, 101
- Wang et al. (2011b) Wang, R., et al. 2011b, ApJ, 739, 34
- Wang et al. (2013) Wang, R., et al. 2013, ApJ, 773, 44
- Wang et al. (2016) Wang, R., et al. 2016, ApJ, 830, 53
- Weymann et al. (1991) Weymann, R. J., Morris, S. L., Foltz, C. B., & Hewett, P. C. 1991, ApJ, 373, 23
- Whitaker et al. (2012) Whitaker, K. E., van Dokkum, P. G., Brammer, G., & Franx, M. 2012, ApJ, 754, 29
- Williams et al. (1994) Williams, J. P., de Geus, E. J., & Blitz, L. 1994, ApJ, 428, 693
- Willott et al. (2003) Willott, C. J., McLure, R. J., & Jarvis, M. J. 2003, ApJ, 587, L15
- Willott et al. (2005) Willott, C. J., Percival, W. J., McLure, R. J., Crampton, D., Hutchings, J. B., Jarvis, M. J., Sawicki, M., & Simard, L. 2005, ApJ, 626, 657
- Willott et al. (2007) Willott, C. J., et al. 2007, AJ, 134, 2435
- Willott et al. (2009) Willott, C. J., et al. 2009, AJ, 137, 3541
- Willott et al. (2010a) Willott, C. J., et al. 2010a, AJ, 140, 546
- Willott et al. (2010b) Willott, C. J., et al. 2010b, AJ, 139, 906
- Willott et al. (2013) Willott, C. J., Omont, A., & Bergeron, J. 2013, ApJ, 770, 13
- Willott et al. (2015) Willott, C. J., Bergeron, J., & Omont, A. 2015, ApJ, 801, 123
- Willott et al. (2017) Willott, C. J., Bergeron, J., & Omont, A. 2017, ApJ, 850, 108
- Wu et al. (2015) Wu, X.-B., et al. 2015, Nature, 518, 512
- Yamaguchi et al. (2017) Yamaguchi, Y., et al. 2017, ApJ, 845, 108
- Yang et al. (2017) Yang, G., et al. 2017, ApJ, 842, 72
- Yun et al. (2000) Yun, M. S., Carilli, C. L., Kawabe, R., Tutui, Y., Kohno, K., & Ohta, K. 2000, ApJ, 528, 171