High-efficiency cold-atom transport into a waveguide trap
Abstract
We have developed and characterized an atom-guiding technique that loads cold rubidium atoms into hollow-core optical fibre, an order-of-magnitude larger than previously reported results. This result was possible because it was guided by a physically realistic simulation that could provide the specifications for loading efficiencies of and a peak optical depth of . The simulation further showed that the demonstrated loading efficiency is limited solely by the geometric overlap of the atom cloud and the optical guide beam, and is thus open to further improvement with experimental modification. The experimental arrangement allows observation of the real-time effects of light-assisted cold atom collisions and background gas collisions by tracking the dynamics of the cold atom cloud as it falls into the fibre. The combination of these observations, and physical understanding from the simulation, allows estimation of the limits to loading cold atoms into hollow-core fibres.
I Introduction
Cold atoms have been a transformational tool for sensing Kasevich and Chu (1991); Dutta et al. (2016); Canuel et al. (2006), measurement Peters et al. (2001); Stockton et al. (2011); Hinkley et al. (2013); Cronin et al. (2009); Altin et al. (2013), emulation Glaetzle et al. (2017) and simulation Gross and Bloch (2017); Garreau (2017). The specific properties of cold matter that makes it useful for these applications is its high atomic density, low velocity, and excellent isolation from the environment. Furthermore, alkali metals are commonly used in cold matter experiments as they confer strong atom-light interaction allowing both efficient measurement and manipulation. The figures of merit that quantify these properties for an atomic ensemble are its coherence time, , and optical depth, defined as , where is the transmission. Examples where overall performance depends crucially on these figures of merit are quantum state storage Kasevich and Chu (1991); Sparkes et al. (2013), strong photon-photon interaction for quantum information processing Liu et al. (2016), and interferometric magnetic gradiometry Hardman et al. (2016).
A promising approach to attain a high is the loading of cold atoms into a hollow-core photonic crystal fibre (HC-PCF) Cregan et al. (1999); Couny et al. (2006); Markos et al. (2017). The tight confinement of atoms to the core of the fibre delivers a close match between the optical cross-section of the cold atom and the transverse mode diameter of the light field. The close matching leads to an optimal for a given atom number. Further, the guidance of the fibre means the match can be extended over lengths that are not limited by diffraction - up to s of centimetres.
Previous experiments aimed at loading cold atoms into HC-PCF have achieved up to Blatt et al. (2014) and have been used to demonstrate slow and stopped light Blatt et al. (2016) as well as highly efficient few-photon all-optical switching Peyronel et al. (2012) and excitation of Rydberg atoms Langbecker et al. (2017). Similar systems have shown coherence times not limited by atom-wall or atom-guide interactions using Lamb-Dicke spectroscopy in a 1-D lattice Okaba et al. (2014), or atom interferometry using optically-confined free-falling cold atoms Xin et al. (2018).
These preliminary explorations show promising results; however, the limitations and dynamics of the atomic loading and trapping process are still not well understood. This work provides a detailed simulation of the cold atom loading of an optical fibre, which is augmented with an innovative experimental design that can follow the atoms during the loading and trapping process. The simulation is seen to be in excellent agreement with the experiment and the imbued confidence allows rapid pinpointing of the optimal conditions in which more than million cold atoms can be loaded into the fibre. Using the validated simulation we are able to predict the limits to optical depth and coherence lifetimes and suggest techniques to expand the capacity of this platform for implementing coherent state storage and manipulation.
II Methods
The experiment uses cold rubidium-85 atoms produced in a standard 3-dimensional magneto optical trap (MOT). The atoms are cooled on the cycling transition of the D2 line, and repumped on the transition of the D1 line, shown in figure 1(a). We trap atoms in a cloud in diameter with a steady state temperature of . The ensemble temperature is reduced below using polarisation gradient cooling (PGC) Dalibard and Cohen-Tannoudji (1989). A length of core diameter Kagome-lattice fibre (see figure 1(b)) is situated under the MOT as shown in figure 1(c). This fibre has low loss between and , and we are able to achieve a combined guidance and coupling efficiency into the fundamental mode of over at . After the PGC phase an intense guide laser Grimm et al. (2000) is switched on producing trapping forces that cause the falling atoms within the laser field to be guided towards the core of the fibre. The guide beam is coupled into the fibre from below, which produces an attractive dipole trap within the hollow-core fibre that diverges from the output to produce a conical, self-aligning optical funnel that steers atoms into the fibre. With over of guide light detuned by to the red of the D1 transition we produce a radial trapping field with a peak trap depth of at the MOT location without the need for intricate magnetic field guides Bajcsy et al. (2011). The eventual fraction of atoms guided into the fibre depends on the velocity and density distributions of the initial ensemble as well as its position with respect to the guide beam. These are complicated functions of the MOT and PGC parameters as well as the settings of the background magnetic field cancellation coils. We maximize the loading dependence on the initial state of the MOT by placing of the most sensitive of these variables under the control of a neural-net learning tool, M-Loop Wigley et al. (2016); Hush (2017), which is capable of efficiently optimising over this multidimensional space.
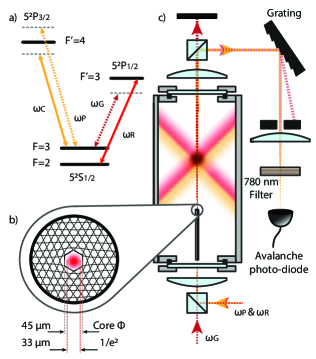
The atom number contained within the guide beam is estimated using the transmission of a weak () co-propagating light field that is tuned around the D2 transition. The transmitted probe is separated from the guide using high extinction polarisation optics, an optical grating, and finally a narrow band-pass filter, which suppresses the guide light by . Prior work Bajcsy et al. (2009); Blatt et al. (2014); Okaba et al. (2014); Xin et al. (2018) has implemented a spatial-mode filter of the probe light on exit from the fibre: we did not do that here as strong lensing effects within the large fibre core Noaman et al. (2018); Roof et al. (2015) would lead to an over-estimate of the optical depth.
The intense guide light introduced an inhomogeneous broadening of the probe transition through its transverse intensity variation Davidson et al. (1995). This effect was circumvented by probing in the dark: the guide beam was rapidly intensity modulated and probing was only performed in the absence of the guide light. We used two double-passed acousto-optic modulators (AOMs) in the probe path to perform the fast () switching required. This fast switching speed delivered us an additional advantage in that we could step the optical frequency between each probing phase, thereby observing the full spectral width of the absorption feature over in a cycle lasting just . A small amount of re-pump light is present with probe, ensuring that population is not lost to the ground state during measurement. We confirmed that our technique was non-destructive by applying two consecutive probe sequences and measuring less than variation between measurements. During each cycle of the experiment we probe the cold cloud with one laser pulse sequence at a pre-determined time following its release from the MOT; a second identical pulse sequence is then applied following the first. This second pulse sequence is used to normalize the cold atom absorption as it is sufficiently delayed that it sees only a small residual absorption associated with the background of hot rubidium atoms - less than .
III Atom Loading Results
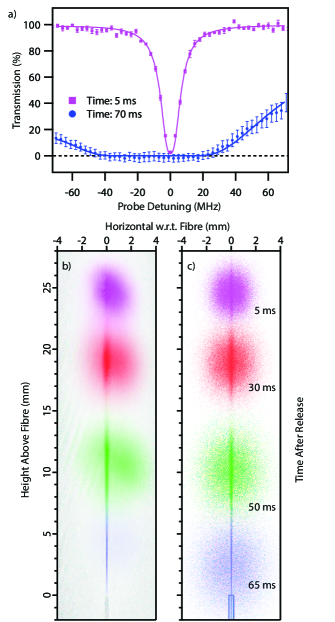
We compare the probe absorption when the atoms are just released from the MOT (time: ), to that observed as they just enter the fibre (time: ) in figure 2(a). We see a peak optical depth, of , comparable to the highest depths measured in other fibre-loading experiments Blatt et al. (2014, 2016); Peyronel et al. (2012), and approaching the highest depths possible with other techniques Sparkes et al. (2013); Hsiao et al. (2018); Kaczmarek et al. (2015); Hsiao et al. (2014).
By calculating the atom number from (see Appendix A) we estimate we have guided atoms into the fibre, which is approximately of the MOT cloud. Using near-resonance absorption imaging from the side, see figure 2(b), we can directly see the intensifying atomic density in the guide field as the atoms drop.
Due to the relatively small diffraction angle of the guide from the fibre only of the atoms in the initial ensemble experience a trap depth larger than the average temperature of the ensemble. The Gaussian form of the trap depth in the radial direction from the guide axis, and linear scaling of trap depth with guide power, impose harsh diminishing returns on atom coupling performance for fixed cloud and trap geometries (see Appendix B). This strongly suggests that the transfer efficiency could be significantly increased by using density-enhancing techniques in the MOT region e.g. spatial dark spot Kaczmarek et al. (2015); Ketterle et al. (1993), magnetic compression Depue et al. (2000); Petrich et al. (1994) or a vertically aligned cigar shaped trap Lin et al. (2008), or by increasing the divergence of the guide by using a smaller core fibre.
IV Monte-Carlo Simulation
The underlying physics of the atom-light interaction can be modelled using a detailed Monte-Carlo simulation of the loading process. The simulation picks atoms from within a three dimensional position and velocity distribution that is matched to the experimentally measured atom-cloud size and temperature. The evolution of the atomic position, , and velocity is then modelled using the differential equation:
| (1) |
where is the atomic mass of rubidium-85 and
| (2) |
describes the potential experienced by a neutral atom in a linearly polarized dipole trap where detunings from the D1 and D2 transitions, and , are much larger than the ground state hyperfine splitting Grimm et al. (2000) and which the atom is subject to gravitational acceleration, . Here and are the decay rates and optical angular frequencies for specified transitions, and is the local intensity of the guide beam. The simulation includes the spontaneous absorption and emission of guide photons as well as atom loss due to background gas collisions (see Appendix C).
We are able to qualitatively test our simulation by comparing the time dynamics of the ensemble to the experiment. A large number () of atoms are simulated, and by calculating the position and optical depth for each atom at several time steps we are able to replicate the data obtained experimentally using both absorption imaging and in-fibre spectroscopy techniques. As seen in figure 2(c) there is excellent agreement between the experiment and simulation. It is clear from these images that a large fraction of the initial atom cloud is not guided by the dipole trap, which highlights the importance of improving the mode overlap of the guide and MOT.
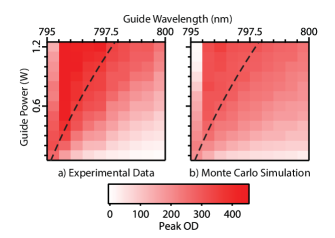
We experimentally investigated the dependence of the atom loading process on dipole trap parameters by measuring peak optical depth as a function of guide powers and wavelengths. These measurements, shown in figure 3(a), provide a quantitative means to compare the experiment against the simulation results shown on figure 3(b). In order to ensure that the experimental atom density distribution is a match for the assumed initial distribution in the simulation we reduced the total atom number density by about a factor of 2 from the values shown before (since it is known that high density MOTs have complex atomic distributions Walker et al. (1990); Gattobigio et al. (2010)). We see excellent agreement between experiment and simulation, both in the absolute values and the overall shape. For conditions in which the guide is nearly resonant (the left-most column in figure 3(a)) we see a reduction in the number of loaded atoms as we increase the guide depth. The simulation provides the physical understanding that this comes because of the high photon scattering rates that drive the atoms away from the fibre. We also see a plateau in the loaded atom number as guide power is increased (marked out by dashed line on the figure) corresponding to a trap deep enough to catch all the atoms in the volume defined by the overlap of the guide and initial atom ensemble. We note that there are no free parameters in the simulation, which emphasizes the strength of the model.
V Time Dynamics
We have investigated the time dynamics of the loading process by taking absorption measurements at time intervals following the release of the MOT (similar to that shown in figure 2(a). Fitting to each spectra provides , and we convert this to the equivalent atom number in the fibre. To estimate the uncertainty of each measurement and also improve the statistics we have taken averages for each time step.
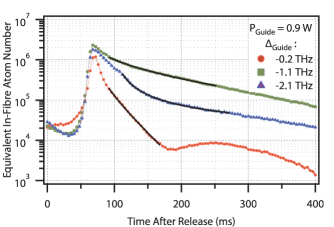
This procedure is performed in guide detuning steps of out to below the D1 transition. We show in figure 4 the temporal evolution of atom number for three of these different wavelengths. We note that these curves display considerably different loading behaviours. For a near-detuned guide we see a very clear peak in the number of atoms in the fibre followed by a rapid decay, and a weak resurgence at . For a guide detuning we see a similar dramatic increase in atom number at but with a much slower exponential decay of atomic number. For a guide detuning, where one might have expected weaker interaction with the guide and thus similar behaviour to the result, we observe an initially higher decay rate. At longer times we see a return to an exponential decay with a similar coefficient to the detuning situation. Between these specific examples the loading dynamics follow a smooth transition between each regime.
Our simulation allows us to explain these behaviours: for near-detuning the photon scattering rate from the guide is high and atoms are quickly expelled from the fibre leading to the strong decay. As seen on figure 4, some of the atoms that have been pushed upwards eventually re-enter the fibre at a later time leading to the observation of the resurgence of absorption associated with “bouncing” atoms. The theoretical treatment allows us to observe these “bouncing” atoms in the simulated absorption images 111See Supplementary Material at [URL HERE] for simulation atom bounce absorption images.. For the case with detuning, the scattering rate is small enough that we don’t see this repulsive effect of the guide. In this case, the residual exponential loss is associated with background gas collisions; the observed decay rate allows calculation of the residual background gas density within the fibre (see below). For the guide detuning we believe that we are driving a photo-association transition resulting in the formation of excited molecules that are lost from the trap Miller et al. (1993). The photo-association rate is proportional to the density of Rb atoms and hence becomes negligible once the density has fallen sufficiently.
We fit the atom number evolution for the family of guide detunings to an equation of the form:
| (3) |
where is the loss rate due to atomic collisions, and is the wavelength-dependent photo-association loss coefficient, to extract a collisional loss rate of . The derived density-independent loss rate has a similar value to measurements made by Okaba et al. (2014) () in a shorter section of fibre (). The background rubidium densities in the chamber and the fibre are below , which results in a Rb-Rb collision rate that is -fold too low to explain the observed collision-related loss Rapol et al. (2001). We thus attribute these losses to collisions with background gas atoms - if, as expected, this background is dominated by N2 due to outgassing, then we can calculate the background pressure from the in-fibre collision rate as Arpornthip et al. (2012); Rapol et al. (2001). We can separately calculate the N2 pressure in the chamber from the measured MOT loading time constant giving a value of . The N2 pressure inside the fibre appears reasonable in light of the unfavourable vacuum geometry of the core of the fibre.
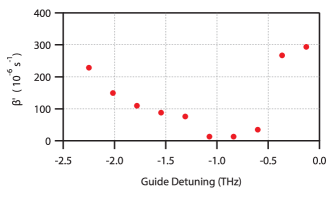
The value for is more difficult to obtain precisely as these processes are dominant during the peak loading time while there are other strongly competing processes. We choose a fit window that contains the corner between the fast and slow loss processes (shown as black solid lines in figure 4). The fit quality is sensitive to the chosen start and end of this fitting window due to the simplicity of the two parameter model and the complexity of the experimental system. As such, the results of this fitting, shown in figure 5, are intended only as a qualitative description. The form of shows a decrease from the rapid decay experienced near resonance, to a minimum at detuned, before smoothly increasing as the guide is detuned further. Is it possible to convert from the number loss rate rate to the density loss rate by estimating the total volume of the atomic sample that we calculate from the Monte Carlo to be . Using this value for the volume we calculate to be as low as and as high as , values that are comparable to values in the literature for similarly sized dipole traps Kuppens et al. (2000); Fuhrmanek et al. (2012).
As the density-dependent loss term restricts the usable optical depth of the system, the ability to select a wavelength for which the coefficient is minimized is of key importance.
VI Performance and Limitations
We have demonstrated a highly efficient mechanism for transferring cold atoms into a waveguide. Most applications to which this extreme media could be targeted will depend on the achievable optical depth and coherence time of the media.
The highest optical depth attained in our system is under typical operating conditions. The current limit to this performance is the due to the geometric mismatch between the guide beam and the MOT, with of the initial cloud coupled into the fibre. This fraction could be dramatically increased by using densifying techniques such as a spatial dark spot MOT, or changing to a high aspect ratio cigar shaped MOT.
We have also investigated the dependence and dynamics of the loading process on wavelength and power of the guide - in this process we identified a density dependent atom-loss term that is likely associated with photo-association. This process can result in an unwanted reduction in the number of loaded atoms, but can be alleviated by tuning the guide wavelength to avoid a photo-association transition.
The atomic coherence time will be limited by the faster of two effects: decoherence induced by interaction between trapped atoms and the optical guide field, or the loss of atoms. Photon scattering in the current experiment limits the atomic coherence time to around , although this rate could be much reduced by replacing the attractive guide with a hollow repulsive guide mode Poulin et al. (2011). This trap geometry would confine atoms predominantly within the low intensity region, vastly reducing the scattering rate. We have simulated this situation, using a hollow trap of the same peak intensity as our Gaussian trap, to predict a time between photon scattering events of - a hundred fold improvement over the current lifetime. An alternative approach to the same end would be the use of a weak far off resonance red-detuned trap; this approach has been shown to work by using an initial ensemble with a lower temperature or by only trapping the coldest fraction of the atomic cloud Okaba et al. (2014); Xin et al. (2018). In these weaker red or blue detuned traps, the background gas collisions will set a coherent light-atom interaction limit at ; however, even this limit is likely extended by careful baking of the fibre to reduce outgassing.
VII Conclusion
We have demonstrated a HC-PCF cold-atom-loading technique that is capable of loading atoms into the fibre - a state of the art result. Aided by a robust Monte Carlo simulation we have explored the loading efficiency dependence on the parameters of the optical guide beam enabling us to generate confined atom samples with optical depths as high as . Our rapid probing technique has allowed us to follow the evolution of atoms in real-time and we can use this to observe the fundamental de-coherence processes that apply to the approach. Our simulation allows us to show that one could maintain these high optical depths while extending the coherence time out to beyond .
Acknowledgements.
We would like to thank the South Australian government for supporting this research through the PRIF program. This research was funded by the Australian government through the Australian Research Council (DE12012028). BMS acknowledged support from an ARC Discovery Early Career Researcher Award (DE170100752). We would like to thank Marcin Witkowski for his contribution to the design and construction of the scalar magnetic field cancellation coils.Appendix A 1: Optical Depth Calculations
The optical depth for a single atom in a gaussian probe field is given by
| (4) |
where is the optical detuning in the atomic reference frame, is the photon scattering cross-section for the interrogated transition, is the local waist of the probe, are the hyperfine strength factors, and are the optical detunings of hyperfine levels. The velocity of the atom is accounted for by moving to the lab reference frame using .
The optical depth for an ensemble of atoms can be estimated by summing the optical depth over each atom, or equivalently, one can integrate over the spatial atom number density :
| (5) |
where and are the length and radius of the ensemble, respectively.
One can simplify this calculation by making the assumption that ensemble of atoms is uniformly populated over , and that the radial dependence of the atom density follows a gaussian distribution with standard deviation :
| (6) |
The integration now reduces to
| (7) |
for the peak optical depth on the hyperfine transition, where is a coefficient that describes the level of spatial overlap between a cloud of atoms with gaussian radial density and uniform longitudinal density, and a gaussian intensity profile:
| (8) |
Appendix B 2: Atom Coupling Dependence
The atom capture efficiency strongly depends on the geometries of the initial MOT and guide geometries. A brief algebraic analysis is done to determine the scaling of efficiency with the power and size of the guide beam.
We first approximate the guide beam to be collimated through the length of the atom cloud, and we assume that the waist, , is sufficiently small at the initial atom cloud location, , that the cloud can be approximated as having a uniform column number density given by . At the trap depth in the radial direction can be described by
| (9) |
where is the radial coordinate, and are the optical power and wavelength of the guide, and
| (10) | ||||
| (11) |
is the peak trap depth, with wavelength dependence .
We consider atoms to be trapped if the trap depth at their location is greater in magnitude than the kinetic energy of the atom, and negative in sign, i.e.
| (12) |
The radius at which this is true for a fixed ensemble temperature is
| (13) |
and the number of trapped atoms thus given by
| (14) | ||||
| (15) | ||||
| (16) |
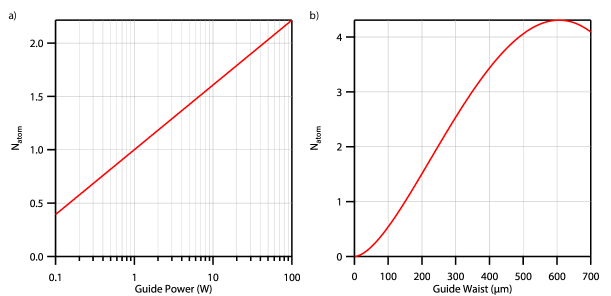
From this we can find the dependence of trapped atoms on guide power and waist:
| (17) | ||||
| (18) |
We conclude that the scaling of atom number with power offers strongly diminishing returns, while increasing the divergence of the guide or the distance from the fibre to the cloud could lift the trapped atom number as shown in figure 6.
Appendix C Monte Carlo Simulation
The local photon scattering rate for an alkali metal atom in a light field detuned from an optical transition by a distance larger than the hyperfine splitting, and less than the fine splitting, is given by
| (19) |
where is the speed of light, is the reduced Planck constant, is the resonance angular frequency, and are the detunings from the centres of the D1 and D2 lines respectively, and is the guide intensity.
We integrate while numerically solving the equations of motion for each atom to find the total number of scattering events up to a time t:
| (20) |
Each time crosses an integer, we perturb the atom velocity with a kick, , of
| (21) |
where is the optical angular frequency of the guide and is a unit vector randomly generated in spherical coordinates. The first term represents a velocity kick in the direction of the guide due to spontaneous absorption, and the second represents a velocity kick in a random direction due to spontaneous emission.
The simulation also allows for background gas collisions by probabilistically eliminating atoms from the simulation. The probability that an atom does not experience a collision in the time frame is given by
| (22) |
where is atom loss rate either outside or inside of the fibre, of . By sampling this probability at sufficiently fine time intervals during calculation the population decays by the appropriate rate.
References
- Kasevich and Chu (1991) M. Kasevich and S. Chu, “Atomic interferometry using stimulated Raman transitions,” Physical Review Letters 67, 181–184 (1991).
- Dutta et al. (2016) I. Dutta, D. Savoie, B. Fang, B. Venon, C. L. Garrido Alzar, R. Geiger, and A. Landragin, “Continuous Cold-Atom Inertial Sensor with Rotation Stability,” Physical Review Letters 116, 183003 (2016).
- Canuel et al. (2006) B. Canuel, F. Leduc, D. Holleville, A. Gauguet, J. Fils, A. Virdis, A. Clairon, N. Dimarcq, Ch J. Bordé, A. Landragin, and P. Bouyer, “Six-axis inertial sensor using cold-atom interferometry,” Physical Review Letters 97, 010402 (2006).
- Peters et al. (2001) A. Peters, K. Y. Chung, and S. Chu, “High-precision gravity measurements using atom interferometry,” Metrologia 38, 25–61 (2001).
- Stockton et al. (2011) J. K. Stockton, K. Takase, and M. A. Kasevich, “Absolute Geodetic Rotation Measurement Using Atom Interferometry,” Physical Review Letters 107, 133001 (2011).
- Hinkley et al. (2013) N. Hinkley, J. A. Sherman, N. B. Phillips, M. Schioppo, N. D. Lemke, K. Beloy, M. Pizzocaro, C. W. Oates, and A. D. Ludlow, “An Atomic Clock with 10-18 Instability,” Science 341, 1215–1218 (2013).
- Cronin et al. (2009) A. D. Cronin, J. Schmiedmayer, and D. E. Pritchard, “Optics and interferometry with atoms and molecules,” Reviews of Modern Physics 81, 1051–1129 (2009).
- Altin et al. (2013) P. A. Altin, M. T. Johnsson, V. Negnevitsky, G. R. Dennis, R. P. Anderson, J. E. Debs, S. S. Szigeti, K. S. Hardman, S. Bennetts, G. D. McDonald, L. D. Turner, J. D. Close, and N. P. Robins, “Precision atomic gravimeter based on Bragg diffraction,” New Journal of Physics 15, 1–19 (2013).
- Glaetzle et al. (2017) A. W. Glaetzle, R. M. W. van Bijnen, P. Zoller, and W. Lechner, “A coherent quantum annealer with Rydberg atoms,” Nature Communications 8, 15813 (2017).
- Gross and Bloch (2017) C. Gross and I. Bloch, “Quantum simulations with ultracold atoms in optical lattices,” Science 357, 995–1001 (2017).
- Garreau (2017) J.-C. Garreau, “Quantum simulation of disordered systems with cold atoms,” Comptes Rendus Physique 18, 31–46 (2017).
- Sparkes et al. (2013) B. M. Sparkes, J. Bernu, M. Hosseini, J. Geng, Q. Glorieux, P. A. Altin, P. K. Lam, N. P. Robins, and B. C. Buchler, “Gradient echo memory in an ultra-high optical depth cold atomic ensemble,” New Journal of Physics 15, 085027 (2013).
- Liu et al. (2016) Z.-Y. Liu, Y.-H. Chen, Y.-C. Chen, H.-Y. Lo, P.-J. Tsai, I. A. Yu, Y.-C. Chen, and Y.-F. Chen, “Large cross-phase modulations at the few-photon level,” Physical Review Letters 117, 203601 (2016).
- Hardman et al. (2016) K. S. Hardman, P. J. Everitt, G. D. McDonald, P. Manju, P. B. Wigley, M. A. Sooriyabandara, C. C. N. Kuhn, J. E. Debs, J. D. Close, and N. P. Robins, “Simultaneous Precision Gravimetry and Magnetic Gradiometry with a Bose-Einstein Condensate: A High Precision, Quantum Sensor,” Physical Review Letters 117, 138501 (2016).
- Cregan et al. (1999) R. F. Cregan, B. J. Mangan, J. C. Knight, T. A. Birks, P. St J. Russell, P. J. Roberts, and D. C. Allan, “Single-mode photonic band gap guidance of light in air,” Science 285, 1537–1539 (1999).
- Couny et al. (2006) F. Couny, F. Benabid, and P. S. Light, “Large-pitch kagome-structured hollow-core photonic crystal fiber,” Optics Letters 31, 3574–3576 (2006).
- Markos et al. (2017) C. Markos, J. C. Travers, A. Abdolvand, B. J. Eggleton, and O. Bang, “Hybrid photonic-crystal fiber,” Reviews of Modern Physics 89, 045003 (2017).
- Blatt et al. (2014) F. Blatt, T. Halfmann, and T. Peters, “One-dimensional ultracold medium of extreme optical depth,” Optics Letters 39, 446 (2014).
- Blatt et al. (2016) F. Blatt, L. S. Simeonov, T. Halfmann, and T. Peters, “Stationary light pulses and narrowband light storage in a laser-cooled ensemble loaded into a hollow-core fiber,” Physical Review A 94, 043833 (2016).
- Peyronel et al. (2012) T. Peyronel, M. Bajcsy, S. Hofferberth, V. Balic, M. Hafezi, Q. Liang, A. Zibrov, V. Vuletic, and M. D. Lukin, “Switching and counting with atomic vapors in photonic-crystal fibers,” IEEE Journal on Selected Topics in Quantum Electronics 18, 1747–1753 (2012).
- Langbecker et al. (2017) M. Langbecker, M. Noaman, N. Kjærgaard, F. Benabid, and P. Windpassinger, “Rydberg excitation of cold atoms inside a hollow-core fiber,” Physical Review A 96, 041402 (2017).
- Okaba et al. (2014) S. Okaba, T. Takano, F. Benabid, T. Bradley, L. Vincetti, Z. Maizelis, V. Yampol’skii, F. Nori, and H. Katori, “Lamb-Dicke spectroscopy of atoms in a hollow-core photonic crystal fibre,” Nature Communications 5, 4096 (2014).
- Xin et al. (2018) M. Xin, W. S. Leong, Z. Chen, and S.-Y. Lan, “An atom interferometer inside a hollow-core photonic crystal fiber,” Science Advances 4, e1701723 (2018).
- Dalibard and Cohen-Tannoudji (1989) J. Dalibard and C. Cohen-Tannoudji, “Laser cooling below the Doppler limit by polarization gradients: simple theoretical models,” Journal of the Optical Society of America B 6, 2023 (1989).
- Grimm et al. (2000) R. Grimm, M. Weidemüller, and Y. Ovchinnikov, “Optical dipole trap for neutral atoms,” Adv. At. Mol. Opt. Phys. 42, 95 (2000).
- Bajcsy et al. (2011) M. Bajcsy, S. Hofferberth, T. Peyronel, V. Balic, Q. Liang, A. S. Zibrov, V. Vuletic, and M. D. Lukin, “Laser-cooled atoms inside a hollow-core photonic-crystal fiber,” Physical Review A 83, 063830 (2011).
- Wigley et al. (2016) P. B. Wigley, P. J. Everitt, A. van den Hengel, J. W. Bastian, M. A. Sooriyabandara, G. D. McDonald, K. S. Hardman, C. D. Quinlivan, P. Manju, C. C. N. Kuhn, I. R. Petersen, A. N. Luiten, J. J. Hope, N. P. Robins, and M. R. Hush, “Fast machine-learning online optimization of ultra-cold-atom experiments,” Scientific Reports 6, 25890 (2016).
- Hush (2017) M. R. Hush, “M-loop: Machine-learning online optimization package,” https://github.com/michaelhush/M-LOOP (2017).
- Bajcsy et al. (2009) M. Bajcsy, S. Hofferberth, V. Balic, T. Peyronel, M. Hafezi, A. S. Zibrov, V. Vuletic, and M. D. Lukin, “Efficient All-Optical Switching Using Slow Light within a Hollow Fiber,” Physical Review Letters 102, 203902 (2009).
- Noaman et al. (2018) M. Noaman, M. Langbecker, and P. Windpassinger, “Micro-lensing-induced line shapes in a single-mode cold-atom–hollow-core-fiber interface,” Optics Letters 43, 3925 (2018).
- Roof et al. (2015) S. Roof, K. Kemp, M. Havey, I. M. Sokolov, and D. V. Kupriyanov, “Microscopic lensing by a dense, cold atomic sample,” Optics Letters 40, 1137 (2015).
- Davidson et al. (1995) N. Davidson, H. J. Lee, C. S. Adams, M. Kasevich, and S. Chu, “Long Atomic Coherence Times in an Optical Dipole Trap,” Physical Review Letters 74, 1311–1314 (1995).
- Hsiao et al. (2018) Y.-F. Hsiao, P.-J. Tsai, H.-S. Chen, S.-X. Lin, C.-C. Hung, C.-H. Lee, Y.-H. Chen, Y.-F. Chen, I. A. Yu, and Y.-C. Chen, “Highly Efficient Coherent Optical Memory Based on Electromagnetically Induced Transparency,” Physical Review Letters 120, 183602 (2018).
- Kaczmarek et al. (2015) K. T. Kaczmarek, D. J. Saunders, M. R. Sprague, W. S. Kolthammer, A. Feizpour, P. M. Ledingham, B. Brecht, E. Poem, I. A. Walmsley, and J. Nunn, “Ultrahigh and persistent optical depths of cesium in Kagomé-type hollow-core photonic crystal fibers,” Optics Letters 40, 5582 (2015).
- Hsiao et al. (2014) Y.-F. Hsiao, H.-S. Chen, P.-J. Tsai, and Y.-C. Chen, “Cold atomic media with ultrahigh optical depths,” Physical Review A 90, 055401 (2014).
- Ketterle et al. (1993) W. Ketterle, K. B. Davis, M. A. Joffe, A. Martin, and D. E. Pritchard, “High densities of cold atoms in a dark spontaneous-force optical trap,” Physical Review Letters 70, 2253–2256 (1993).
- Depue et al. (2000) M. T. Depue, S. Lukman Winoto, D. J. Han, and D. S. Weiss, “Transient compression of a MOT and high intensity fluorescent imaging of optically thick clouds of atoms,” Optics Communications 180, 73–79 (2000).
- Petrich et al. (1994) W. Petrich, M. H. Anderson, J. R. Ensher, and E. A. Cornell, “Behavior of atoms in a compressed magneto-optical trap,” Journal of the Optical Society of America B 11, 1332 (1994).
- Lin et al. (2008) Y.-W. Lin, H.-C. Chou, P. P. Dwivedi, Y.-C. Chen, and I. A. Yu, “Using a pair of rectangular coils in the MOT for the production of cold atom clouds with large optical density,” Optics Express 16, 3753 (2008).
- Walker et al. (1990) T. Walker, D. Sesko, and C. Wieman, “Collective behavior of optically trapped neutral atoms,” Physical Review Letters 64, 408–411 (1990).
- Gattobigio et al. (2010) G. L. Gattobigio, T. Pohl, G. Labeyrie, and R. Kaiser, “Scaling laws for large magneto-optical traps,” Physica Scripta 81, 025301 (2010).
- Note (1) See Supplementary Material at [URL HERE] for simulation atom bounce absorption images.
- Miller et al. (1993) J. D. Miller, R. A. Cline, and D. J. Heinzen, “Photoassociation spectrum of ultracold Rb atoms,” Physical Review Letters 71, 2204–2207 (1993).
- Rapol et al. (2001) U. D. Rapol, A. Wasan, and V. Natarajan, “Loading of a Rb magneto-optic trap from a getter source,” Physical Review A 64, 023402 (2001).
- Arpornthip et al. (2012) T. Arpornthip, C. A. Sackett, and K. J. Hughes, “Vacuum-pressure measurement using a magneto-optical trap,” Physical Review A 85, 033420 (2012).
- Kuppens et al. (2000) S. J. M. Kuppens, K. L. Corwin, K. W. Miller, T. E. Chupp, and C. E. Wieman, “Loading an optical dipole trap,” Physical Review A 62, 013406 (2000).
- Fuhrmanek et al. (2012) A. Fuhrmanek, R. Bourgain, Y. R. P. Sortais, and A. Browaeys, “Light-assisted collisions between a few cold atoms in a microscopic dipole trap,” Physical Review A 85, 062708 (2012).
- Poulin et al. (2011) J. Poulin, P. S. Light, R. Kashyap, and A. N. Luiten, “Optimized coupling of cold atoms into a fiber using a blue-detuned hollow-beam funnel,” Physical Review A 84 (2011), 10.1103/PhysRevA.84.053812.