Long-Term Decline of the Mid-Infrared Emission of Normal Galaxies: Dust Echo of Tidal Disruption Flare?
Abstract
We report the discovery of a sample of 19 low redshift () spectroscopically non-Seyfert galaxies that show slow declining mid-infrared (MIR) light-curves (LCs), similar to those of tidal disruption event (TDE) candidates with extreme coronal lines. Two sources also showed a relatively fast rising MIR LCs. They consist of 61% sample of the WISE MIR variable non-Seyfert galaxies with SDSS spectra. In a comparison sample of optically selected Seyfert galaxies, the fraction of sources with such a LC is only 15%. After rejecting 5 plausible obscured Seyfert galaxies with red MIR colours, remaining 14 objects are studied in detail in this paper. We fit the declining part of LC with an exponential law, and the decay time is typically one year. The observed peak MIR luminosities () after subtracting host galaxies are in the range of a few to erg s-1 with a median of erg s-1 in the band. The black hole masses distribute in a wide range with more than half in between to , but significantly different from that of optical/UV selected TDEs. Furthermore, MIR luminosities are correlated with black hole masses, the stellar mass or luminosity of their host bulges. Most galaxies in the sample are red and luminous with an absolute magnitude of between -20 to -23. We estimate the rate of event about gal-1 yr-1 among luminous red galaxies. We discuss several possibilities for the variable infrared sources, and conclude that most likely, they are caused by short sporadic fueling to the supermassive black holes via either the instability of accretion flows or tidal disruption of stars.
keywords:
black holes, accretion; galaxies: active; galaxies: Seyfert, galaxies: nuclei, infrared: galaxies supernovae: general1 Introduction
A star passing too close to the supermassive black hole (SMBH) in the galactic nucleus will be torn apart by the tidal force of the hole (Hills, 1975). About half of the debris is accreted onto the black hole, producing a strong UV to soft X-ray flare (Rees, 1988; Phinney, 1989; Komossa, 2015). The flare rises rather fast on a time scale of about a month (Gezari et al., 2009, 2012), and fades approximately in a power-law form (Komossa & Bade, 1999; Gezari et al., 2015; Brown et al., 2016; van Velzen et al., 2016; Brown et al., 2017). Transient broad emission lines have been detected recently in a significant fraction of known tidal disruption events (TDEs) or TDE candidates although their origin has not yet fully understood (Komossa et al., 2008; van Velzen et al., 2011; Wang et al., 2011; Gezari et al., 2012; Arcavi et al., 2014). Up to now, several dozens of tidal disruption events have been reported, and the rate of events is broadly consistent with theoretical predictions at about to gal-1 yr-1 (Wang & Merritt, 2004; Donley et al., 2002; Esquej et al., 2008; Wang et al., 2012; van Velzen & Farrar, 2014; Holoien et al., 2016a; Stone & Metzger, 2016). These events provide a unique opportunity to probe SMBHs in quiescent galaxies at the low mass end, below a few M⊙, or at redshifts beyond 0.1, where it is difficult to probe SMBHs using other techniques.
Illuminated by the transient UV and X-ray emission, gas surrounding the black hole is photo-ionized and produce emission lines (Ulmer, 1999). Komossa et al. (2008) reported a transient extreme coronal line emitter (ECLE) in J0952+2143 and suggested that it might be caused by TDE. A moderate-amplitude optical flare was observed serendipitously in the optical survey carried out in the Lincoln Near-Earth Asteroid Research asteroid survey (LINEAR)(Palaversa et al., 2016). The light-curve covers the rising phase, and the detection of large amplitude UV variability is consistent with a TDE. Transients with extreme variable coronal lines were detected in three other star forming galaxies (Wang et al., 2012; Yang et al., 2013). Three of four ECLEs also display transient broad emission lines, including the first reported example of strong blue-shifted very broad HeII lines associated with TDE candidates (Wang et al., 2011, 2012). Yang et al. (2013) also observed brightening of [O iii] emission lines 5-7 years after the discovery of the high ionization lines in two ECLEs. The [O III] doublet line ratios are unusual, substantially higher (or lower) than the canonical values, suggesting very thick warm gas surrounding the central black holes.
Dust within a few parsecs of the black hole will absorb UV flux and re-emit in the infrared. Lu, Kumar, & Evans (2016) considered a model of spherically distributed dust with a sky covering factor 0.1 to 1.0 within 1 pc of the black hole, and predicted an infrared luminosity of order of to erg s-1, lasting for several years for a typical observed TDE. Jiang et al. (2016) found an infrared flare in both and bands of Wide Infrared Sky Explorer (WISE, Wright et al. (2010)) around 36 days after the discovery of the optical/X-ray flare, or a hundred days after the peak, for the nearest known TDE ASASSN-14li. The infrared luminosity is nearly two orders of magnitude lower than the model prediction, suggesting either small covering factor or small amount dust in the nucleus. van Velzen et al. (2016) detected 3 out of five bright TDEs searched in the 3.4m WISE band, and they also argued that dust covering factor must be small. While Dou et al. (2016) examined MIR light curves obtained by WISE for four ECLEs, and found that they all displayed long-term fading in both and bands 4-8 years after the initial detections of transient coronal lines. The infrared luminosities were two orders of magnitude higher than that in ASASSN-14li.
In view of these infrared echoes detected in TDE candidates. We have examined systematically the WISE light curves of optically normal galaxies, in hope to find new infrared echoes of TDEs. This is important as infrared emission is subject less to the dust extinction than optical and UV light. Hitherto, only the jetted TDE SWIFT J1644+57 was known to occur on the partially obscured nucleus (), which showed variable infrared emission (Levan et al., 2016). The paper is arranged as follows. We present the sample in §2. The light curves are analysed in §3. Simple statistics are given in §4. We discuss the implication in §5. Throughout the paper, we will adopt a cosmology of (=(70 km s−1 Mpc−1, 0.3, 0.7)
2 Infrared Flare non-Seyfert Galaxies
2.1 Classification of ALLWISE infrared variable sources with SDSS spectra
We cull mid-infrared variable sources from ALLWISE catalogue, that includes the Cryogenic WISE all sky survey (Wright et al., 2010), WISE 3-band Survey and post-Cryogenic NEOWISE survey (Mainzer et al., 2011), using the flags provided by the standard pipeline. The selection criteria are following: (1) point sources with to avoid additional photometric errors that unaccounted by error model; (2) in at least one band; (3) no source contamination in W1 and W2 band . The is a combination of two components: the implausibility of the null hypothesis that the source is not variable, and the significance of band to band correlations. Sources with can generally be considered as having a high reliability of being variable. Noting the variability flag is based on the data taken between Dec. 14, 2009 and Feb. 1, 2011 (ALLWISE data) only. This yields a list of total 96,856 sources. From their distribution on the sky, it is evident that most of them are Galactic objects. It should be noted that the above criteria still miss a large fraction of the mid-infrared sources variable on long-term as in the case for ECLEs, where only one of four objects meets above criteria, while all of them show long-term variations, as presented in Dou et al. (2016).
Next, we cross-correlate the above list with the SDSS spectroscopic catalogue. It results in 666 matched SDSS spectra for 526 objects within 3 arcsecs matching radius. Of these 526 sources, 360 are classified by SDSS pipeline as ”QSO”, 99 as ”GALAXY”, 31 as ”STAR” and the remaining 36 unclassified111For a source with more than one spectrum, we choose the one with the best signal to noise ratio.. Note that ”QSO” includes all subtypes of broad-line AGN and BL Lac objects. We extracted SDSS spectra from SDSS DR 12 (Alam et al., 2015) archive and checked the spectra visually. In this way, we find that about half of objects classified as ’GALAXY’ by the SDSS pipeline are actually BL Lacs (featureless continuum and strong radio emission) or broad line AGNs, and we correct for this, and also make a classification for 36 objects that were not classified by SDSS pipeline.
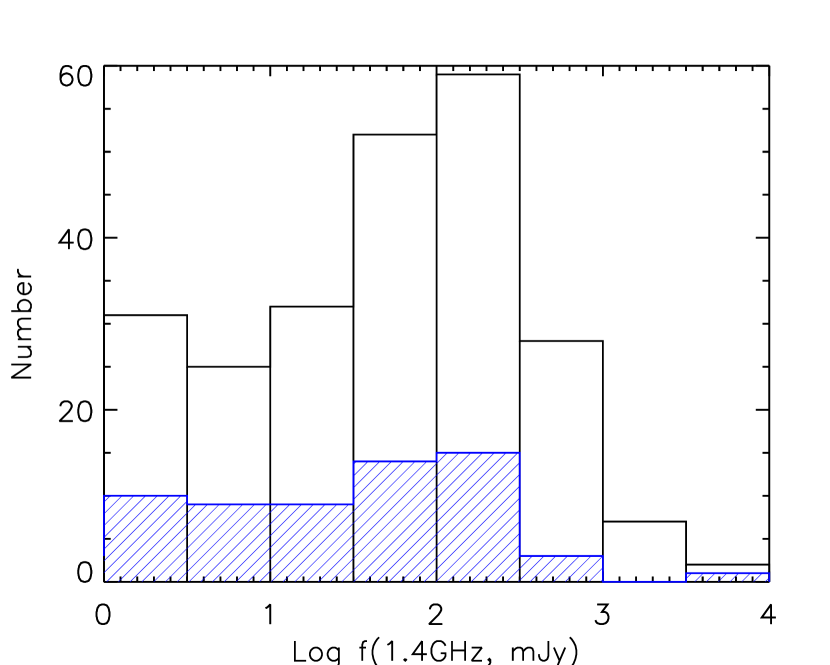
We also add a blazar subclass, which includes BL Lac and flat radio quasars. In our sample, 245 were detected in the FIRST survey (version 2014 December 17; (Becker, White, & Helfand, 1995)) with a median radio flux of 86.45 mJy. The large median radio flux is due to the fact that the FIRST detected sub-sample is dominated by radio strong BL-Lac objects and flat spectral radio quasars (FSRQ). Note that about 10% percent sources fall outside the FIRST survey footprint, in which we also check the NVSS catalogue (Condon et al., 1998). 27 additional sources are found in the NVSS catalogue. Figure 2 shows the distribution radio flux. The distribution for the subsample of ”GALAXY” classified by SDSS spectroscopic pipeline is indistinguishable from the whole sample according to K-S test. According to our visual examinations, most of them are BL Lac objects with a prominent featureless continuum. Although we do not have radio spectral index information, most radio-strong ( mJy) broad-line objects in this sample show systematically weaker emission lines and shorter term infrared variability at a given luminosity. Therefore, they are most likely blazars. We put all broad-line AGNs with mJy and all sources with featureless blue continuum regardless of its radio flux into the subclass of blazars.
To further classify narrow emission line galaxies, we extract emission line flux from Portsmouth database (Thomas et al., 2013). In the first step, a spectrum was decomposed into starlight and nebular emission lines using the publicly available codes Penalized PiXel Fitting (pPXF, Cappellari & Emsellem 2004). Next, they used Gas and Absorption Line Fitting code (GANDALF v1.5; Sarzi et al. 2006) to derive emission line parameters by fitting the nebular component with Gaussian templates. The first step is essential as some emission lines, especially H, are severely affected by the stellar absorption lines. Each emission line was modeled with one gausssian. We examine the optical spectrum and find that our objects usually show narrow and symmetrical emission lines, and a single gaussian should be sufficient. Objects show only weak (Å) or no detectable H line () are classified as pure absorption line galaxies.
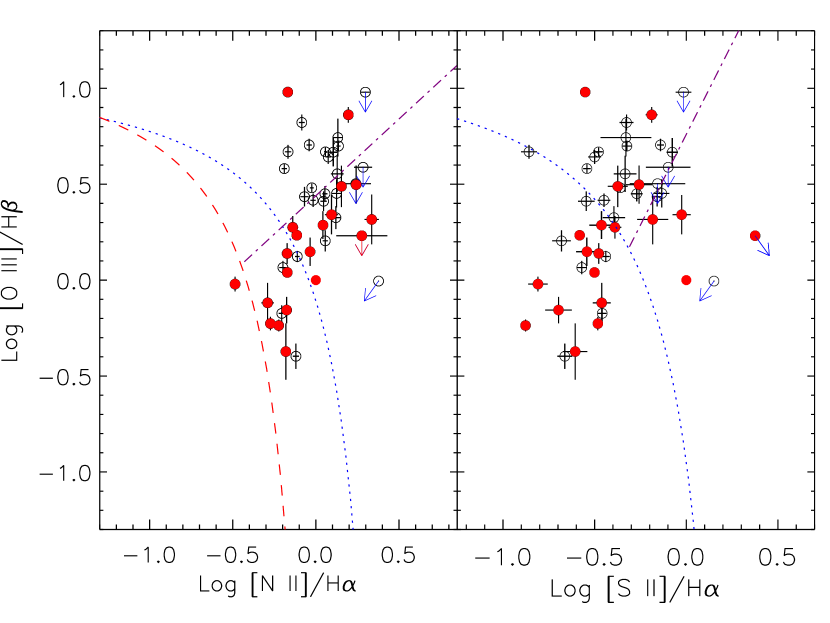
Using emission line ratios, we can further classify emission line galaxies into different subclasses according to their location on Baldwin, Philips and Terlevich (BPT) diagrams (Kewley et al., 2006). Among 45 galaxies (Figure 1) with reliable measurements of H and H or [N ii], 15 are classified as Seyfert 2 galaxies, 11 as star forming galaxies and 19 as Low Ionization Nuclear Emission Region (LINERs). These objects with non-detection of [O iii] is considered as star-forming galaxies or absorption line according to the EWs of H line (Å for absorption line galaxies). It should be noted that a large fraction of LINERs may be actually ionized by evolved star or radiative shocks rather than by an AGN as LINER-like spectra often appears in off-nucleus of normal galaxies as well (e.g., Cid Fernandes et al. 2011; also Zhang et al. 2017).
With all above vetting, we find the number of sources in each class as follows: 238 radio-weak broad-line AGNs, 218 blazars, 24 Seyfert 2 galaxies, 31 normal galaxies, including 1 absorption line galaxy, 5 star-forming galaxies and 8 LINERs, and 14 stars. Blazar is the second largest class after radio weak broad-line AGNs despite they are much less common among AGNs, reflecting that they are more variable than other subclasses of AGNs. In the following sections, we will mainly focus on these non-Seyfert galaxies.
2.2 Selection of MIR Flare Sources
We extracted MIR light-curves from the public WISE archive for all 526 sources. The WISE survey is good for detecting short time scale variabilities on time scale of hours, because the same piece of sky is usually scanned more than 12 times within two days, depending on the sky position. In order to increase signal to noise ratio, following Jiang et al. (2016), we rebinned light curves so that the photometry within two days is co-added. In practice, we fit a constant to the infrared magnitude within two days by minimizing . To account for potential other errors in the measurements, we also add a term to the error so to ensure the . Initially we set to zero, and then iteratively adjust until . We found a typical , which is comparable to the uncertainty given by the pipeline that listed in WISE All Sky survey documents 222http://wise2.ipac.caltech.edu/docs/release/allsky/. In addition, we supplement additional NEOWISE photometries for these 256 objects, extending time coverage to 2300 days.
Our purpose is to search for TDE candidates with mid-IR echoes. So, we focus only on the subset of 31 normal galaxies. In other words, their optical spectra and radio photometries have little signs of Seyfert type activities. In addition, we require that the mid-IR light curve either declines monotonically or displays only one peak, to distinguish the variability of Seyfert galaxies, which usually show up certain stochastic characteristics. Mathematically, a peak is the data point in the light curve that the flux rises before it and declines after that. For each data point, we decide whether it is a local peak or not, by searching backward for the evidence of a significant rising and forward for a significant decline. In practice, the fluctuations due to measurement errors will cause false ’rising’ or ’falling’ in the light curve. To tackle this, we define 2 increase or decrease over the previous data points as a significant rising or falling to account for the uncertainties of the measurements. We carry out Monte-Carlo simulations to quantify, under 2 threshold, how many single peaked light-curves are mis-identified with two or more peaks, and how many cases changed in opposite direction due to measurement errors. For each object, we simulate 100 light curves in W1 band and W2 bands. In each simulation, we add randomly gaussian errors with amplitude as measured one to the observed light curve. Then, we measure the number of peaks in the light curve exactly in the same way as had carried on real light curve. We find that about 7.5% single peaked light curves are misclassified as two or more peaks, and about 9.1% light curves with two or more are erroneously as one peaked objects for the sample of galaxies. In passing, we note that we use above non-parameter statistics to describe the light curve rather than using a light curve fitting because there is no prior knowledge on the form of the MIR light curve, which certainly depends on the dust distribution as well the form of UV light-curve.
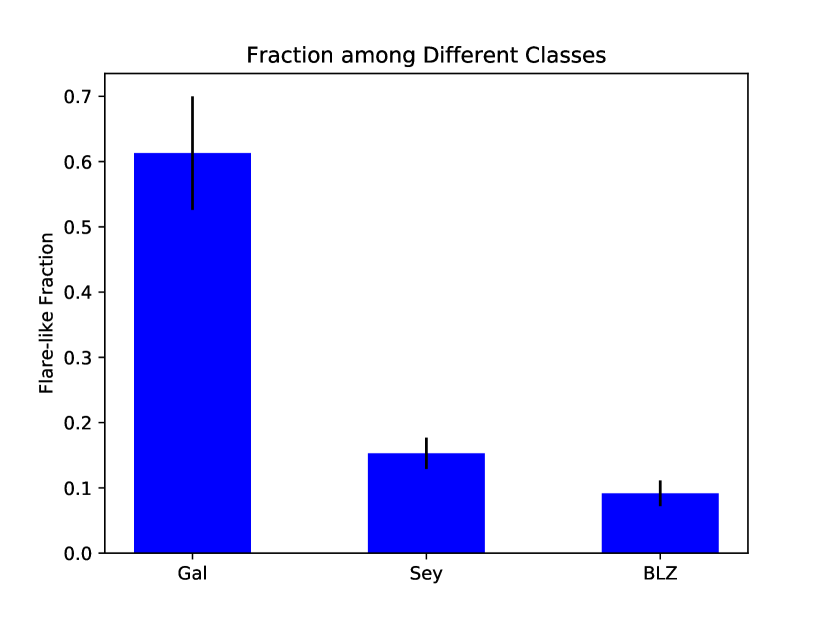
Of 31 sources, 19 meet these criteria. This is 61.3%. For comparison, we apply the same screening to the subsample of 229 Type 1 and Type 2 Seyfert galaxies in the redshift , similar to those of galaxy sample, and find 35 (15.2%) objects with flare-like light curves. The Seyfert galaxies in the comparison sample has similar W2 magnitude (with a median offset of only 0.12 magnitudes to the non-Seyfert galaxy sample). It is clear that the fraction showing flare-like light curves is much higher in the sample of MIR variable normal galaxies than in the sample of Seyfert galaxies. The difference is statistically significant at 2.5 . We make a similar analysis of light curves of the blazar subsample. Since more than half blazars in this sample do not have reliable redshifts, we do not apply any cut in the redshift. We find that 20 of 218 blazars show flare-like light curves. The fraction (9.2%) is significantly smaller than that in non-Seyfert galaxies. These results are summarized in Figure 3.
In the search for a microlensing event in a light curve () , Price-Whelan et al. (2014) used five statistical measures of variability compiled by Shin et al (2009) and also introduced von Neumann ratio (also known as Durbin-Watson statistics, von Neumann 1941; Durbin & Watson 1950). Here, we adopt two of these six parameters, the asymmetric index and von Neumann ratio to characterize the light curve. The asymmetric index () is defined as follows:
| (1) |
| (2) |
where is the error of , is the mean of , and the returns the sign of the variable. For a non-variable source, will be close to zero; for a well sampled light-curve of a strong variable source, should be large. However, if the cadence is comparable to the characteristic variability time scale, then can be a large negative, positive or close to zero. An example is a periodic light curve, and the observations happen to sample maxima and minima.
The von Neumann ratio is
| (3) |
where is the variance of the time series. A small implies a strong positive serial correlation between the successive data points. Applying to our case, is small for a continuously declining or rising light curve and large for random fluctuations. So we expect that a long term flare-like light-curve will have a smaller than stochastic variations as seen in AGNs, which can be described as damping random walks (DRW, e.g., Kelly et al. 2009).
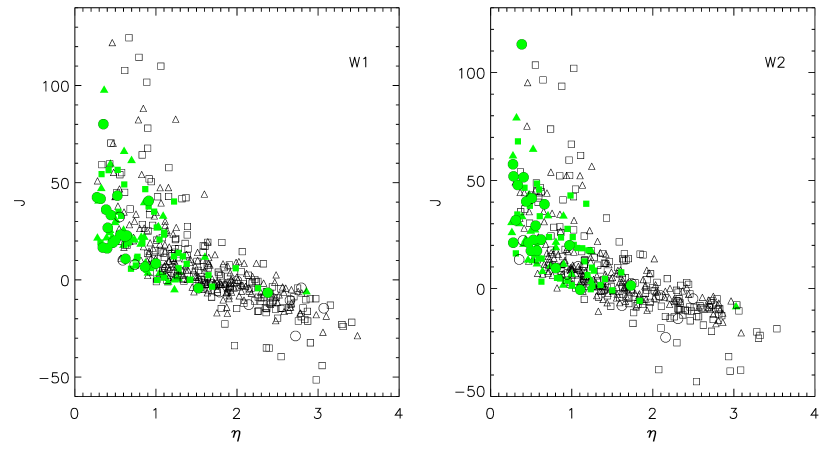
We calculate and for 31 spectroscopic non-Seyfert galaxies, 229 Seyfert galaxies at redshift and 218 blazars. We show versus for each subsample in Figure 4. First, most objects have large , suggesting that typical rising or falling trend on time scale scales longer than the cadence of order a half year. In general, blazars are more likely with a large positive or negative . The latter is likely caused by large-amplitude short-term variability. Second, non-Seyfert galaxies have a larger fraction of objects with small . We perform the Kolmogorov–Smirnov test for whether two distributions are drawn from the same parent population, and find that Seyfert galaxies and blazars show marginally different distributions with , in and bands, respectively. While non-Seyfert galaxies are significantly different from either Seyfert galaxies ( and ) or blazars ( and ) in and , respectively. Finally, objects with one-peak light-curve on average have smaller and a positive , qualitatively consistent with our intuition. But there are some exceptions. An example of the latter is J141036.81+265425.0, where is small negative and is large (). This is caused poor sampling of the flare, particularly, only one data point is notably above the quiescent level in the -light curve. These exceptions indicates that and parameters are not as robust as our single-peak parameter in the application to the case of sparse sampling.
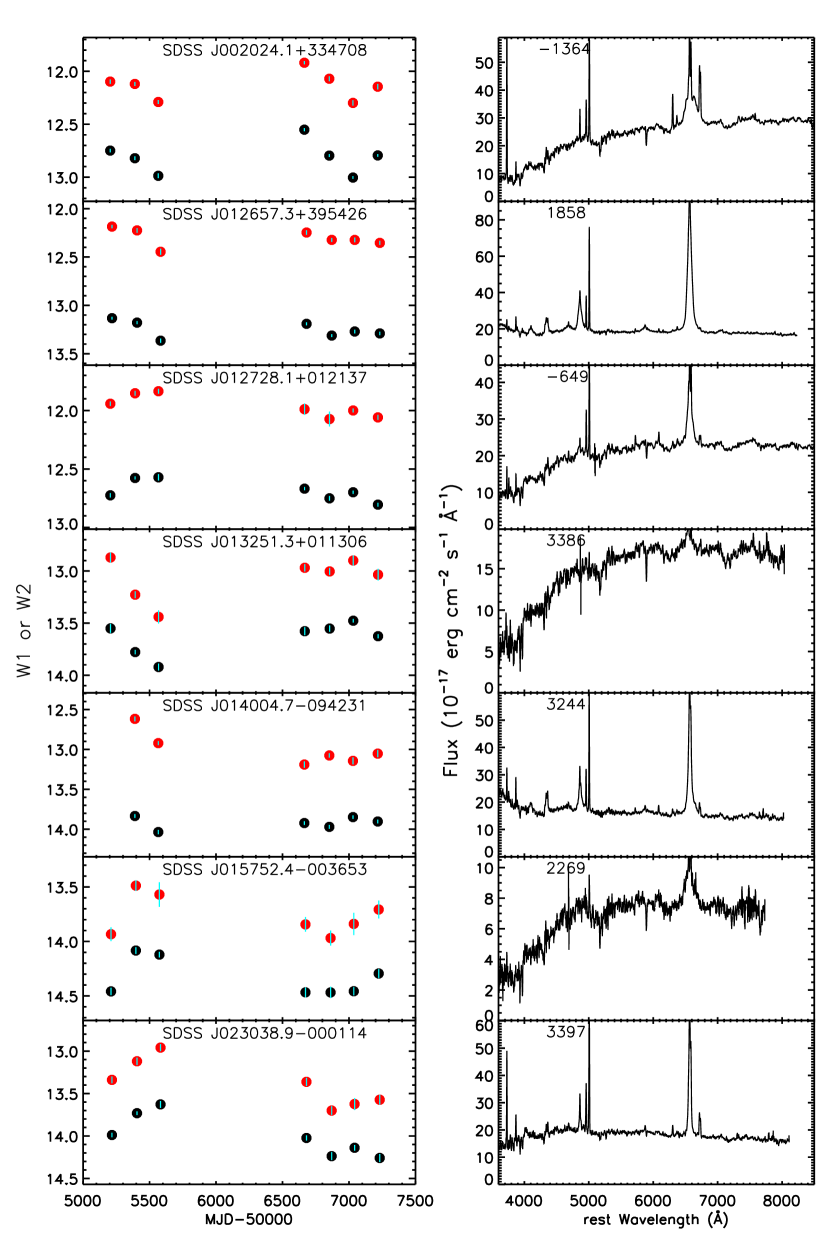
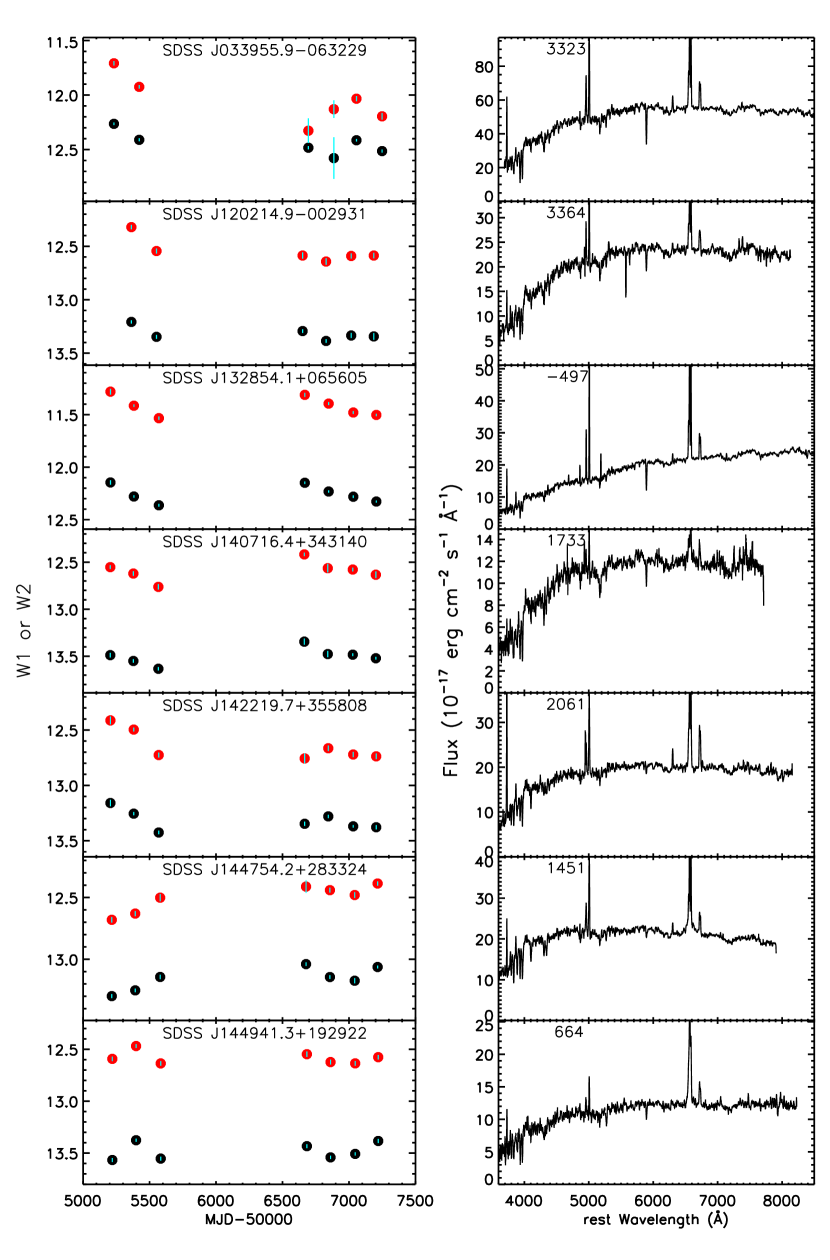
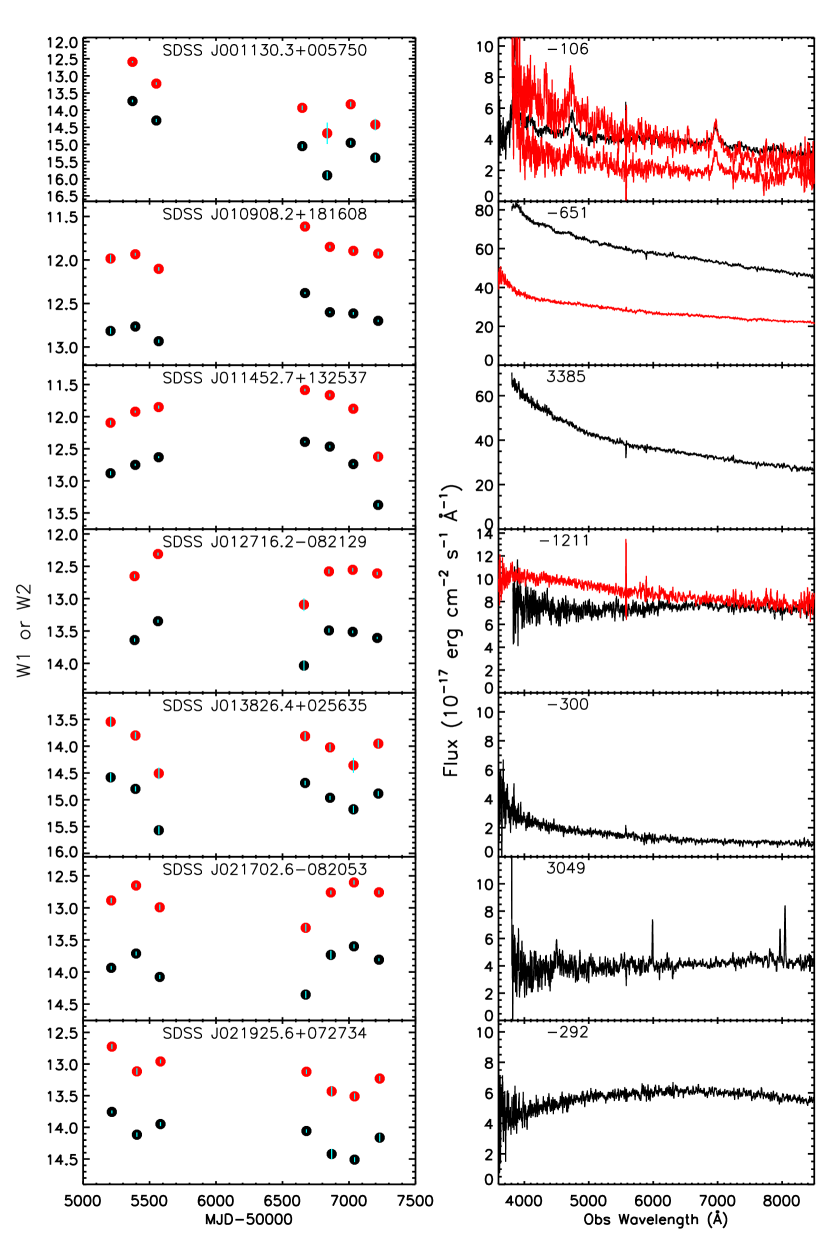
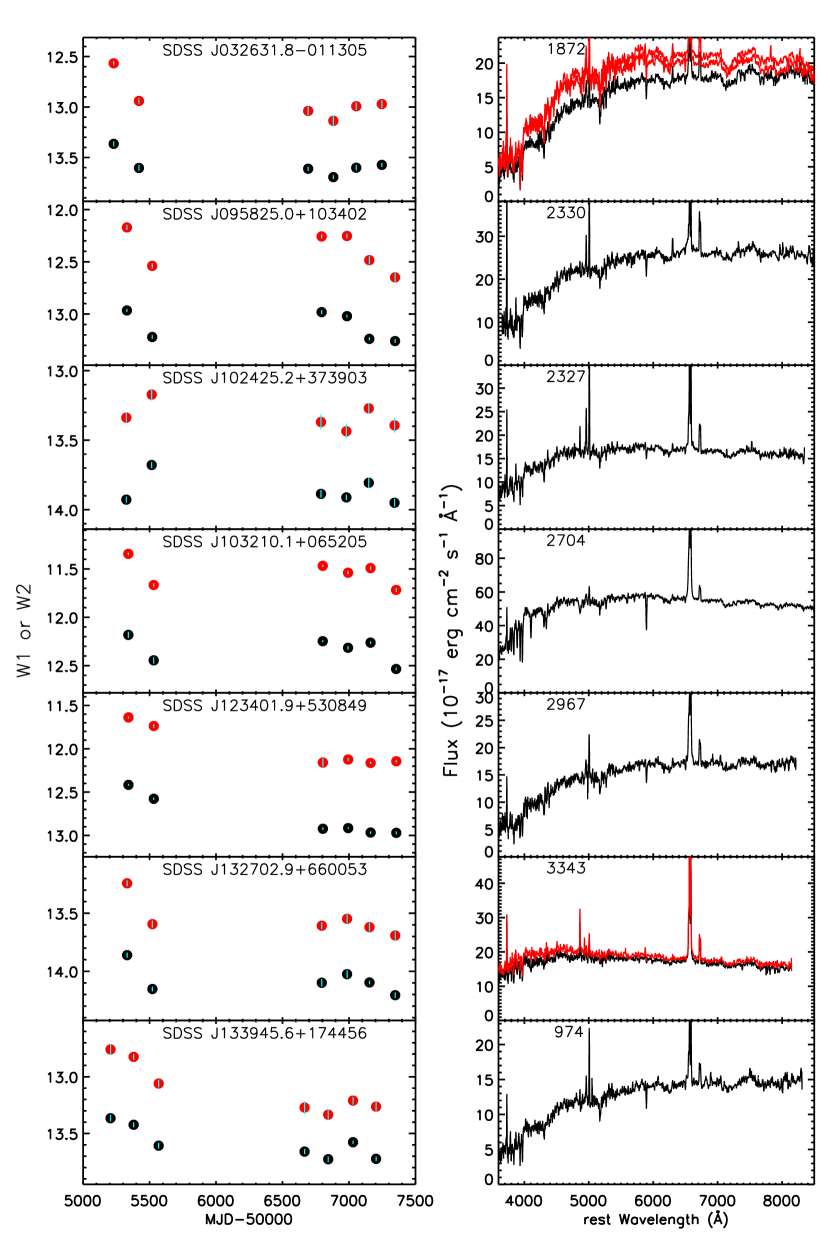
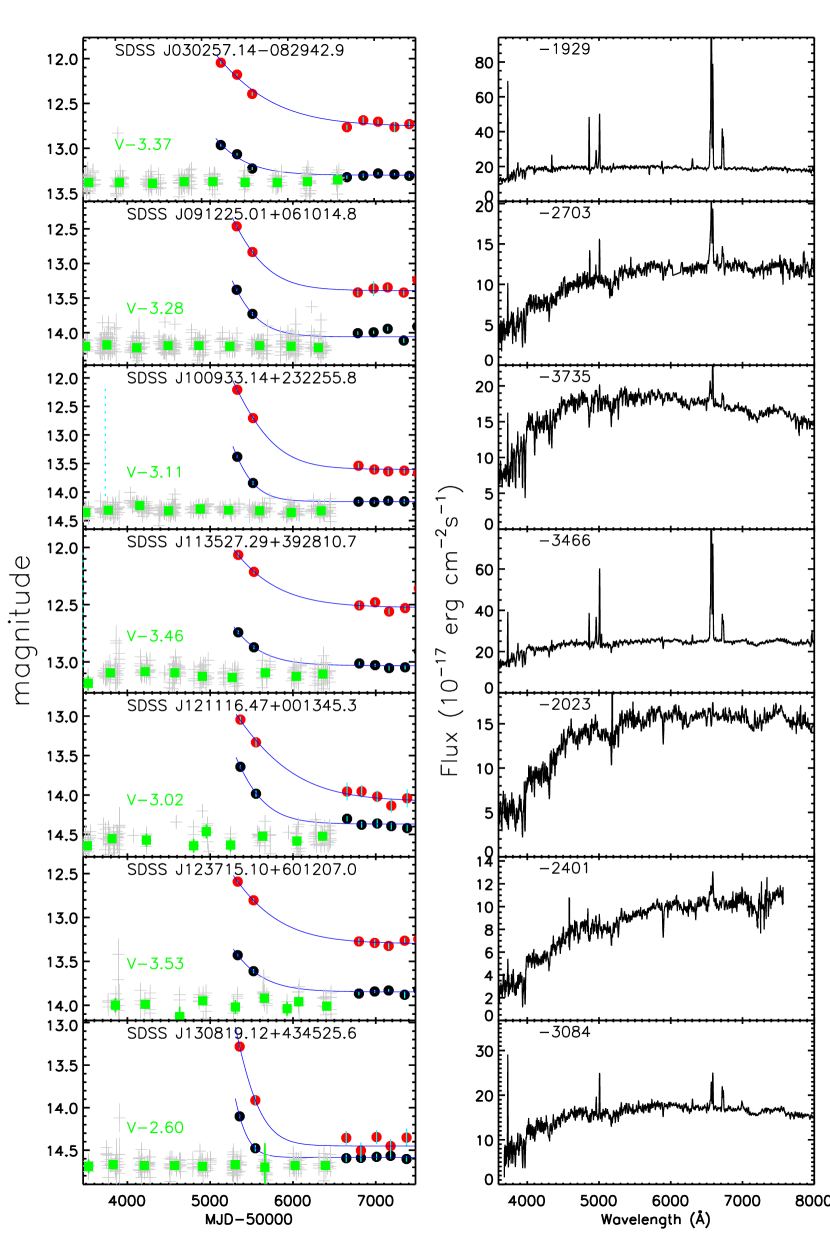
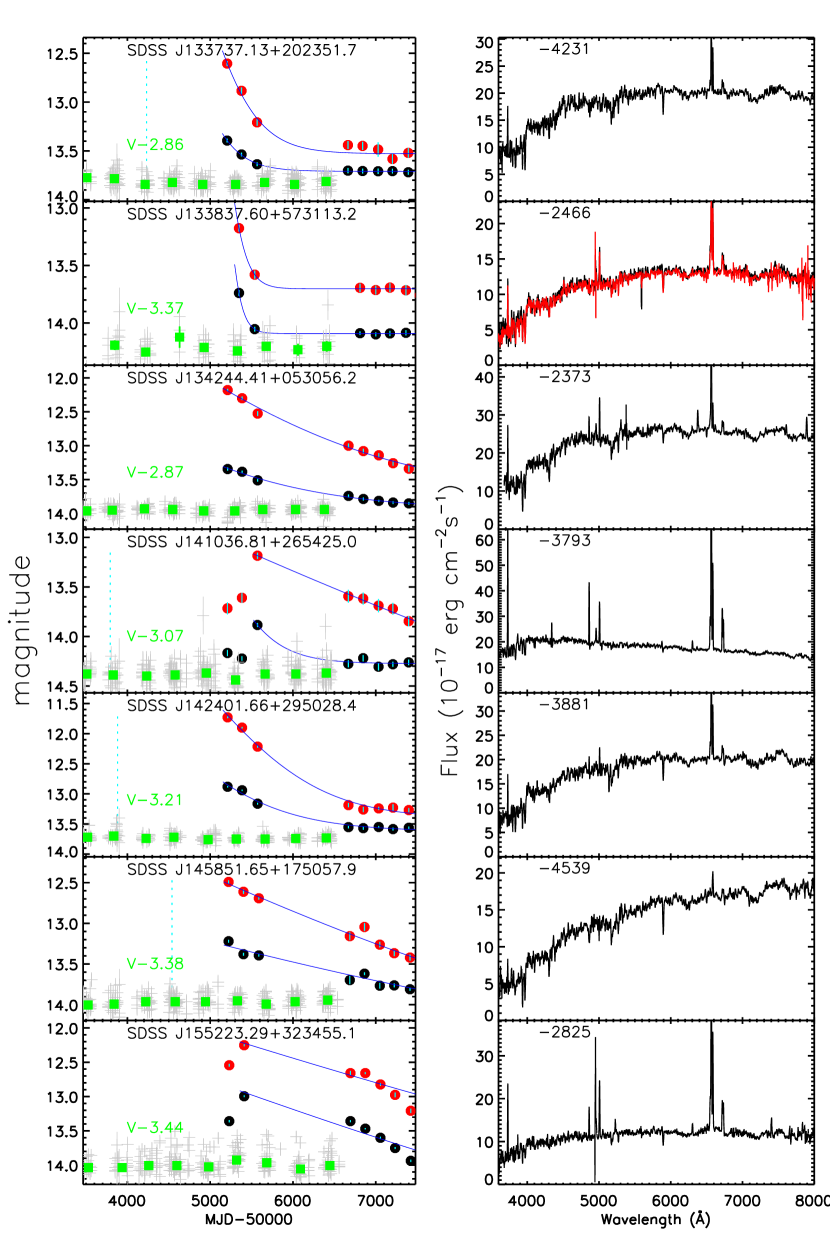
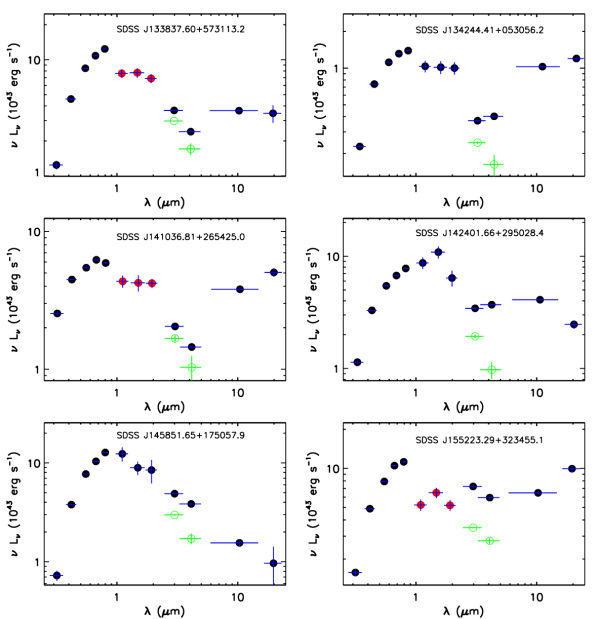
As a final check, we examine the infrared colour in the lowest flux level to further screen potential obscured AGNs. According to Assef et al. (2010), can select pure AGNs very effectively. Thus, we reject additional 5 sources with . The final sample consists of 14 objects. Many galaxies locate on the starburst and LINER regime with W1-W20.5. The basic properties of these galaxies are summarized in Table 1. Figure 5 shows the light curves and SDSS spectra of all these sources. The sample covers the redshift range from 0.0365 to 0.2164.
It is intriguing that in the sample, only two sources show also the uprising phase. This suggests that the light curve must be very asymmetry, with a steep rise and a slow decay, so one has a higher chance of detection the falling part of the light curve than the rising part in the ALLWISE data if flare lasts longer than the period of WISE survey. The light-curve of these two sources seem to confirm that the rising time is much shorter than the decline time although we cannot give specific value due to poor sampling. The selection of WISE highly variable sources in the first two year survey may bias towards the sources in the rising phase because sources in the rising phase usually demonstrate larger variability amplitude, thus less likely be missed, than the sources on the falling part of light curve.
3 Properties of the Flares
3.1 Characterizing Infrared Flares
We fit the declining part of the MIR light curves based on an exponential law to estimate the characteristic time scales (refer as decline time in the following sections). In ASASSN-14li, the reprocessed MIR emission is detected significantly only at one epoch in 2 bands, so we cannot learn much about the form of its light-curve, except the rising time scale is about 4-6 months after the UV flare. However, the MIR LCs of TDE candidates with ECLs has continuously faded for over 5 years from 5-9 years after their optical discoveries, and their MIR LCs can be approximately described by an exponential law or a power-law (Dou et al., 2016). The purposes of the light curve fitting are not only to measure the characteristic time scales of MIR variabilities, but also to determine the quiescent MIR emissions from the host galaxies when there are no pre-flare MIR photometries of the host galaxies. The exponential model gives a good fit to LCs for all objects except for SDSS J155223.29+323455.1, for which the highest observed flux data point may be still on the rising part of LCs due to the large gap between ALLWISE and NEOWISE-R.
The decline time varies from 0.2 to 9 years with a median of 0.75 years, and the peak MIR luminosities of the flare after subtracting the host galaxy333We will always refer the flare luminosity to the the host galaxy subtracted MIR luminosity. are in the range of to erg s-1 with 85% sources between and erg s-1. Moreover, the decay time does not significantly correlate with the peak luminosity (Figure 5). With the Spearman rank correlation coefficient of for 14 points, the chance probability is 10%. The Logarithmic integrated energy in MIR for black body model during the observed falling part of LCs are in the range of 49.2 to 52.4 with a median of 50.6 (ergs). They are only lower limits to the total energy of flares.
3.2 Constraints on UV luminosity
In the dust emission scenario, one can estimate the primary UV luminosity by considering that fact that dust grain is essential a bolometer at thermal equilibrium. For an isotropic UV emission source of luminosity , the equilibrium can be written as (e.g., Laor & Draine 1993)
| (4) |
where is the average dust absorption coefficient for re-radiation light; is the average absorption coefficient for the UV source. is a function of dust temperature while depends on the shape of UV continuum source. Noting that both coefficients are a function of grain size and composition. In the case of TDE, the observed SED in optical to UV can be well fitted by a black body model with temperature around a few K (Gezari et al., 2009; Holoien et al., 2016a, b; Brown et al., 2017). In the following, we will assume that the primary UV source is a black-body of temperature of K, and and are taken from Laor & Draine (1993). A low will significantly increase for small grains, but it changes little if grain size is larger 0.1 micron.
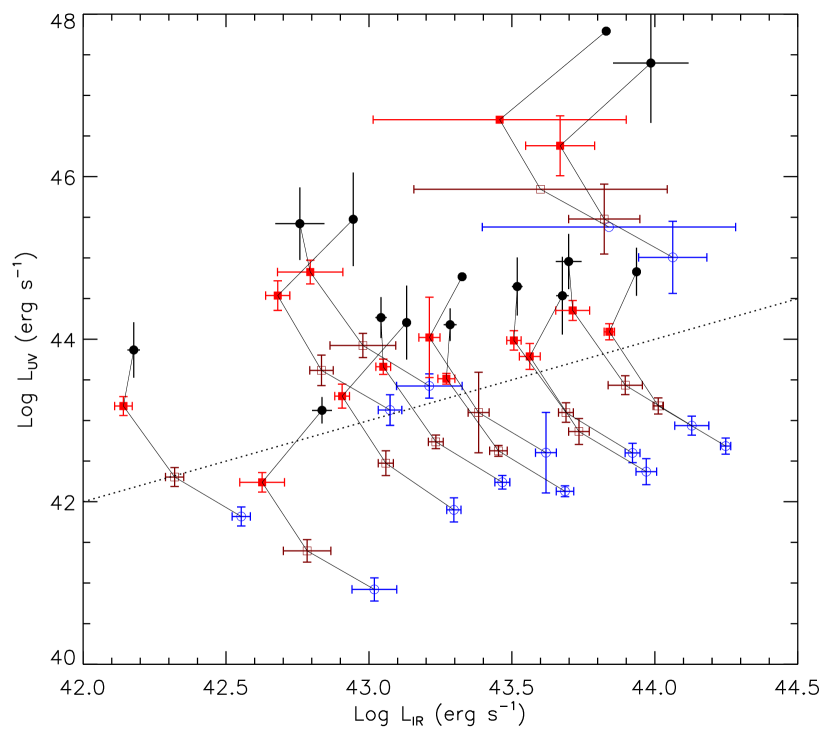
Once the distance to primary continuum () is known, one can estimate the bolometric luminosity of the primary source. Due to extra-light traveling time, the IR flare lags the continuum one by order of light crossing time of dust emission region and also is broadened by a similar amount time although the exact value depends on the geometry of the dust distribution. As we will see in the next subsection, no optical flare is detected in the light curve of these sources so we cannot estimate the lag. However, with the MIR light curve, it is possible to get the width of flare approximately by the time scale of decaying from the peak. These luminosities are in the range from to erg s-1depending on the dust composition and grain size 4. It should be note that the UV luminosity is smaller than the infrared luminosity for silicate grains of size less than 0.1 micron, thus these models are essentially ruled out.
3.3 Temperature and Mass of Dust
We estimate the dust temperature and mass using the galaxy-light subtracted mid-infrared fluxes in and . The galaxy light is estimated in the last section based on the light curve fitting. Since we do not know either the dust composition or the size distribution, we calculate the temperature and mass of warm dust at the maximum observed flux for black-body model and silicate grains of sizes 0.01, 0.1 and 1 m. Future infrared spectra will allow better constraints on the dust properties and dust masses. It should be noted that the mass of warm dust also evolves with time, and it is not necessarily to be the largest at the peak of IR luminosity. The reason for using the peak MIR photometries and colours is to minimize the photometric errors which tend to be bigger at later times.
We fit both black-body () and thermal dust models ( to the galaxy background subtracted . We adopt with a in the wavelength range 1-10 m for silicate of sizes 0.01, 0.1 and 1.0 m, respectively (Drain & Lee 1984). The derived dust temperatures are lower than the sublimation temperature for silicate (900-1200K) or graphite (1500-1900K, e.g., Lebreton et al. 2013). Since one may expect that dust at the sublimation radius responses first to the UV flare and emits most of IR light, the lower dust temperature suggests that the optical depth / the covering factor of dust there is smaller than those at larger radii or WISE missed the luminosity peak. The former case implies a cavity of dust around the black hole. Since there is a low-density pc-scale cavity inside the central nuclear disk in the Galactic centre (e.g., Etxaluze et al. 2011), it should not be surprised if similar cavities present in other quiescent galaxies. On the other hand, the inner edge of dust torus in Seyfert galaxies is usually found around the sublimation radius (e.g., Kishimoto et al. 2007). The dust mass is obtained from the infrared luminosity in band
| (5) |
We adopt g cm-3 for silicate grains. The final results are shown in Table 2. The mass of warm dust is in the range of 0.03-3 , which is similar to the TDE candidates with ECLs (Dou et al., 2016). This amount of dust is one order of magnitude less than that within 1 parsec central cavity of the Galactic centre, and 2 orders of magnitude smaller than in the inner central nuclear disc (Etxaluze et al., 2011). On the other hand, if dust is embedded in individual gas clumps, which is optically thick to UV and optical radiation, then only grains at the skin are heated. Furthermore, only part of dust is heated at a specific time if MIR is caused by dust echo of a short UV flare. The total amount of dust would be considerably under-estimated using our method.
3.4 Searching for Optical Flares
For objects in the list, we extract the light-curves from the second public data release (CSDR2) from Catalina Real-time Transient Survey (CRTS, Drake et al. (2009) ). The light-curves cover the period between April/2005 and October/2013. We calculate a quarter median magnitudes for the light curve to increase the signal to noise ratio for each data point. Unfortunately, we do not find any significant variations in the optical light curve. The standard deviations of these quarter medians is from 0.01 to 0.06 magnitude, which are consistent with measurement errors. We can set an upper limit on the peak of optical flare during CRTS period using the 3 standard deviations in these quarter medians. We found that these upper limits () are 0.2 to 1.2 dex smaller than the black body infrared luminosity in Table 2.
There are several possibilities for the lack of optical flare in the CRTS light curves:
-
1.
Stellar light outshines the optical flare in the low spatial resolution optical image. One important question is that the non-detection is expected or not if MIR flares are due to TDE echoes. In SDSS J0952+2143, Palaversa et al. (2016) estimated the absolute peak magnitude of the flare in band is no fainter than mag in SDSS J0952+2143, while Wang et al. (2011) assessed a lower limit to optical magnitude of flare in SDSS J0748+4712. These converts into an MIR to optical luminosity ratio -0.1 and -0.8 dex, which seems in tension with above upper limits, considering that fact none has been detected. Similarly, Jiang et al (2017) found that the peak MIR luminosity is a factor of ten smaller than the peak optical luminosity in PS16dtm. Only in the TDE candidate in ULIRG F01004-2237, the peak luminosity of flare in MIR is about 0.8 dex higher than in optical, which is believed to be partly obscured (Dou et al. 2017).
-
2.
Optical flares occurred before CRTS started, i.e., before 2005. Noting this is conceivable considering that in ECLE SDSS J0748+4712 and J0952+2143, optical flares taken placed in 2004 (Wang et al., 2011; Palaversa et al., 2016), at the same time WISE detected the infrared echo (Dou et al., 2016). If this is true, the size of infrared region is much larger than we estimated using the decline time scale, so does the estimate UV luminosity in §3.2. In two objects, we saw a fast rising phase in less than a year, that would be very difficult to be explained in this scenario as it requires a special geometry of dust distribution. Much dust distributes over a large range of the outside of a paraboloid with a time delay of order a few years, but little inside.
-
3.
Optical flares are obscured by dust in the galactic nuclei. Considering presence of warm dust emission, it is plausible that dust may block the line of sight in some objects. From statistics point of view, one must see optical flares in some sources if dust covering factor is not close to unity.
-
4.
Optical flares may be considerably weaker than in ECLEs because of large black hole masses. It is interesting to note that the black hole mass distribution of our sample is significantly different from the optical selected TDE. In optical selected TDEs, the optical emission is thought to be produced through reprocessing at large radius (Strubbe & Quataert, 2009; Piran et al., 2015; Stone & Metzger, 2016), e.g., thick super-Eddington disk wind. For some reasons, if such a reprocessor is absent for large black hole masses due to reduced Eddington ratio, optical emission should be weaker in these objects in comparison with their UV luminosities.
-
5.
Lastly, IR emission is caused by non-thermal process, instead of reprocessed dust emission, which is peaked in IR. Although we limited our sample to radio weak sources in quiescent state, there is no simultaneous radio observation that can limit non-thermal emission during the flare. Certainly, future observations can constrain this.
4 The Host Galaxy Properties
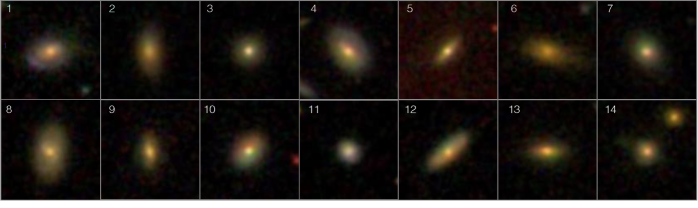
The SDSS images of these galaxies are displayed on the Figure 6. They are resolved with a Petrosian radius . According to the automatic morphology classification by Kuminski & Shamir (2016), which agrees with Galaxy Zoo debiased ”superclean” data-set at 98% probability, 7 galaxies are more likely elliptical (); 4 are spirals, and 3 are ambiguous (either probability is less than 0.7), and remained one is not included in their catalogues. So, ellipticals outnumber spirals. On the other hand, galaxies can be classified as disc-like or elliptical-like based on the probability of the fits to the 1-D profile by either exponential law or de Vaucouleurs law and on the concentration index (e.g.,Bernardi et al. 2003). Using the probability derived with SDSS pipeline, exponential model is preferred over the de Vaucouleurs-law for 3 galaxies in both and -bands; for another only in the -band. For the remaining objects, de Vaucouleurs-law gives a much better fit than the exponential law in both and bands. On the other hand, 5 galaxies do not meet the requirement of for an early type galaxy. Among them, 3 objects can be better fitted by an exponential law. Thus, we conclude that more than half of the sample are early-type galaxies, dominated by spheroid components. In the later analysis, we define 7 galaxies that satisfy all above criteria as early-type galaxies.
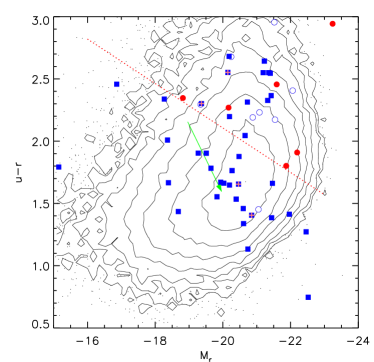
Colour magnitude diagram (CMD) has been used to demonstrate the bimodal distribution of galaxies, which has significant implication for the galaxy evolution (Bell et al., 2004). On CMD, galaxies are clustered into red sequence or blue cloud, and a few galaxies scattered in the green valley in between. Figure 7 shows our galaxies on the CMD with low redshift () SDSS galaxies in the legacy survey in contours. We have applied k-correction (v3_2) using the code given by Blanton et al. (2003), so both colour and magnitude are referred to the frame at . We do not make correction, thus the density of low luminosity galaxies is under-estimated by a large fraction, as a result bimodality is much less obvious. We over-plot our galaxies on the same figure, and most our galaxies are located on the red sequence of the massive galaxies. It is interesting to mention that all non-early-type galaxies except one also show red colours. This is consistent with the spheroid-dominated galaxy morphology. The high luminosity of hosts indicates that these galaxies possess large SMBHs.
Simard et al. (2011) de-composed the 1-D profiles of 660,000 SDSS galaxies into disc and bulge components in and -bands. Mendel et al. (2014) extended the work to the rest SDSS-bands, and calculated the total, bulge and disc stellar masses. All galaxies in our sample are included in Simard et al. (2011), and bulge masses are available for all galaxies but SDSS J095858.5+021459 in Mendel et al. (2014). The total stellar masses of these galaxies are in the range , and the bulge mass consists of 30% to 100% total stellar mass of the galaxy. In the sample, the Sérsic index of the bulge () is less than 2 for two galaxies (100933.14+232255.8;123715.10+601207.0), between 2 and 3 for another galaxy, and greater than 3 for the remaining 12 galaxies. According to Fisher & Drory (2008), bulges with are most likely pseudo-bulges, and those with are classical bulges. Therefore, most of these galaxies have classical rather pseudo-bulges.
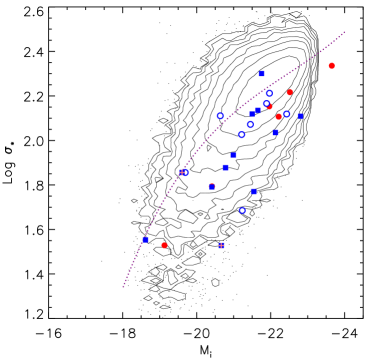
As a further check, we plot the stellar velocity dispersion versus the absolute magnitude in band (known as Faber-Jackson relation) in Figure 7. For comparison, we show the distribution of low redshift (), early type galaxies (Bernardi et al., 2003) in SDSS legacy sample as contours on the sample plot. The stellar velocity dispersions () are retrieved from the Portmouth emission line database (Maraston et al., 2013; Thomas et al., 2013) in the SDSS archive. First, it should be pointed out that three galaxies in this sample has km s-1, i.e., smaller than the spectral resolution of the SDSS. Their may be not reliable, and one may take seriously its exact value, but rather treat them as km s-1. This does not affect our main results. Second, these may not represent the of the bulge for disc galaxies because the light within 3 arcsecs of SDSS fibre aperture may include significant contribution of the disc component. The effects depend on the angular size of the bulge and disc, the inclination of the disc, etc. Thus, there is no simple way to correct them. Nevertheless, considering the fact that the bulge component accounts for a substantial fraction of total light even for the object with the least bulge to disc ratio, and dominate in more than half of the objects. Thus, we will use them as an approximation for the . For early type galaxies, there is an additional effect that is usually defined as being measured with either or . However, considering the weak dependence on on aperture size when is small (e.g., Falcón-Barroso et al. 2017), the aperture corrections have only small effect on the Faber-Jackson relation considering its relative large intrinsic scatter. In comparison with SDSS early-type galaxies, 7 early-type galaxies in this sample appear to have smaller stellar velocity dispersions at a given optical magnitude. The offsets in Faber-Jackson relation is in line with the offsets in the BH masses derived using above two methods.
The deviation from the Faber-Jackson relation can be due to either an excess of galaxy luminosity or a deficiency in stellar velocity dispersions. In the first case, objects with too high luminosity may be due to younger stellar population or low metallicity. To check this, we plot the vs , and compare it to the low-redshift () early-type galaxies in Figure 7. Apparently, early-type galaxies in our sample have similar colours as others, suggesting that stellar age or metallicity is not the main cause for such deviation. The over-luminosity may also be caused by many dry minor-mergers during the accumulation of extended stellar envelope, while the compact core remains almost unshaped (Huang et al., 2013). As accreted small galaxies are usually bluer and have a lower metallicity, the add-on stellar component is expected to be bluer (Huang et al., 2016), which does not agree with above analysis. Thus, this seems also not likely the main reason.
Alternatively, the stellar velocity is under-estimated for the mass, probably caused by different evolution track. Smaller stellar velocity dispersions suggest that these systems have relatively higher energy than average early type galaxies according to virial theory. Simulations showed that during dry-merging of two galaxies, the orbit energy of the system transforms into the internal energy, leading to a puffed-up remnant, especially on nearly radial orbits (Boylan-Kolchin, Ma, & Quataert, 2006). During this process, the colour of galaxy should not be affected, in accordance with the above analysis.
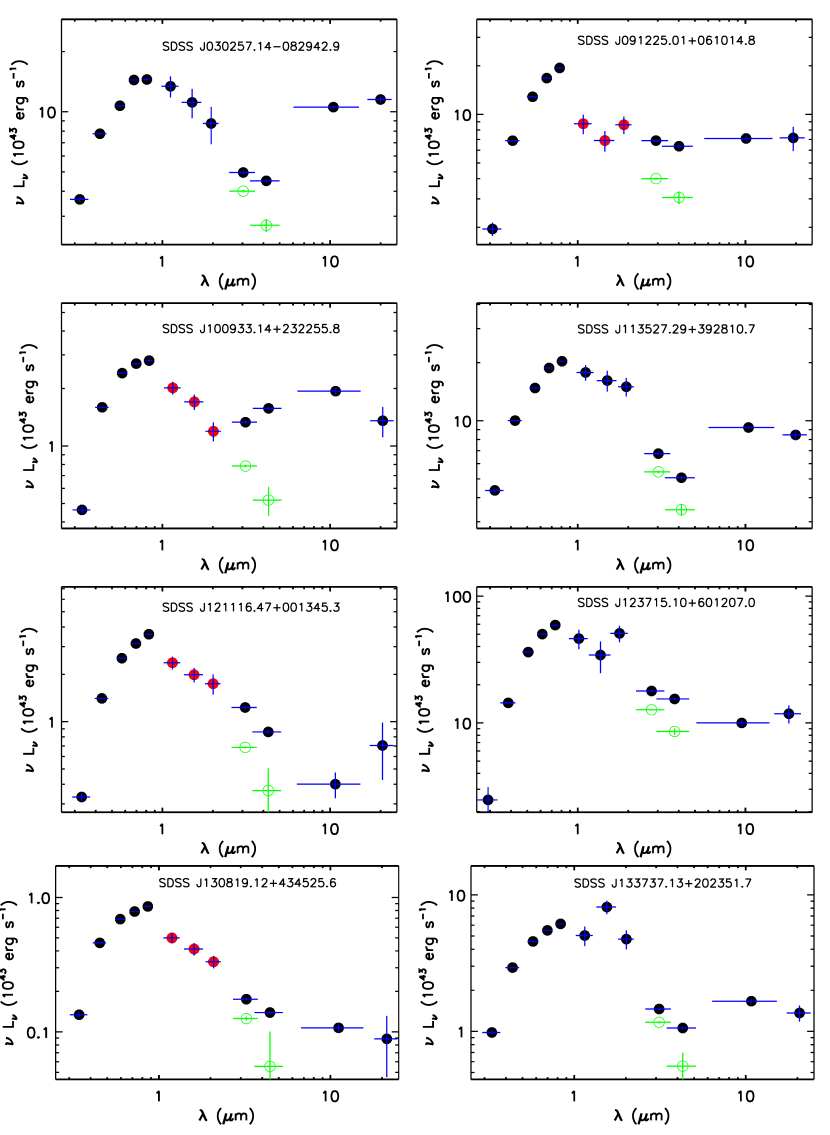
We show the spectral energy distributions (SEDs) of these galaxies in Figure 9. The SED is peaked 0.7- 2 m and then decreases steeply to the 4-5 m in the low state, in particularly, suggesting the dominant old stellar populations. About 2/3 display another peak in 10-20 m or longer, implying a moderate star-formation in these galaxies.
5 Estimate of Black Hole Masses
It is well established that masses of SMBHs () are tightly correlated with the stellar velocity dispersions (), the masses () and the K-band luminosities () of the classical galaxy bulges (see Kormendy & Ho 2013 for a review, hereafter KH13). However, it is still controversial whether black hole mass is more tightly correlated with or equally well with and (Graham 2016 for review), or whether different type of galaxies (e.g., core or power-law galaxies) follows the same correlations (e.g., McConnell & Ma 2013, MM13 hereafter; also KH13 and reference therein). In either KH13 and MM13, the bulge mass is calibrated using a mixture of stellar and dynamic mass, which is not available for our objects. So we will use relation as the base black hole mass estimate.
In the following, we will adopt relation in MM13. The slope in MM13 () is steeper than those in KH13 (), and the two relations agree at km s-1. For the infrared flare sample in this paper, the black hole derived using MM13 is 0.8 dex smaller than those using KH13 for the smallest , while the difference is less than 0.5 dex for majority. We use MM13 because it is more consistent with recent work of van den Bosch (2016). With this method, the BH masses are in the range from below to with a median of . It should be noted that black hole masses less than are not reliable because their is below the SDSS spectral resolution, so they can be taken as upper limits of .
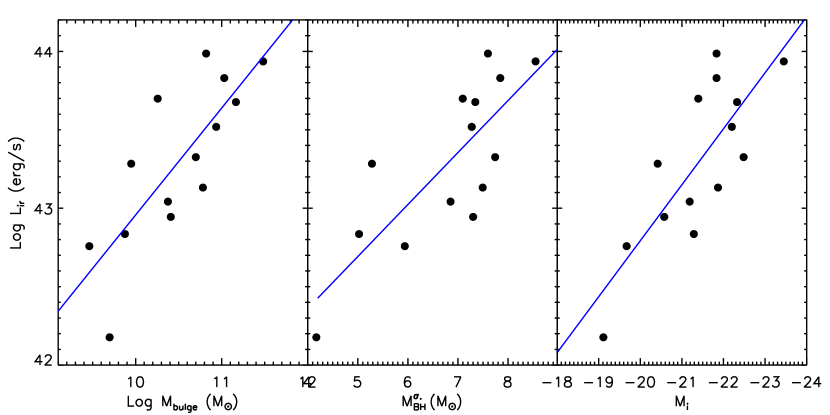
We find that the observed maximum luminosity of infrared bursts is fairly well correlated with the black hole mass from (Figure 7). A Spearman rank correlation analysis gives a correlation coefficient , corresponding to a null probability of . A linear fit yields the following relation . The flat slope means that MIR Eddington ratio decreases with black hole masses. The MIR luminosity is also correlated with the stellar mass of galactic bulge ( and ) and the absolute optical magnitude of the galaxy at band ( and , Figure 7).
6 Estimate of Event Rate
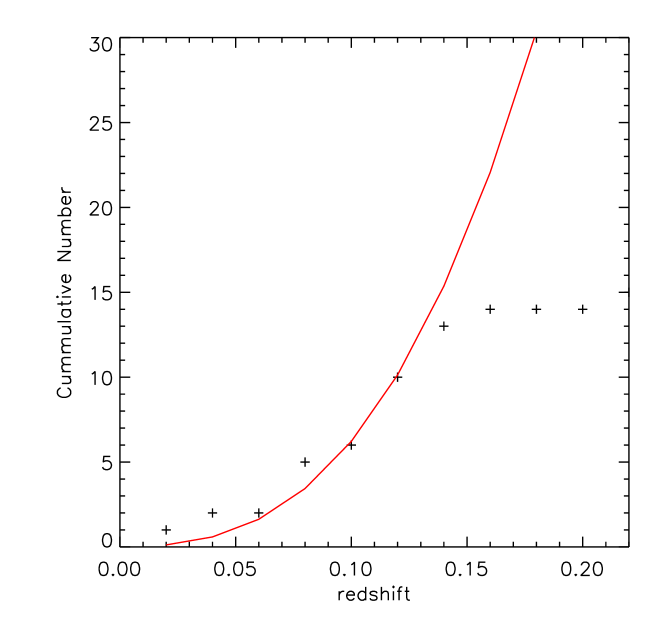
The accumulative number increases with redshift roughly proportional to the comoving volume within the SDSS footprint up to redshift , then flattens (Figure LABEL:redshift) suggesting that the sample becomes seriously under-representative beyond that redshift assuming that there is no abrupt evolution in the event rate. So in the following, we will only consider the subsample of 10 objects at redshift . This gives a density of about Mpc-3. However, as we have already mentioned, requiring selected only one of 4 TDE candidates with ECLs, which all showed long term declined light curves with mag in the ALLWISE data. So, the density is likely a factor 4 higher.
To obtain the rate, we need to know the average time-scale that the flare can be picked up with our criteria. This relies on our understanding of various selection effects imposed by our criteria, the WISE sensitivity and observation cadence etc, as well as the parameters of light curves, such as the statistical distribution of the peak luminosity and decay-time scales. Because these properties are unknown, here we will only give an order of magnitude estimate. By noting that all objects in our sample display a mag during the 3-years ALLWISE period, we take the duration of the light-curve that W1 or W2 magnitude changes at least 0.2 mag within 3 years as the appropriate time scale. For most objects, we only observed the declining part of the light curve, and thus can only give a lower limit to time scale. The average value is about 3 years. Putting these together, we attain an event rate of order Mpc-3 yr-1.
However, we showed in last section that the event does not take place at the same probability for each galaxy. Rather, host galaxies mostly are red and luminous. Guiding by eyes, we draw a straight line on the CMD-diagram (Figure 7). All but one locate on the upper right of the line. Now we count all spectroscopic galaxies on the same regime of CMD-diagram in the SDSS DR-12 spectroscopic catalogue in the redshift . The number of galaxies turns out to be 62710. Taking into account the duration of the light curve that can be detected and the fraction of sources missed due to variability selection criterion discussed above, we estimate the rate of event around gal-1 yr-1 for red-luminous galaxies defined in the Figure. We will leave a more thoroughly statistical study of the event rate to a later work using a sample of galaxies without such restrictions.
7 Discussion
We have identified 14 normal galaxies which display flare-like mid-infrared light curves by combining the SDSS spectroscopic data and the WISE multi-epoch photometries. By selection, these sources are required to have normal galaxy optical spectra, with either star forming emission lines, early type absorption features or LINER. Because W1 and W2 show the same trend, they are not spurious. Mid-infrared variabilities could have different physical sources, such as supernova explosion, or fluctuation of accretion disc in an obscured Seyfert galaxy, or sporadic accretion onto a supermassive black hole due to instability in an accretion disc or a tidal disruption of a star. We will discuss these possibilities in detail. Any likely scenario should be able to explain the following observations: (1) lack of Seyfert-like narrow line spectrum; (2) much higher probability of finding flare-like light-curves among MIR variable non-Seyfert galaxies than among MIR variable Seyfert galaxies; (3) the maximum infrared luminosity in the range of erg s-1and the integrated MIR flare energy in the range of ergs; (4) typical decay time is a year, and rising time is an order of magnitude shorter; (5) host galaxies are mostly red and luminous, and black hole masses distribute in a rather broad range with more than half in the range of to and one larger than ; (6) the maximum infrared luminosity is correlated with the black hole mass or the stellar mass of galactic bulge, and typical MIR Eddington ratio is between to ; (7) there had been no detectable optical flare in the CRST data from 5 years before the appearance of infrared flare, with the limits on the luminosities of optical flares to 0.2 to 1.2 dex smaller than of these MIR flares. If the infrared light comes from thermal emission of dust heated by UV light from an accretion disc around black holes and assuming a dust covering factor of 0.1, about 0.002-1.4 gas had been accreted during the burst assuming a typical radiation efficiency of 0.1.
7.1 Non-Thermal Flares from Low Power Blazars
Could it be possible that the infrared flares are associated with blazar-like activities that below the radio detection limit in quiescent state? In the case of non-thermal emission, it is more proper to use the spectral index rather than black-body temperature to characterize the spectrum. The flux ratios of W1 to W2 bands during the peak give power-law indices () in the range of 0 to 3.2, with a median of 1.8, which are within the range of blazars (Giommi & Padovani, 1994). 9 of 14 sources have , they should be low synchrotron-peaked ones if they are blazars. As we discussed in §3.4, an analysis of CRTS light curves set upper limits on the luminosity of optical flares to be 0.2 to 1.2dex lower than these of MIR flares. This is consistent with SEDs of low- to intermediate-synchrotron-peaked blazars, but is inconsistent with those high peak blazars unless the optical light is heavily extincted by dust (Rani et al., 2011). However, there are several problems for blazar-like non-thermal activity. First, radio weak blazars are usually high synchrotron-peaked blazars rather than low synchrotron-peaked ones (Giommi & Padovani, 1994; Mao et al., 2016). Second, variability flag selected blazars show much lower chance (9.2% versus 61%) of flare-like MIR light curves than the non-Seyfert galaxy sample. Thus, we consider that blazar-like activity is less likely.
7.2 Infrared Luminous Supernova
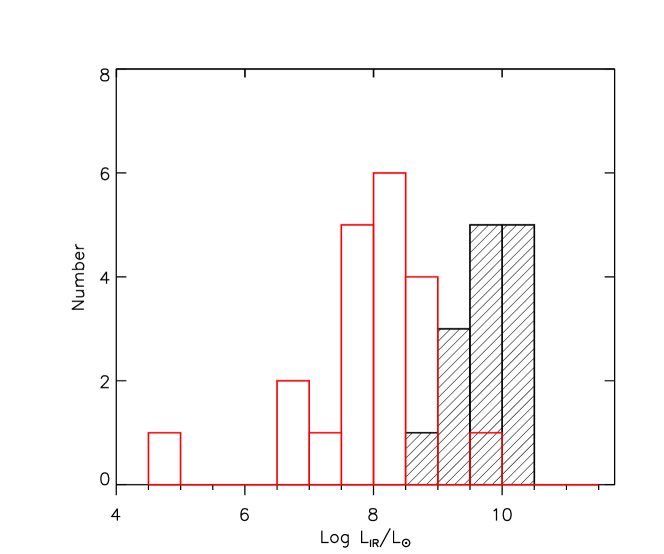
Infrared emission has been detected in about 20% nearby sample of supernovae (SNe) at a few months to several years after the explosion using Spitzer IRAC (Fox et al., 2011, 2013; Tinyanont et al., 2016). The peak infrared luminosity lies in the range of to , depending on the type of SNe. Type Ia SNe usually shows very weak mid-infrared emission and is not detectable three years after the explosion(Tinyanont et al., 2016). type IIn SNe are more luminous, and the infrared emission may last up to ten years due to the heating of pre-existing dust by radiative shock between the expanding SN shell and the dense wind of the progenitor (Fox et al., 2013). We have cross-correlated with the SN catalogue (Guillochon, Parrent, & Margutti, 2016), and does not find any matches within 10 arcsecs matching radius. This appears not surprising as it is difficult to find SNe in galactic nuclei.
Although the light curves of our objects look similar to those of SNe, SN scenario falls in two aspects. First, the peak MIR luminosities are much higher than those of SNe (Figure 6). Among 14 objects, all but one have MIR luminosities greater than , while among 22 type IIn SN detected by Spitzer and WISE, only one is above (Fox et al. 2013). It is even remarkable considering the fact that most of our galaxies have red colours, so current star-formation rates are low, thus most SNe in these galaxies should be type Ia. The long lasting time of infrared burst for more than five years is not compatible with known type Ia supernova. Second, it is very difficult to understand the strong correlation between the peak luminosity and the mass of SMBH in the centre of the host galaxy in the scenario of supernova.
7.3 Fully Obscured Seyfert Galaxies
Is it possible that those 14 galaxies in our sample are heavily obscured Seyfert galaxies? In this scenario, the observed MIR LCs could be naively due to AGN activities in Seyfert galaxies. However, this scenario cannot explain two facts. First, there are no optical signatures suggesting existence of Seyfert nuclei, AGN-like narrow line spectra. Second, the MIR LC morphology and the time scales observed among our sources are quite different from stochastic behaviours of AGN LCs. Finally, we have rejected objects with infrared colours of typical Seyfert galaxies.
Lack of optical spectroscopic signatures of Seyfert galaxies can be caused by galactic scale obscuration. In the classic picture of type-2 AGN, the broad line and continuum regions are obscured by dust tori, while the extended narrow line regions, so called ionization cone, are less obscured and more visible. However, if there is a large-scale dust lane in the galaxy, the narrow line region may be also obscured, thus optical AGN signatures based on narrow line ratios could become less clear due to dust extinction. With less dust obscuration in the mid-IR, we may still be able to see mid-infrared emission from inner regions. Mid-infrared variability thus is expected. We believe that WISE variable normal galaxies with significantly fluctuating light curves are buried Seyfert galaxies. As we have already showed that about 15% type 1 AGNs display flare-like light-curves, there should be no surprising that some of our objects are also obscured Seyfert galaxies. Assuming the obscured and non-obscured Seyfert galaxies has the same probability of showing flare-like light curve, we would expect 2-3 fully obscured AGNs among of our sample. They would show strong mid-IR excess, a type-1 AGN feature in the infrared, and probably some of them have already been removed using the WISE colour ().
7.4 Outburst of Low Accretion Rate AGNs
In this scenario, the central black hole is episodically fed at a high accretion rate for a relatively short time scale probably caused by instability in the accretion flow and then return to the quiescent level. In this case, the narrow line region may be too small to have significant emission in [O iii] 444Yang et al. (2013) detect brightening of [O iii] in the TDE candidates with ECLs to make a Seyfert-like spectrum. However, low level activity in the quiescent state may also explain their very common LINER spectra. Regardless of the physical process responsible for such episodic fuelling, the rising and decay time must be shorter than the viscous time scale of the disc at the radii causing dramatic change of the accretion rate. For geometrically thin accretion disc, the viscous time scale can be written as (Czerny, 2006)
| (6) |
where is dimensional viscosity coefficient, the disc height, and . In the radiation dominated inner disc, . Thus, the short observed rising and decay time (years) suggests that the perturbation must occur at a small radii (order of for a few solar mass black hole and Eddington ratio of 0.1). Yet the duty cycle of the event must be very low in order not to produce Seyfert-like narrow emission lines. From the rate estimated in last section, such event occurred once in yr in luminous red galaxies, consistent with this requirement.
In black hole X-ray Nova, the X-ray flux rises in several days by a factor of several hundreds and last for several tens to hundred days before declining to the pre-burst level (Tanaka & Shibazak 1996 for a review). It is general accepted that the thermal instability due to hydrogen ionization in the thin accretion disc is thought to trigger a transition from a cold, low accretion-rate branch to a warm, high accretion-rate mode (See Lasota 2001 for a review). The mechanism operates when the steady income accretion rate is lower than that is required to sustain a steady high accretion mode. When scaling to the black hole mass here, the rising time (thermal time scale at a fixed disc temperature ) would be one to a few years for black hole mass of to if the dimensionless quiescent accretion rate is similar to those in X-ray Nova (Lin & Shields, 1986). If the quiescent accretion rate is as low as , the ionization instability radius may extend to 13 for a black hole (Janiuk & Czerny, 2011). As we estimated at the begin of this section, the total mass accreted during the outburst is order of one solar mass from observation. This is in coincidence with the disc mass in a wide annulus of at the critical accretion rate (See Figure 1a of Lin & Shields (1986) for the disc column density). However, their model predicts only a moderate increase in the accretion rate with a duration of the burst (tens to hundred years) much longer than observed. In addition, it is also questionable whether the accretion flow can keep geometrically thin down to such small radius at such low accretion rate (Yuan & Narayan, 2014). Despite all of theoretical uncertainties, observations show that some quasars and Seyfert galaxies turn on/off on time scales of years (Gezari et al., 2016), suggesting that such episodic accretion does occur on time scales of years in AGNs, but the observed frequency of these events is low.
7.5 Echoes of Tidal Disruption Flares
Giving the recent detection of the reprocessed TDE infrared emission (Jiang et al., 2016; van Velzen et al., 2016), it is likely that some or most of the MIR long fading galaxies are of the same nature. The observed MIR luminosity is about a few times erg s-1 for ASSASN-14li (Jiang et al., 2016) and a few erg s-1 for the TDE candidates with ECLs (Dou et al., 2016). The observed peaked infrared luminosities of our objects are in the range of erg s-1 with a median of erg s-1 using the black-body fit to W1 and W2 bands, which is similar to the TDE candidates with ECLs.
As already noticed in van Velzen et al. (2016), about 60% bright TDEs were detected in reprocessed infrared emission by WISE. Had not ASSASN-14li been so close, it would not have been detected by WISE (Jiang et al., 2016). On the other hand, in gas rich environment, such as ECLEs, typical MIR luminosity is a few erg s-1 and the detection rate of 100%. The high luminosity of these sources suggests that they reside in more gas-rich environment although we have the optical light-curve of only one source in the interesting time range (from SDSS spectroscopic observation to the WISE observations). Palaversa et al. (2016) found that the ECLE SDSS J0952+2143 is a factor of two brighter in luminosity than PS1-10jh, led them speculating that it could be a more energetic event. This may also account partly the high infrared luminosity.
However, we notice several differences in properties of host galaxies our objects and those of TDE candidates with ECLs or known TDE candidates. We collect the optical magnitudes of host galaxies for known TDEs or TDE candidates, and shown them also on the CMD. It is apparent that our sample has a distinct distribution than known TDEs or subsample of TDE candidates with ECLs. The host galaxies of our sources are more luminous and redder than the hosts of known TDEs (see Figure 7), while TDE candidates with ECLs are similar to the other known TDEs. For example, 7 of 14 galaxies in our sample are brighter than mag, while only 3 of 39 known TDEs/TDE candidates do. Furthermore, those three galaxies in latter group all show blue colours (), but 7 luminous galaxies in our sample all possess red colours (). The red colour is unlikely due to the dust reddening to the stellar light but rather attributed to the old stellar populations because the reddest galaxies in the sample shows prominent 4000Å break. In line with this, these galaxies do not offset from the CMD of other SDSS galaxies.
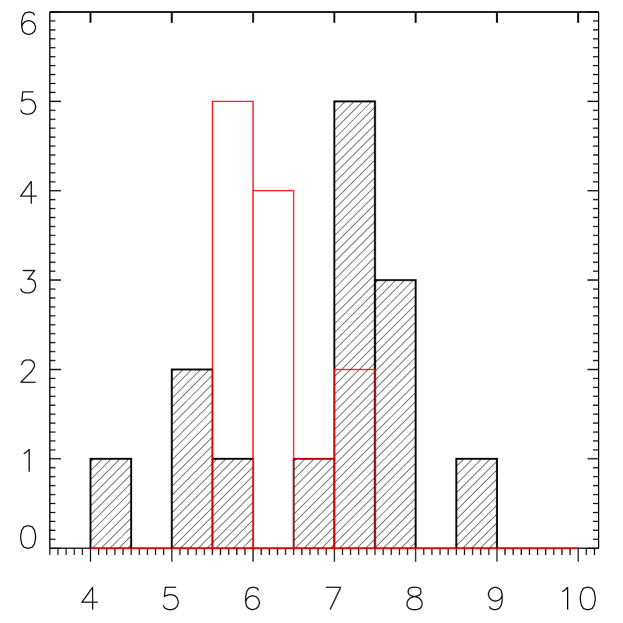
The red colour and high luminosity suggest that these galaxies host larger SMBHs than known TDEs or TDE candidates. In section 4, we derived from to using . These masses are compared to a complete sample of 12 optically/UV selected TDE host galaxies measured by Wevers et al. (2017) in Figure 8. Apparently, the distribution of our sample is much more spread with much more objects in either larger or small masses. 10 of 12 objects in their sample have masses between and , while only 2 of 14 objects in our sample fall in this range and most of them are from to . Note that also one object has a black hole mass larger than , which is the upper limit for the tidal disruption of a solar-mass main-sequence star around a Schwarzschild black hole. In the TDE scenario, this can be disrupting a solar-mass main sequence star by a spinning black hole (Kesden, 2012; Leloudas et al., 2016; Margutti et al., 2017) or disruption of a post main sequence star (Kochanek, 2016). The different mass distribution from optical/UV selected TDE suggests that our sources are either not TDE or a population of yet missed TDEs. In passing, we note that some theoretical models of Kochanek (2016) predicted that the observed TDEs should be dominated by black hole masses between to although the true distribution is very uncertain.
There are several potential drawbacks for the TDE scenario. As we discussed in the last section, the small stellar velocity dispersion at a given galaxy luminosity implies a less compact structure following fundamental plane Bernardi et al. (2003), which also disfavours the tidal disruption scenario. But if the excessive luminosity is due to accumulation of outer part of disc through the accretion or minor merger as discussed in last section, then this has little effect on the structure of galactic centre, hence the rate of TDE. Second, the red colour of the host seems at odds with the conventional wisdom that there is a dearth of cold gas and dust in red galaxies, although Young et al. (2011) detected CO emission in at least 22% early type of galaxies in the volume-limited ATLAS3D sample.
On the other hand, there are some advantages for detecting infrared TDE echoes in early type galaxies. First, early type galaxies show systematically weaker mid-infrared emission than late-type galaxies. Thus it may be easy to detect infrared echoes. Second, these galaxies also host a more massive central black hole, thus a more luminous TDE is expected. For the disruption of a solar type star, the fallback rate decreases as the black hole mass increases () in the Newtonian treatment. At black hole masses less than , the rate of initial fallback exceeds the Eddington rate (Rees, 1988). Strong outflows are expected to be launched, and the radiative luminosity may be still limited by the Eddington one (Jiang, Stone, & Davis, 2014), which increases with the black hole mass. Wevers et al. (2017) found that observed peak luminosity is consistent with Eddington limit accretion for black hole mass less than 3 . At black hole mass larger than this, the disruption radius is so close to the black hole that relativistic effects must be taken into account and the mass falling rate can be doubled (Kesden, 2012), so the peak bolometric luminosity may depend on the black hole mass very weakly. If the infrared luminosity is proportional to that of bolometric luminosity, one would expect that infrared luminosity increases with the black hole mass, and then flattens.
As we have mentioned that the non-detection of any optical flare in CRTS sets a significant upper limit on the peak luminosity of the optical flare to be lower than expected for either SDSS J0952+2143 or PS16dtm with similar MIR luminosities (see §3.4). This can be interpreted as either heavily obscured TDE or weaker than usual optical-flares. Note that optical emission in known-TDEs is stronger than the disc model predicted, and is assumed to form through reprocessing of the accretion disc radiation by an optically thick gas-shell with much larger radius than the disc (e.g., Stone et al. 2016). The reprocessor can be outflows launched by the super-Eddington accretion flows (Strubbe & Quataert, 2009) or in the stream-stream collisions (Jiang, Guillochon, & Loeb, 2016). We may expect that outflows weaken as mass infalling rate of debris becomes sub-Eddington when black hole mass increases to larger than , so less hard disc radiation is reprocessed into optical light.
With all pros and cons, it is inconclusive whether they are infrared echoes of TDE. But it is clear that if these are indeed TDEs, they will represent a subset that mostly missed by the current TDE surveys.
8 Summary
We have examined 31 galaxies spectroscopically classified as star forming galaxies, LINERs or absorption line galaxies that flagged as variable in the ALLWISE catalogue. We find that 19 (61%) of them show light-curves similar to IR echoes of tidal disruption events, i.e., long term decline, and in two cases also a relatively fast rising ahead. In comparison, among Seyfert galaxies with variable MIR emission, the fraction showing such a light-curve is much lower (%). We carry out a comprehensive study of these 19 sources using WISE archival data. Among them, 5 have [W1-W2] colour 0.8, indicating them like being obscured AGNs. They were rejected from the sample. The maximum infrared luminosities after subtracting the host galaxy are in the ranges of a few time to erg s-1 with a median erg s-1, and correlate with black hole masses and the stellar mass and absolute magnitude of the host bulges. We fit the light curve with exponential law and the typical decay time is a year. We estimate warm-dust mass in the range of 10th to a few solar masses and temperatures from 600 to 1200 K at the maximum infrared flux. With typical gas to dust ratio of solar, we expect at least a few to a few hundred solar mass gas within a distance of a few parsecs. The estimated dust mass is still significantly lower than that observed in the inner parsecs of the Galactic centre. Most of the host galaxies are intrinsically red and luminous, and tend to have lower stellar velocity dispersions than galaxies with the same optical luminosity. We estimate a rate of event about gal-1 yr-1 among red luminous galaxies. We do not detect any optical flares in CRTS light curves spanning 8.5 years from 5 years before the starting of the MIR survey, with upper limits on the flare luminosity in the V-band about 0.2 to 1.2 dex smaller than the MIR luminosities.
We considered several possibilities, including infrared echoes from supernova, fully obscured Seyfert nuclei, the episodic accretion due to certain instability in a low accretion rate system, and echoes of TDEs. The strong correlation with the host galaxy luminosity suggests that it is not supernova; also the infrared luminosities are generally too high for SNe. The scenario of fully obscured (including narrow line region) Seyfert galaxies cannot explain the high fraction of flare-like light-curves among infrared variable normal galaxies. While the ionization instability of thin disc predicts much longer MIR flare even at a very low accretion rate, and the physical mechanism of accretion flow instability is still to be identified for episodic fueling for shorter time scales. The observed flare may be an analogy to the turn on/off AGNs discovered in recent years but with even shorter time scales. In this picture, common LINER spectra are expected. The strong correlation between the peak luminosity and the black hole mass suggests that the dimensionless accretion rates at the peak are similar. Although infrared luminosities and light curves are similar to that of known TDEs and TDE candidates with ECLs, their host galaxies are significantly more luminous and redder. If these events are indeed dust echoes of TDE optical flares, they must be a subset of TDEs that are mostly missed by previous surveys. Black hole mass distribution has a peak between to , significantly above that of TDEs selected in optical/UV. Non-detection of any optical flare in CRTS suggests that either optical flares are either intrinsically weaker than known TDEs with similar MIR luminosities or the nuclei are obscured.
Acknowledgments
We are grateful the referee for careful reading the manuscript and critical comments, that lead significant improvement of the presentation. We thank Dr N.C. Stone for helpful discussion. This project is supported by National Basic Research Program of China (grant No. 2015CB857005), the NSFC through NSFC-11233002, NSFC-11421303, and U1431229 and U1731104, jointly supported by Chinese Academy of Science and NSFC. This research makes use of data products from the WISE, which is a joint project of the University of California, Los Angeles and the Jet Propulsion Laboratory/California Institute of Technology, funded by the National Aeronautics and Space Administration. Funding for SDSS-III has been provided by the Alfred P. Sloan Foundation, the Participating Institutions, the National Science Foundation, and the U.S. Department of Energy Office of Science. The SDSS-III web site is http://www.sdss3.org/. SDSS-III is managed by the Astrophysical Research Consortium for the Participating Institutions of the SDSS-III Collaboration.
References
- Alam et al. (2015) Alam S., et al., 2015, ApJS, 219, 12
- Arcavi et al. (2014) Arcavi I., et al., 2014, ApJ, 793, 38
- Assef et al. (2010) Assef R. J., et al., 2010, ApJ, 713, 970
- Becker, White, & Helfand (1995) Becker R. H., White R. L., Helfand D. J., 1995, ApJ, 450, 559
- Bell et al. (2004) Bell E. F., et al., 2004, ApJ, 608, 752
- Bernardi et al. (2003) Bernardi M., et al., 2003, AJ, 125, 1817
- Blanton et al. (2003) Blanton M. R., et al., 2003, AJ, 125, 2348
- Boylan-Kolchin, Ma, & Quataert (2006) Boylan-Kolchin M., Ma C.-P., Quataert E., 2006, MNRAS, 369, 1081
- Brown et al. (2017) Brown J. S., Holoien T. W.-S., Auchettl K., Stanek K. Z., Kochanek C. S., Shappee B. J., Prieto J. L., Grupe D., 2017, MNRAS, 466, 4904
- Brown et al. (2016) Brown J. S., Shappee B. J., Holoien T. W.-S., Stanek K. Z., Kochanek C. S., Prieto J. L., 2016, MNRAS, 462, 3993
- Burtscher et al. (2013) Burtscher L., et al., 2013, A&A, 558, A149
- Cappellari & Emsellem (2004) Cappellari M., Emsellem E., 2004, PASP, 116, 138
- Cid Fernandes et al. (2011) Cid Fernandes R., Stasińska G., Mateus A., Vale Asari N., 2011, MNRAS, 413, 1687
- Condon et al. (1998) Condon J. J., Cotton W. D., Greisen E. W., Yin Q. F., Perley R. A., Taylor G. B., Broderick J. J., 1998, AJ, 115, 1693
- Czerny (2006) Czerny B., 2006, ASPC, 360, 265
- Donley et al. (2002) Donley J. L., Brandt W. N., Eracleous M., Boller T., 2002, AJ, 124, 1308
- Dou et al. (2016) Dou L., Wang T.-g., Jiang N., Yang C., Lyu J., Zhou H., 2016, ApJ, 832, 188
- Dou et al. (2017) Dou L., Wang T., Yan L., Jiang N., Yang C., Cutri R. M., Mainzer A., Peng B., 2017, ApJ, 841, L8
- Draine & Lee (1984) Draine B. T., Lee H. M., 1984, ApJ, 285, 89
- Drake et al. (2009) Drake A. J., et al., 2009, ApJ, 696, 870
- ( (1950)) Durbin, J. & Watson, G.S. 1950, Biometrika, 37 (3–4), 409
- Esquej et al. (2008) Esquej P., et al., 2008, A&A, 489, 543
- Etxaluze et al. (2011) Etxaluze M., Smith H. A., Tolls V., Stark A. A., González-Alfonso E., 2011, AJ, 142, 134
- Falcón-Barroso et al. (2017) Falcón-Barroso J., et al., 2017, A&A, 597, A48
- Ferrarese & Ford (2005) Ferrarese L., Ford H., 2005, SSRv, 116, 523
- Fisher & Drory (2008) Fisher D. B., Drory N., 2008, AJ, 136, 773
- Fox et al. (2013) Fox O. D., Filippenko A. V., Skrutskie M. F., Silverman J. M., Ganeshalingam M., Cenko S. B., Clubb K. I., 2013, AJ, 146, 2
- Fox et al. (2011) Fox O. D., et al., 2011, ApJ, 741, 7
- Gezari et al. (2012) Gezari S., et al., 2012, Natur, 485, 217
- Gezari et al. (2009) Gezari S., et al., 2009, ApJ, 698, 1367
- Gezari et al. (2015) Gezari S., Chornock R., Lawrence A., Rest A., Jones D. O., Berger E., Challis P. M., Narayan G., 2015, ApJ, 815, L5
- Gezari et al. (2016) Gezari S., et al., 2016, arXiv, arXiv:1612.04830
- Giommi & Padovani (1994) Giommi P., Padovani P., 1994, MNRAS, 268, L51
- Graham (2016) Graham, A. W., 2016, Galactic Bulges, 418, 263
- Guillochon, Parrent, & Margutti (2016) Guillochon J., Parrent J., Margutti R., 2016, arXiv, arXiv:1605.01054
- Hills (1975) Hills J. G., 1975, Natur, 254, 295
- Holoien et al. (2016a) Holoien T. W.-S., et al., 2016, MNRAS, 463, 3813
- Holoien et al. (2016b) Holoien T. W.-S., et al., 2016, MNRAS, 455, 2918
- Hönig et al. (2013) Hönig S. F., et al., 2013, ApJ, 771, 87
- Huang et al. (2013) Huang S., Ho L. C., Peng C. Y., Li Z.-Y., Barth A. J., 2013, ApJ, 768, L28
- Huang et al. (2016) Huang S., Ho L. C., Peng C. Y., Li Z.-Y., Barth A. J., 2016, ApJ, 821, 114
- Janiuk & Czerny (2011) Janiuk A., Czerny B., 2011, MNRAS, 414, 2186
- Jiang et al. (2016) Jiang N., Dou L., Wang T., Yang C., Lyu J., Zhou H., 2016, ApJ, 828, L14
- Jiang et al. (2017) Jiang N., et al., 2017, ApJ, 850, 63
- Jiang, Stone, & Davis (2014) Jiang Y.-F., Stone J. M., Davis S. W., 2014, ApJ, 796, 106
- Jiang, Guillochon, & Loeb (2016) Jiang Y.-F., Guillochon J., Loeb A., 2016, ApJ, 830, 125
- Kesden (2012) Kesden M., 2012, PhRvD, 86, 064026
- Kewley et al. (2006) Kewley L. J., Groves B., Kauffmann G., Heckman T., 2006, MNRAS, 372, 961
- Kishimoto et al. (2007) Kishimoto M., Hönig S. F., Beckert T., Weigelt G., 2007, A&A, 476, 713
- Kochanek (2016) Kochanek C. S., 2016, MNRAS, 461, 371
- Komossa (2015) Komossa S., 2015, JHEAp, 7, 148
- Komossa et al. (2008) Komossa S., et al., 2008, ApJ, 678, L13
- Komossa & Bade (1999) Komossa S., Bade N., 1999, A&A, 343, 775
- Kormendy & Ho (2013) Kormendy J., Ho L. C., 2013, ARA&A, 51, 511
- Koshida et al. (2014) Koshida S., et al., 2014, ApJ, 788, 159
- Kuminski & Shamir (2016) Kuminski E., Shamir L., 2016, ApJS, 223, 20
- Laor & Draine (1993) Laor A., Draine B. T., 1993, ApJ, 402, 441
- Leloudas et al. (2016) Leloudas G., et al., 2016, NatAs, 1, 0002
- Lasota (2001) Lasota J.-P., 2001, NewAR, 45, 449
- Lebreton et al. (2013) Lebreton J., et al., 2013, A&A, 555, A146
- Levan et al. (2016) Levan A. J., et al., 2016, ApJ, 819, 51
- Lin & Shields (1986) Lin D. N. C., Shields G. A., 1986, ApJ, 305, 28
- Lu, Kumar, & Evans (2016) Lu W., Kumar P., Evans N. J., 2016, MNRAS, 458, 575
- Mainzer et al. (2011) Mainzer A., et al., 2011, ApJ, 743, 156
- Mao et al. (2016) Mao P., Urry C. M., Massaro F., Paggi A., Cauteruccio J., Künzel S. R., 2016, ApJS, 224, 26
- Maraston et al. (2013) Maraston C., et al., 2013, MNRAS, 435, 2764
- Margutti et al. (2017) Margutti R., et al., 2017, ApJ, 836, 25
- McConnell & Ma (2013) McConnell N. J., Ma C.-P., 2013, ApJ, 764, 184
- Mendel et al. (2014) Mendel J. T., Simard L., Palmer M., Ellison S. L., Patton D. R., 2014, ApJS, 210, 3
- Metzger & Stone (2016) Metzger B. D., Stone N. C., 2016, MNRAS, 461, 948
- Palaversa et al. (2016) Palaversa L., Gezari S., Sesar B., Stuart J. S., Wozniak P., Holl B., Ivezić Ž., 2016, ApJ, 819, 151
- Phinney (1989) Phinney E. S., 1989, IAUS, 136, 543
- Piran et al. (2015) Piran T., Svirski G., Krolik J., Cheng R. M., Shiokawa H., 2015, ApJ, 806, 164
- Prieto et al. (2016) Prieto J. L., et al., 2016, ApJ, 830, L32
- Price-Whelan et al. (2014) Price-Whelan, A. M., Agüeros, M. A., Fournier, A. P., et al. 2014, ApJ 781, 35
- Rani et al. (2011) Rani B., et al., 2011, MNRAS, 417, 1881
- Rees (1988) Rees M. J., 1988, Natur, 333, 523
- Sarzi et al. (2006) Sarzi M., et al., 2006, MNRAS, 366, 1151
- Simard et al. (2011) Simard L., Mendel J. T., Patton D. R., Ellison S. L., McConnachie A. W., 2011, ApJS, 196, 11
- Stone & Metzger (2016) Stone N. C., Metzger B. D., 2016, MNRAS, 455, 859
- Strubbe & Quataert (2009) Strubbe L. E., Quataert E., 2009, MNRAS, 400, 2070
- Tanaka & Shibazaki (1996) Tanaka Y., Shibazaki N., 1996, ARA&A, 34, 607
- Tinyanont et al. (2016) Tinyanont S., et al., 2016, arXiv, arXiv:1601.03440
- Thomas et al. (2013) Thomas D., et al., 2013, MNRAS, 431, 1383
- Ulmer (1999) Ulmer A., 1999, ApJ, 514, 180
- van Velzen & Farrar (2014) van Velzen S., Farrar G. R., 2014, ApJ, 792, 53
- van Velzen et al. (2011) van Velzen S., et al., 2011, ApJ, 741, 73
- van Velzen et al. (2016) van Velzen S., Mendez A. J., Krolik J. H., Gorjian V., 2016, ApJ, 829, 19
- von Neumann (1941) von Neumann, J., 1941, Annals of Mathematical Statistics, 12 (4), 367
- Wang & Merritt (2004) Wang J., Merritt D., 2004, ApJ, 600, 149
- Wang et al. (2011) Wang T.-G., Zhou H.-Y., Wang L.-F., Lu H.-L., Xu D., 2011, ApJ, 740, 85
- Wang et al. (2012) Wang T.-G., Zhou H.-Y., Komossa S., Wang H.-Y., Yuan W., Yang C., 2012, ApJ, 749, 115
- Wevers et al. (2017) Wevers T., van Velzen S., Jonker P. G., Stone N. C., Hung T., Onori F., Gezari S., Blagorodnova N., 2017, MNRAS, 471, 1694
- Wright et al. (2010) Wright E. L., et al., 2010, AJ, 140, 1868-1881
- Yamanaka et al. (2016) Yamanaka M., et al., 2016, PASJ, 68, 68
- Yang et al. (2013) Yang C.-W., Wang T.-G., Ferland G., Yuan W., Zhou H.-Y., Jiang P., 2013, ApJ, 774, 46
- Young et al. (2011) Young L. M., et al., 2011, MNRAS, 414, 940
- Yuan & Narayan (2014) Yuan F., Narayan R., 2014, ARA&A, 52, 529
- Zhang et al. (2015) Zhang W., Yu W., Karas V., Dovčiak M., 2015, ApJ, 807, 89
- Zhang et al. (2013) Zhang K., Wang T.-G., Yan L., Dong X.-B., 2013, ApJ, 768, 22
- Zhang et al. (2017) Zhang K., et al., 2017, MNRAS, 466, 3217

| No | IAU | z | type | W1 | W2 | W3 | W4 | V | |||||||
|---|---|---|---|---|---|---|---|---|---|---|---|---|---|---|---|
| mag | Å | km s-1 | M☉ | mag | mag | mag | mag | mag | mag | ||||||
| (1) | (2) | (3) | (4) | (5) | (6) | (7) | (8) | (9) | (10) | (11) | (12) | (13) | (14) | (15) | |
| 1 | 030257.14-082942.9 | 0.1056 | -22.20 | 0.65 | LINER | 83.92.9 | 12713 | 0.590.04 | 10.94 | 13.09 | 12.21 | 8.45 | 6.21 | 16.744 | 0.011 |
| 2 | 091225.01+061014.8 | 0.1453 | -22.33 | 0.98 | SF | 13.10.9 | 13115 | 0.520.05 | 11.17 | 13.52 | 12.63 | 9.67 | 7.51 | 17.479 | 0.014 |
| 3 | 100933.14+232255.8 | 0.0719 | -20.42 | 0.75 | SF | 2.00.2 | 546 | 0.580.03 | 9.95 | 13.60 | 12.44 | 9.38 | 7.61 | 17.431 | 0.036 |
| 4 | 113527.29+392810.7 | 0.1084 | -22.48 | 0.72 | LINER | 45.91.5 | 15510 | 0.320.02 | 10.70 | 12.82 | 12.15 | 8.66 | 6.61 | 16.581 | 0.031 |
| 5 | 121116.47+001345.3 | 0.0763 | -20.58 | 0.94 | AbsL | 0.40.2 | 1298 | 0.790.05 | 10.41 | 13.83 | 13.23 | 11.23 | 8.46 | 17.588 | 0.062 |
| 6 | 123715.10+601207.0 | 0.2164 | -23.45 | 1.30 | SF | 3.31.0 | 22017 | 0.460.04 | 11.48 | 13.51 | 12.68 | 10.32 | 7.99 | 17.532 | 0.061 |
| 7 | 130819.12+434525.6 | 0.0365 | -19.11 | 0.74 | SF | 6.50.4 | 3327 | 0.990.03 | 9.70 | 14.24 | 13.51 | 10.96 | 9.01 | 17.282 | 0.010 |
| 8 | 133737.13+202351.7 | 0.0725 | -21.19 | 0.78 | LINER | 9.90.4 | 1067 | 0.320.02 | 10.38 | 13.52 | 12.88 | 9.56 | 7.62 | 16.678 | 0.027 |
| 9 | 133837.60+573113.2 | 0.1269 | -21.87 | 0.96 | LINER | 13.60.6 | 14010 | 0.670.04 | 10.78 | 13.87 | 13.34 | 10.06 | 7.97 | 17.575 | 0.040 |
| 10 | 134244.41+053056.2 | 0.0365 | -19.67 | 0.75 | SF | 15.90.4 | 715 | 0.340.07 | 9.46 | 13.43 | 12.35 | 8.50 | 6.19 | 16.817 | 0.011 |
| 11 | 141036.81+265425.0 | 0.1071 | -21.29 | 0.51 | LINER | 60.62.1 | 4811 | 0.090.05 | 9.88 | 14.09 | 13.48 | 9.60 | 7.14 | 17.459 | 0.021 |
| 12 | 142401.66+295028.4 | 0.0855 | -21.39 | 0.84 | LINER | 13.50.5 | 1189 | 0.130.03 | 10.26 | 12.98 | 11.92 | 8.97 | 7.37 | 16.944 | 0.019 |
| 13 | 145851.65+175057.9 | 0.1165 | -21.83 | 1.07 | SF | 0.90.3 | 16211 | 0.690.05 | 11.03 | 13.35 | 12.62 | 10.77 | 9.14 | 17.348 | 0.020 |
| 14 | 155223.29+323455.1 | 0.1277 | -21.83 | 0.82 | LINER | 25.81.0 | 14621 | 0.810.04 | 10.82 | 13.14 | 12.38 | 9.45 | 6.83 | 17.451 | 0.040 |
Column (1): IAU name; (2): redshift; (3) absolute magnitude at ; (4) SDSS colour ; (5) spectral classification based on BPT diagram: SF-star forming galaxy, AbsL-absorption line galaxy; (6) equivalent width of H; (7) stellar velocity dispersions; (8) bulge to total light ratio in band from Simard et al. (2011); (9) bulge stellar mass from Mendel et al. (2014) ; (10-13) ALLWISE magnitudes from W1 to W4 bands; (14-15) are the mean and standard deviations of quarter median of CRTS magnitude in V.
| No | black body | 0.01m silcate | 0.1m silcate | 1m silcate | |||||||||||||
|---|---|---|---|---|---|---|---|---|---|---|---|---|---|---|---|---|---|
| mag | mag | mag | mag | yr | yr | erg s-1 | K | erg s-1 | K | erg s-1 | K | erg s-1 | K | ||||
| (1) | (2) | (3) | (4) | (5) | (6) | (7) | (8) | (9) | (10) | (11) | (12) | (13) | (14) | (15) | (16) | (17) | |
| 1 | 13.670.08 | 13.010.21 | 0.36 | 0.72 | 0.81 | 1.28 | 43.52 | 6329 | 43.92 | 5617 | 0.263 | 43.69 | 5536 | 0.047 | 43.51 | 5136 | -0.095 |
| 2 | 13.950.29 | 13.180.21 | 0.73 | 0.95 | 0.51 | 0.71 | 43.68 | 77622 | 43.97 | 67016 | 0.069 | 43.73 | 65915 | -0.146 | 43.56 | 60313 | -0.285 |
| 3 | 14.790.14 | 14.390.20 | 0.85 | 1.46 | 0.48 | 0.75 | 43.28 | 63710 | 43.68 | 5658 | 0.012 | 43.45 | 5577 | -0.204 | 43.27 | 5176 | -0.346 |
| 4 | 13.350.31 | 12.930.35 | 0.31 | 0.49 | 0.60 | 0.99 | 43.33 | 77722 | 43.62 | 67016 | -0.282 | 43.38 | 65915 | -0.497 | 43.21 | 60413 | -0.637 |
| 5 | 14.190.19 | 13.680.18 | 0.82 | 1.12 | 0.71 | 1.29 | 42.94 | 104172 | 43.07 | 85346 | -1.154 | 42.83 | 83444 | -1.367 | 42.68 | 74535 | -1.500 |
| 6 | 13.900.46 | 13.260.65 | 0.45 | 0.73 | 0.77 | 1.06 | 43.94 | 74910 | 44.25 | 6507 | 0.390 | 44.01 | 6397 | 0.174 | 43.84 | 5876 | 0.034 |
| 7 | 13.870.31 | 13.630.41 | 0.50 | 1.22 | 0.31 | 0.45 | 42.17 | 66713 | 42.55 | 58810 | -1.175 | 42.32 | 5799 | -1.390 | 42.14 | 5368 | -1.532 |
| 8 | 13.400.16 | 12.980.22 | 0.37 | 0.98 | 0.70 | 0.77 | 43.04 | 6058 | 43.47 | 5406 | -0.140 | 43.23 | 5336 | -0.356 | 43.05 | 4965 | -0.499 |
| 9 | 14.170.20 | 13.820.20 | 0.41 | 0.58 | 0.25 | 0.33 | 43.14 | 98534 | 43.30 | 81623 | -0.866 | 43.06 | 80022 | -1.080 | 42.91 | 71817 | -1.214 |
| 10 | 13.650.26 | 13.380.30 | 0.53 | 1.16 | 3.08 | 3.20 | 42.76 | 56931 | 43.21 | 51125 | -0.318 | 42.98 | 50424 | -0.534 | 42.79 | 47121 | -0.676 |
| 11 | 14.720.15 | 14.120.16 | 0.42 | 0.66 | 0.08 | 0.08 | 42.84 | 93892 | 43.02 | 78463 | -1.089 | 42.78 | 76960 | -1.303 | 42.63 | 69348 | -1.439 |
| 12 | 13.600.28 | 13.160.36 | 0.72 | 1.64 | 1.74 | 1.59 | 43.70 | 59718 | 44.13 | 53314 | 0.539 | 43.90 | 52613 | 0.323 | 43.71 | 49112 | 0.181 |
| 13 | 14.090.24 | 13.670.41 | 0.66 | 1.01 | 12.58 | 6.43 | 43.83 | 1279*** | 43.84 | 999*** | -0.607 | 43.60 | 973*** | -0.819 | 43.46 | 852*** | -0.945 |
| 14 | 14.130.30 | 13.310.22 | 0.94 | 0.96 | 7.18 | 7.92 | 43.99 | 1145388 | 44.06 | 919230 | -0.270 | 43.82 | 897218 | -0.482 | 43.67 | 794166 | -0.612 |
Column (1) and (2): the estimate of constant background magnitudes in and bands from the light curve fitting; Column (3) and (4): the variability amplitude in and bands; Column (5) and (6): the decay time of exponential law fit to the light curves in and bands; Column (7)-(8) luminosity and temperature of black body model derived from the peak flux of the flare; Column (9)-(11), (12)-(14) and (15)-(17): logarithmic luminosity, temperature and logarithmic dust mass for one temperature silicate dust model with grain sizes 0.01, 0.1 and 1 microns.
Appendix A Light curves and spectra of different spectroscopic classes
In the main text, we focused on the subsample of non-Seyfert galaxies with flare-like light curves, and their statistical properties are compared with spectroscopically classified Seyfert galaxies and blazars. In order to for readers to gain a direct view of the difference between different classes, in this appendix, we present the MIR light curves and SDSS spectra for the leading 7 objects (in increasing RA order) in the subsamples of Seyfert 1 galaxies, Seyfert 2 galaxies, Blazars and non-Seyfert galaxies that are not included in Figure 5.