TIFR Near Infrared Imaging Camera-II on the 3.6-m Devasthal Optical Telescope
Abstract
TIFR Near Infrared Imaging Camera-II is a closed-cycle Helium cryo-cooled imaging camera equipped with a Raytheon 512 512 pixels InSb Aladdin III Quadrant focal plane array having sensitivity to photons in the 1–5 wavelength band. In this paper, we present the performance of the camera on the newly installed 3.6-m Devasthal Optical Telescope (DOT) based on the calibration observations carried out during 2017 May 11–14 and 2017 October 7–31. After the preliminary characterization, the camera has been released to the Indian and Belgian astronomical community for science observations since 2017 May. The camera offers a field-of-view of 865 865 on the DOT with a pixel scale of 0169. The seeing at the telescope site in the near-infrared bands is typically sub-arcsecond with the best seeing of 045 realized in the near-infrared -band on 2017 October 16. The camera is found to be capable of deep observations in the , and bands comparable to other 4-m class telescopes available world-wide. Another highlight of this camera is the observational capability for sources up to Wide-field Infrared Survey Explorer (WISE) W1-band (3.4 ) magnitudes of 9.2 in the narrow band (; 3.59 ). Hence, the camera could be a good complementary instrument to observe the bright -band sources that are saturated in the Spitzer-Infrared Array Camera ([3.6] 7.92 mag) and the WISE W1-band ([3.4] 8.1 mag). Sources with strong polycyclic aromatic hydrocarbon (PAH) emission at 3.3 are also detected. Details of the observations and estimated parameters are presented in this paper.
keywords:
instrumentation: detectors, instrumentation: photometers, methods: observational1Corresponding author.
; ; ;
1 Introduction
The Infrared Astronomy group of Tata Institute of Fundamental Research (TIFR), Mumbai, India is continuously involved in developing ground-based and space-based near- and far-infrared photometers/imagers and spectrographs. The TIFR near infrared imaging camera-I (TIRCAM1) having a 58 62 pixels InSb focal plane array (FPA), was the first array camera developed by the group. Using the TIRCAM1, observations were mainly carried out during the period 2001–2006 at the focal plane of the 1.2-m Mount Abu infrared telescope (f/13 Cassegrain focus) of Physical Research Laboratory, India. More details about this camera and the related works can be found elsewhere in Ghosh & Naik (1993), Ghosh (2005) and Ojha et al. (2002, 2003, 2006).
Later in 2012, the camera was upgraded with a larger Raytheon 512 512 pixels InSb Aladdin III Quadrant FPA. The optics was re-designed for use of the camera at the focal plane of the 2-m Himalayan Chandra Telescope (HCT; f/9) operated by Indian Institute of Astrophysics, India111https://www.iiap.res.in/iao_telescope, and the 2-m Girawali Telescope (f/10) operated by Inter-University Centre for Astronomy and Astrophysics, India222http://igo.iucaa.in/. The camera was therefore renamed as TIFR Near Infrared Imaging Camera-II (TIRCAM2). The detector is cooled to an operating temperature of 35 K by a closed-cycle Helium cryo-cooler. The InSb array in the TIRCAM2 is sensitive to photons in the 1–5 wavelength band. However, the optics in the TIRCAM2 restricts the operating wavelength range below 3.8 . The camera accommodates seven selectable standard near-infrared (NIR) filters (see Table References) for imaging observations.
The TIRCAM2 has been recently mounted at the axial port (shown in Figure 1) of the 3.6-m Devasthal Optical Telescope (DOT; latitude: 29∘.1971 N, longitude: 79∘.6841 E, altitude: 2450 m). The field-of-view (FoV) of the camera on the DOT is 865 865, with a pixel scale of 01690002. In typical 1′′ seeing conditions, the TIRCAM2 therefore heavily samples the stellar profile. Such a pixel sampling is ideal for high accuracy photometry, particularly of bright NIR sources. The dark current measured was 12 e- sec-1, and the readout noise was 30 e- (single readout) for the FPA. This value of dark current is comparatively higher, possibly because of a thermal leak. The median gain of the detector was found to be 10 e- ADU-1. Elaborative technical details of the TIRCAM2 can be found in Naik et al. (2012). One of the filters (narrow -band filter; 2.12 , 0.03 ) in the camera, has been replaced by the standard broad -band ( 1.60 , 0.30 ) filter (see Table References) before commissioning it on the DOT. The TIRCAM2 also accommodates the Bracket-gamma filter ( 2.16 , 0.03 ). This particular filter is extremely useful in the study of emission line sources, and star-forming regions.
In this article, we report on the calibration and performance of the TIRCAM2 at the focal plane of the 3.6-m DOT, the largest optical aperture in the country till date. The calibration observations presented in this paper were mainly carried out in two successive cycles, before and after the monsoon in the year 2017 (i.e., Cycles 2017A and 2017B). The paper is arranged in the following manner. The details of the observations and the data reduction are presented in Section 2. The performance of the TIRCAM2, estimation of several observational parameters, and characterization of the camera on the DOT are presented in Section 3. Finally, a summary of the performance of the TIRCAM2 is presented in Section 4.
2 Observations and Data reduction
The TIRCAM2 was shipped to Devasthal for installation and commissioning with the 3.6-m DOT in 2016 May. The camera was installed on the telescope on 2016 June 1. On the following night, 2016 June 2, first light was obtained with the TIRCAM2 instrument on the DOT. The observations during 2016 June could not be carried out due to the monsoons and cloudy weather. Preliminary observations using the TIRCAM2 with the 3.6-m DOT were performed only during 2017 January 9–16. However, we were unable to obtain systematic data required for calibration, during that run again due to interruption by the clouds. Primary part of the calibration observations presented in this paper were carried out during the early science run of the DOT (i.e., 2017A) from 2017 May 11–22. During this period the sky was clear with excellent sub-arcsec seeing conditions (06–09) in the -band, and that is why we could obtain fruitful observations in spite of highly humid pre-monsoon weather condition (relative humidity typically 70%) at the Devasthal site. Few more additional calibration observations were also performed during 2017 October 7–31, the second phase of the early science run (cycle 2017B) after the monsoon. The seeing during this run was generally . However, the best seeing of 045 was noted on 2017 October 16.
The standard NIR observation strategy was followed while observing with the TIRCAM2 which involves acquisition of dark frames, along with the observations of flat frames during the morning and evening twilights. In general, short exposure observations of the target object in at least 3 dithered positions were deemed sufficient. Typically, in the bands, multiple frames of 50 s exposure were acquired, while in the -band several 10 s frames were acquired to avoid saturation. Due to large background in the -band, several hundreds to thousands of frames were acquired with a short exposure of 50 ms for each frame. Observations of nearby standard stars, immediately before or after the observations of science targets, were also done for flux calibration. Additionally, we observed blank sky frames of identical exposures as of the target star. This is to remove a non-uniform additive illumination in TIRCAM2 images. Master sky frame was generated by median combining all the observed sky frames. It is however possible to construct sky frames by median combining the science target frames if the observed field is not too crowded. During data reduction, sky background was removed from the science frame by subtracting the master-sky images after flat-fielding. We have also constructed a TIRCAM2 bad pixel mask (discussed in Section 3.2) which was applied to all the science images before performing the photometric reduction.
Photometric reduction was carried out using iraf333Image Reduction and Analysis Facility (Website: http://iraf.net/) software, following the standard procedures. All the raw scientific frames were first dark subtracted, and then corrected by a master flat. The point sources in those frames were identified using the daofind package of iraf (Stetson, 1992). Aperture photometry was carried out on the frames with isolated sources. For the crowded frames, point-spread-function (PSF) photometry was performed. The average PSF was defined by choosing at least 9 isolated stars in the frame. Subsequently, the PSF photometry was performed on the identified point sources in that frame using the average PSF. The instrumental magnitudes were finally calibrated to the standard system using the Two Micron All Sky Survey (2MASS) magnitudes (Cutri et al., 2003) of a few non-variable stars in the frame.
3 Performance of the TIRCAM2 on the DOT
In this section, we present the performance of the TIRCAM2 on the DOT and the estimation of several parameters based on the calibration observations.
3.1 Seeing at Devasthal
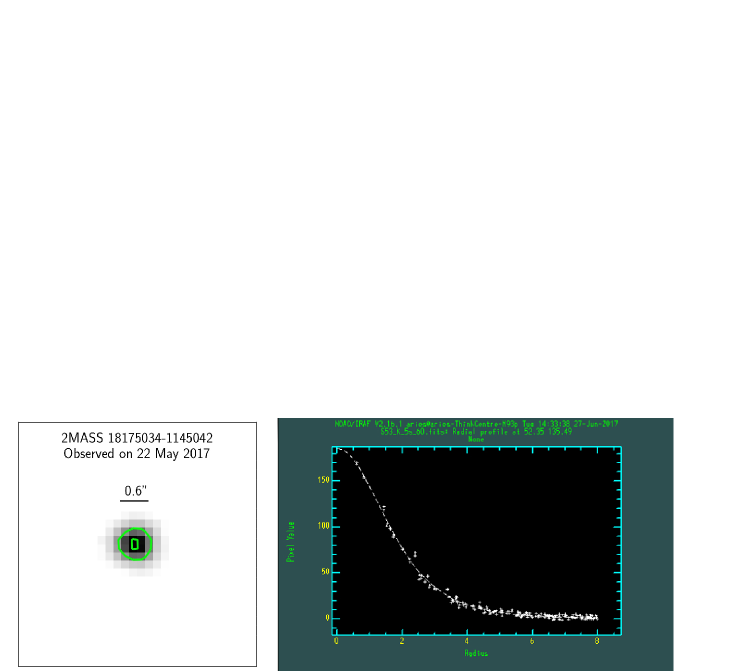
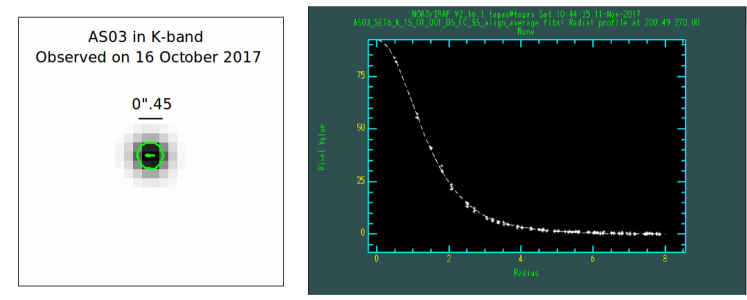
The FWHM seeing during the calibration nights was typically sub-arcsecond in all JHK bands. The best seeing obtained during the cycle 2017A was about 06 on 2017 May 22 (see a -band stellar image in the top-left panel of Figure 2). We have also shown the radial profile of the stellar image in the top-right panel of Figure 2. The full width at half maxima (FWHM) of the stellar profile is 3.5 pixels which converts to 06 on the sky. However, during cycle 2017B, a seeing of 045 ( 2.65 pixels) was obtained in the -band on 2017 October 16, and the corresponding stellar image and the radial profile are also shown in the lower panels of Figure 2, respectively. Hence, it seems that under normal sky conditions, the typical seeing at the DOT site should be sub-arcsecond in the NIR bands. Such a sub-arcsecond seeing is extremely useful not only to resolve sources in crowded regions but also to perform accurate photometry. It is also worth mentioning here, that the pixel scale of the TIRCAM2 ( 0169) is optimal for sub-arcsecond seeing conditions at Devasthal. It must be mentioned here that the variation of the PSF over the FoV is negligible compared to the seeing limitation.
3.2 Bad pixel mask
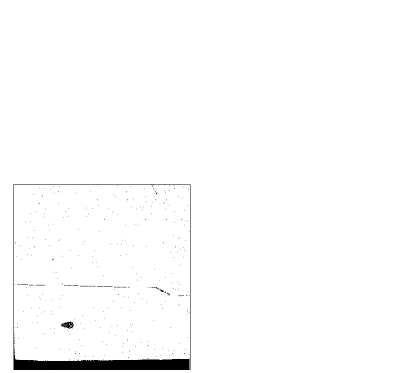
Every detector array has a certain percentage of bad, hot and cold pixels. Bad pixels are considered to be those which show substantially high variations with respect to the median counts in the resultant frame obtained by dividing two flat frames observed in the high and the low incident flux. For the TIRCAM2, we found that pixels having variations more than 8 are generally bad. Similarly, the hot and cold pixels are those pixels that have counts more than 8 above and below the median value, respectively, in a dark readout frame. It is noted that not all hot and cold pixels are really bad pixels that need to be masked. Efficiency of many of these hot and cold pixels can be corrected by dark subtraction and flat field correction.
A bad pixel mask has been constructed for the TIRCAM2 array in order to replace the counts in bad pixels by the average counts of their neighboring pixels. The bad pixel mask of the array is shown in Figure 3.
3.3 Sky brightness
The night sky in the NIR bands is generally a few hundred times brighter than it is in the optical bands. Sky brightness in NIR bands depends on various parameters like humidity, presence of the moon and its phase, and ambient temperature. The sky brightness values were estimated from the observed science frames after subtraction of dark frames and performing flat-field correction444For detail formula: http://www.inquinamentoluminoso.it/cinzano/en/sbeam2.html. Sky brightness in the , and narrow bands () was found to vary night to night. Such a variation is also expected since the water vapor contents in the atmosphere were sufficiently high and variable during the calibration nights at the DOT. In good sky conditions, we obtained sky surface brightness values (in mag arcsec-2) of 16.4, 14.0, 12.2 and 3.0 in , , and bands, respectively. The estimated sky brightness values in both the DOT cycles are consistent. Although the sky in the -band at Devasthal seems to be little brighter, but overall these values are comparable with other good sites like Hanle (Ninan et al., 2014), Calar Alto and several other observatories (see Sánchez et al., 2008). The sky brightness in the -band also seems to be comparable to the sites like Paranal555https://www.eso.org/gen-fac/pubs/astclim/paranal/skybackground/.
3.4 Photometric sensitivity and capability
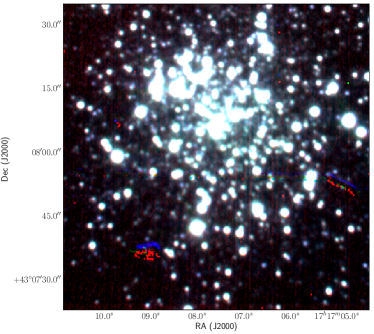
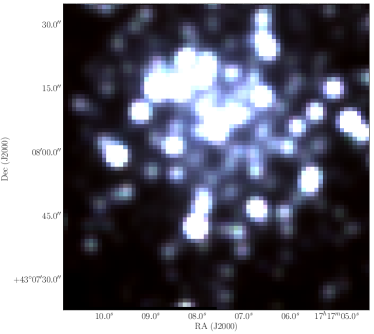
The estimation of the limiting magnitudes in the NIR bands depends on several factors like sky brightness, and reflectivity of the primary mirror (i.e., M1). We have observed several clusters to estimate the limiting magnitudes in the NIR bands. All these clusters were observed in one dithered position in bands. In addition, nearby sky frames were also observed with same exposure times as the target frames. Here, we report the limiting magnitudes estimated from the globular cluster M92. In both and bands, a total of eleven frames were acquired with each frame having an exposure time of 50 s. However, due to large background in the -band, a total of hundred frames were observed with each of them having a shorter exposure time of 10 s. Accordingly, the effective exposure times in , and bands are 550 s, 550 s and 1000 s, respectively. A three-color composite image (red: -band, green: -band, blue: -band) of the globular cluster M92 is presented in Figure 4. In addition, a similar three-color composite RGB image of the M92, constructed using the 2MASS bands, is also presented in Figure 4 for comparison. It can be clearly seen in the figure that the TIRCAM2 image is much deeper and has a better spatial resolution (FWHM08) compared to the 2MASS images (spatial resolution 2′′; see Skrutskie et al., 2006).
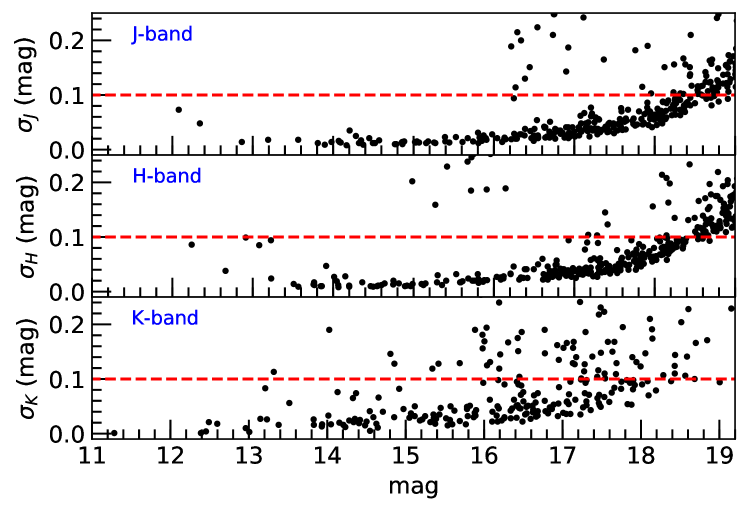
The band magnitudes of the globular cluster M92 are used to estimate sensitivity limits. As can be seen in Figure 5, the 10 limiting magnitudes in bands are of 19.0, 18.8 and 18.0 mag, respectively. These numbers are comparable with the limiting magnitudes of other NIR cameras attached to several 4-m class telescopes available world-wide, e.g., Wide Field Camera attached to the 3.8-m United Kingdom Infrared Telescope (Lawrence et al., 2007) and Wide-field Infrared Camera with the 3.6-m Canada-France-Hawaii Telescope (Delorme et al., 2010).
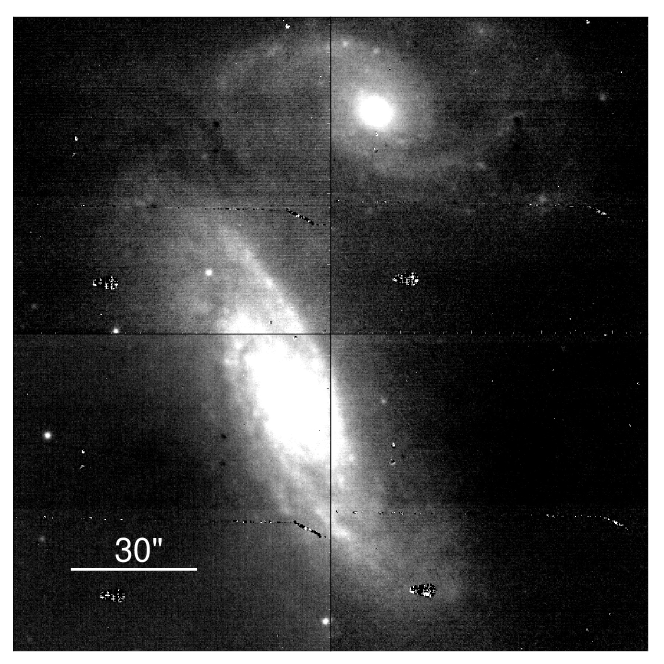
The FoV of TIRCAM2 is comparatively small (865 865). Thus, in order to examine the dithering capability and the linearity of the array, we observed two interacting galaxies, NGC 4567 and NGC 4568, in four dithered positions on 2017 May 15. The effective exposure time in each dithered position is 550 s. A mosaic of four dithered TIRCAM2 -band images for a FoV ( 25 25) covering both the interacting galaxies together is shown in Figure 6.
3.5 Exposure time calculator
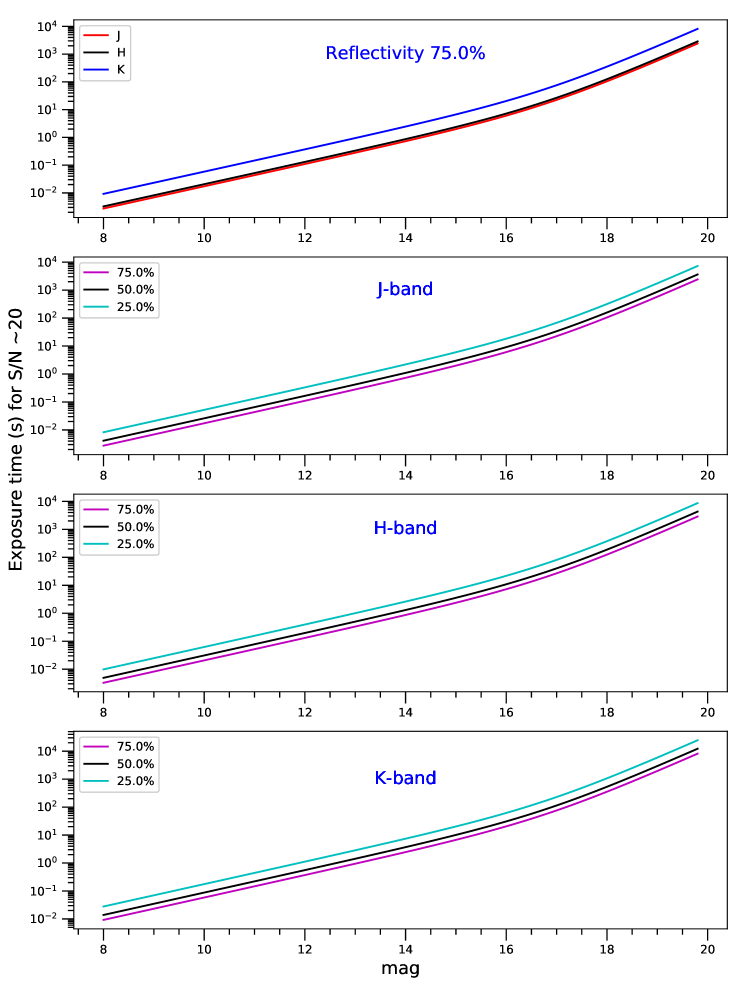
It is important to estimate the required exposure time for any object before starting observations, as it eventually helps to plan and optimize the observations to be made. Hence, we have developed an Exposure time calculator for TIRCAM2, and also made it available online666http://tirspec.pythonanywhere.com/tircam2/tircam2/. It requires the name of the filter in which observations will be made, magnitude of the target source, expected signal-to-noise ratio (S/N) of the observed frame, and the desired number of frames as inputs, in order to obtain an estimate of the required exposure time for each frame. It must be noted that per frame exposure times larger than 50 s, 50 s and 10 s in , and bands, respectively, may saturate the observed frames. In such a situation, the required exposure time has to be re-estimated by increasing the number of frames. Figure 7 shows graphs of required exposure times in the , and bands for a magnitude range from 8–20 mag for a typical 75% reflectivity of the primary mirror, M1. Estimates of required exposure times for three different reflectivities of the M1 (i.e., 75%, 50% and 25%) are also shown in Figure 7 separately for all the three bands.
3.6 Sub-array acquisition mode of TIRCAM2
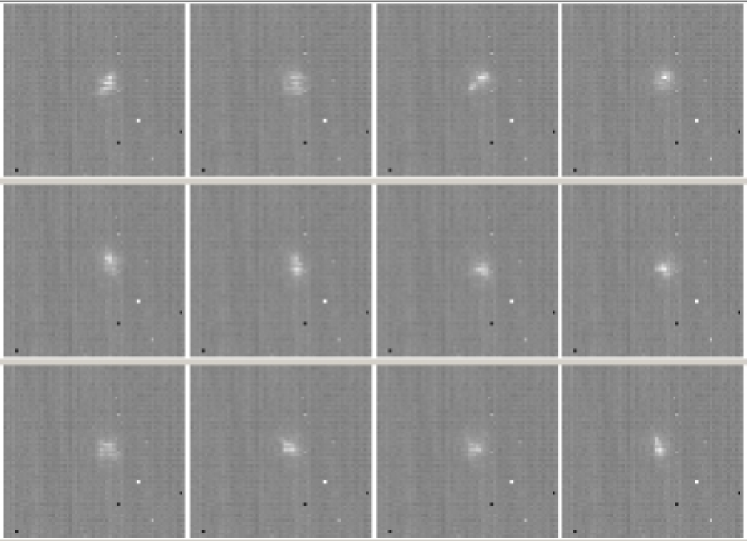
In the full frame mode, the TIRCAM2 captures 512 512 pixels image, and the shortest possible sampling time in the full-frame mode is 256 ms. However, in the window or sub-array mode, the TIRCAM2 is able to acquire images for small box sizes ranging from 16 16 to 256 256 pixels with finer sampling times. This sub-array capability of the TIRCAM2 could therefore be useful to observe bright sources with a small exposure time in order to avoid saturation. This capability can also be employed for speckle observations generally performed to identify binary stars. Such rapid acquisition can also be useful to record light curves of fast events that occur within few hundreds of milli-seconds (e.g., lunar occultations). Twelve consecutive sky-subtracted frames of 64 64 pixels window (out of 1000 observed frames) are shown in Figure 8. The frame acquisition time for 64 64 pixels window is 11 ms and the window sampling time is 8.2 ms. The frame acquisition time is generally more due to the additional time needed to skip rows that fall outside the window.
3.7 Detection of sources in the -band
Ground-based observations in the NIR -band ( 3.59 , 0.07 ) is extremely difficult because of poor atmospheric transmission in this wavelength band. Also, this band is highly affected by the water vapor content in the Earth’s atmosphere. Observations in this band have primarily been possible with satellite-based cameras, such as the Spitzer-Infrared Array Camera (IRAC; Reach et al., 2005), and the Wide-field Infrared Survey Explorer (WISE; Wright et al., 2010). We have performed -band observations of several sources using the TIRCAM2 attached to the DOT. The observed -band frames (100 100 pixels cut-outs) of sources having WISE W1-band (3.4 ) magnitudes ranging from 3.1 to 9.2 is shown in Figure 9. The brighter sources (W1 5.0 mag) were observed on the calibration nights during the DOT Cycle 2017A with an effective integration time of 15 s. However, the remaining sources were observed during the DOT cycle 2017B with an effective exposure time of 125 s. It is found that sources up to 9.2 mag can be detected in the -band of the TIRCAM2 even with an effective exposure time of about 25 s.
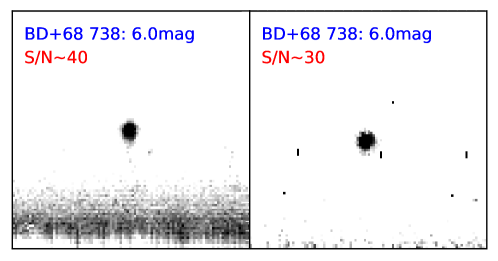
The sources up to W1-band magnitude of 6.0 are sparsely visible even in short exposure frames of 50 ms, and thus, it allows us to align and combine those dithered frames to construct the final frame. This eventually helps us to achieve a better S/N in the combined frame. However, frames with sources fainter than W1-band magnitude of 6.0 are combined without alignment since they were not visible in the individual frames. Note that the S/N of the observed point sources can be improved substantially by aligning the frames before combining as compared to combining blindly. For example, in Figure 10, the S/N of the source, BD+68 738 (W1 6.0 mag), has improved from 30 to 40 when aligned and combined. Hence, it might be possible to observe sources fainter than 9.2 mag with similar exposure in the -band using the TIRCAM2, if another bright source is present in the frame for alignment. It is worth mentioning here that point sources brighter than 7.92 mag and 8.1 mag777http://wise2.ipac.caltech.edu/docs/release/allsky/expsup/sec6_3d.html#satcat are generally saturated in the Spitzer-IRAC 3.6 frames (Churchwell et al., 2009) and the WISE W1-band images (Wright et al., 2010), respectively. The TIRCAM2 can therefore be a complementary instrument to observe the bright sources that are saturated in the Spitzer-IRAC and the WISE W1 frames.
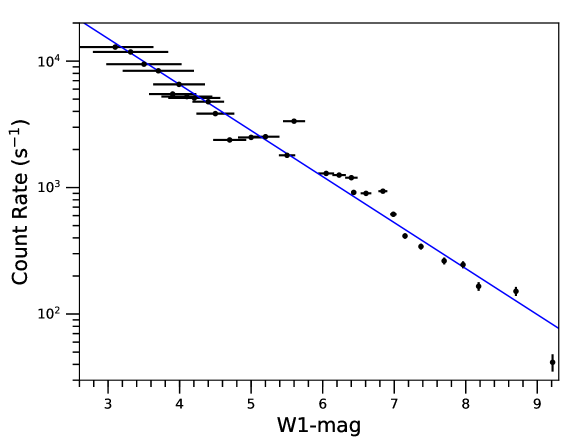
We have also examined the linearity of the TIRCAM2 array in the -band. A total of 29 sources were observed that have W1-band magnitudes ranging from 3.1–9.2. Figure 11 shows the W1-band magnitudes versus corresponding TIRCAM2 count rates. As can be seen in the figure, the array behaves linearly in this magnitude range. Since the brighter sources in the WISE W1-band (8.1 mag) are generally saturated, the photometry of these sources is determined using an indirect method. Thus, the magnitudes of brighter sources have larger errors. However, scatter in the TIRCAM2 count rates in a few measurements are seen possibly because of the variable sky background due to high humidity. It must be noted that the source having 9.2 mag is merely a 3 detection, and hence, a large scatter (see Figure 11) in its count is not unusual as the corresponding frame is background dominated.
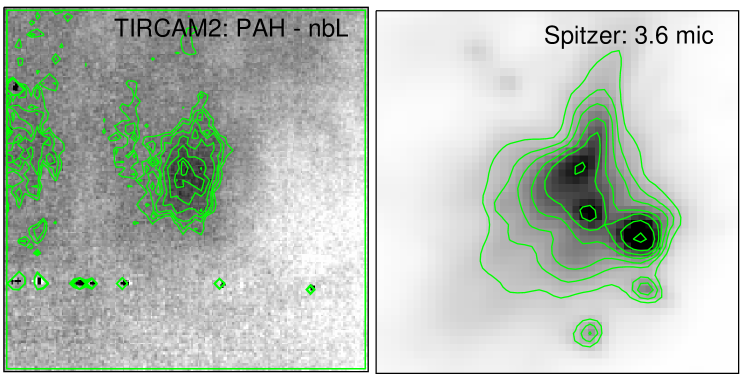
3.8 Detection of polycyclic aromatic hydrocarbon emission
The TIRCAM2 is also equipped with a polycyclic aromatic hydrocarbon (PAH) band filter ( 3.29 , 0.06 ). But, in general, it is difficult to observe the diffused PAH emission using ground-based telescopes. However, encouraged by the -band detection, we observed a few known PAH emitting sources (Ghosh & Ojha, 2002). Figure 12 shows the continuum-subtracted -band image of the Sh 2-61 region (F0.4 Jy; estimated from Verhoeff et al., 2012) observed using the TIRCAM2 at the 3.6-m DOT with an effective integration time of 13 s. Spitzer-IRAC 3.6 image which includes PAH emission, is also shown in Figure 12 for comparison. As can be seen in the figure, the TIRCAM2 could detect the central (i.e., the strongest) part of the PAH emission of the Sh 2-61 region. Hence, it might be possible to observe strong PAH sources (F 0.4 Jy) using the TIRCAM2.
4 Summary
The performance of the NIR imaging camera, TIRCAM2, attached to the 3.6-m DOT is found to be consistent with the expectations. At longer wavelengths, specifically at the -band ( 3.59 ), the results are highly encouraging. In spite of high humidity (70%) during the calibration observation runs, the seeing was generally sub-arcsecond, and the best seeing obtained was 045 in the -band on 2017 October 16. Deep imaging observations show that the camera has the capability to observe sources up to 19.0 mag, 18.8 mag, and 18.0 mag with 10% photometric accuracy in , and bands, respectively, with corresponding effective exposure times of 550 s, 550 s and 1000 s. The camera is also capable of detecting the -band sources brighter than 9.2 mag, and hence, can be useful in observing bright sources that are saturated in the Spitzer-IRAC 3.6 and the WISE W1-band images. Also, the detector response is found to be linear in the -band up to W1-band magnitude of 9.2. Overall, it is found that the TIRCAM2 with the 3.6-m DOT is adequate for deep NIR observations that are comparable to other 4-m class telescopes available world-wide. The camera is also capable of detecting strong PAH emitting sources (F 0.4 Jy), like Sh 2-61. The TIRCAM2 is made available at the DOT for scientific observations since 2017 May. It is also proposed to be used on one of the side ports of the DOT as the axial port will be occupied by one of the other instruments (e.g., TANSPEC888TIFR-ARIES Near Infrared Spectrometer, ADFOSC999ARIES-Devasthal Faint Object Spectrograph and Camera, and CCD imager) in the near future. The corresponding mechanical design is being finalized and will be fabricated soon. Overall, it is concluded that the TIRCAM2 can be highly useful for deep NIR bands observations and may also be useful for observations in the -band, particularly at the Devasthal site.
Acknowledgement
We thank the anonymous referee for the constructive comments that have improved the presentation of the paper. We thank the members of the Infrared Astronomy group of Department of Astronomy & Astrophysics, TIFR, and specially Mr. Rajesh Jadhav and Mr. Shailesh Bhagat for assistance and support during the installation and observations. We also like to thank the staff at the DOT, Devasthal and ARIES, for their co-operation during the installation and characterization of TIRCAM2. We specially thank Mr. Nandish Nanjappa for his valuable contributions during the installation phase. This publication has made use of data products from the Two Micron All Sky Survey (a joint project of the University of Massachusetts and the Infrared Processing and Analysis Center/ California Institute of Technology, funded by NASA and NSF).
References
- Churchwell et al. (2009) Churchwell, E., Babler, B. L., Meade, M. R., et al. 2009, PASP, 121, 213
- Cutri et al. (2003) Cutri, R. M., Skrutskie, M. F., van Dyk, S., et al. 2003, The 2MASS All-Sky Catalog of Point Sources (available at https://www.ipac.caltech.edu/2mass)
- Delorme et al. (2010) Delorme, P., Albert, L., Forveille, T., et al. 2010, A&A, 518, A39
- Ghosh (2005) Ghosh, S. K. 2005, Bulletin of the Astronomical Society of India, 33, 133
- Ghosh & Ojha (2002) Ghosh, S. K., & Ojha, D. K. 2002, A&A, 388, 326
- Ghosh & Naik (1993) Ghosh, S. K., & Naik, M. B. 1993, Bulletin of the Astronomical Society of India, 21, 485
- Lawrence et al. (2007) Lawrence, A., Warren, S. J., Almaini, O., et al. 2007, MNRAS, 379, 1599
- Naik et al. (2012) Naik, M. B., Ojha, D. K., Ghosh, S. K., et al. 2012, Bulletin of the Astronomical Society of India, 40, 531
- Ninan et al. (2014) Ninan, J. P., Ojha, D. K., Ghosh, S. K., et al. 2014, Journal of Astronomical Instrumentation , 3, 1450006
- Ojha et al. (2006) Ojha, D. K., Ghosh, S. K., Tej, A., et al. 2006, MNRAS, 368, 825
- Ojha et al. (2003) Ojha, D. K., Ghosh, S. K., Verma, R. P., & Anandarao, B. G. 2003, Bulletin of the Astronomical Society of India, 31, 467
- Ojha et al. (2002) Ojha, D. K., Ghosh, S. K., Verma, R. P., Chakraborti, A., & Anandarao, B. G. 2002, Bulletin of the Astronomical Society of India, 30,
- Reach et al. (2005) Reach, W. T., Megeath, S. T., Cohen, M., et al. 2005, PASP, 117, 978
- Sánchez et al. (2008) Sánchez, S. F., Thiele, U., Aceituno, J., et al. 2008, PASP, 120, 1244
- Skrutskie et al. (2006) Skrutskie, M. F., Cutri, R. M., Stiening, R., et al. 2006, AJ, 131, 1163
- Stetson (1992) Stetson, P. B. 1992, Astronomical Data Analysis Software and Systems I, 25, 297
- Verhoeff et al. (2012) Verhoeff, A. P., Waters, L. B. F. M., van den Ancker, M. E., et al. 2012, A&A, 538, A101
- Wright et al. (2010) Wright, E. L., Eisenhardt, P. R. M., Mainzer, A. K., et al. 2010, AJ, 140, 1868-1881
[h] TIRCAM2 filter characteristics. \topruleFilter Name \colrule 1.20 0.36 1.65 0.30 - 2.16 0.03 -cont 2.17 0.03 2.19 0.40 3.28 0.06 3.59 0.07 \botrule