PlayeRank: data-driven performance evaluation and player ranking in soccer via a machine learning approach
Abstract.
The problem of evaluating the performance of soccer players is attracting the interest of many companies and the scientific community, thanks to the availability of massive data capturing all the events generated during a match (e.g., tackles, passes, shots, etc.). Unfortunately, there is no consolidated and widely accepted metric for measuring performance quality in all of its facets. In this paper, we design and implement PlayeRank, a data-driven framework that offers a principled multi-dimensional and role-aware evaluation of the performance of soccer players. We build our framework by deploying a massive dataset of soccer-logs and consisting of millions of match events pertaining to four seasons of 18 prominent soccer competitions. By comparing PlayeRank to known algorithms for performance evaluation in soccer, and by exploiting a dataset of players’ evaluations made by professional soccer scouts, we show that PlayeRank significantly outperforms the competitors. We also explore the ratings produced by PlayeRank and discover interesting patterns about the nature of excellent performances and what distinguishes the top players from the others. At the end, we explore some applications of PlayeRank — i.e. searching players and player versatility — showing its flexibility and efficiency, which makes it worth to be used in the design of a scalable platform for soccer analytics.
1. Introduction
Rankings of soccer players and data-driven evaluations of their performance are becoming more and more central in the soccer industry (Stein et al., 2017; Gudmundsson and Horton, 2017; Rein and Memmert, 2016; Bornn et al., [n. d.]). On the one hand, many sports companies, websites and television broadcasters, such as Opta, WhoScored.com and Sky, as well as the plethora of online platforms for fantasy football and e-sports, widely use soccer statistics to compare the performance of professional players, with the purpose of increasing fan engagement via critical analyses, insights and scoring patterns. On the other hand, coaches and team managers are interested in analytic tools to support tactical analysis and monitor the quality of their players during individual matches or entire seasons. Not least, soccer scouts are continuously looking for data-driven tools to improve the retrieval of talented players with desired characteristics, based on evaluation criteria that take into account the complexity and the multi-dimensional nature of soccer performance. While selecting talents on the entire space of soccer players is unfeasible for humans as it is too much time consuming, data-driven performance scores could help in selecting a small subset of the best players who meet specific constraints or show some pattern in their performance, thus allowing scouts and clubs to analyze a larger set of players thus saving considerable time and economic resources, while broadening scouting operations and career opportunities of talented players.
The problem of data-driven evaluation of player performance and ranking are gaining interest in the scientific community too, thanks to the availability of massive data streams generated by (semi-)automated sensing technologies, such as the so-called soccer-logs (Stein et al., 2017; Gudmundsson and Horton, 2017; Rein and Memmert, 2016; Bornn et al., [n. d.]), which detail all the spatio-temporal events related to players during a match (e.g., tackles, passes, fouls, shots, dribbles, etc.). Ranking players means defining a relation of order between them with respect to some measure of their performance over a sequence of matches. In turn, measuring performance means computing a data-driven performance rating which quantifies the quality of a player’s performance in a specific match and then aggregate them over the sequence of input matches. This is a complex task since there is no objective and shared definition of performance quality, which is an inherently multidimensional concept (Pappalardo et al., 2017). Several data-driven ranking and evaluation algorithms have been proposed in the literature to date, but they suffer from three main limitations.
First, existing approaches are mono-dimensional, in the sense that they propose metrics that evaluate the player’s performance by focusing on one single aspect (mostly, passes or shots (Power et al., 2017; Brooks et al., 2016; Duch et al., 2010; López Peña and Touchette, 2012; Lucey et al., 2014)), thus missing to exploit the richness of attached meta-information provided by soccer-logs. Conversely, soccer scouts search for a talented player based on ”metrics” which combine many relevant aspects of their performance, from defensive skills to possession and attacking skills. Since mono-dimensional approaches cannot meet this requirement, there is the need for a framework capable to exploit a comprehensive evaluation of performance based on the richness of the meta-information available in soccer-logs.
Second, existing approaches evaluate performance without taking into account the specificity of each player’s role on the field (e.g., right back, left wing), so they compare players that comply with different tasks (Duch et al., 2010; Brooks et al., 2016; López Peña and Touchette, 2012; Power et al., 2017; Lucey et al., 2014). Since it is meaningless to compare players which comply with different tasks and considering that a player can change role from match to match and even within the same match, there is the need for an automatic framework capable of assigning a role to players based on their positions during a match or a fraction of it.
Third, missing a gold standard dataset, existing approaches in the literature report judgments that consist mainly of informal interpretations based on some simplistic metrics (e.g., market value or goals scored (Torgler and Schmidt, 2007; Stanojevic and Gyarmati, 2016; Brooks et al., 2016)). It is important instead to evaluate the goodness of ranking and performance evaluation algorithms in a quantitative and throughout manner, through datasets built with the help of human experts as done for example for the evaluation of recommender systems in Information Retrieval.
This paper presents the results of a joint research among academic computer scientists and data scientists of Wyscout (wys, [n. d.]), the leading company for soccer scouting. The goal has been to study the limitations of existing approaches and develop PlayeRank, a new-generation data-driven framework for the performance evaluation and the ranking of players in soccer. PlayeRank offers a principled multi-dimensional and role-aware evaluation of the performance of soccer players, driven only by the massive and standardized soccer-logs currently produced by several sports analytics companies (i.e., Wyscout, Opta, Stats). PlayeRank is designed around the orchestration of the solutions to three main phases: a learning phase, a rating phase and a final ranking phase. PlayeRank models the performance of a soccer player in a match as a multidimensional vector of features extracted from soccer-logs. In the learning phase, PlayeRank performs two main sub-tasks: (i) the extraction of feature weights: since we do not have a ground-truth for “learning” the mapping from the performance features to the players’ performance quality, we turn this problem into a classification problem between the multidimensional vector of features, aggregated over all players’ of a team, and the result this team achieved in a match; (ii) the training of a role detector: given that there are different player roles in soccer we identify, in an unsupervised way, a set of roles from the match events available in the soccer-logs.
In the subsequent rating phase, the performance quality of a player in a match is evaluated as the scalar product between the previously computed feature weights and the values these feature get in that match played by that player. In the final ranking phase, PlayeRank computes a set of role-based rankings for the available players, by taking into account their performance ratings and their role(s) as they were computed in the two phases before.
In order to validate our framework, we instantiated it over a massive dataset of soccer-logs provided by Wyscout which is unique in the large number of logged matches and players, and for the length of the period of observation. In fact, it includes 31 millions of events covering around 20K matches and 21K players in the last four seasons of 18 prominent soccer competitions: La Liga (Spain), Premier League (England), Serie A (Italy), Bundesliga (Germany), Ligue 1 (France), Primeira Liga (Portugal), Super Lig (Turkey), Souroti Super League (Greece), Austrian Bundesliga (Austria), Raiffeisen Super League (Switzerland), Russian Football Championship (Russia), Eredivisie (The Netherlands), Superliga (Argentina), Campeonato Brasileiro Série A (Brazil), UEFA Champions League, UEFA Europa League, FIFA World Cup 2018 and UEFA Euro Cup 2016. Then we performed an extensive experimental analysis advised by a group of professional soccer scouts which showed that PlayeRank is robust in agreeing with a ranking of players given by these experts, with an improvement up to 30% (relative) and 21% (absolute) with respect to the current state-of-the-art algorithms (Duch et al., 2010; Brooks et al., 2016).
One of the main characteristics of PlayeRank is that, by providing a score which meaningfully synthesizes a player’s performance quality in a match or in a series of matches, it enables the analysis of the statistical properties of player performance in soccer. In this regard, the analysis of the performance ratings resulting from PlayeRank, for all the players and all the matches in our dataset, revealed several interesting patterns.
First, on the basis of the players’ average position during a match, the role detector finds eight main roles in soccer (Section 4.3) and enables the investigation of the notion of player’s versatility, defined as his ability to change role from match to match (Section 6.2). Second, the analysis of feature weights reveals that there is no significant difference among the 18 competitions, with the only exception of the competitions played by national teams (Section 4.4). Third, the distribution of player ratings changes by role, thus suggesting that the performance of a player in a match highly depends on the zone of the soccer field he is assigned to (Section 4.5). This is an important aspect that will be exploited to design a novel search engine for soccer players (Section 6.1). Fourth, we find that the distribution of performance ratings is strongly peaked around its average, indicating that “outlier” performances are rare (Section 4.5). In particular, these outlier performances are unevenly distributed across the players: while the majority of players achieve a few excellent performances, a tiny fraction of players achieve many excellent performances. Moreover, we find that top players do not always play in an excellent way but, nonetheless, they achieve excellent performances more frequently than the other players (Section 4.5).
In conclusion, our study and experiments show that PlayeRank is an innovative data-driven and open-source framework which goes beyond the state-of-the-art results in the evaluation and ranking of soccer players.111The source code of PlayeRank and a portion of the soccer-logs used to train it will be made available in the camera-ready version of this paper. This study also provides the first thorough, and somewhat surprising, characterization of soccer performance. The last section will start from PlayeRank and its study to present a set of new challenging problems in soccer analytics that we state and comment in order to stimulate the research interest from the community of data scientists.
2. Related Works
The availability of massive data portraying soccer performance has facilitated recent advances in soccer analytics. The so-called soccer-logs (Stein et al., 2017; Gudmundsson and Horton, 2017; Rein and Memmert, 2016; Bornn et al., [n. d.]), capturing all the events occurring during a match, are one of the most common data format and have been used to analyze many aspects of soccer, both at team (Lucey et al., 2013; Cintia et al., 2015a; Pappalardo and Cintia, 2017; Wang et al., 2015; Decroos et al., 2018) and individual level (Brooks et al., 2016; Duch et al., 2010; Nsolo et al., 2018). Among all the open problems in soccer analytics, the data-driven evaluation of a player’s performance quality is the most challenging one, given the absence of a ground-truth for that performance evaluation.
Data-driven evaluation of performance.
While many metrics have been proposed to capture specific aspects of soccer performance (e.g., expected goals, pass accuracy, etc.), just a few approaches evaluate a player’s performance quality in a systemic way.
The flow centrality (FC) metric proposed by Duch et al. (Duch et al., 2010), one of the first attempts in this setting, is defined as the fraction of times a player intervenes in pass chains which end in a shot. Based on this metric, they rank all players in UEFA European Championship 2008 and observe that 8 players in their top-20 list belong to the UEFA’s top-20 list which was released just after the competition. Being based merely on pass centrality, as the authors themselves highlight in the paper, the FC metric mostly makes sense for midfielders and forwards.
Brooks et al. (Brooks et al., 2016) develop the Pass Shot Value (PSV), a metric to estimate the importance of a pass for generating a shot. They represent a pass as a vector of 360 features describing the vicinity of a field zone to the pass’ origin and destination. Then, they use a supervised machine-learning model to predict whether or not a given pass results in a shot. The feature weights resulting from the model training are used to compute PSV as the sum of the feature weights associated with the pass’ origin and destination. They finally used soccer-logs to rank players in La Liga 2012-13 according to their average PSV, showing that it correlates with the rankings based on assists and goals. Unfortunately, as the authors highlight in the paper, PSV is strongly biased towards offensive-oriented players. Moreover, PSV is a pass-based metric which thus omits all the other kinds of events observed during a soccer match, and lacks of a proper validation.
Instead of proposing their own algorithm for performance quality evaluation, Nsolo et al. (Nsolo et al., 2018) extract performance metrics from soccer-logs to predict the WhoScored.com performance rating with a machine learning approach. The resulting model is more accurate for specific roles (e.g., forwards) and competitions (e.g., English Premier League) when predicting if a player is in the top 10%, 25% and 50% of the WhoScored.com ranking.
The problem of evaluating players performance got much attention in other team sports, like hockey, basketball and especially baseball. In hockey, Schulte and Zhao proposed the Scoring Impact metric (SI) (Shulte and Zhao, 2017) to rank ice hockey players in NHL depending on his team’s chance of scoring the next goal. In basketball, the Performance Efficiency Rating222https://www.basketball-reference.com/about/per.html is nowadays a widely used metric to assess players’ performance by deploying basketball-logs (i.e. pass completed, shots achieved, etc.). In baseball, a plethora of statistical metrics have been proposed to evaluate the performance of players and teams (Baumer and Zimbalist, 2014).
Rating systems for sports teams.
Many studies also focused on developing the so-called rating systems, like Elo and TrueSkill (Lasek et al., 2013; Herbrich et al., 2006), which rank teams or players based on their past victories/defeats and the estimated strength of the opponent. Therefore, they do not take into account neither player-observed match events nor other quantitative aspects of individual and collective performance (Pappalardo and Cintia, 2017). As a result, unlike PlayeRank, such rating systems are unable to provide an explicit characterization of the evaluated performance of a player as well as to discern his contribution in a match.
Relations between performance and market value.
Another strand of literature focuses on quantifying the relation between proxies of a player’s quality, like market value, wage or popularity, and his performance on the field. Stanojevic and Gyarmati (Stanojevic and Gyarmati, 2016) use soccer-logs to infer the relation between a player’s typical performance and his market value as estimated by crowds. They find a large discrepancy between estimated and real market values, due to the lack of important information such as injury-proneness and commercialization capacity. Müller et al. (Müller et al., 2017) develop a similar approach and use soccer-logs, as well as players’ popularity data and market values in the preceding years, to estimate a player transfer fee. They show that for the low- and medium-priced players the estimated market values are comparable to estimations by the crowd, while the latter performs better for the high-priced players. Torgler and Schmidt (Torgler and Schmidt, 2007) investigate what shapes performance in soccer, represented as a player number of goals and assists. They find that salary, age and team effects have a statistically significant impact on a player performance on the field.
Position of our work
Despite an increasing interest in this research field, our review of the state-of-the-art highlights that there is no validated framework allowing for a multi-dimensional and role-aware evaluation of soccer performance quality. In this paper, we overcome this issue by proposing PlayeRank, a framework that deploys all the possible events described by soccer-logs to evaluate player’s performance quality and player’s role in a match. In contrast to FC and PSV, which lack of a proper validation with domain experts, we test the framework against a humanly-labeled dataset we have specifically built for the purpose of evaluating soccer players performance. Finally, and for the first time in the literature, we shed some light on the statistical patterns that characterize soccer players performance by providing a novel and throughout analysis that exploits PlayeRank scores and the large and unique dataset of competitions, teams and players Wyscout made available to us.
3. The PlayeRank framework
Figure 1 describes how the PlayeRank framework operates. It is designed to work with soccer-logs, in which a soccer match consists of a sequence of events encoded as a tuple: , where is the identifier of the player which originated/refers to this event, is the event type (i.e., passes, shots, goals, tackles, etc.), and denote the spatio-temporal coordinates of the event over the soccer field. PlayeRank assumes that soccer-logs are stored into a database, which is updated with new events after each soccer match (Figure 1a).
The key task addressed by PlayeRank is the “evaluation of the performance quality of a player in a soccer match ”. This consists of computing a numerical rating , called performance rating, that aims at capturing the quality of the performance of in given only the set of events related to that player in that match. This is a complex task because of the many events observed in a match, the interactions among players within the same team or against players of the opponent team, and the fact that players performance is inextricably bound to the performance of their team and possibly of the opponent team. PlayeRank addresses such complexity by means of a procedure which hinges onto a massive database of soccer-logs and consists of three phases: a rating phase, a ranking phase and a learning phase.
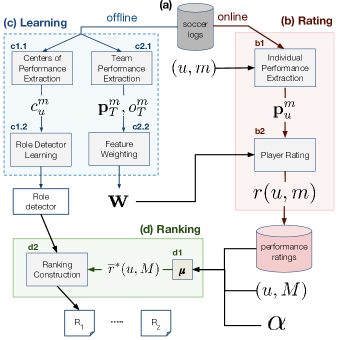
3.1. Rating phase
The rating phase (step b in Figure 1) is the procedure responsible for the computation of the performance rating and it is run for each player every time a new match becomes available in the soccer-logs database. This phase exploits information computed ”offline” and consists of two main steps: individual performance extraction (Figure 1, step b1) and player rating (Figure 1, step b2).
Individual Performance Extraction
Given that a match is represented as a set of events, PlayeRank models the performance of a player in by means of a -dimensional feature vector , where is a feature that describes a specific aspect of ’s behavior in match and is computed from the set of events played by in that match. In our experiments at Section 4, we provide an example of features extracted from the Wyscout dataset. Some features count some events (e.g., number of fouls, number of passes, etc.), some others are at a finer level in that they distinguish the outcome of those events — i.e., if they were “accurate” or “not accurate”. Note that PlayeRank is designed to work with any set of features, thus giving to the user a high flexibility about the description and deployment of soccer performance.
Player Rating
The evaluation of the performance of a player in a single match is computed as the scalar product between the values of the features referring to match and the feature weights computed during the learning phase (Figure 1, step c2.2, described in the next Section 3.3). Each feature weight models the importance of that feature in the evaluation of the performance quality of any player.
Formally speaking, given the multi-dimensional vector of features and their weights , PlayeRank evaluates the performance of a player in a match as follows:
| (1) |
The quantity is called the performance rating of in match , where is a normalization constant such that . Since we decided to not include the number of goals scored in a match into the set of features, for reasons that are explained in Section 3.3 (learning phase), but goals could themselves be important to evaluate the performance of some (offensive) players, PlayeRank can be adapted to manage goals too via an adjusted-performance rating, defined as follows:
| (2) |
where indicates the number of goals scored by in match normalized in the range , and is a parameter indicating the importance given to goals into the new rating. Clearly, when , and when .
Finally, PlayeRank computes the rating of a player over a series of matches by aggregating ’s ratings over those matches according to a function which, in this paper, is set to the Exponential Weighted Smoothing Average (EWMA). This way, the performance quality of player after matches is computed as:
| (3) |
where is a proper smoothing factor set in the range . In other words, the performance quality of player after matches, i.e. , is computed as the weighted average of the rating reported by in the last match and the previous smoothed ratings . This way we are counting more the recent performances of players. Similarly, the goal-adjusted rating of given a series of matches is computed as the EWMA of his adjusted performance ratings. The quantity is called the player rating of player given , while is called the adjusted-player rating of player given .
3.2. Ranking phase.
Based on the players ratings computed in the previous phase, PlayeRank constructs a set of role-based rankings , each corresponding to one of the roles identified by a role detector (step c1.2, described in the next Section 3.3), an algorithm previously trained during the learning phase which assigns to one or more roles each player in a match . PlayeRank assigns a player to if he has at least % of the matches in assigned to role , where is a parameter chosen by the user. In our experiments at Section 4 we select , a choice dictated by the fact that arguably a soccer player may be assigned to at most two roles. Experiments showed this threshold is robust, however this parameter can be chosen by the user when running PlayeRank, possibly increasing the number of assigned roles per player (i.e., his versatility). Depending on the value of the threshold , a player can appear in more than one ranking and with different ranks since they depend on .
3.3. Learning phase.
The learning phase (Figure 1c) is executed ”offline”in order to generate information used in the rating and the ranking phases. It consists of two main steps: feature weighting and role detector training.
Feature weighting
Performance evaluation is a difficult task because we do not have an objective evaluation of the performance of each individual player . This technically means that we do not have a ground-truth dataset to learn a relation between performance features and performance quality of in match . On the other hand, we observe that the outcome of a match may be considered a natural proxy for evaluating performance quality at team level. Therefore, we overcome that limitation by proposing a supervised approach: we determine the impact of the chosen features onto a player performance by looking in turn at the team-wise contribution of these features to the match outcome.
This idea is motivated by the fact that (i) a team’s ultimate purpose in a match is to win by scoring one goal more than the opponent, (ii) some actions of players during a match have a higher impact on the chances of winning a match than others. For example, making a pass which puts a teammate in condition to score a goal (assist) is intuitively more valuable than making a pass to a close teammate in the middle of the field. Conversely, getting a red card is intuitively less valuable than, let’s say, winning a dribble against an opponent. Therefore those actions which strongly increase (or decrease) the chances of winning a match must be evaluated more during the evaluation, either positively or negatively. While soccer practitioners and fans have in mind an idea of what the most and the least valuable actions during a match are, it is important to develop a data-driven and automatic procedure that quantifies how much valuable an action is with respect to increasing or decreasing the chances of winning a match.
PlayeRank implements this syllogism via a two-phase approach. In the first phase (Figure 1, step c2.1) it extracts the performance vector of team in match and the outcome of that match: where indicates a victory for team in match and indicates a non-victory (i.e., a defeat or a draw) for . The team performance vector is obtained by summing the corresponding features over all the players composing team in match :
In the second phase (Figure 1, step 2.2), PlayeRank solves a classification problem between the team performance vector and the outcome . This classification problem has been shown in (Pappalardo and Cintia, 2017) to be meaningful, because there is a strong relation between the team performance vector and the match outcome. We use a linear classifier, such as the Linear Support Vector Machine (SVM), to solve the previous classification problem and then we extract from the classifier the weights which quantify the influence of the features to the outcomes of soccer matches, as explained above.
These weights are then used in the rating phase (Figure 1, step b2) to compute the performance ratings of players.
Role detector training
As pointed out in (Shulte and Zhao, 2017; Pettigrew, 2015), performance ratings are meaningful only when comparing players with similar roles. In soccer, each role corresponds to a different area of the playing field where a player is assigned responsibility relative to his teammates (Bialkowski et al., 2014). Different roles imply different tasks, hence it is meaningless to compare, for example, a player that is asked to create goal occasions and a player that is asked to prevent the opponents to score. Furthermore, a role is not a unique label as a player’s area of responsibility can change from one match to another and even within the same match. Given these premises, we decided to design and implement an algorithm able to detect the role associated with a player’s performance in a match based on the soccer-logs. We observe that they do exist methods, originally designed for hockey (Shulte and Zhao, 2017), that compute the roles of players via an affinity clustering applied over a heatmap describing their presence in predefined zones of the field. But these approaches are arguably not effective in soccer because it offers a lower density of match events w.r.t. hockey. Nonetheless we experimented and discarded the approach of (Shulte and Zhao, 2017) because it produces on our dataset a clustering with a very low quality (i.e., silhouette score ).
Conversely, PlayeRank detects the role of a player in a match by looking at his average position. This is motivated by the fact that a player’s role is often defined as the position covered by the player relative to his teammates (Bialkowski et al., 2014). This is called the center of performance for in and it is denoted as , where and are the average coordinates of ’s events in match , as they are extracted from the soccer-logs (Figure 1, step c1.1). Then PlayeRank deploys a -means algorithm (Hartigan and Wong, 1979) to group the centers of performance of all players in all matches (Figure 1, step 1.2).
PlayeRank also accounts for the possibility of having “hybrid” roles where a center of performance is assigned to two or more clusters. This is useful in situations where the center of performance of a player is between two or more clusters, and so the role of in match cannot be well characterized by just one single cluster. Therefore, PlayeRank aims at a finer classification of roles via a soft clustering. For every center of performance occurring in some cluster , PlayeRank computes its -silhouette with respect to every other cluster () as:
| (4) |
where is the average distance between and all other points in cluster . PlayeRank assigns to every cluster for which , where is a threshold indicating the tolerance to “hybrid” centers. If no such does exist, is assigned to the cluster given by the partitioning computed by the -means algorithm.
For the sake of completeness we mention that in approaching the task of role classification we have considered other, more sophisticated modeling of players’ performance such as heatmaps (as in (Shulte and Zhao, 2017), see comments above) or events direction (as in (Bialkowski et al., 2014)), but clusters were of lower quality in terms of the silhouette score.
4. Experimental Results
We implemented the PlayeRank framework and executed it on a massive database of soccer-logs provided by the company Wyscout (wys, [n. d.]). In this section, we show experiments for each of the modules described in Section 3 and depicted in Figure 1.
4.1. Wyscout dataset
We use a database of soccer-logs provided by Wyscout consisting of 31,496,332 events, capturing matches, 296 clubs and players of several seasons of 18 prominent competitions around the world (see Table 1): La Liga (Spain), Premier League (England), Serie A (Italy), Bundesliga (Germany), Ligue 1 (France), Primeira Liga (Portugal), Super Lig (Turkey), Souroti Super League (Greece), Austrian Bundesliga (Austria), Raiffeisen Super League (Switzerland), Russian Football Championship (Russia), Eredivisie (The Netherlands), Superliga (Argentina), Campeonato Brasileiro Série A (Brazil), UEFA Champions League, UEFA Europa League, FIFA World Cup 2018 and UEFA Euro Cup 2016.
| competition | area | type | #seasons | #matches | #events | #players |
| La Liga | Spain | national | 4 | 1520 | 2,541,873 | 1264 |
| Premier League | England | national | 4 | 1520 | 2,595,808 | 1231 |
| Serie A | Italy | national | 4 | 1520 | 2,610,908 | 1499 |
| Bundesliga | Germany | national | 4 | 1124 | 2,075,483 | 1042 |
| Ligue 1 | France | national | 4 | 1520 | 2,592,708 | 1288 |
| Primeira Liga | Portugal | national | 4 | 1124 | 1,720,393 | 1227 |
| Super Lig | Turkey | national | 4 | 1124 | 1,927,416 | 1182 |
| Souroti Super Lig | Greece | national | 4 | 1060 | 1,596,695 | 1151 |
| Austrian Bundesliga | Austria | national | 4 | 720 | 1,162,696 | 593 |
| Raiffeisen Super League | Switzerland | national | 4 | 720 | 1,124,630 | 647 |
| Football Championship | Russia | national | 4 | 960 | 1,593,703 | 1046 |
| Eredivisie | The Netherlands | national | 4 | 1248 | 2,021,164 | 1177 |
| Superliga | Argentina | national | 4 | 1538 | 2,450,170 | 1870 |
| Campeonato Brasileiro Serie A | Brazil | national | 4 | 1437 | 2,326,690 | 1790 |
| UEFA Champions League | Europe | continental | 3 | 653 | 995,363 | 3577 |
| UEFA Europa League | Europe | continental | 3 | 1416 | 1,980,733 | 9100 |
| UEFA Euro Cup 2016 | Europe | continental | 1 | 51 | 78,140 | 552 |
| FIFA World Cup 2018 | World | international | 1 | 64 | 101,759 | 736 |
| 64 | 19,619 | 31,496,332 | (*)21,361 |
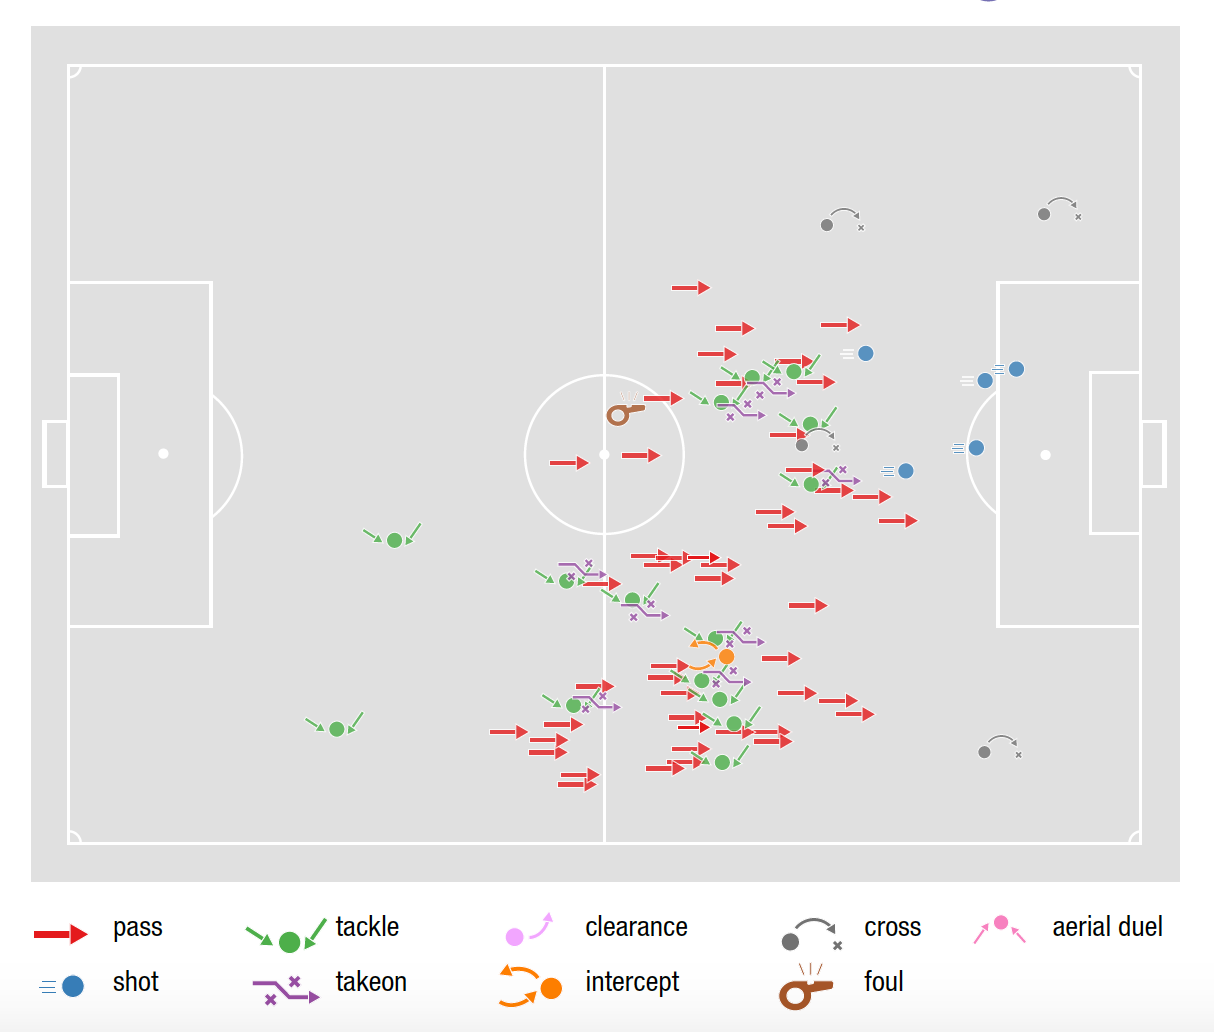
Each event records: (i) a unique event identifier; (ii) the type of the event; (iii) a time-stamp; (iv) the player related to the event; (v) the team of the player; (vi) the match in which the event is observed; (vii) the position on the soccer field, specified by a pair of integers in the range indicating the percentage from the left corner of the attacking team; (viii) the event subtype and a list of tags, that enrich the event with additional information (see Table 2). We do not consider the goalkeeping events available from the Wyscout APIs, as we discard goalkeepers from the analysis.333Goalkeepers would need a dedicated analysis since it is the only role having different game rules w.r.t. to all other players. Figure 3 shows an example of an event in the dataset, corresponding to an accurate pass by player 3344 (Rafinha) of team 3161 (Internazionale) made at second 2.41 in the first half of match 2576335 (Lazio - Internazionale) started at position (49, 50) of the field. Figure 2 shows a pictorial representation of the events produced by player Lionel Messi during a match in the Spanish La Liga, where each event is drawn at the position of the field where it has occurred.
| type | subtype | tags |
|---|---|---|
| pass | cross, simple pass | accurate, not accurate, key pass, opportunity, assist, (goal) |
| foul | no card, yellow, red, 2nd yellow | |
| shot | accurate, not accurate, block, opportunity, assist, (goal) | |
| duel | air duel, dribbles, tackles, ground loose ball | accurate, not accurate |
| free kick | corner, shot, goal kick, throw in, penalty, simple kick | accurate, not accurate, key pass, opportunity, assist, (goal) |
| offside | ||
| touch | acceleration, clearance, simple touch | counter attack, dangerous ball lost, missed ball, interception, opportunity, assist, (goal) |
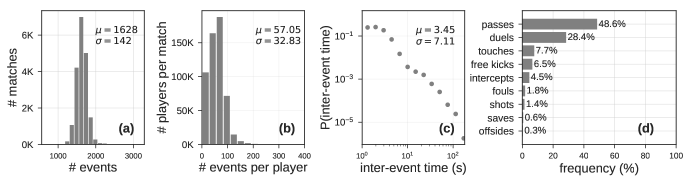
In the Wyscout dataset a match consists of an average of about 1,600 events, and for each player there are about 57 observed events per match (Figure 4a-b), with an average inter-time between two consecutive events of 3.45 seconds (Figure 4c). Passes are the most frequent events, accounting for around 50% of the total events (Figure 4d). Wyscout soccer-logs adhere to a standard format for storing events collected by semi-automatic systems (Gudmundsson and Horton, 2017; Stein et al., 2017; Rein and Memmert, 2016) and do not include off-ball actions. Moreover, given the existing literature on the analysis of soccer matches (Brooks et al., 2016; Pappalardo and Cintia, 2017; Gyarmati et al., 2014; Gyarmati and Hefeeda, 2016; Cintia et al., 2015a; Pappalardo et al., 2017), we can state that the Wyscout dataset we use in our experiments is unique in the large number of events, matches and players considered, and for the length of the period of observation.
4.2. Performance extraction
We compute the players’ performance vectors by a two-step procedure. First, we define a feature for every possible combination of type, subtype and tag shown in Table 2. For example, given the foul type, we obtain four features: foul no card, foul yellow, foul red and foul 2nd yellow. We discard the goal tag since we have implicitly considered the goals as the outcome of a performance during the learning phase. Nevertheless goals can be still included in the performance rating by Equation (2) in Section 3.1. Eventually we extracted 76 features from the Wyscout soccer-logs, and normalized them in the range in order to guarantee that all features are expressed in the same scale (see Table 6 for a list of all the features).
We tried more sophisticated features by considering the field zones where events have occurred or the fraction of the match when they have occurred, but we didn’t find any significant difference w.r.t. the results presented below.
Second, we build the performance vector for a player in match by counting the number of events of a given type, subtype and tag combination that player produced in . For example, the number of fouls without card made by in compose the value of feature foul no card of in .
4.3. Role detection
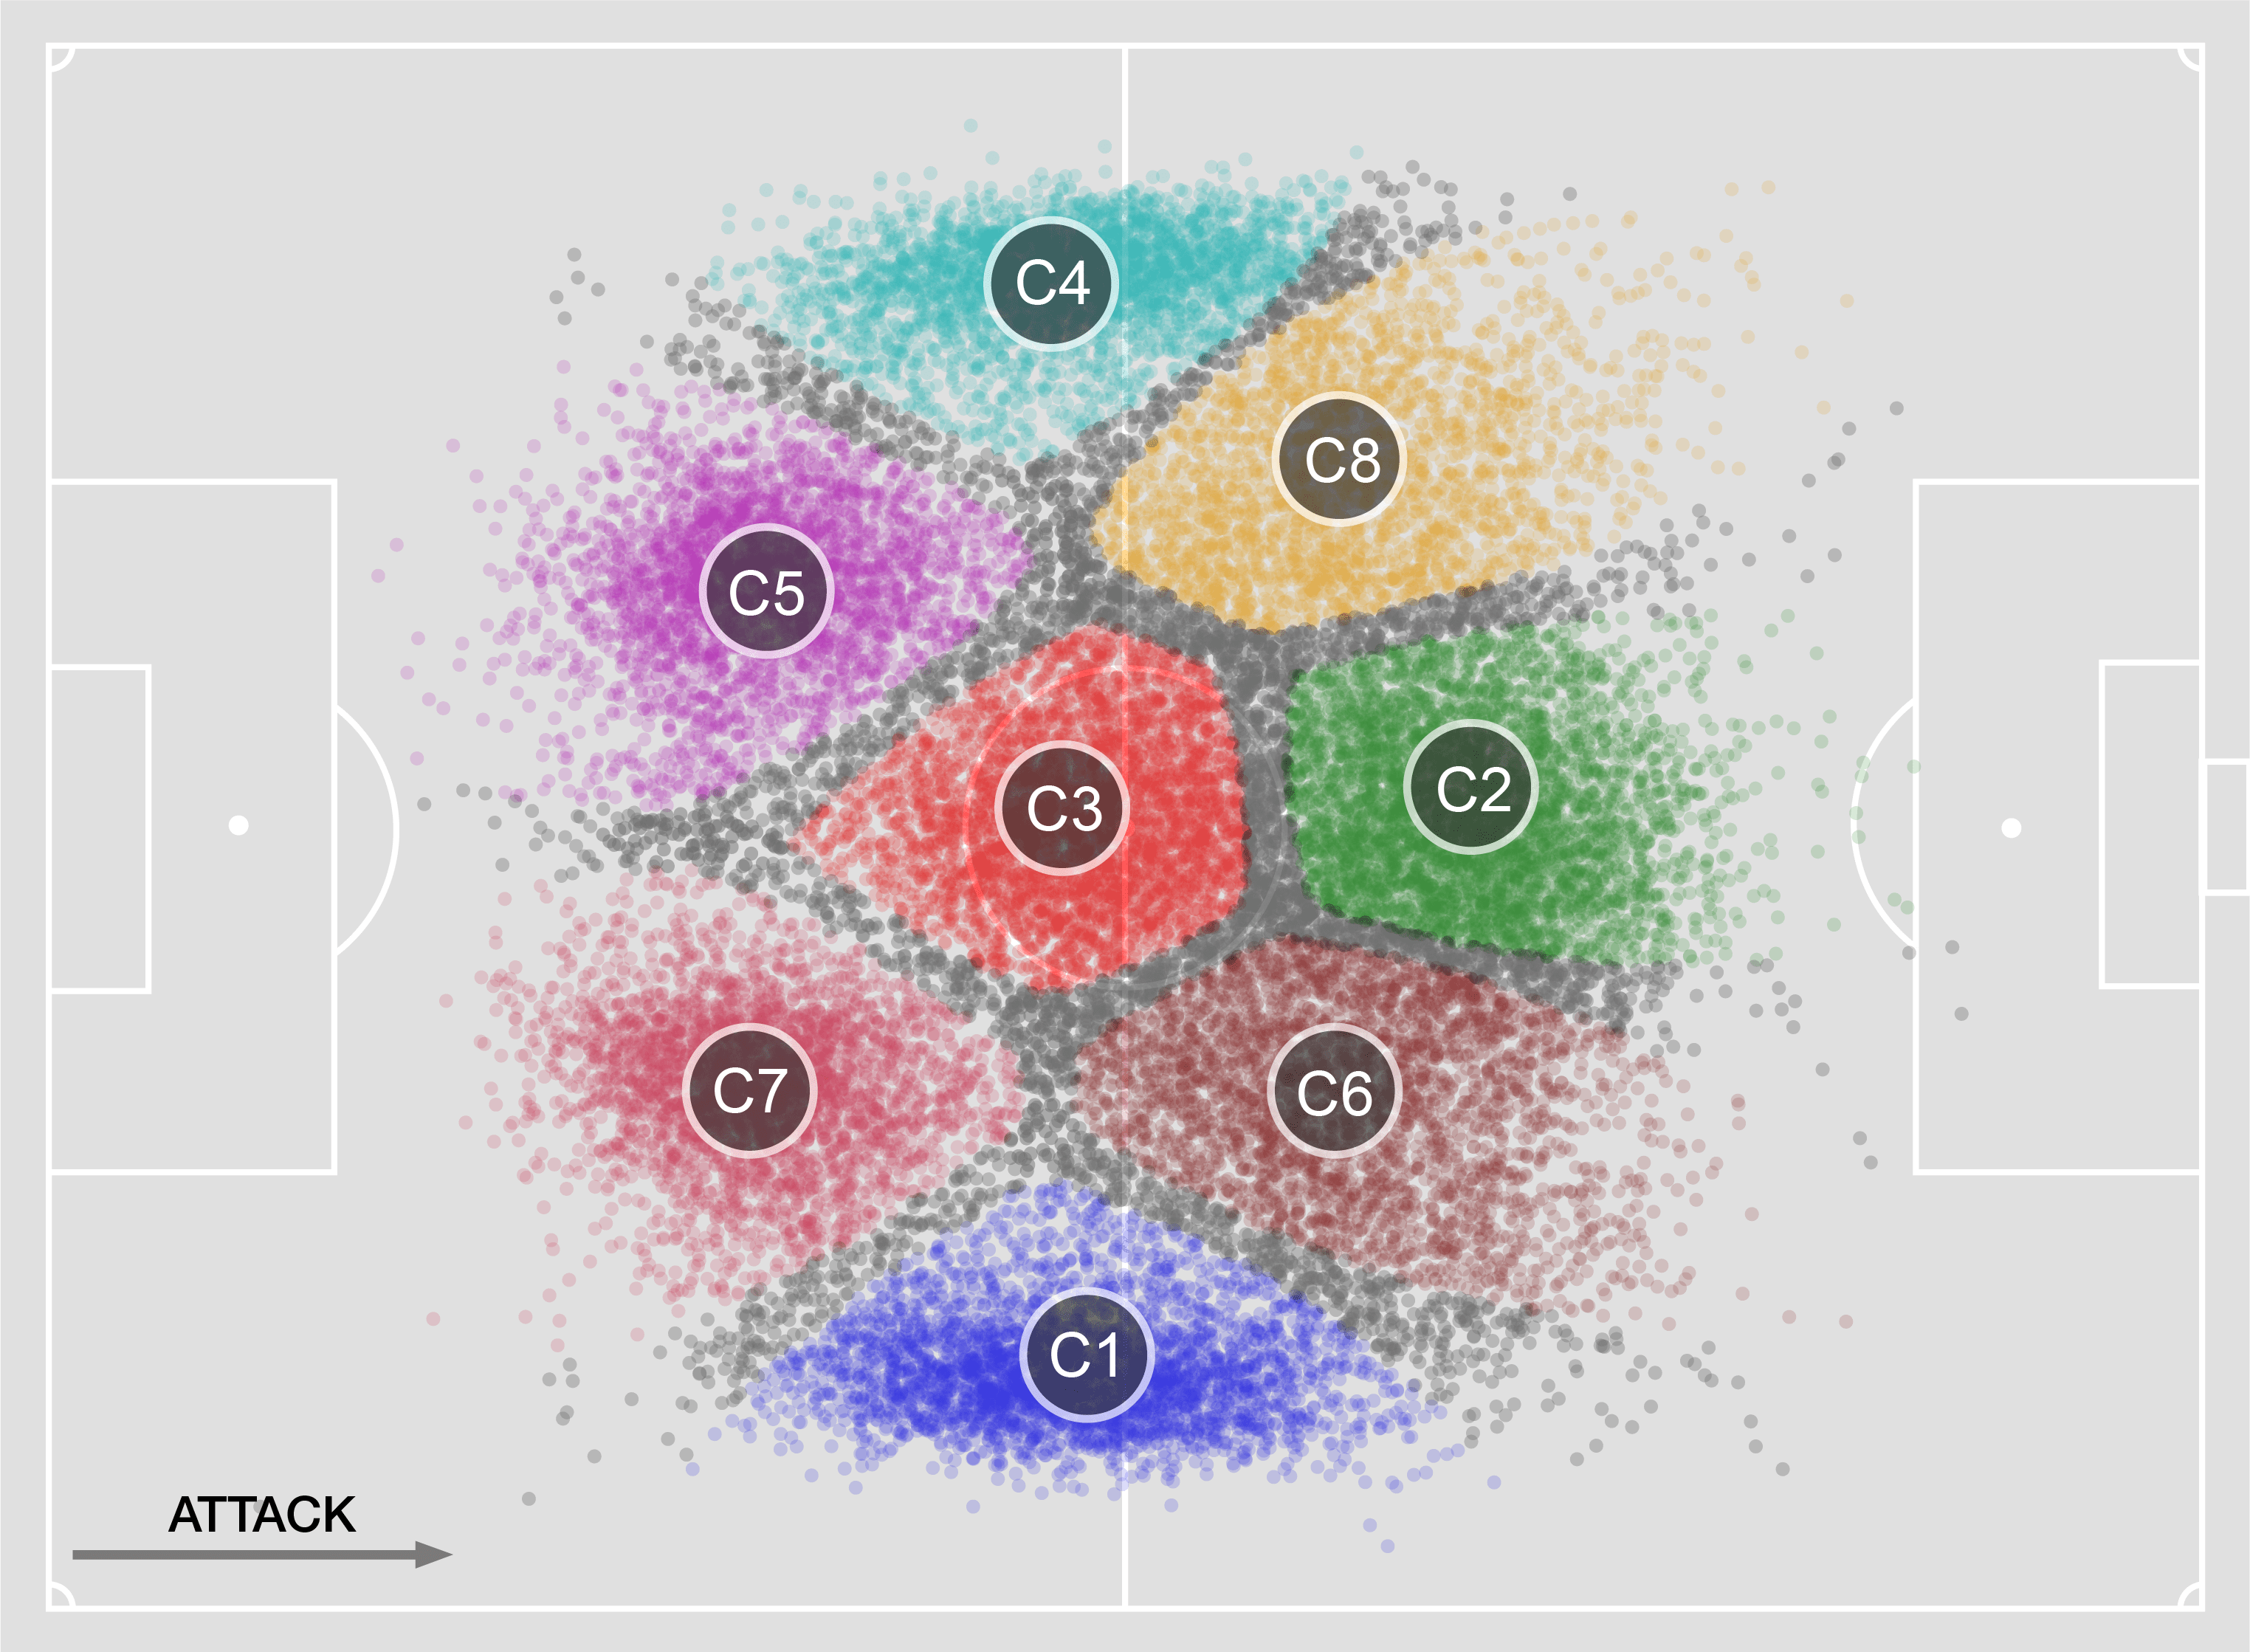
To discover roles from the Wyscout dataset we execute the role detection algorithm of Section 3.3 by varying and specifying , which implies that 5% of the centers are classified as hybrids.444Experiments on the Wyscout dataset have shown that the number of hybrid centers increases linearly with , from none to all centers. We observe that provides the best clustering in terms of silhouette score () and that these results are stable across several executions of the experiment where different sets of centroids are used to initialize the -means algorithm.
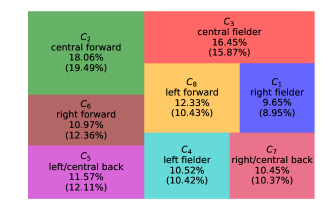
Figure 5 shows the result of the -means clustering. We asked professional soccer scouts, employed by Wyscout, to provide an interpretation of the 8 clusters with terms suitable for soccer practitioners. An explanation for the clusters C1-C8, as well as a set of players typically in each role, are provided in Table 3.
| cluster | name | description | examples |
|---|---|---|---|
| C1 | right fielder | plays on the right side of the field, as a wing, back, or both | Sergi Roberto, Danilo |
| C2 | central forward | plays in the center of the field, close to the opponent’s area | Messi, Suárez |
| C3 | central fielder | plays in the center of the field | Kroos, Pjanić |
| C4 | left fielder | plays on the left side of the field, as a wing, back, or both | Nolito, Jordi Alba |
| C5 | left central back | plays close to his own goal, preferably on the left | Bartra, Maguire |
| C6 | right forward | plays on the right side of the field, close to the opponent’s area | Robben, Dembélé |
| C7 | right central back | plays close to his own goal, preferably on the right | Javi Martínez, Matip |
| C8 | left forward | plays on the left side of the field, close to the opponent’s area | Neymar, Insigne |
It is worth to notice that, while there are 10 players in a team (excluding the goalkeeper), the clustering algorithm detected 8 roles. This means that there is at least one cluster (i.e. role) having more than one player in each team. Moreover the correspondence with classic roles is not perfect in that two players classified in two different classic roles can appear in the same cluster, and vice versa.
Figure 6 shows how the performances and the players are distributed among the detected roles, where each player is assigned to the role he covers most frequently during the matches of the available seasons. We find that role (central forward) is the most common role covering 18% of performances and 19% of players, followed by role (central fielder) covering 16% of performances and 15% of players. All other roles are almost equally populated.
4.4. Feature weighting
As discussed in Section 3.3, PlayeRank turns the problem of estimating the feature weights into a classification problem between a team performance vector and a match outcome. We instantiate this problem by creating, for each match , two examples and , that correspond to the performance vectors of two playing teams and , and the match outcome label that is 1 if a team wins and 0 otherwise. The resulting dataset consists of examples, 80% of which are used to train a Linear Support Vector Machine (SVM). We have selected the cost parameters that had the maximum average Area Under the Receiver Operating Characteristic Curve (AUC) on a 5-fold cross validation. We validate SVM on the remaining 20% of the examples, finding an (, accuracy), significantly better than a classifier which always predicts the most frequent outcome (i.e., non-victory, , , accuracy) and a classifier which chooses the label at random based on the distribution of victories and non-victories (, , accuracy). We also experimented with different labelling of by defining either in the case of defeat and otherwise, or by defining a ternary classification problem where indicates a victory, a defeat and a draw. In all these cases we did not find any significant difference in the feature weights described below, so that we chose to deploy the binary classification problem above.
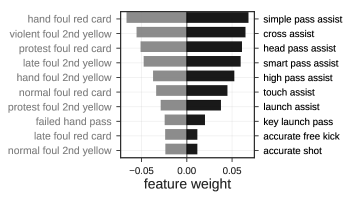
Figure 8 shows the top-10 (black bars) and the bottom-10 (grey bars) feature weights resulting from SVM. We find that assist-based features are the most important ones, followed by the number of key passes and the accuracy of shots. In contrast, getting a red/yellow card gets a strong negative weight, especially for hand and violent fouls. It is interesting to notice that, though these choices are pretty natural for who is skilled in soccer-player evaluations, PlayeRank derived them automatically by just looking at the massive soccer-logs provided by Wyscout.
For the sake of completeness of our experimental results, we also repeated the classification task separately: (i) competition by competition, i.e., we created 18 SVMs each one trained on the matches of one competition only; (ii) role by role, i.e., we created 8 SVMs each one trained on the examples created from players tagged with one role only (Section 4.3).
Competition-based weights.
We extracted for each of the 18 competitions the corresponding set of weights () and quantified the difference between the weights extracted from all competitions and the s via the Normalized Root-Mean-Square Error:
| (5) |
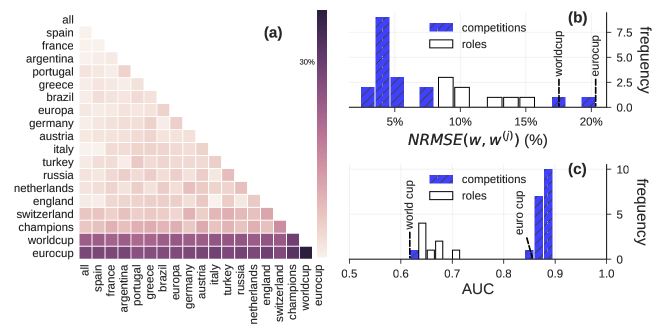
where and are the maximum and the minimum weights in , respectively. We found that the average is around 6% and that 16 out of 18 competitions have (Figure 7b), indicating that the difference between any and is small and hence the relation between team performance and match outcome is in most of the cases independent of the specific competition for clubs considered. Only for competitions involving national teams, such as UEFA Euro Cup 2016 and FIFA World Cup 2018, the is higher, 17% and 20% respectively (Figure 7b). This can be due either to the fact that: (i) these two competitions have a few matches (51 and 64 respectively, see Table 1) or that (ii) while all the other competitions refer to soccer clubs, UEFA Euro Cup 2016 and FIFA World Cup 2018 are competitions for national teams, which are generally more unpredictable (Cintia et al., 2015a; Cintia et al., 2015b). Figure 7c indicates that the accuracy of the SVM model trained on the 64 matches of the FIFA World Cup 2018 is lower than the accuracy of the other models, suggesting that the number of matches in a competition influences the accuracy of the model. However, the accuracy of the SVM model trained on the UEFA Euro Cup 2016 is close to the accuracy of all other models, suggesting that the difference in the weights can be also due to the specific nature of the competition.
Role-based weights.
We repeated the classification task separately role by role by aggregating the players’ feature role by role. We found that: (i) the accuracy of the SVM models trained on the roles separately are lower than the accuracy of the models trained on the competitions, though the role-based model’s accuracy is still higher than the model trained on the FIFA World Cup 2018 (Figure 7c); (ii) the between each role’s set of weights and the set of weights trained on all competitions together is lower than 15% (Figure 7b). This indicates that there is a small variation between the competition-based and the role-based sets of weights. For this reason, we will just use (i.e., the set of weights computed at match level including all competitions) in the computation of the ratings in the following sections.
4.5. Player ratings and rankings
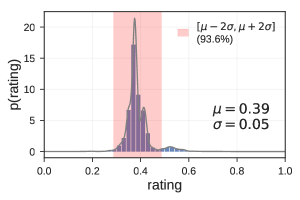
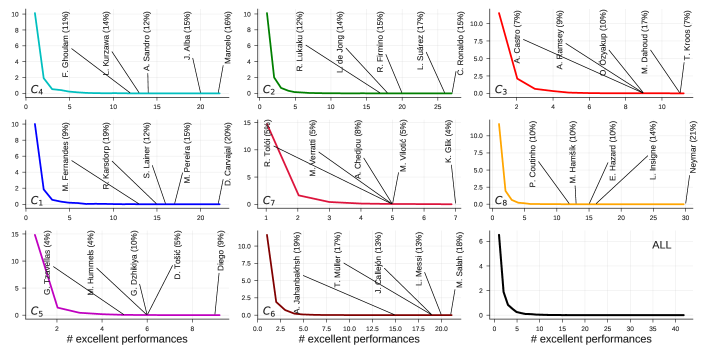
Given , we compute the performance rating for each player in each match and then explore their distribution. As Figure 9 shows, the distribution is strongly peaked around its average (), indicating that “outlier” performances (i.e., , is the standard deviation) are rare. In particular, excellent performances (i.e., ), accounting for just 5% of the total, are unevenly distributed across the players. Indeed, the distribution of the number of excellent performances per player is long-tailed (Figure 12, ALL): while the majority of players achieve a few excellent performances, a tiny fraction of players achieve up to 40 excellent performances during the five years. This trend is observed also when we split performances by the player’s role, highlighting the presence of a general pattern (Figure 12, -).
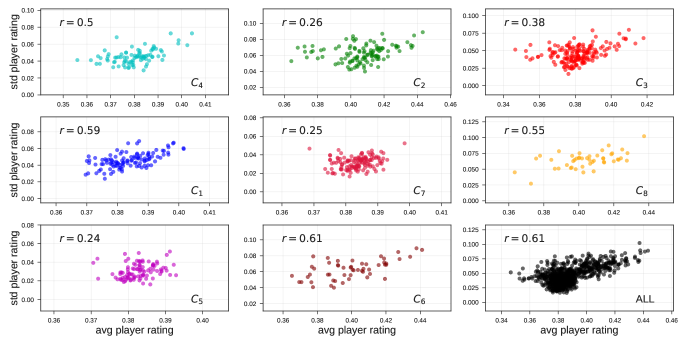
As an example, let us consider all performances of role (left forward): most of the players achieve excellence just once, while a few players achieve as many as 30 (Neymar, 21% of his performances), 16 (L. Insigne, 14%) and 15 (E. Hazard, 10%) excellent performances. Moreover, we find that a correlation exists between a player’s average performance rating and the variability of his ratings (Figure 13): the stronger a player is (i.e., the higher his average performance rating), the more variable his performance ratings are (i.e., the higher is the standard deviation of his ratings). In other words, the best players do not play excellence in every match, they just achieve excellence more frequently than the other players. Taken together, Figures 9, 12 and 13 indicate that: (i) excellent performances are rare (5% of the total); (ii) just 11% of the players achieve excellent performances at least once; (iii) while a small set of players repeatedly achieve excellence, all other players do a few times, suggesting that the best players do not always play excellence but they just achieve it more frequently; (iv) excellent performances are at most 21% (Neymar) and on average 9% of all the performance of players who reach excellence at least once.
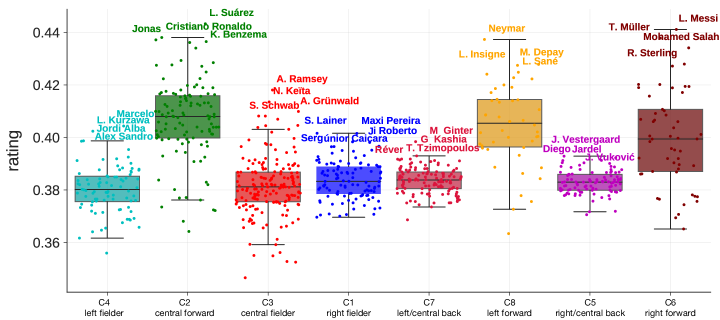
By aggregating the performance rating of each player over the whole series of matches, we compute the player rating . Figure 10 visualizes the distribution of these player ratings by grouping the players on the x-axis according to their roles. We recall that we are assigning a player to a role if he plays at least 40% of the matches in that role, meaning that a player may be assigned to at most two roles among the 8 roles detected. We observe a different distribution of ratings according to the players’ roles, both in terms of range of values and their concentration. This fully justifies the design of the role detection module in the PlayeRank framework. In fact we notice that the top-ranked player of cluster , Marcelo, gets a player rating which is below the average of the ratings of clusters or (Figure 10).
Table 4 reports the top-10 players grouped by the 8 roles. Although PlayeRank is fully data-driven, it is able to place the most popular players at the top of some ranking. For example, Lionel Messi (Barcelona) is the best player in cluster (see Figure 5), followed by other renowned players such as Thomas Müller (Bayern Munich) and Mohamed Salah (Liverpool). Instead, the best player in cluster (central forward) is Luís Suárez (Barcelona), preceding Cristiano Ronaldo (Juventus), Jonas (Benfica) and Benzema (Real Madrid). Other renowned players are at the top of their role’s ranking, such as Neymar (PSG, cluster , left forward) and Marcelo (Real Madrid, cluster , left fielder).
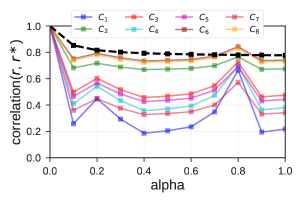
What it is surprising in these role-based rankings is that they have been derived by PlayeRank without considering the number of goals scored by players when building the performance vector. Actually, we observe that in general the goal-adjusted ranking is consistent with for all values of (Eq. 2): as the black dashed curve in Figure 11 shows, the correlation between the player rating and the adjusted-player rating slightly decreases with , with values that are in general . However, when investigating how the correlation changes with role by role, we find that while offensive-oriented roles like (central forward), (right forward) and (left forward) show in general high correlations between those ratings (), roles (central fielder), (left central back), (left fielder) shows moderate correlations (), while role (right fielder) shows low correlation (). This result suggests that the player rating of offensive players is not much influenced by the number of goals scored, presumably because they are already associated with events related to scoring.
| r | player | club | r | player | club | r | player | club | |||
| cluster 4 - left fielder | .404 | Marcelo | R. Madrid | cluster 2 - central foward | .404 | L. Suárez | Barcelona | cluster 3 - central fielder | .404 | A. Ramsey | Arsenal |
| .402 | L. Kurzawa | PSG | .402 | C. Ronaldo | Juventus | .402 | N. Keïta | RB Leipzig | |||
| .399 | Alex Sandro | Juventus | .399 | Jonas | Benfica | .399 | A. Grünwald | A. Wien | |||
| .399 | Jordi Alba | Barcelona | .399 | K. Benzema | R. Madrid | .399 | S. Schwab | R. Wien | |||
| .395 | J. Willems | Eintracht F. | .395 | D. Mertens | Napoli | .395 | J. van Overeem | AZ | |||
| .393 | D. Alaba | Bayern M. | .393 | L. de Jong | PSV | .393 | O. Özyakup | Beşiktaş | |||
| .392 | Marcos Alonso | Chelsea | .392 | S. Agüero | Man City | .392 | A. Dzagoev | CSKA M. | |||
| .392 | B. Davies | Tottenham | .392 | Son Heung-Min | Tottenham | .392 | C. Tolisso | Bayern M. | |||
| .391 | D. Kombarov | Spartak M. | .391 | D. Alli | Tottenham | .391 | R. Nainggolan | Roma | |||
| .390 | J. Brenet | PSV | .390 | A. Dzyuba | Zenit | .390 | B. N’Diaye | Stoke City | |||
| cluster 1 - right fielder | .402 | S. Lainer | Salzburg | cluster 7 - central back | .402 | M. Ginter | Borussia M. | cluster 8 - left forward | .402 | Neymar | PSG |
| .402 | Maxi Pereira | Porto | .402 | G. Kashia | Vitesse | .402 | M. Depay | Olympique L. | |||
| .398 | Sergi Roberto | Barcelona | .398 | Réver | Flamengo | .398 | L. Insigne | Napoli | |||
| .398 | Júnior Caiçara | Istanbul B. | .398 | T. Tzimopoulos | PAS | .398 | L. Sané | Man City | |||
| .397 | Daniel Carvajal | R. Madrid | .397 | M. Yumlu | Akhisar | .397 | M. Hamšík | Napoli | |||
| .397 | L. De Silvestri | Torino | .397 | Hilton | Montpellier | .397 | M. Dabbur | Salzburg | |||
| .397 | Ricardo Pereira | Leicester | .397 | T. Alderweireld | Tottenham | .397 | E. Hazard | Chelsea | |||
| .396 | D. Caligiuri | Schalke | .396 | Bruno Silva | Cruzeiro | .396 | P. Coutinho | Barcelona | |||
| .395 | N. Skubic | Konyaspor | .395 | Y. Ayhan | Osmanlıspor | .395 | I. Perišić | Inter | |||
| .395 | S. Widmer | Udinese | .395 | J. Schunke | Estudiantes | .395 | Isco | R. Madrid | |||
| cluster 5 - central back | .393 | J. Vestergaard | Southampton | cluster 6 - right forward | .393 | L. Messi | Barcelona | ||||
| .392 | Jardel | Benfica | .392 | T. Müller | Bayern M. | ||||||
| .391 | J. Vuković | Hellas Verona | .391 | M. Salah | Liverpool | ||||||
| .391 | Diego | Antalyaspor | .391 | R. Sterling | Man City | ||||||
| .390 | Raúl Silva | Sporting Braga | .390 | G. Bale | R. Madrid | ||||||
| .390 | D. Siovas | Leganés | .390 | S. Mané | Liverpool | ||||||
| .390 | M. Hummels | Bayern M. | .390 | K. Bellarabi | B. Leverkusen | ||||||
| .389 | C. Lema | Belgrano | .389 | B. Traoré | Olympique L. | ||||||
| .389 | L. Perrin | Saint-Étienne | .389 | Gelson Martins | A. Madrid | ||||||
| .389 | S. Ignashevich | CSKA M. | .389 | A. Candreva | Inter |
5. Validation of PlayeRank
Existing player ranking approaches report judgments that consist mainly of informal interpretations based on some simplistic metrics (e.g., market value or goals scored (Torgler and Schmidt, 2007; Stanojevic and Gyarmati, 2016; Brooks et al., 2016)). It is important instead to evaluate the goodness of ranking and performance evaluation algorithms in a quantitative manner, through the help of human experts as done for example for the evaluation of recommender systems in information retrieval.
We validated PlayeRank by creating and submitting a survey to three professional soccer talent scouts, employed by Wyscout, hence particularly skilled at evaluating and comparing soccer players. Our survey consisted of a set of pairs of players randomly generated by a two-step procedure, defined as follows. First, we randomly selected 35% of the players in the dataset. Second, for each selected player we cyclically iterated over the ranges , and and selected one value, say , for each of these ranges, and then picked the player being positions above and the one being positions below in the role-based ranking (if they exist). This generated a set of 211 pairs involving 202 distinct players.
For each pair , each soccer scout was asked to select the best player between and , or to specify that the two players were equally valuable. For each such pair, we also computed the best player according to PlayeRank by declaring stronger than if precedes in the ranking. We then discarded from all pairs for which there is not a majority among the evaluations of the soccer experts: namely, either all experts expressed equality or two experts disagreed in judging the best player and the third one expressed equality. As a result of this process, we discarded 8% of ’s pairs.
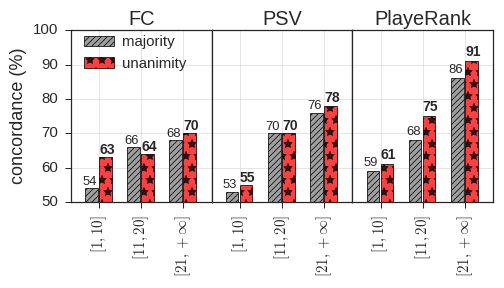
Over the remaining ’s pairs, we investigated two types of concordance among the scouts’ evaluations: (i) the majority concordance defined as the fraction of the pairs for which PlayeRank agrees with at least two scouts; (ii) the unanimous concordance defined as the fraction of pairs for which the scouts’ choices are unanimous and PlayeRank agrees with them. We found that and , indicating that PlayeRank has in general a good agreement with the soccer scouts, compared to the random choice (for which ). Figure 14 offers a more detailed view on the results of the survey by specializing and on the three ranges of ranking differences: . The bars show a clear and strong correlation between the concordance among scouts’ evaluations (per majority or unanimity) and the difference between the positions in the ranking of the checked pairs of players: when the ranking difference is it is and ; for larger and larger ranking differences, PlayeRank achieves a much higher concordance with experts which is up to and when the ranking difference is . Clearly, the disagreement between PlayeRank with the soccer scouts is less significant when the players are close in the ranking (i.e., their distance ¡ 10). Indeed, the comparison between soccer players is a well-known difficult problem as witnessed by the significant increase in the fraction of unanimous answers by the scouts, which goes from a low 58% in the range to a reasonable 71% in the range . This a fortiori highlights the robustness of PlayeRank: the scouts disagreement decreases as pairs of players are farther and farther in the ranking provided by PlayeRank.
As a final investigation, we compared PlayeRank with the Flow Centrality (FC) (Duch et al., 2010) and the PSV (Brooks et al., 2016) metrics, which constitute the current state-of-the-art in soccer-players ranking (see Section 2). These metrics are somewhat mono-dimensional because they exploit just passes or shots to derive the final ranking. Figure 14 (right) shows the results obtained by FC and PSV over our set of players’ pairs evaluated by the three Wyscout experts. It is evident that FC and PSV achieve significantly lower concordance than PlayeRank with the experts: for PSV, the majority concordance ranges from 53% to 76%, while the unanimity concordance ranges from 55% to 78%; for FC the majority concordance ranges from 54% to 68%, while the unanimity concordance ranges from 63% to 70%. So that PlayeRank introduces an improvement which is up to 16% (relative) and 13% (absolute) with respect to PSV, and and an improvement of 30% (relative) and 21% (absolute) with respect to FC.
6. Applications
To demonstrate its usefulness, in this section we show two examples of analytical services that can be designed using PlayeRank: the retrieval of players in a database of soccer-logs and the computation of the players’ versatility.
6.1. Retrieval of players
One of the most useful applications of PlayeRank is searching players in a soccer-logs database. The search is driven by a query formulated in terms of a suitable query language that considers the events occurring during a match and their position on the field. Since we do not want to enter in the formal definition of the full query language, which is beyond the scope of this paper, we concentrate here only on its specialties that are the most interesting algorithmically for the issues we have discussed in this paper.
We propose the efficient solution of a spatial query over the soccer-field zones which possibly span more roles and have geometric forms that differ from the ones identified by the role detector. We assume a tessellation of the soccer field into zones of equal size . The query is modeled as a vector in which expresses how much relevant is the presence of the searched player in zone . Similarly, player is modeled as a vector in which expresses how much inclined is player to play in zone . We can go from binary vectors, that model interest/no interest for and presence/no presence for , to the more sophisticated case in which expresses a weighted interest for some specific zones and is finely modeled by counting, for example, the number of events played by in each zone . Now, given a query and the players in the soccer-logs database, the goal is to design an algorithm that evaluates the propensity of players to play in the field zones specified by . We follow the standard practice of Information Retrieval (IR) and compute for each player the dot product . We can efficiently compute this product by means of one of the plethora of solutions known in the IR literature (see e.g. (Ribeiro-Neto and Baeza-Yates, 1999; Manning et al., 2008)). In this respect we point out that known solutions work efficiently over million (and more) dimensions, so that they easily scale to the problem size at hand, because if we would assume zones of size !
Finally PlayeRank ranks players according to their rating over a series of matches and their propensity to play in the queried zones by sorting the players in decreasing order of the following score:
| (6) |
where is the dot product between and the player vector , and is ’s player rating over a series of matches. Note that the function could be defined in many other ways, for example by weighting and differently, in order to better capture the user’s needs. Other combinations will be investigated in the future.
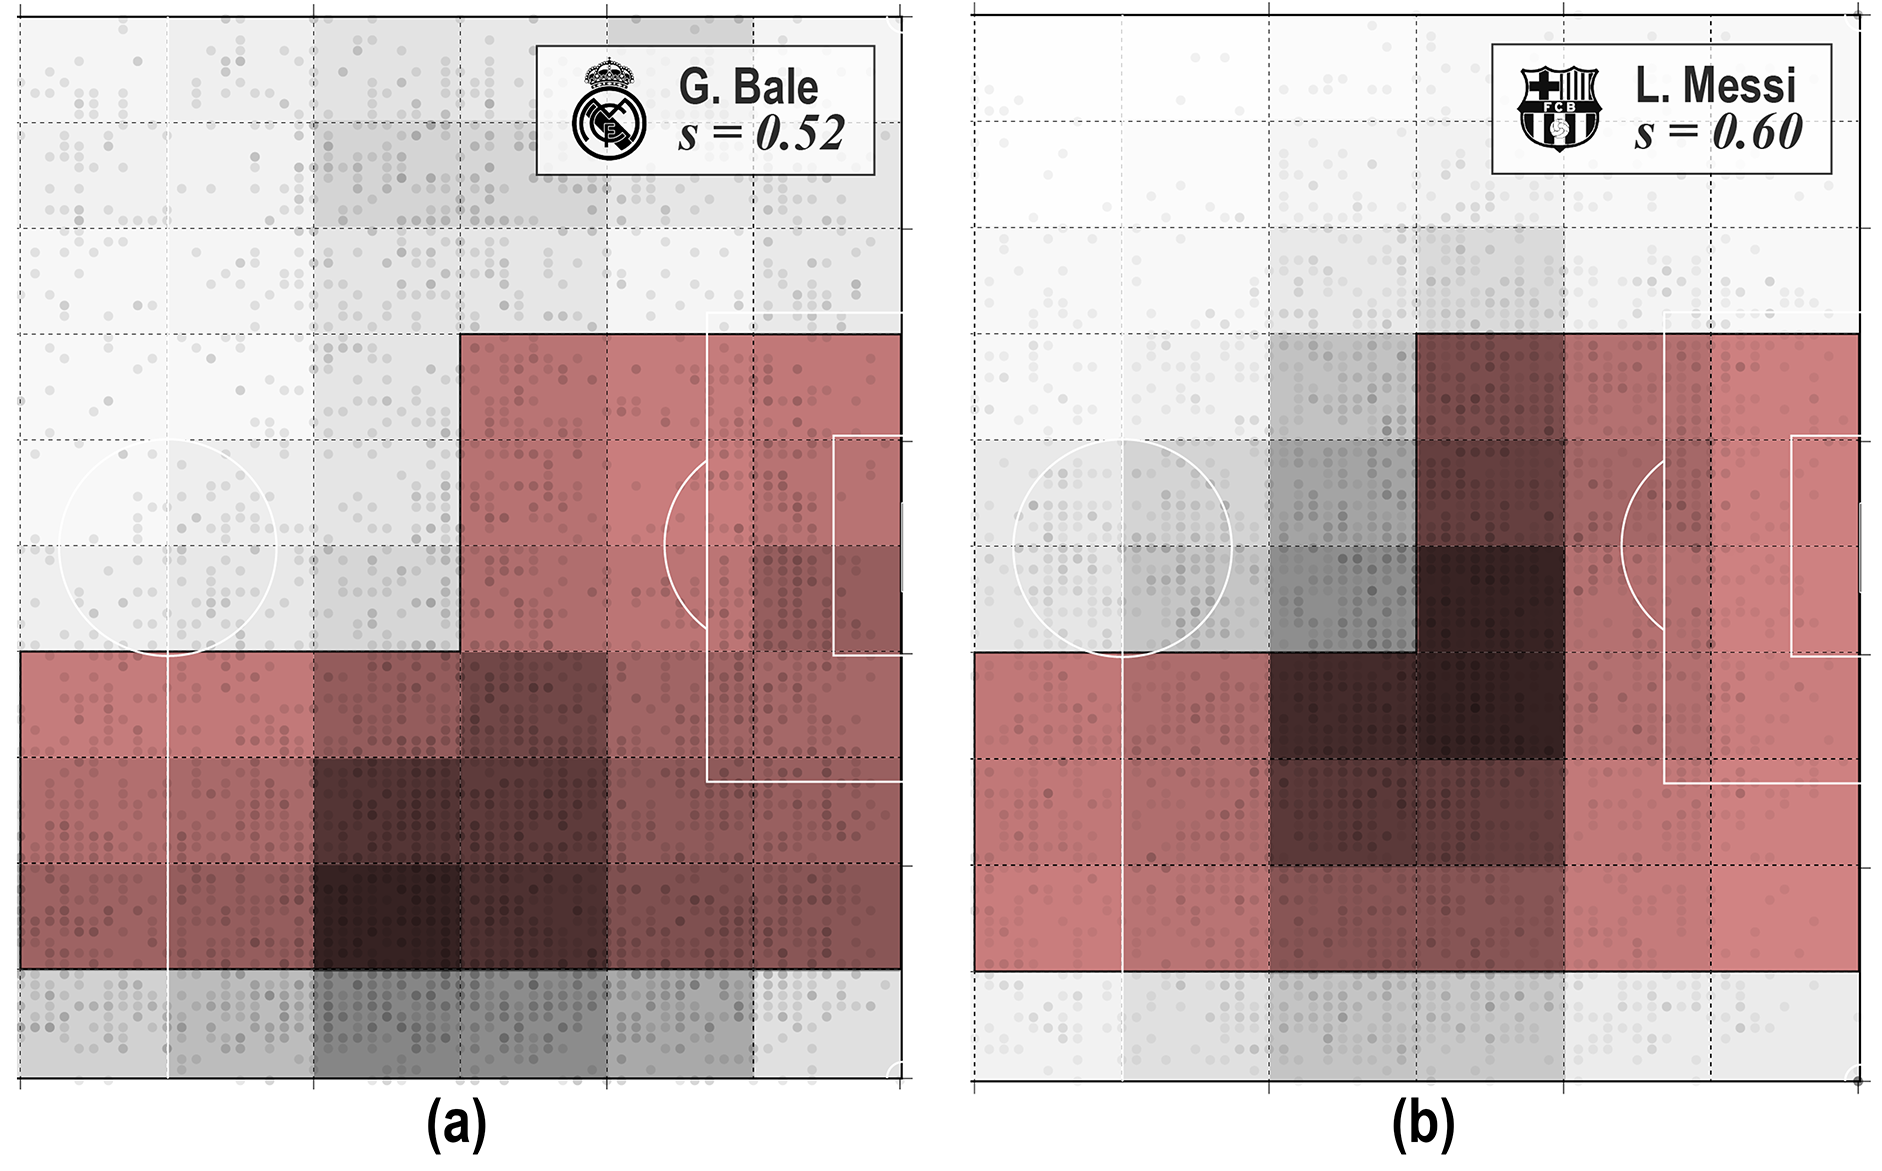
For the sake of presentation, we consider here a tessellation of the soccer field into 100 equal-sized zones and, thus, define a query as a binary vector of components which express the interest of the user about the “presence in a zone” for the searched players. Then PlayeRank computes as the dot product between and the player vector , and as the player rating over all matches of . Then players are ranked in decreasing order of the quantity as described above.
Table 5 shows the top-10 players in the our database according to their for an exemplar query showed in Figure 15. Lionel Messi, whose heatmap of positions is drawn in Figure 15b, has the highest . In the table, it is interesting to note that, though the vector of Arjen Robben is more similar to () than Messi’s vector (), Messi has a higher player rating (, ). As a result, the combination of the two quantities makes Messi the player offering the best trade-off between matching with the user-specified zones and performing well in those zones.
| player | club | ||||
|---|---|---|---|---|---|
| 1 | L. Messi | 0.28 | 0.60 | 0.46 | Barcelona |
| 2 | A. Robben | 0.26 | 0.61 | 0.43 | Bayern M. |
| 5 | M. Salah | 0.24 | 0.56 | 0.43 | Liverpool |
| 3 | L. Suárez | 0.24 | 0.54 | 0.45 | Barcelona |
| 4 | T. Müller | 0.24 | 0.56 | 0.43 | Bayern M. |
| 6 | R. Lukaku | 0.24 | 0.56 | 0.42 | Man. Utd |
| 7 | A. Petagna | 0.23 | 0.55 | 0.42 | Atalanta |
| 8 | D. Berardi | 0.22 | 0.54 | 0.41 | Sassuolo |
| 9 | Aduriz | 0.22 | 0.55 | 0.40 | A. Bilbao |
| 10 | G. Bale | 0.22 | 0.52 | 0.43 | R. Madrid |
6.2. Versatility
The role detector of PlayeRank enables the analysis of an important aspect of a player’s behavior: his versatility, that we define as a player’s propensity to change role from match to match. To investigate this aspect, we define the versatility of a player as the Shannon entropy of his roles in a series of matches :
| (7) |
where and is the probability of player of playing in role , computed as the ratio of the number of matches in in which played in role .
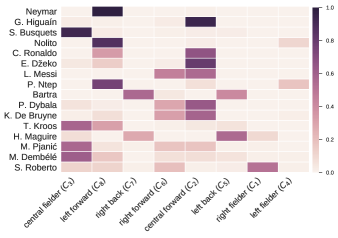
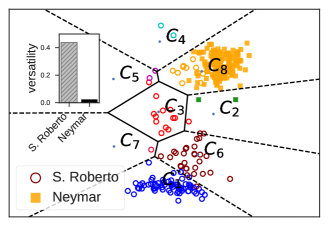
Figure 16 displays the frequency of playing in a role for a set of top soccer players. We observe that many players have a high versatility, i.e., they play in different roles across different matches. In particular, Sergi Roberto (Barcelona) and Neymar (PSG) are among the most versatile and the least versatile players, respectively. Figure 17 visualizes all the centers of performance of Sergi Roberto and Neymar, coloring the centers according to the role assigned by the role detector. We observe that Neymar’s centers of performance are concentrated in just one role (, left forward) while Sergi Roberto’s centers are scattered around the field, indicating that he plays in all 8 roles, witnessing a high versatility. Numerically, we observe that and . The versatility of a player is an important property to take into account when composing a club’s roster. PlayeRank embeds versatility within its analytic framework, allowing soccer practitioners and scouters to evaluate the flexibility of a player as well as his playing quality in an automatic way.
7. Conclusions and Future works
In this paper we presented PlayeRank, a data-driven framework that offers a multi-dimensional and role-aware evaluation of the performance of soccer players. Our extensive experimental evaluation on the massive database of soccer-logs provided by Wyscout – 18 competitions, 31 million events, 21 thousands players – showed that the rankings offered by PlayeRank outperform existing approaches in being significantly more concordant with professional soccer scouts. Moreover, our experiments showed several interesting results, shedding light on novel patterns that characterize the performance of soccer players. Indeed we found that excellent performances are rare and unevenly distributed, since a few top players produce most of the observed excellent performances. An interesting result is also that top players do not always play excellence, they just achieve excellent performances more frequently than the other players. Regarding the extraction of feature weights, we found that the difference between the weights extracted from each competition separately is small (i.e., ¡ 10%) with the only exception of the Euro Cup and the World Cup for which that difference is slightly higher (i.e., ), thus highlighting the different nature of competitions for national teams. Lastly, our role detector found 8 main roles in soccer which we also exploited to investigate the versatility of players, an entropy-based measure which indicates the ability of a player to change role from match to match.
PlayeRank is a valuable tool to support professional soccer scouts in evaluating, searching, ranking and recommending soccer players. We wish to highlight here that, given its modularity, PlayeRank can be extended and customized in several ways. First, more sophisticated algorithms could be designed to detect a player’s role during a match or fraction of a match. These algorithms could then be easily embedded in the PlayeRank’s architecture, giving the user the possibility to customize role detection according to their needs. Some innovative AI-based solutions to role detection, that we plan to embed into PlayeRank, have been recently proposed during a Soccer Data Challenge recently organized by Wyscout and SoBigData (https://sobigdata-soccerchallenge.it/). A similar reasoning applies to the feature weighting module: as soon as more sophisticated techniques will be proposed to weight performance features, they could be embedded in PlayeRank’s architecture.
Another direction to improve PlayeRank is to make it able to work with different data sources. In its current version, PlayeRank is based on soccer-logs only, a standard data format describing all ball touches that occur during a match (Gudmundsson and Horton, 2017; Pappalardo and Cintia, 2017). Unfortunately, out-of-possession movements are not described in soccer-logs, making it difficult to assess important aspects such as pressing (Andrienko et al., 2017) or the ability to create spaces (Bornn and Fernandez, 2018). PlayeRank can be easily extended by making the individual performance extraction module able to extract features from other data sources like video tracking data (Gudmundsson and Horton, 2017) and GPS data (Rossi et al., 2018), which provide a detailed description of the spatio-temporal trajectories generated by players during a match.
Finally, it would be interesting to investigate the flexibility of PlayeRank’s architecture by plugging into it new performance metrics that will be proposed in the literature; as well as to evaluate its applicability to other team sports, such as basketball, hockey or rugby, for which data are available in the same format of soccer-logs (Gudmundsson and Horton, 2017; Stein et al., 2017; Rein and Memmert, 2016).
Acknowledgements.
This work is funded by EU project SoBigData RI, grant #654024. We thank Daniele Fadda for support on data visualization and Alessio Rossi for his invaluable suggestions.Appendix A Performance features
Table 6 shows the list of features used in our experiments. Note that PlayeRank is designed to work with any set of features, thus giving to the user a high flexibility about the description of performance. If other features are available from different data sources, describing for example physiological aspects of performance, they can be added into the framework. Section 5 shows that the proposed set of features is powerful enough to make PlayeRank outperform existing approaches in being more concordant with professional soccer scouts.
| type | feature | type | feature |
|---|---|---|---|
| duel | duel-air duel-accurate | others on the ball | others on the ball-accelleration-accurate |
| duel-air duel-not accurate | others on the ball-accelleration-not accurate | ||
| duel-ground attacking duel-accurate | others on the ball-clearance-accurate | ||
| duel-ground attacking duel-not accurate | others on the ball-clearance-not accurate | ||
| duel-ground defending duel-accurate | others on the ball-touch-assist | ||
| duel-ground defending duel-not accurate | others on the ball-touch-counter attack | ||
| duel-ground loose ball duel-accurate | others on the ball-touch-dangerous ball lost | ||
| duel-ground loose ball duel-not accurate | others on the ball-touch-feint | ||
| foul | foul-hand foul-red card | others on the ball-touch-interception | |
| foul-hand foul-second yellow card | others on the ball-touch-missed ball | ||
| foul-hand foul-yellow card | others on the ball-touch-opportunity | ||
| foul-late card foul-yellow card | pass | pass-cross pass-accurate | |
| foul-normal foul-red card | pass-cross pass-assist | ||
| foul-normal foul-second yellow card | pass-cross pass-key pass | ||
| foul-normal foul-yellow card | pass-cross pass-not accurate | ||
| foul-out of game foul-red card | pass-hand pass-accurate | ||
| foul-out of game foul-second yellow card | pass-hand pass-not accurate | ||
| foul-out of game foul-yellow card | pass-head pass-accurate | ||
| foul-protest foul-red card | pass-head pass-assist | ||
| foul-protest foul-second yellow card | pass-head pass-key pass | ||
| foul-protest foul-yellow card | pass-head pass-not accurate | ||
| foul-simulation foul-second yellow card | pass-high pass-accurate | ||
| foul-simulation foul-yellow card | pass-high pass-assist | ||
| foul-violent foul-red card | pass-high pass-key pass | ||
| foul-violent foul-second yellow card | pass-high pass-not accurate | ||
| foul-violent foul-yellow card | pass-launch pass-accurate | ||
| free kick | free kick-corner free kick-accurate | pass-launch pass-assist | |
| free kick-corner free kick-not accurate | pass-launch pass-key pass | ||
| free kick-cross free kick-accurate | pass-launch pass-not accurate | ||
| free kick-cross free kick-not accurate | pass-simple pass-accurate | ||
| free kick-normal free kick-accurate | pass-simple pass-assist | ||
| free kick-normal free kick-not accurate | pass-simple pass-key pass | ||
| free kick-penalty free kick-not accurate | pass-simple pass-not accurate | ||
| free kick-shot free kick-accurate | pass-smart pass-accurate | ||
| free kick-shot free kick-not accurate | pass-smart pass-assist | ||
| free kick-throw in free kick-accurate | pass-smart pass-key pass | ||
| free kick-throw in free kick-not accurate | pass-smart pass-not accurate | ||
| shot | shot-shot-accurate | ||
| shot-shot-not accurate |
References
- (1)
- wys ([n. d.]) [n. d.]. WyScout spa. https://wyscout.com/.
- Andrienko et al. (2017) Gennady Andrienko, Natalia Andrienko, Guido Budziak, Jason Dykes, Georg Fuchs, Tatiana von Landesberger, and Hendrik Weber. 2017. Visual analysis of pressure in football. Data Mining and Knowledge Discovery 31, 6 (01 Nov 2017), 1793–1839. https://doi.org/10.1007/s10618-017-0513-2
- Baumer and Zimbalist (2014) Benjamin Baumer and Andrew Zimbalist. 2014. The Sabermetric Revolution: Assessing the Growth of Analytics in Baseball. University of Pennsylvania Press.
- Bialkowski et al. (2014) A. Bialkowski, P. Lucey, P. Carr, Y. Yue, S. Sridharan, and I. Matthews. 2014. Large-Scale Analysis of Soccer Matches Using Spatiotemporal Tracking Data. In Procs of the IEEE Intl Conf on Data Mining. 725–730. https://doi.org/10.1109/ICDM.2014.133
- Bornn et al. ([n. d.]) Luke Bornn, Dan Cervone, and Javier Fernandez. [n. d.]. Soccer analytics: Unravelling the complexity of the beautiful game. Significance 15, 3 ([n. d.]), 26–29. https://doi.org/10.1111/j.1740-9713.2018.01146.x arXiv:https://rss.onlinelibrary.wiley.com/doi/pdf/10.1111/j.1740-9713.2018.01146.x
- Bornn and Fernandez (2018) Luke Bornn and Javier Fernandez. 2018. Wide Open Spaces: A statistical technique for measuring space creation in professional soccer. In MIT Sloan Sports Analytics Conference 2018.
- Brooks et al. (2016) Joel Brooks, Matthew Kerr, and John Guttag. 2016. Developing a Data-Driven Player Ranking in Soccer Using Predictive Model Weights. In Procs of the 22nd ACM SIGKDD Intl Conf on Knowledge Discovery and Data Mining. 49–55.
- Cintia et al. (2015a) Paolo Cintia, Fosca Giannotti, Luca Pappalardo, Dino Pedreschi, and Marco Malvaldi. 2015a. The harsh rule of the goals: data-driven performance indicators for football teams. In Procs of the 2015 IEEE Intl Conf on Data Science and Advanced Analytics.
- Cintia et al. (2015b) Paolo Cintia, Salvatore Rinzivillo, and Luca Pappalardo. 2015b. Network-based Measures for Predicting the Outcomes of Football Games. In Proceedings of the 2nd Workshop on Machine Learning and Data Mining for Sports Analytics co-located with 2015 European Conference on Machine Learning and Principles and Practice of Knowledge Discovery in Databases (ECML PKDD 2015), Porto, Portugal, September 11th, 2015. 46–54. http://ceur-ws.org/Vol-1970/paper-07.pdf
- Decroos et al. (2018) Tom Decroos, Jan Van Haaren, and Jesse Davis. 2018. Automatic Discovery of Tactics in Spatio-Temporal Soccer Match Data. In Proceedings of the 24th ACM SIGKDD International Conference on Knowledge Discovery & Data Mining (KDD ’18). ACM, New York, NY, USA, 223–232. https://doi.org/10.1145/3219819.3219832
- Duch et al. (2010) Jordi Duch, Joshua S. Waitzman, and Luís A. Nunes Amaral. 2010. Quantifying the Performance of Individual Players in a Team Activity. PLOS ONE 5, 6 (2010), 1–7. https://doi.org/10.1371/journal.pone.0010937
- Gudmundsson and Horton (2017) Joachim Gudmundsson and Michael Horton. 2017. Spatio-Temporal Analysis of Team Sports. Comput. Surveys 50, 2 (2017), 22:1–22:34. https://doi.org/10.1145/3054132
- Gyarmati and Hefeeda (2016) László Gyarmati and Mohamed Hefeeda. 2016. Analyzing In-Game Movements of Soccer Players at Scale. In MIT SLOAN Sports Analytics Conference.
- Gyarmati et al. (2014) László Gyarmati, Haewoon Kwak, and Pablo Rodriguez. 2014. Searching for a Unique Style in Soccer. CoRR abs/1409.0308 (2014).
- Hartigan and Wong (1979) J. A. Hartigan and M. A. Wong. 1979. A k-means clustering algorithm. JSTOR: Applied Statistics 28, 1 (1979), 100–108.
- Herbrich et al. (2006) Ralf Herbrich, Tom Minka, and Thore Graepel. 2006. TrueSkill™: A Bayesian Skill Rating System. In Procs of the 19th Intl Conf on Neural Information Processing Systems. 569–576.
- Lasek et al. (2013) Jan Lasek, Zoltán Szlávik, and Sandjai Bhulai. 2013. The predictive power of ranking systems in association football. Journal of Applied Pattern Recognition 1, 1 (2013). https://doi.org/10.1504/IJAPR.2013.052339
- López Peña and Touchette (2012) J. López Peña and H. Touchette. 2012. A network theory analysis of football strategies. ArXiv e-prints (June 2012). arXiv:math.CO/1206.6904
- Lucey et al. (2014) Patrick Lucey, Alina Bialkowski, Mathew Monfort, Peter Carr, and Iain Matthews. 2014. quality vs quantity: Improved shot prediction in soccer using strategic features from spatiotemporal data. In Proc. 8th Annual MIT Sloan Sports Analytics Conf. 1–9.
- Lucey et al. (2013) Patrick Lucey, Dean Oliver, Peter Carr, Joe Roth, and Iain Matthews. 2013. Assessing Team Strategy Using Spatiotemporal Data. In Proceedings of the 19th ACM SIGKDD Intl Conf on Knowledge Discovery and Data Mining. 1366–1374. https://doi.org/10.1145/2487575.2488191
- Manning et al. (2008) Christofer D. Manning, Prabhakar Raghavan, and Hinrich Schütze. 2008. Introduction to Information Retrieval. Cambridge University Press.
- Müller et al. (2017) Oliver Müller, Alexander Simons, and Markus Weinmann. 2017. Beyond crowd judgments: Data-driven estimation of market value in association football. European Journal of Operational Research 263, 2 (2017), 611–624. https://doi.org/10.1016/j.ejor.2017.05.005
- Nsolo et al. (2018) Edward Nsolo, Patrick Lambrix, and Niklas Carlsson. 2018. Player valuation in European football. In Machine Learning and Data Mining for Sports Analytics workshop (MLSA 2018).
- Pappalardo and Cintia (2017) Luca Pappalardo and Paolo Cintia. 2017. Quantifying the relation between performance and success in soccer. Advances in Complex Systems 20, 4 (2017). https://doi.org/10.1142/S021952591750014X
- Pappalardo et al. (2017) Luca Pappalardo, Paolo Cintia, Dino Pedreschi, Fosca Giannotti, and Albert-Laszlo Barabasi. 2017. Human Perception of Performance. arXiv preprint arXiv:1712.02224 (2017).
- Pettigrew (2015) S. Pettigrew. 2015. Assessing the offensive productivity of NHL players using in-game win probabilities. In MIT Sloan Sports Analytics Conference.
- Power et al. (2017) Paul Power, Héctor Ruiz, Xinyu Wei, and Patrick Lucey. 2017. Not All Passes Are Created Equal: Objectively Measuring the Risk and Reward of Passes in Soccer from Tracking Data. In Procs of the 23rd ACM SIGKDD Intl Conf on Knowledge Discovery and Data Mining. 1605–1613. https://doi.org/10.1145/3097983.3098051
- Rein and Memmert (2016) Robert Rein and Daniel Memmert. 2016. Big data and tactical analysis in elite soccer: future challenges and opportunities for sports science. SpringerPlus 5, 1 (2016), 1410. https://doi.org/10.1186/s40064-016-3108-2
- Ribeiro-Neto and Baeza-Yates (1999) Berthier Ribeiro-Neto and Ricardo Baeza-Yates. 1999. Modern Information Retrieval. Addison-Wesley Longman Publishing Co., Inc. Boston, MA, USA.
- Rossi et al. (2018) Alessio Rossi, Luca Pappalardo, Paolo Cintia, F. Marcello Iaia, Javier Fernà ndez, and Daniel Medina. 2018. Effective injury forecasting in soccer with GPS training data and machine learning. PLOS ONE 13, 7 (07 2018), 1–15. https://doi.org/10.1371/journal.pone.0201264
- Shulte and Zhao (2017) Oliver Shulte and Zeyu Zhao. 2017. Apples-to-Apples: Clustering and Ranking NHL Players Using Location Information and Scoring Impact. In MIT Sloan Sports Analytics Conference. Hynes Convention Center, Boston, MA, USA.
- Stanojevic and Gyarmati (2016) R. Stanojevic and L. Gyarmati. 2016. Towards Data-Driven Football Player Assessment. In Procs of the IEEE 16th Intl Conf on Data Mining. 167–172.
- Stein et al. (2017) Manuel Stein, Halldór Janetzko, Daniel Seebacher, Alexander Jäger, Manuel Nagel, Jürgen Hölsch, Sven Kosub, Tobias Schreck, Daniel A. Keim, and Michael Grossniklaus. 2017. How to Make Sense of Team Sport Data: From Acquisition to Data Modeling and Research Aspects. Data 2, 1 (2017). https://doi.org/10.3390/data2010002
- Torgler and Schmidt (2007) Benno Torgler and Sascha L. Schmidt. 2007. What shapes player performance in soccer? Empirical findings from a panel analysis. Applied Economics 39, 18 (2007), 2355–2369. https://doi.org/10.1080/00036840600660739
- Wang et al. (2015) Qing Wang, Hengshu Zhu, Wei Hu, Zhiyong Shen, and Yuan Yao. 2015. Discerning Tactical Patterns for Professional Soccer Teams: An Enhanced Topic Model with Applications. In Procs of the 21th ACM SIGKDD Intl Conf on Knowledge Discovery and Data Mining. 2197–2206. https://doi.org/10.1145/2783258.2788577